

ABSTRACT
An unhealthy diet is among the leading global causes of death and disability. Globally, a range of policies are being implemented to support healthy food choices at a population level, including novel polices in the areas of food marketing, nutrition labeling, and taxation of less healthy foods. There is a need to evaluate and inform the implementation of these policies, including their impacts on marginalized population subgroups. The International Food Policy Study (IFPS) consists of repeated cross-sectional surveys conducted in 5 high- and upper-middle-income countries: Australia, Canada, Mexico, the United Kingdom, and the United States. In each country, approximately 4000 adults and 1200 children and youth (aged 10–17) were recruited from a global commercial panel to complete an online survey using consistent measures and methodologies across countries. The first annual IFPS surveys were conducted in 2017 with adults; annual surveys for young people aged 10–17 were launched in 2019 in the same countries, as well as in Chile. The design of the IFPS surveys creates a framework for evaluating “natural experiments” in food policies, including comparisons over time within countries implementing the policy and comparisons with countries in which the policy was not implemented. IFPS surveys have 3 primary areas of focus: 1) knowledge, attitudes, and beliefs associated with specific policies; 2) diet-related behaviors; and 3) dietary intake, including 24-hour dietary recalls for adults in 4 of the 5 countries. Surveys also assess food insecurity, income adequacy, sex and gender, race/ethnicity, and a range of other measures to assess trends among priority subgroups. Overall, the IFPS project has the potential to address important gaps in national monitoring surveys for dietary patterns, and to evaluate the impacts of novel food policies implemented in any of the 5 countries over the study period.
Keywords: food policy, nutrition policy; policy evaluation; quasi-experimental study; dietary intake; between-country comparisons
Introduction
An unhealthy diet is a primary risk factor for noncommunicable diseases (NCDs), including cardiovascular diseases, type 2 diabetes, and several cancers, and plays a major role in the development of obesity (1, 2). The importance of dietary intake to global NCDs is reflected in major initiatives promoting healthy food policies, including the Global Action Plan for the Prevention and Control of NCDs 2013–2020 (3) and the WHO's Ending Childhood Obesity Report (4).
Dietary intake is strongly influenced by food environments. Food environments comprise the social, economic, and policy factors that determine food availability, access, and quality, including the food supply, nutrition information, food marketing, cost of food, retail environments, and other environmental influences on dietary intake (5–7). Countries are implementing an increasing number of policies to improve food environments and support healthy eating, including in the areas of food labeling; restrictions on marketing to children; fiscal policies, such as taxes on sugar-sweetened beverages; and enhanced dietary guidelines (5, 8–12).
The need to evaluate these precedent-setting policies has been highlighted by the WHO and others (13). However, national-level policies present several methodological challenges for evaluation. First, population-level dietary patterns evolve over time in response to industry changes and consumer trends, making it difficult to detect the impacts of policies against this backdrop of “secular” change. Second, the impacts of many policies, such as marketing restrictions, are not immediate, but build over time, necessitating a longer time period for evaluation. Third, national-level policies are frequently implemented with little advance notice, leaving insufficient time to establish evaluation studies and collect baseline measures. Fourth, it is not possible to conduct randomized trials of national-level nutrition policies: countries cannot be randomized to different policies, as would be required to establish control groups. Preimplementation experimental studies—in which research participants are assigned to hypothetical policy condition—can provide data on the potential efficacy of policies. However, these experimental designs have limited ecological validity: they do not account for either the educational efforts that often accompany policy implementation (14–16) or industry actions, which can both enhance policy impact, through actions such as product reformulation (11, 17), and undermine policy impact, including through low uptake of voluntary policies [e.g., the relatively low implementation of voluntary front-of-package (FOP) food labeling in Australia] (18).
“Natural experiment” research designs are ideally suited to evaluating complex interventions, such as national-level policies (19, 20). Natural experiments consist of comparisons between groups in the absence of randomization (21). In the case of national-level policies, countries serve as the comparison groups and differences in dietary trends between countries with and without nutrition policies are the analytical focus. Dietary trends can be assessed using several data sources, including sales data and various market-based indicators; however, population-level surveys are the most common methodology for assessing national-level changes in dietary behavior, particularly when surveys are incorporated into national dietary surveillance frameworks. The frequency with which population-level dietary surveys are conducted is an important factor in their ability to evaluate nutrition policies in a natural-experiment design (22, 23). Population-level surveys that are conducted at frequent intervals—such as in annual waves—can account for potentially different secular trends between countries and can help disentangle policy effects from the “background noise” of these secular changes. Population-level surveys are also enhanced when they include key mediators and moderators of dietary intake, such as nutrition knowledge, food security, and social norms, which are often the primary target of national-level policies. These measures are critical not only for measuring policy impacts, but also as part of routine surveillance to identify policy gaps and needs. Finally, unlike many studies of sales data or market-based data, population surveys typically collect dietary intake data that are linked with detailed measures of socioeconomic status to assess changes among priority at-risk groups (24, 25).
To date, few countries have implemented comprehensive nutrition surveillance frameworks capable of assessing the impacts of novel nutrition policies (26). In many cases, national dietary surveys are conducted on an ad hoc or infrequent basis, and few surveys provide sufficient detail on both dietary intake and key mediators and moderators to understand how and why dietary trends may be changing (27). Furthermore, population surveys across countries are often not comparable due to methodological differences in survey measures, samples, and data collection periods. These limitations are a considerable barrier to the type of between-country comparisons that are required to conduct robust natural experiments of nutrition policies.
The purpose of the current paper is to describe the conceptual approach and methods of an international study that seeks to provide comparative dietary data across countries using population-level surveys. The International Food Policy Study (IFPS) consists of repeated cross-sectional surveys conducted annually in 5 high- and upper-middle-income countries: Australia, Canada, Mexico, the United Kingdom, and the United States. The project provides comparisons within and between countries over time to assess changes in dietary patterns, including natural experiments for policy measures implemented in IFPS countries over the period of study.
Conceptual framework
The theoretical framework of the IFPS is based on the model of dietary behavior developed by Glanz and colleagues (28), which highlights the range of interrelated factors that affect food choices (see Figure 1). While much research to date has focused on individual-level factors, food choices are heavily influenced by broader environmental factors, including the commercial food system, government policies, and population-level nutrition interventions that shape the food environment and the food supply (29). Individual-level variables—including socioeconomic status (SES), food security, and health and nutrition literacy—can mediate or moderate the effects of the food environment on behavior and diet quality. SES and other individual-level variables are particularly important to understanding the impacts of health policies on health equity and current health disparities, as well as the unintended consequences of population-level policies on population subgroups, which are often overlooked in evaluation research.
FIGURE 1.

Conceptual model of the International Food Policy Study.
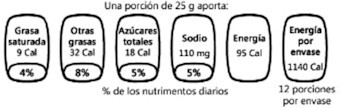
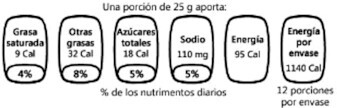
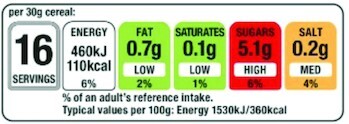
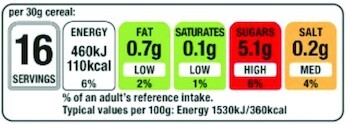
The conceptual approach of the IFPS project is also based on the principle of natural experiment designs and comparisons across countries, as described above (21, 30). The selection of IFPS countries—Australia, Canada, Mexico, the United Kingdom, and the United States—was based on broad similarities in the food environments, languages, and cultures. In the case of Mexico, geographic proximity and sociocultural similarities to key US subpopulations was also a consideration. IFPS countries also differ in the national-level nutrition policies that have been implemented, which forms the basis for the natural experimental framework. For example, Table 1 illustrates differences between countries in FOP nutrition labeling policies. In 2018, the first year in which IFPS surveys were conducted, Canada and the United States had not implemented FOP labeling systems. The United Kingdom and Australia had implemented voluntary policies, but for different types of FOP labels (the traffic light and Health Stars FOP labeling systems, respectively). In contrast, Mexico had implemented mandatory FOP labels based on the Guideline Daily Amounts (GDA) system. Thus, countries differed both in the existence of any FOP labeling policy and the type of FOP policy that had been implemented. In addition, FOP policies have changed over the course of the IFPS study: in 2020, Mexico revised its mandatory policy to replace the GDA FOP system with “High In” FOP warnings on foods, similar the FOP system previously mandated in Chile (31). An additional policy change appears imminent, as Canada has released regulatory proposals to implement a similar High In FOP system (32, 33). The repeated cross-sectional design of the IFPS, in which surveys are conducted annually in each of the 5 countries, is critically important to capturing these policy changes and establishing the natural experiment design: countries with different policies can be compared over time, including “pre-post” differences in countries with and without the policy intervention. The same conceptual approach can be applied to other policy domains on which countries differ, including food marketing restrictions, nutrition labeling requirements in restaurants, retail policies, and national dietary guidelines, among others (34, 35).
TABLE 1.
International Food Policy Study quasi-experimental study design for FOP labeling1
| FOP labeling policy | 2018 | 2019 | 2020 | 2021 | 2022 |
|---|---|---|---|---|---|
| Mexico: Guideline Daily Amount and “High In” FOP labels2 |
|
|

|

|

|
| Australia: Health Star FOP labels3 |

|

|

|

|

|
| United Kingdom: traffic light FOP labels3 |
|
|

|

|

|
| Canada: no FOP label (control) | — | — | — | — | — |
| United States: no FOP label (control) | — | — | — | — | — |
FOP, front-of-package.
Mandatory FOP labels.
Voluntary policy.
The IFPS also draws on conceptual frameworks from tobacco control research, which aim to evaluate population-level policies in tobacco control by measuring upstream, proximal, policy-specific measures to understand the impacts on downstream, distal behavior changes and health outcomes (36, 37). IFPS surveys include measures of proximal and policy-specific variables (e.g., food label comprehension, exposure to food marketing, awareness of sugar taxes) that are conceptually close to the policies that are being evaluated, and are thus less likely to be affected by other confounding factors, compared to more downstream outcomes (see Figure 1). The use of proximal measures, such as self-reported exposure to marketing and awareness of product warnings/labels, are well established in domains such as tobacco control (37–39). For example, self-reported exposure to marketing is associated with objective data on advertising expenditures and audience viewership numbers, as well as behavioral outcomes (40–43). IFPS surveys incorporate policy-specific variables from multiple food environment policy domains (see Figure 1), which have the potential for synergistic and/or antagonistic effects.
Methods
IFPS data are collected in November/December annually. The first survey wave was conducted in 2018 following an extensive pilot study in the 5 IFPS countries in 2017 (44). All data collection for the IFPS occurs online. The use of online surveys is expanding, given their convenience and reach, and online surveys are now the most common form of data collection (45–50). Recent findings from major research centers suggest that response rates for telephone surveys in the United States are around 9% (51). Internet penetration now exceeds that for landline subscriptions, and is approximately 90% or more in Australia, Canada, the United Kingdom, and the United States (52–55) and 77% in urban areas of Mexico (56). In addition, internet usage is known to be similarly high among those with lower levels of education in IFPS countries (52, 57, 58), including Mexico (59), albeit somewhat lower among those with lower income levels (60). Online surveys also provide several administrative advantages, including the ability to use automated skip logic and questionnaire routing to address complicated patterns of dietary behaviors (61, 62) and the ability to include images that can both improve self-reporting and simplify the provision of complex, experimental designs related to viewing food products and food marketing (63). Research suggests that social desirability bias may be lower in online compared with interviewer-administered surveys for sensitive topics such as food security (64), with little or no difference in dietary intake reporting when data collection is conducted online or in person (65–67). IFPS surveys have been adapted to optimize the survey layout on smaller screens, including greater vertical (compared with horizontal) scrolling, to ensure the legibility of wording and any images. The screen size is also recorded to empirically assess any impact of device type on survey responses.
IFPS sampling strategy
Individuals were eligible to participate if they were 18 to 100 years of age and resided in the relevant IFPS country. Email invitations with unique survey access links were sent to a sample of panelists within each country; panelists known to be ineligible were not invited. The IFPS surveys employ sampling quotas for age, sex, and education that were established based on the population distributions in each country, according to national census data. Additional quotas were also used for language in Canada (proportional to the overall English/French population distribution) and in the United States (based on the overall English and Spanish population distribution).
The sample was recruited from the Nielsen Consumer Insights Global Panel, which maintains and/or has partner panels in each country. The panels were recruited using both probability and nonprobability sampling methods. Typically, panelists are recruited online using nonprobability-based methods, and panelists join by signing up and providing personal and demographic information that can be used for survey selection by the survey panel company (50). Panelists received remuneration for participation in line with each panel's usual incentive structure, which includes points-based or monetary rewards (redeemed for catalog items, redeemed as cash, or donated) and/or chances to win monthly prizes. Such incentives have been shown to increase response rates and decrease response bias in subgroups underrepresented in surveys, including disadvantaged subgroups (68, 69).
Data integrity practices
The IFPS study incorporates best practices for online surveys to enhance data quality, including exclusions for “speeders” (those completing the survey in less than one-third the median completion time), incorrect responses to trap questions, and response patterns indicative of a lack of respondent engagement (50, 70). Overall, between 1% and 4% of respondents were excluded from the final sample at each wave based on data integrity checks.
Survey content
IFPS surveys were conducted in English (Australia, Canada, the United Kingdom, and the United States), French (Canada), and Spanish (the United States and Mexico). Surveys also incorporated country-specific phrasing as required (e.g., soda compared with soft drinks, fries compared with chips, etc.). Survey measures for the IFPS were drawn or adapted from national surveys and previous research. Full copies of all IFPS surveys are publicly available (71). The conceptual map in Figure 1 identifies the key outcomes, moderators, and mediators assessed in the IFPS survey. The selection of measures was informed by consultations with knowledge users and stakeholders. IFPS measures include several core health indicators from the Global Monitoring Framework on NCDs (72) and incorporate key monitoring indicators for nutrition labeling identified by the WHO (73). The survey includes 8 primary modules, summarized below.
Sociodemographic measures and food security
Whenever possible, sociodemographic measures were used or adapted from government-led national surveys in each country, to ensure comparability to national, census-based surveys and across countries. The survey assesses age, sex at birth, gender identity (74), ethnicity (75–79), and household and family composition. Socioeconomic measures include education (75, 76, 78–80), perceived income adequacy (81), subjective social status (82), and zip/postal code data to calculate the area-level deprivation index as an objective proxy measure of socioeconomic status (83, 84). Household food security is assessed using the US Household Food Security Survey Module (85).
Health literacy and nutrition knowledge
Health literacy is examined using a self-administered adaptation of the Newest Vital Sign, which assesses comprehension of the information displayed in Nutrition Facts tables (tailored to the Nutrition Facts tables displayed in each country) (86, 87). In addition, IFPS surveys include the FoodProK score, which assesses respondents’ ability to identify healthiness as a function of the overall level of food processing (88). A total of 12–15 food products are rated—3 products in each of 4 food groups (fruit and vegetables, grains, dairy, and meat)—with an additional category added for fish products in 2020 (89, 90). Participants are separately asked to self-report their perceived level of nutrition knowledge (91).
Policy-specific variables
Policy-specific measures are included for 6 major policy domains (food labeling, food marketing, food price/taxation, food retail environments, public education campaigns, and dietary guidelines). For food labeling, respondents in each country view images of the relevant Nutrition Facts and FOP labels implemented in their country and are asked a series of survey measures regarding noticing, use of, ease of understanding, and perceived influence of food labels while the images are displayed on the screen (92–94). The incorporation of labeling images in the survey measures is important to ensure respondents do not confuse the labels of interest with voluntary claims and other labeling images frequently used by food manufacturers. Measures also incorporate noticing and use of nutrition information on menus (e.g., menu labeling) in restaurant settings. For food marketing, measures examine self-reported exposure to marketing via different channels (e.g., TV, digital, packaging), as well as marketing content (e.g., traditional ads, sponsorships, product tie-ins), with a focus on marketing of sugary drinks and fast food. Additional measures examine marketing exposure and outcomes among parents with children (95, 96). For food price/taxation, the measures examine purchasing patterns, awareness of sugar taxes, and social norms and attitudes regarding sugary products. For food retail environments, the measures query supermarket policies and retail environments within and surrounding homes, school, and work. For public education campaigns and dietary guidelines, open-ended questions probe awareness of and recall of key messages within campaigns or guidelines (97).
Policy support
Measures assess policy support for proposed population-level policies and prominent international policy options being implemented by governments to examine how support changes over time across countries and relative to other policy initiatives (98). The measures ask about policies across a variety of areas that include various levels of government intervention (e.g., incentives and level of restriction) (99, 100).
Diet-related behaviors
Three frequency-based measures assess aspects of dietary intake. A Food Source Dietary Recall was adapted and validated to establish the proportion of meals that are purchased outside of the home and to understand the types of food outlets those meals were purchased at, as well as the manner of purchasing (take out, dine in, online ordering via a food app) (101–103). The Beverage Frequency Questionnaire (BFQ) assesses the prior 7-day beverage intake, focusing on sugary drinks (104). The BFQ captures drinks consumed infrequently or episodically, such as energy drinks and alcoholic beverages that may not be captured in 24-hour recalls, and has been shown to be highly correlated with 7-day food records among young adults in Canada (104). Compared to the 24-hour dietary recalls (described below), the 7-day period of the BFQ provides a better assessment of individual-level sugary drink intake, particularly for beverages that are consumed less frequently. An adaptation of the Behavioral Risk Factor Surveillance System fruit and vegetable screener was included to assess fruit and vegetable intakes (105). The survey also assessed efforts to modify intakes of specific food categories and nutrients (e.g., sugars or sodium) (106, 107) and efforts and modes for weight loss (108).
Dietary outcomes (24-hour dietary recalls)
Beginning in 2020, IFPS respondents in all countries except Mexico were asked to complete an online 24-hour dietary recall following completion of the main IFPS survey. The 24-hour dietary recalls provide the opportunity to examine population-level intakes for specific nutrients (e.g., sugar), as well as commonly used indices of diet quality, such as the Healthy Eating Index (109). The Automated Self-Administered 24-Hour Dietary Assessment Tool (ASA24) was used in the United States, Canada, and Australia. The ASA24 was developed by the US National Cancer Institute to make it feasible to collect recalls in large studies (110). The ASA24 is modeled on the automated multiple-pass method, developed by the USDA to enhance the accuracy of interviewer-administered recalls (111, 112), and is used in NHANES and the Canadian Community Health Survey (CCHS) (113). In the United States, the ASA24 is available in Spanish and includes foods consumed by Mexican people living in the United States, as well as Mexican-Americans. Respondents reported foods and drinks consumed the prior day (by browsing or searching user-friendly terms), entered details of food preparation and portion size, and were prompted to think about frequently forgotten items. The intake frame for the ASA24 was from midnight to midnight of the previous day, and respondents were required to complete reporting in a single session. ASA24 modules for location, “ate with,” and supplements were turned on. UK respondents completed a similar online dietary recall using the Intake24 system (114). An equivalent online 24-hour dietary recall is not available in Mexico.
Distal health measures and weight-related measures
Self-reported height (without shoes) and weight (without clothes or shoes) were used to calculate BMI (115), using appropriate measurement units in each country (e.g., pounds, kilograms, or stones in the United Kingdom and Australia; pounds or kilograms in all other countries). The survey incorporates brief measures of weight perceptions, weight-related stigma, and disordered eating (116, 117). Self-reported measures of general health, stress, and mental health are incorporated (118).
Analysis
Poststratification sample weights were constructed for each country separately based on known population totals by age, sex at birth, region, ethnicity (except in Canada), and education (except in Mexico). Respondents were classified into sex-by-age-by-region groups, ethnicity-by-region groups (except in Canada) and education groups (except in Mexico). Corresponding census data from each country were obtained. Separately by country, a raking algorithm was applied to compute weights that are calibrated to these groupings. Raking is an iterative technique to align weighted sample proportions with known population proportions (119). A SAS macro (SAS Institute) (120) was used with trimming to control extreme weights and large CVs (121), if necessary. Trimming, if necessary, was applied for weights greater than 5 times the mean weight or less than 0.2 times the mean weight. Respondents missing a value for any of the weighting variables were assigned the mean weight for their other variables. Small sample sizes (cells generally of less than 15 respondents) lead to collapsing of some weighting variable categories. Finally, the weights were rescaled to equal the sample size in each country. Additional information on the age, sex-at-birth, region, ethnicity, and education categories used for weighting and the range of survey weights in each country are available in Supplemental Table 1.
Typically, analyses are conducted using survey-adjusted logistic and linear regressions, including indicator variables for country and year where applicable, and multiplicative interaction terms to examine differences between countries over time. The IFPS data also support interrupted time series analyses to assess policies for which trends are expected to be linear and interventions are introduced at 1 time point, given the multiple waves of data collection prior to policy implementation in many circumstances (122, 123).
Results
Survey response rates
For commercial panels that include nonprobability-based samples, the American Association for Public Opinion Research (AAPOR) recommends reporting the participation rate, also referred to as the completion rate. The participation rate is defined as “the number of respondents who have provided a usable response divided by the total number of initial personal invitations requesting participation” (124). Participation rates are largely a product of sample management and the amount of sample that is “released” prior to reaching target quotas. The total participation rates were 6.5%, 4.0%, and 3.9% in 2018, 2019, and 2020, respectively. Because the IFPS surveys are conducted over predetermined, limited time periods, email invitations are sent to a greater number of respondents than are required to achieve the survey quotas before the survey end date. Accordingly, the number of nonresponders is higher than would otherwise be the case if the survey did not have quotas or the sample was released more slowly to allow for additional reminder invitations. Given this, the cooperation rate can provide a more informative indication of potential self-selection bias. The cooperation rate represents “the proportion of all cases interviewed of all eligible units ever contacted.” Based on AAPOR Cooperation Rate #2, the cooperation rates across all countries were 69.2% in 2018, 60.1% in 2019, and 62.1% in 2020. Additional information on sample dispositions is available in the online technical reports (125–127).
Disposition rates are also calculated for completion of the 24-hour dietary recalls among the IFPS samples. Prior to 2020, 24-hour dietary recalls were only conducted in Canada. In Canada, totals of 3303 respondents (75.1%) in 2018, 2606 respondents (63.5%) in 2019, and 3028 respondents (70.3%) in 2020 completed the 24-hour dietary recall and had usable data. In 2020, 72.1% of Australian respondents, 71.2% of UK respondents, and 61.3% of US respondents completed the 24-hour dietary recall.
Sample profile
Table 2 shows the unweighted and weighted sociodemographic characteristics for the 2020 sample in each of the 5 countries [tables for the 2018 and 2019 samples are publicly available (125, 126)]. Overall, the unweighted IFPS sample had a higher education level than the general population in all countries, and particularly in Mexico (see Supplemental Figures 1 and 2 for comparisons of national and weighted IFPS estimates for the percentages of participants that were of the majority ethnicity or had low education). The proportions of the weighted sample that identified as the ethnic majority in each country were similar to or slightly higher than national estimates, but were very similar (within 3%) when weighted, with the exception of the United States, which had a higher proportion of White-only participants than the general population. The application of survey weights made the proportion of the sample with low education similar to national estimates in all countries except Mexico, for which the small number of participants with low education made weighting by this variable unfeasible.
TABLE 2.
International Food Policy Study 2020 unweighted and weighted sample characteristics by country (N = 21,753)
| Australia, n = 4289 | Canada, n = 4309 | Mexico, n = 4284 | United Kingdom, n = 4249 | United States, n = 4622 | ||||||
|---|---|---|---|---|---|---|---|---|---|---|
| Unweighted | Weighted | Unweighted | Weighted | Unweighted | Weighted | Unweighted | Weighted | Unweighted | Weighted | |
| % (n) | % (n) | % (n) | % (n) | % (n) | % (n) | % (n) | % (n) | % (n) | % (n) | |
| Sex at birth | ||||||||||
| Male | 49.6% (2126) | 49.1% (2104) | 49.1% (2117) | 49.4% (2127) | 50.6% (2166) | 48.0% (2055) | 49.8% (2114) | 48.9% (2076) | 47.7% (2206) | 48.7% (2252) |
| Female | 50.4% (2163) | 50.9% (2,185) | 50.9% (2192) | 50.6% (2182) | 49.4% (2118) | 52.0% (2229) | 50.2% (2135) | 51.1% (2173) | 52.3% (2416) | 51.3% (2370) |
| Age, years, mean (SD) | 48.3 (17.31) | 46.6 (17.07) | 48.2 (17.17) | 47.9 (17.44) | 38.1 (13.00) | 40.5 (14.50) | 48.6 (17.66) | 48.2 (17.31) | 46.8 (16.86) | 46.7 (17.25) |
| Education1 | ||||||||||
| Low | 43.6% (1870) | 41.9% (1798) | 28.0% (1207) | 42.3% (1821) | 22.7% (972) | 23.2% (993) | 40.3% (1711) | 51.7% (2195) | 37.0% (1710) | 54.8% (2531) |
| Medium | 30.9% (1326) | 32.0% (1374) | 40.9% (1764) | 33.1% (1425) | 13.6% (582) | 13.8% (593) | 29.2% (1,240) | 19.4% (825) | 20.6% (951) | 10.1% (465) |
| High | 25.0% (1071) | 25.5% (1094) | 30.5% (1314) | 24.1% (1040) | 63.6% (2723) | 62.8% (2691) | 29.8% (1265) | 28.1% (1195) | 41.8% (1933) | 34.7% (1602) |
| Not stated | 0.5% (22) | 0.5% (23) | 0.6% (24) | 0.6% (24) | 0.2% (7) | 0.2% (8) | 0.8% (33) | 0.8% (33) | 0.6% (28) | 0.5% (23) |
| Ethnicity2 | ||||||||||
| Majority | 83.1% (3563) | 73.3% (3144) | 78.0% (3362) | 77.3% (3330) | 81.2% (3479) | 78.9% (3379) | 89.3% (3796) | 88.3% (3750) | 62.7% (2899) | 62.9% (2909) |
| Minority | 16.6% (710) | 26.3% (1,129) | 20.6% (888) | 21.4% (921) | 16.3% (700) | 18.7% (803) | 10.0% (427) | 11.2% (475) | 36.7% (1,696) | 36.5% (1,686) |
| Not stated | 0.4% (16) | 0.4% (16) | 1.4% (59) | 1.3% (58) | 2.5% (105) | 2.4% (102) | 0.6% (26) | 0.6% (24) | 0.6% (27) | 0.6% (27) |
| BMI3 | ||||||||||
| Underweight | 3.3% (140) | 3.5% (151) | 2.9% (123) | 3.0% (128) | 1.7% (72) | 1.4% (60) | 2.8% (121) | 2.8% (119) | 2.2% (102) | 2.1% (99) |
| Normal weight | 30.8% (1321) | 32.3% (1384) | 34.4% (1483) | 34.3% (1477) | 37.3% (1600) | 35.9% (1539) | 35.1% (1493) | 34.7% (1476) | 32.8% (1517) | 32.4% (1499) |
| Overweight | 27.4% (1176) | 26.9% (1152) | 27.4% (1181) | 26.2% (1128) | 30.3% (1298) | 30.8% (1319) | 26.9% (1144) | 26.0% (1107) | 28.9% (1335) | 27.7% (1281) |
| Obesity | 23.2% (997) | 21.9% (939) | 21.2% (913) | 21.7% (935) | 14.2% (607) | 15.0% (644) | 16.8% (715) | 17.4% (738) | 23.5% (1088) | 24.5% (1131) |
| Missing | 15.3% (655) | 15.5% (663) | 14.1% (609) | 14.9% (641) | 16.5% (707) | 16.9% (723) | 18.3% (776) | 19.0% (809) | 12.5% (580) | 13.3% (613) |
The education level was categorized as low (i.e., completed secondary school or less), medium (i.e., some postsecondary qualifications), or high (i.e., university degree or higher) according to country-specific criteria related to the highest level of formal education attained.
Ethnic categories in each country, as per the census questions asked in each country: 1) in Australia, majority indicates the participant only speaks English at home and minority indicates they speak a language besides English at home; 2) in Canada, the United Kingdom, and the United States, majority indicates the participant is White and minority indicates they are of other ethnicity; and 3) in Mexico, majority indicates the participant is nonindigenous and minority indicates they are indigenous.
The BMI classifications are underweight (<18.5 kg/m2), normal weight (18.5 to 24.9 kg/m2), overweight (25.0 to 29.9 kg/m2), and obese (≥30 kg/m2)
Figure 2 compares self-reported IFPS estimates of the percentage of the sample that have a BMI ≥ 25.0 kg/m2 (indicating overweight or obesity) to national estimates of directly measured BMI among approximately the same age group using a similar data source across countries [Organization for Economic Cooperation and Development (OECD)] (128), indicating that self-reported IFPS estimates are systematically lower than directly measured estimates. When compared to the self-reported BMI (as opposed to the directly measured BMI) from nationally representative surveys (when available), IFPS estimates were more closely aligned (see Supplemental Figure 1). For example, the prevalence of overweight and obesity was 63.1% in the self-reported 2018 CCHS (129), compared with 59.0% in the 2018 IFPS Canadian sample, 59.9% in the 2019 IFPS sample, and 56.2% in the 2020 IFPS sample (excluding missing data to allow for comparable estimates) (129). Similarly, in the United States, the prevalence of overweight and obesity was 66.2% according to 2018 OECD self-reported obesity estimates of those aged 15 years or more, compared with 61.6% in those aged 18 years or more in the 2018 IFPS US sample and 60.6% in the 2019 IFPS US sample (128).
FIGURE 2.

Comparison of self-reported BMI estimates from the IFPS weighted sample of the percentage of the population that has overweight and obesity in 2018 and 2019 compared to most recent ‘directly’ measured rates according to the OECD* in each country. *2016 in USA, 2017 in Australia and 2018 in Canada, Mexico and the UK (139). IFPS, International Food Policy Study; OECD, Organization for Economic Cooperation and Development.
IFPS youth surveys
Although the IFPS surveys were originally limited to respondents 18 years and older, many policy measures are targeted at improving diets among children and youth. Beginning in 2019, IFPS surveys were expanded to include respondents aged 10–17 in each of the 5 countries, as well as in Chile, which has implemented a range of novel policy measures (130, 131). The methodology is similar to the adult IFPS surveys, with sample recruitment through parents/guardians in the Nielsen Consumer Insights Global Panel in each country. Annual surveys are conducted with approximately 1500 respondents in each country, with an oversample of approximately 3500 respondents in Canada due to greater funding availability. The wording and content of the IFPS child and youth surveys have been adapted to be age appropriate, and to have a greater focus on the school nutrition setting and food marketing. In 2019, the cooperation rate across all countries was 76.8%, calculated as the percentage of respondents who completed the survey (11,108) of those eligible who accessed the survey link (14,457) (124). As is the case for adults, the youth surveys are conducted in English, French, and Spanish, and the median survey time in 2019 was 24 minutes across countries. Note that 24-hour dietary recalls are not conducted among the youth sample. Additional details on the IFPS child and youth surveys and the sample profile are available (71).
Discussion
A new era in nutrition policy is emerging, in which an increasing number of countries are implementing policy measures to address the public health burden from deteriorating diet quality. There is an immediate need for evidence to inform and evaluate these policy decisions. The use of natural experiments—with comparisons within and across countries over time—provides a robust framework for examining the impacts of national-level policies. The consistent methodology and annual surveys of the IFPS study provide an infrastructure that can provide pre- and postmeasures for policies implemented in the participating countries, as well as direct comparisons with countries in which policies have not been implemented. Even in the absence of policy changes, the IFPS study can make contributions to dietary surveillance at the country level (132). In Canada, for example, nationally representative assessments of dietary intake are conducted sporadically, with the 2 most recent data collections occurring in 2004 and 2015. Similarly, household food security data are collected on an infrequent basis in Mexico and Australia, and regular data collection has only recently been announced in the United Kingdom (133, 134). The lack of routine dietary surveillance was laid bare by the coronavirus disease 2019 pandemic: few countries had the necessary survey measures in place to understand how the pandemic affected levels of food insecurity and dietary behaviors. In the absence of gold-standard, probability-based surveys conducted by national authorities, IFPS data can serve as benchmarks to track changes over time in national samples with similar sociodemographic profiles to the broader population.
Limitations and data collection challenges
Response rates in population-based surveys are declining (68). Traditional random-digit-dialed phone surveys suffer from response rates below 10% (or <5% for sampling frames that include unlisted cell phone numbers) and are likely no longer suitable for surveying young people, who have diminishing access to landlines (135–137). Accordingly, methods for conducting population-based surveys are rapidly shifting from random-digit-dial telephone-based surveys to online data collection, often using commercial panels recruited through nonprobability recruitment methods. The extent to which these samples are representative of the broader population is an important consideration for population-based surveys such as the IFPS. The weighted IFPS estimates closely resemble population sociodemographics in most countries, including for variables that are incorporated in the poststratification weights. For example, the self-reported BMI was lower in the IFPS than in surveys where height and weight were objectively measured, while comparisons with self-reported data suggest that the IFPS estimates are similar to or perhaps slightly lower than nationally representative surveys. Overall, estimates from nonprobability-based samples should be interpreted with caution, and should be compared with key indicators from nationally representative surveys where possible.
A primary recruitment challenge is that of low-SES and older participants in Mexico, which are underrepresented in both unweighted and weighted IFPS data. Mexico is the only upper-middle-income IFPS country and has very different population demographics compared to other IFPS countries, including for the average age of the population, income, and life expectancy, which may systematically influence access to and participation in survey panels and online surveys. Preliminary data suggest that targeting these groups with specific online survey panels, and increasing accessibility of the survey among those with smartphones, may lessen some of these challenges. The inclusion of other middle- and lower-income countries, including those with markedly different food environments, would be an asset.
The use of self-reported measures for dietary indicators is subject to limitations. For example, self-reports of BMI are known to produce lower estimates than directly measured BMIs. Tests of changes over time in self-reported BMI values may help to mitigate some of the bias associated with single point estimates, on the basis that self-report biases at the population level should be generally constant over time. As the IFPS is limited to a single 24-hour dietary recall, the surveys estimate the mean usual intakes for groups, but are not considered representative of usual intakes for individuals, and cannot be used to estimate distributions of usual intakes for comparison to Dietary Reference Intakes, for example (138). All of the online 24-hour dietary recalls (the ASA24 in the United States, Canada, and Australia and the Intake24 system) use an online interface and adapted automated multiple-pass methods, but differences in responses and response biases have not been tested. Although an online 24-hour dietary recall is under development in Mexico, the lack of a comparable online tool for evaluation of dietary practices in Mexico limits the ability to conduct similar comparisons. Other dietary indicators, such as beverage intake, fruit and vegetable intake, and others, have been adapted from the national measures used in the United States and would be subject to similar levels of mis- or underreporting. Many measures have been tailored to capture unique aspects of dietary intake. For example, the BFQ assesses intake over 7 days to capture episodically consumed beverages that may be missed when only reporting intake for the previous 24 hours, and uses images to support accurate recall of the container size. A comparison of a version of the BFQ relative to 7-day food records among young adults 16–30 years in Canada found moderate to high correlations and agreement between estimates of the frequency of consumption and total volume of each of the beverage categories consumed for 14 of 17 beverage categories (between 0.46 and 0.91 for the number of drinks and 0.48 and 0.95 for the volume) and lower correlations for 3 of 17 categories (coffee with cream or sugar, specialty coffee, and hard alcohol with no mix) (104).
Although the IFPS is designed primarily to examine national-level differences, several important nutrition policies are implemented at the subnational level, particularly in Canada, Australia, and the United States, in which many policies are implemented at the state/provincial level. The ability to evaluate subnational policies with IFPS data is largely determined by issues of sample size and statistical power. Analyses of subnational policies that apply to small segments of the population will have limited power for within-country differences over time; however, sample sizes of 4000 in each country may be sufficient to detect policies that cover substantial proportions of the overall population within a country.
In conclusion, the importance of diet-related NCDs and their contributions to global morbidity and mortality require fundamental shifts in nutrition policy and sociocultural norms surrounding food and nutrition. Innovative policy measures implemented in different countries provide an opportunity to advance the evidence on nutrition policies and to inform regulators in other jurisdictions. The IFPS project seeks to collect this evidence and to document broader trends in dietary patterns across countries.
Supplementary Material
ACKNOWLEDGEMENTS
The authors’ responsibilities were as follows – DH, LV: prepared the initial draft of the manuscript; CMW: assisted in preparing the initial draft of the manuscript; and all authors: contributed to the manuscript and read and approved the final manuscript.
Notes
This supplement was supported by funding from a Project Grant from the Canadian Institutes of Health Research (PJT-162167). The views expressed herein are solely the responsibility of the authors and do not necessarily represent the official views of the Canadian Institutes for Health Research or other sources of funding. The International Food Policy Study is funded by a Project Grant from the Canadian Institutes of Health Research (CIHR) (PJT-162167) and supported by a Public Health Agency of Canada (PHAC)-CIHR Chair in Applied Public Health (to DH). JA and MW are supported by the Medical Research Council (grant number MC_UU_00006/7). GS is a recipient of an NHMRC Emerging Leadership Fellowship (2021/GNT2008535). AJC and GS are the recipients of Heart Foundation Future Leader Fellowships from the National Heart Foundation of Australia (project numbers 102611 and 102035).
Author disclosures: DH has served as a paid expert witness on behalf of public health authorities in the legal challenge to San Francisco’s health warning ordinance for sugar-sweetened beverages. All other authors report no conflicts of interest.
Supplemental Table 1 and Supplemental Figures 1 and 2 are available from the “Supplementary data” link in the online posting of the article and from the same link in the online table of contents at https://academic.oup.com/jn/.
Abbreviations used: AAPOR, American Association for Public Opinion Research; ASA24, Automated Self-Administered 24-Hour Dietary Assessment Tool; BFQ, Beverage Frequency Questionnaire; CCHS, Canadian Community Health Survey; FOP, front-of-package; GDA, Guideline Daily Amounts; IFPS, International Food Policy Study; NCD, noncommunicable diseases; OECD, Organization for Economic Cooperation and Development; SES, socioeconomic status.
Contributor Information
David Hammond, School of Public Health Sciences, University of Waterloo, Waterloo, Ontario, Canada.
Lana Vanderlee, École de Nutrition, Centre Nutrition, santé et société (Centre NUTRISS), and Institut sur la nutrition et les aliments fonctionnels (INAF), Université Laval, Québec, Canada.
Christine M White, School of Public Health Sciences, University of Waterloo, Waterloo, Ontario, Canada.
Rachel B Acton, School of Public Health Sciences, University of Waterloo, Waterloo, Ontario, Canada.
Martin White, Medical Research Council Epidemiology Unit, University of Cambridge, Cambridge, United Kingdom.
Christina A Roberto, Department of Medical Ethics and Health Policy, Perelman School of Medicine, University of Pennsylvania, Philadelphia, PA, USA.
Adrian Cameron, Global Obesity Centre, Institute for Health Transformation, Deakin University, Geelong, Australia.
Gary Sacks, Global Obesity Centre, Institute for Health Transformation, Deakin University, Geelong, Australia.
Sharon Kirkpatrick, School of Public Health Sciences, University of Waterloo, Waterloo, Ontario, Canada.
Joel Dubin, Department Statistics and Actuarial Science, University of Waterloo, Waterloo, Canada.
Jean Adams, Medical Research Council Epidemiology Unit, University of Cambridge, Cambridge, United Kingdom.
Alejandra Jauregui, Centre for Health and Nutrition Research, National Institute of Public Health, Cuernavaca, Mexico.
James F Thrasher, Department of Health Promotion, Education & Behavior, Arnold School of Public Health, University of South Carolina, Columbia, SC, USA.
References
- 1. WHO . Food based dietary guidelines for the WHO European region. World Health Organization; 2003. [Google Scholar]
- 2. WHO . Obesity and overweight. World Health Organization; 2018. Available from[Internet]: https://www.fda.gov/iceci/inspections/inspectionguides/ucm074948.htm. [Google Scholar]
- 3. WHO . Global action plan for the prevention and control of noncommunicable diseases 2013–2020. World Health Organization; 2013. [Google Scholar]
- 4. WHO . Report of the Commission on Ending Childhood Obesity. World Health Organization; 2016. [Google Scholar]
- 5. Swinburn B, Sacks G, Vandevijvere S, Kumanyika S, Lobstein T, Neal B, Barquera S, Friel S, Hawkes C, Kelly Bet al. INFORMAS (International Network for Food and Obesity/Non-communicable Diseases Research, Monitoring and Action Support): Overview and key principles. Obes Rev. 2013;14(S1):1–12. [DOI] [PubMed] [Google Scholar]
- 6. Swinburn BA, Sacks G, Hall KD, McPherson K, Finegood DT, Moodie ML, Gortmaker SL. The global obesity pandemic: Shaped by global drivers and local environments. Lancet North Am Ed. 2011;378(9793):804. [DOI] [PubMed] [Google Scholar]
- 7. Fanzo J, Arabi M, Burlingame B, Haddad L, Kimenju S, Miller G, Nie F, Recine E, Serra-Majem L, Sinha D. Nutrition and food systems. A report by the High Level Panel of Experts on Food Security and Nutrition of the Committee on World Food Security. United Nations: Food and Agricultural Organization; 2017. [Google Scholar]
- 8. Vandevijvere S, Barquera S, Caceres G, Corvalan C, Karupaiah T, Kroker-Lobos MF, L'Abbe M, Ng SH, Phulkerd S, Ramirez-Zea Met al. An 11-country study to benchmark the implementation of recommended nutrition policies by national governments using the Healthy Food Environment Policy Index, 2015–2018. Obes Rev. 2019;20(S2):57–66. [DOI] [PubMed] [Google Scholar]
- 9. Kanter R, Vanderlee L, Vandevijvere S. Front-of-package nutrition labelling policy: Global progress and future directions. Public Health Nutr. 2018;21(8):1399–408. [DOI] [PMC free article] [PubMed] [Google Scholar]
- 10. Taillie LS, Busey E, Mediano Stoltze F, Dillman Carpentier FR. Governmental policies to reduce unhealthy food marketing to children. Nutr Rev. 2019;77(11):787–816. [DOI] [PMC free article] [PubMed] [Google Scholar]
- 11. Popkin BM, Ng SW. Sugar-sweetened beverage taxes: Lessons to date and the future of taxation. PLoS Med. 2021;18(1):e1003412. [DOI] [PMC free article] [PubMed] [Google Scholar]
- 12. Herforth A, Arimond M, Álvarez-Sánchez C, Coates J, Christianson K, Muehlhoff E. A global review of food-based dietary guidelines. Adv Nutr. 2019;10(4):590–605. [DOI] [PMC free article] [PubMed] [Google Scholar]
- 13. Snell A, Reeves A, Rieger M, Galea G, Mauer-Stender K, Mikkelsen B, Stuckler D. WHO regional office for Europe's natural experiment studies project: An introduction to the series. Eur J Public Health. 2018;28(Suppl 2):1–3. [DOI] [PMC free article] [PubMed] [Google Scholar]
- 14. Arrúa A, Machín L, Curutchet MR, Martínez J, Antúnez L, Alcaire F, Giménez A, Ares G. Warnings as a directive front-of-pack nutrition labelling scheme: Comparison with the guideline daily amount and traffic-light systems. Public Health Nutr. 2017;20(13):2308–17. [DOI] [PMC free article] [PubMed] [Google Scholar]
- 15. Cecchini M, Warin L. Impact of food labelling systems on food choices and eating behaviours: A systematic review and meta-analysis of randomized studies. Obes Rev. 2016;17(3):201–10. [DOI] [PubMed] [Google Scholar]
- 16. Taillie LS, Hall MG, Popkin BM, Ng SW, Murukutla N. Experimental studies of front-of-package nutrient warning labels on sugar-sweetened beverages and ultra-processed foods: A scoping review. Nutrients. 2020;12(2):569. [DOI] [PMC free article] [PubMed] [Google Scholar]
- 17. Reyes M, Smith Taillie L, Popkin B, Kanter R, Vandevijvere S, Corvalán C. Changes in the amount of nutrient of packaged foods and beverages after the initial implementation of the Chilean law of food labelling and advertising: A nonexperimental prospective study. PLoS Med. 2020;17(7):e1003220. [DOI] [PMC free article] [PubMed] [Google Scholar]
- 18. Jones A, Shahid M, Neal B. Uptake of Australia's Health Star Rating System. Nutrients. 2018;10(8):997. [DOI] [PMC free article] [PubMed] [Google Scholar]
- 19. Ogilvie D, Adams J, Bauman A, Gregg EW, Panter J, Siegel KR, Wareham NJ, White M. Using natural experimental studies to guide public health action: Turning the evidence-based medicine paradigm on its head. J Epidemiol Community Health. 2020;74(2):203–8. [DOI] [PMC free article] [PubMed] [Google Scholar]
- 20. Crane M, Bohn-Goldbaum E, Grunseit A, Bauman A. Using natural experiments to improve public health evidence: A review of context and utility for obesity prevention. Health Res Policy Syst. 2020;18(1):48. [DOI] [PMC free article] [PubMed] [Google Scholar]
- 21. Shadish WR, Cook TD, Campbell DT. Experimental and quasi-experimental designs for generalized causal inference. Boston, MA: Houghton Mifflin; 2002. [Google Scholar]
- 22. Campbell M, Fitzpatrick R, Haines A, Kinmonth AL, Sandercock P, Spiegelhalter D, Tyrer P. Framework for design and evaluation of complex interventions to improve health. BMJ. 2000;321(7262):694–6. [DOI] [PMC free article] [PubMed] [Google Scholar]
- 23. Victora CG, Habicht J-P, Bryce J. Evidence-based public health: Moving beyond randomized trials. Am J Public Health. 2004;94(3):400–5. [DOI] [PMC free article] [PubMed] [Google Scholar]
- 24. Taillie LS, Reyes M, Colchero MA, Popkin B, Corvalán C. An evaluation of Chile's law of food labeling and advertising on sugar-sweetened beverage purchases from 2015 to 2017: A before-and-after study. PLoS Med. 2020;17(2):e1003015. [DOI] [PMC free article] [PubMed] [Google Scholar]
- 25. Teng AM, Jones AC, Mizdrak A, Signal L, Genc M, Wilson N. Impact of sugar-sweetened beverage taxes on purchases and dietary intake: Systematic review and meta-analysis. Obes Rev. 2019;20(9):1187–204. [DOI] [PMC free article] [PubMed] [Google Scholar]
- 26. Micha R, Coates J, Leclercq C, Charrondiere UR, Mozaffarian D. Global dietary surveillance: Data gaps and challenges. Food Nutr Bull. 2018;39(2):175–205. [DOI] [PubMed] [Google Scholar]
- 27. Miller V, Singh GM, Onopa J, Reedy J, Shi P, Zhang J, Tahira A, Morris MLS, Marsden DP, Kranz S. Global dietary database 2017: Data availability and gaps on 54 major foods, beverages and nutrients among 5.6 million children and adults from 1220 surveys worldwide. BMJ Glob Health. 2021;6(2):e003585. [DOI] [PMC free article] [PubMed] [Google Scholar]
- 28. Glanz K, Sallis JF, Saelens BE, Frank LD. Healthy nutrition environments: Concepts and measures. Am J Health Promot. 2005;19(5):330–3. [DOI] [PubMed] [Google Scholar]
- 29. Contento IR. Nutrition education: Linking research, theory, and practice. Sudbury, MA: Jones & Bartlett Learning; 2007. [PubMed] [Google Scholar]
- 30. Craig P, Cooper C, Gunnell D, Haw S, Lawson K, Macintyre S, Ogilvie D, Petticrew M, Reeves B, Sutton M. Using natural experiments to evaluate population health interventions: New Medical Research Council guidance. J Epidemiol Community Health. 2012;66(12):1182–6. [DOI] [PMC free article] [PubMed] [Google Scholar]
- 31. Diario Oficial . MODIFICACIÓN a la norma oficial Mexicana NOM-051-SCFI/SSA1–2010, Especificaciones generales de etiquetado para alimentos y bebidas no alcohólicas preenvasados-Información comercial y sanitaria, publicada el 5 de abril de 2010. Mexico City: Government of Mexico; 2020. Available from[Internet]: https://www.dof.gob.mx/2020/SEECO/NOM_051.pdf. [Google Scholar]
- 32. MP Consulting . Health Star rating system five year review report. Canberra AUS: Commonwealth of Australia; 2019. Available from[Internet]: http://www.healthstarrating.gov.au/internet/healthstarrating/publishing.nsf/Content/D1562AA78A574853CA2581BD00828751/$File/Health-Star-Rating-System-Five-Year-Review-Report.pdf. [Google Scholar]
- 33. Australia and New Zealand Ministerial Forum on Food Regulation . Australia and New Zealand Ministerial Forum on Food Regulation communique. Canberra AUS: Commonwealth of Australia; 2019. Available from[Internet]: https://foodregulation.gov.au/internet/fr/publishing.nsf/content/818671E42DDCF1F6CA2584B300120830/$File/Forum-Communiqu%C3%A9-15%20November%202019.pdf. [Google Scholar]
- 34. Health Canada . Health Canada's healthy eating strategy. Ottawa, On: Health Canada; 2016. Available from[Internet]: http://healthycanadians.gc.ca/publications/eating-nutrition/healthy-eating-strategy-canada-strategie-saine-alimentation/index-eng.php. [Google Scholar]
- 35. Department of Health and Social Care . Tackling obesity: Empowering adults and children to live healthier lives. Ottawa, On: Health Canada; 2020. Available from[Internet]: https://www.gov.uk/government/publications/tackling-obesity-government-strategy/tackling-obesity-empowering-adults-and-children-to-live-healthier-lives. [Google Scholar]
- 36. Fong GT, Cummings KM, Borland R, Hastings G, Hyland A, Giovino GA, Hammond D, Thompson ME. The conceptual framework of the International Tobacco Control (ITC) policy evaluation project. Tob Control. 2006;15(Suppl 3):iii3–iii11. [DOI] [PMC free article] [PubMed] [Google Scholar]
- 37. International Agency for Research on Cancer . IARC handbooks of cancer prevention volume 12: Methods for evaluating tobacco control policies. Lyon, France: International Agency for Research on Cancer; 2008. [Google Scholar]
- 38. National Cancer Institute . The role of the media in promoting and reducing tobacco use. NIH Pub. No. 07-6242. Bethesda, MD: US Department of Health and Human Services, National Institutes of Health, National Cancer Institute; 2008. [Google Scholar]
- 39. U.S. Department of Health and Human Services . Preventing tobacco use among youth and young adults: A report of the Surgeon General. Atlanta, GA: U.S. Department of Health and Human Services, Centers for Disease Control and Prevention, National Center for Chronic Disease Prevention and Health Promotion, Office on Smoking and Health; 2012. [Google Scholar]
- 40. Southwell BG, Barmada CH, Hornik RC, Maklan DM. Can we measure encoded exposure? Validation evidence from a national campaign. J Health Commun. 2002;7(5):445–53. [DOI] [PMC free article] [PubMed] [Google Scholar]
- 41. Feighery EC, Henriksen L, Wang Y, Schleicher NC, Fortmann SP. An evaluation of four measures of adolescents' exposure to cigarette marketing in stores. Nicotin Tob Res. 2006;8(6):751–9. [DOI] [PubMed] [Google Scholar]
- 42. Wadsworth E, McNeill A, Li L, Hammond D, Thrasher J, Yong H-H, Cummings K, Fong G, Hitchman S. Reported exposure to e-cigarette advertising and promotion in different regulatory environments: Findings from the International Tobacco Control Four Country (ITC-4C) survey. PrevMed. 2018;112:130–7. [DOI] [PMC free article] [PubMed] [Google Scholar]
- 43. Hammond D, Reid JL, Burkhalter R, Rynard VL. E-cigarette marketing regulations and youth vaping: Cross-sectional surveys, 2017–2019. Pediatrics. 2020;146(1):e20194020. [DOI] [PMC free article] [PubMed] [Google Scholar]
- 44. Hammond D, White CM, Mahamad S. International Food Policy Study: Technical report - Wave 1 (2017). Waterloo, Canada: University of Waterloo; 2019. [Google Scholar]
- 45. Tourangeau R, Conrad F, Couper M. The science of web surveys. New York, NY: Oxford University Press; 2013. [Google Scholar]
- 46. American Association of Public Opinion Research (AAPOR) Standards Committee . Report on online panels. Alexandria, VA: AAPOR; 2010. Available from[Internet]: https://www.aapor.org/Education-Resources/Reports/Report-on-Online-Panels. [Google Scholar]
- 47. American Association of Public Opinion Research (AAPOR) . Online panels. Alexandria, VA: AAPOR; 2018. Available from[Internet]: https://www.aapor.org/Education-Resources/Election-Polling-Resources/Online-Panels.aspx. [Google Scholar]
- 48. Braunsberger K, Wybenga H, Gates R. A comparison of reliability between telephone and web-based surveys. J Bus Res. 2007;60(7):758–64. [Google Scholar]
- 49. American Association of Public Opinion Research (AAPOR) Standards Committee . Report on online panels. Alexandria, VA; 2010. Available from[Internet]: https://www.aapor.org/Education-Resources/Reports/Report-on-Online-Panels. [Google Scholar]
- 50. American Association of Public Opinion Research (AAPOR) . Online panels. Alexandria, VA; 2018. Available from[Internet]: https://www.aapor.org/Education-Resources/Election-Polling-Resources/Online-Panels.aspx. [Google Scholar]
- 51. Pew Research Center . What low response rates mean for telephone surveys. Washington, DC: Pew Research Center; 2017. Available from[Internet]: https://www.pewresearch.org/methods/2017/05/15/what-low-response-rates-mean-for-telephone-surveys/. [Google Scholar]
- 52. Australian Bureau of Statistics . Household use of information technology. Canberra, AUS: Commonwealth of Australia; 2018. Available from[Internet]: https://www.abs.gov.au/ausstats/abs@.nsf/mf/8146.0. [Google Scholar]
- 53. Statistics Canada . The internet and digital technology. Ottawa, ON: Statistics Canada; 2017. Available from[Internet]: https://www150.statcan.gc.ca/n1/pub/11-627-m/11-627-m2017032-eng.htm. [Google Scholar]
- 54. Office for National Statistics . Internet users, UK: 2018. London UK: Office for National Statistics; 2017. Available from[Internet]: https://www.ons.gov.uk/businessindustryandtrade/itandinternetindustry/bulletins/internetusers/2018. [Google Scholar]
- 55. Pew Research Center . Internet/broadband fact sheet. Washington, DC: Pew Research Center; 2018. Available from[Internet]: https://www.pewinternet.org/fact-sheet/internet-broadband/. [Google Scholar]
- 56. Instituto Nacional de Estadística y Geografía [National Institute of Statistics and Geography] . Encuesta nacional sobre disponibilidad y uso de tecnologías de la información en los hogares (ENDUTIH) [national survey on availability and use of information technologies in homes]. Aguascalientes, MX: Instituto Nacional de Estadística y Geografía; 2019. Available from[Internet]: https://www.inegi.org.mx/programas/dutih/2019/. [Google Scholar]
- 57. PEW Research Center . Internet/broadband fact sheet. Washington, DC: Pew Research Center; 2019. Available from[Internet]: https://www.pewresearch.org/internet/fact-sheet/internet-broadband/. [Google Scholar]
- 58. Statistics Canada . Canadian internet use survey data visualization tool. Ottawa, ON: Statistics Canada;2019. Available from[Internet]: https://www150.statcan.gc.ca/n1/pub/71-607-x/71-607-x2019017-eng.htm. [Google Scholar]
- 59. Instituto Nacional de Estadística y Geografía [National Institute of Statistics and Geography] . Encuesta nacional sobre disponibilidad y uso de tecnologías de la información en los hogares (ENDUTIH) [national survey on availability and use of information technologies in homes]. Aguascalientes, MX: Instituto Nacional de Estadística y Geografía; 2019. Available from[Internet]: https://www.inegi.org.mx/programas/dutih/2019/. [Google Scholar]
- 60. Office for National Statistics . Exploring the UK's digital divide. London UK: Office for National Statistics; 2019. Available from[Internet]: https://www.ons.gov.uk/peoplepopulationandcommunity/householdcharacteristics/homeinternetandsocialmediausage/articles/exploringtheuksdigitaldivide/2019-03-04#what-other-patterns-are-there-in-internet-usage. [Google Scholar]
- 61. Johnson JS. Improving online panel data usage in sales research. J Pers Sell Sales Manag. 2016;36(1):74–85. [Google Scholar]
- 62. Groves RM, Fowler F, Couper M, JM L, Singer E, Tourangeau R. Survey methodology. 2nd ed. Hoboken, NJ: John Wiley & Sons; 2009. [Google Scholar]
- 63. Goodman S, Leos-Toro C, Hammond D. Methods to assess cannabis consumption in population surveys: Results of cognitive interviewing. Qual Health Res. 2019;29(10):1474–82. [DOI] [PubMed] [Google Scholar]
- 64. Dodou D, de Winter J. Social desirability is the same in offline, online, and paper surveys: A meta-analysis. Comput Hum Behav. 2014;36:487–95. [Google Scholar]
- 65. Thompson FE, Dixit-Joshi S, Potischman N, Dodd KW, Kirkpatrick SI, Kushi LH, Alexander GL, Coleman LA, Zimmerman TP, Sundaram MEet al. Comparison of interviewer-administered and automated self-administered 24-hour dietary recalls in 3 diverse integrated health systems. Am J Epidemiol. 2015;181(12):970–8. [DOI] [PMC free article] [PubMed] [Google Scholar]
- 66. Kirkpatrick SI, Subar AF, Douglass D, Zimmerman TP, Thompson FE, Kahle LL, George SM, Dodd KW, Potischman N. Performance of the automated self-administered 24-hour recall relative to a measure of true intakes and to an interviewer-administered 24-h recall. Am J Clin Nutr. 2014;100(1):233–40. [DOI] [PMC free article] [PubMed] [Google Scholar]
- 67. Foster E, Lee C, Imamura F, Hollidge SE, Westgate KL, Venables MC, Poliakov I, Rowland MK, Osadchiy T, Bradley JCet al. Validity and reliability of an online self-report 24-h dietary recall method (Intake24): A doubly labelled water study and repeated-measures analysis. J Nutr Sci. 2019;8:e29. [DOI] [PMC free article] [PubMed] [Google Scholar]
- 68. Groves RM, Fowler FJ Jr, Couper MP, Lepkowski JM, Singer E, Tourangeau R. Survey methodology. Hoboken, NJ: John Wiley & Sons; 2011. [Google Scholar]
- 69. Barón JD, Breunig RV, Cobb-Clark DA, Gørgens T, Sartbayeva A. Does the effect of incentive payments on survey response rates differ by income support history?. J Off Stat. 2009;25(4):483–507. [Google Scholar]
- 70. AAPOR Standards Committee . Report on online panels. Lexington VA: AAPOR; 2010. Available from[Internet]: https://www.aapor.org/Education-Resources/Reports/Report-on-Online-Panels. [Google Scholar]
- 71. International Food Policy Study (IFPS) Team . International Food Policy Study. Waterloo, ON: University of Waterloo; 2018. Available from[Internet]: http://foodpolicystudy.com/methods/. [Google Scholar]
- 72. WHO . NCD Global Monitoring Framework. Geneva, Switzerland: WHO; 2013. [Google Scholar]
- 73. Kelly B, Jewell J. What is the evidence on the policy specifications, development processes and effectiveness of existing front-of-pack food labelling policies in the WHO European region?. Copenhagen, DK: UN Regional Office for Europe; 2018. [PubMed] [Google Scholar]
- 74. Statistics Canada . Gender and sex variables. Ottawa, ON: Statistics Canada; 2018. Available from[Internet]: https://www.statcan.gc.ca/eng/concepts/definitions/gender-sex-variables. [Google Scholar]
- 75. Statistics Canada . Canadian Community Health Survey - Annual component (CCHS). Ottawa ON: Statistics Canada; 2013. Available from[Internet]: http://www23.statcan.gc.ca/imdb/p2SV.pl?Function=getSurvey&SDDS=3226&lang=en&db=imdb&adm=8&dis=2. [Google Scholar]
- 76. Instituto Nacional de Salud Pública . Encuesta nacional de salud y nutrición medio camino. Mexico City MX: Government of Mexico; 2016. Available from[Internet]: https://ensanut.insp.mx/encuestas/ensanut2016/descargas/hogar/hogar_socioeconomico/hogar_socioeconomico.pdf. [Google Scholar]
- 77. Office for National Statistics . Ethnic group, national identity and religion. London UK: Office for National Statistics; 2016. Available from[Internet]: https://www.ons.gov.uk/methodology/classificationsandstandards/measuringequality/ethnicgroupnationalidentityandreligion. [Google Scholar]
- 78. CDC . National Health and Nutrition Examination Survey (NHANES). Atlanta GA: Centers for Disease Control and Prevention; 2019. Available from[Internet]: https://www.cdc.gov/nchs/nhanes/index.htm. [Google Scholar]
- 79. International Tobacco Control Policy Evaluation Project . 4-Country smoking and vaping w1. Waterloo ON: University of Waterloo; 2009. Available from[Internet]: https://itcproject.s3.amazonaws.com/uploads/documents/ITC_4CV1_web_Eng_09May.pdf. [Google Scholar]
- 80. UK Data Service . Household questionnaire England: 2011 census. Colchester UK: Economic and Social Research Council; 2011. Available from[Internet]: https://census.ukdataservice.ac.uk/media/50966/2011_england_household.pdf. [Google Scholar]
- 81. Litwin H, Sapir EV. Perceived income adequacy among older adults in 12 countries: Findings from the survey of health, ageing, and retirement in Europe. Gerontologist. 2009;49(3):397–406. [DOI] [PMC free article] [PubMed] [Google Scholar]
- 82. Bradshaw N, Kent B, Henderson W, Setar A. Subjective social status, life course SES, and BMI in young adulthood. Health Psychol. 2017;36(7):682–94. [DOI] [PubMed] [Google Scholar]
- 83. Phillips R, Liaw W, Crampton P, Exeter D, Bazemore A, Vickery KD, Diaz K, Petterson S, Carrozza M. How other countries use deprivation indices-and why the United States desperately needs one. Health Aff. 2016;35(11):1991–8. [DOI] [PubMed] [Google Scholar]
- 84. Knighton AJ, Savitz L, Belnap T, Stephenson B, VanDerslice J. Introduction of an area deprivation index measuring patient socioeconomic status in an integrated health system: Implications for population health. EGEMS (Wash DC). 2016;4(3):1238. [DOI] [PMC free article] [PubMed] [Google Scholar]
- 85. US Economic Research Service. U.S. household food security survey module: Three-stage design, with screeners. In: USDA, USDoA, editor. United States Department of Agriculture; 2012. [Google Scholar]
- 86. Weiss BD, Mays MZ, Martz W, Castro KM, DeWalt DA, Pignone MP, Mockbee J, Hale FA. Quick assessment of literacy in primary care: The newest vital sign. Ann Fam Med. 2005;3(6):514–22. [DOI] [PMC free article] [PubMed] [Google Scholar]
- 87. Mansfield ED, Wahba R, Gillis DE, Weiss BD, L'Abbé M. Canadian adaptation of the Newest Vital Sign©, a health literacy assessment tool. Public Health Nutr. 2018;21(11):2038–45. [DOI] [PMC free article] [PubMed] [Google Scholar]
- 88. Bhawra J, Kirkpatrick SI, Hall MG, Vanderlee L, Hammond D. Initial development and evaluation of the food processing knowledge (FoodProK) score: A functional test of nutrition knowledge based on level of processing. J Acad Nutr Diet. 2021;121(8):1542–50. [DOI] [PubMed] [Google Scholar]
- 89. Monteiro CA, Moubarac JC, Cannon G, Ng SW, Popkin B. Ultra-processed products are becoming dominant in the global food system. Obes Rev. 2013;14(S2):21–28. [DOI] [PubMed] [Google Scholar]
- 90. Monteiro CA, Cannon G, Levy RB, Moubarac J-C, Louzada ML, Rauber F, Khandpur N, Cediel G, Neri D, Martinez-Steele E. Ultra-processed foods: What they are and how to identify them. Public Health Nutr. 2019;22(5):936–41. [DOI] [PMC free article] [PubMed] [Google Scholar]
- 91. Canadian Foundation for Dietary Research . Tracking nutrition trends IX. 2015. Available from[Internet]: https://www.cfdr.ca/Downloads/Tracking-Nutrition-Trends/Tracking-Nutrition-Trends-IX-2015.aspx. [Google Scholar]
- 92. Lin C-TJ, Zhang Y, Carlton ED, Lo S. 2014 FDA health and diet survey. Sllver Spring MD: Food and Drug Administraion; 2016. Available from[Internet]: https://www.fda.gov/files/food/published/2014-FDA-Health-and-Diet-Survey-Topline-Frequency-Report.pdf. [Google Scholar]
- 93. Hock K, Acton RB, Jáuregui A, Vanderlee L, White CM, Hammond D. Experimental study of front-of-package nutrition labels’ efficacy on perceived healthfulness of sugar-sweetened beverages among youth in six countries. Prev Med Rep. 2021;24:101577. [DOI] [PMC free article] [PubMed] [Google Scholar]
- 94. Jáuregui A, White CM, Vanderlee L, Hall MG, Contreras-Manzano A, Nieto C, Sacks G, Thrasher JF, Hammond D, Barquera S. Impact of front-of-pack labels on the perceived healthfulness of a sweetened fruit drink: A randomized experiment in 5 countries. Public Health Nutr. [accessed2022; March 1]. doi:10.1017/S1368980021004535. [DOI] [PMC free article] [PubMed] [Google Scholar]
- 95. Forde H, White M, Levy L, Greaves F, Hammond D, Vanderlee L, Sharp S, Adams J. The relationship between self-reported exposure to sugar-sweetened beverage promotions and intake: Cross-sectional analysis of the 2017 International Food Policy Study. Nutrients. 2019;11(12):3047. [DOI] [PMC free article] [PubMed] [Google Scholar]
- 96. Vanderlee L, Czoli CD, Pauzé E, Potvin Kent M, White CM, Hammond D. A comparison of self-reported exposure to fast food and sugary drinks marketing among parents of children across five countries. Prev Med. 2021;147:106521. [DOI] [PubMed] [Google Scholar]
- 97. Goodman S, Armendariz G, Corkum A, Arellano L, Jáuregui A, Keeble M, Marshall J, Sacks G, Thrasher JF, Vanderlee Let al. Recall of government healthy eating campaigns by consumers in five countries. Public Health Nutr. 2021;24(13):3986–4000. [DOI] [PMC free article] [PubMed] [Google Scholar]
- 98. Raine KD, Nykiforuk CIJ, Vu-Nguyen K, Nieuwendyk LM, VanSpronsen E, Reed S, Wild TC. Understanding key influencers' attitudes and beliefs about healthy public policy change for obesity prevention. Obesity (Silver Spring). 2014;22(11):2426–33. [DOI] [PubMed] [Google Scholar]
- 99. Kwon J, Cameron AJ, Hammond D, White CM, Vanderlee L, Bhawra J, Sacks G. A multi-country survey of public support for food policies to promote healthy diets: Findings from the International Food Policy Study. BMC Pub Health. 2019;19(1):1205. [DOI] [PMC free article] [PubMed] [Google Scholar]
- 100. Gómez-Donoso C, Sacks G, Vanderlee L, Hammond D, White CM, Nieto C, Bes-Rastrollo M, Cameron AJ. Public support for healthy supermarket initiatives focused on product placement: A multi-country cross-sectional analysis of the 2018 International Food Policy Study. Int J Behav Nutr Phys Act. 2021;18(1):78. [DOI] [PMC free article] [PubMed] [Google Scholar]
- 101. O'Neill M WC, Vanderlee L, Reid JL, Acton B, Hammond D. Validation of a brief measure to assess food source and preparation: The food source dietary recall. Under review2019. [Google Scholar]
- 102. O'Neill M, White C, Vanderlee L, Reid JL, Acton RB, Hammond D, editors. Validation of a 7-day food source recall. Poster presented at: The International Society for Behavioral Nutrition and Physical Activity Annual Meeting on June 7-10; 2017; Victoria, Canada. [Google Scholar]
- 103. Wiggers D, Vanderlee L, White CM, Reid JL, Minaker L, Hammond D. Food sources among young people in five major Canadian cities. Can J Pub Health. 2018;109(4):506–15. [DOI] [PMC free article] [PubMed] [Google Scholar]
- 104. Vanderlee L, Reid JL, White CM, Hobin EP, Acton RB, Jones AC, O'Neill M, Kirkpatrick SI, Hammond D. Evaluation of the online beverage frequency questionnaire (BFQ). Nutr J. 2018;17(1):73. [DOI] [PMC free article] [PubMed] [Google Scholar]
- 105. CDC . 2017 Behavioral Risk Factor Surveillance System Questionnaire (BRFSSQ). Atlanta GA: Centers for Disease Control and Prevention; 2016.; Available from[Internet]: https://wwwn.cdc.gov/nchs/data/nhanes/2015-2016/questionnaires/WHQ_I.pdf. [Google Scholar]
- 106. Vergeer L, Vanderlee L, White CM, Hammond D. Vegetarianism and other eating practices among youth and young adults in major Canadian cities. Public Health Nutr. 2020;23(4):609–19. [DOI] [PMC free article] [PubMed] [Google Scholar]
- 107. Canadian Council of Food and Nutrition . Tracking nutrition trends VII: An initiative of the Canadian Council of Food and Nutrition. Mississauga, ON: Canadian Council of Food and Nutrition; 2008. Available from[Internet]: https://www.cfdr.ca/Downloads/CCFN-docs/C1180—TNT-VII-FINAL-REPORT—full-report–Sept-1.aspx. [Google Scholar]
- 108. CDC . NHANES 2015–2016 weight history - WHQ. Atlanta GA: Centers for Disease Control and Prevention; 2013. Available from[Internet]: https://wwwn.cdc.gov/nchs/data/nhanes/2015-2016/questionnaires/WHQ_I.pdf. [Google Scholar]
- 109. Kirkpatrick SI, Reedy J, Krebs-Smith SM, Pannucci TE, Subar AF, Wilson MM, Lerman JL, Tooze JA. Applications of the Healthy Eating Index for surveillance, epidemiology, and intervention research: Considerations and caveats. J Acad Nutr Diet. 2018;118(9):1603–21. [DOI] [PMC free article] [PubMed] [Google Scholar]
- 110. Subar AF, Kirkpatrick SI, Mittl B, Zimmerman TP, Thompson FE, Bingley C, Willis G, Islam NG, Baranowski T, McNutt Set al. The automated self-administered 24-hour dietary recall (ASA24): A resource for researchers, clinicians, and educators from the National Cancer Institute. J Acad Nutr Diet. 2012;112(8):1134–7. [DOI] [PMC free article] [PubMed] [Google Scholar]
- 111. Freedman LS, Commins JM, Moler JE, Willett W, Tinker LF, Subar AF, Spiegelman D, Rhodes D, Potischman N, Neuhouser MLet al. Pooled results from 5 validation studies of dietary self-report instruments using recovery biomarkers for potassium and sodium intake. Am J Epidemiol. 2015;181(7):473–87. [DOI] [PMC free article] [PubMed] [Google Scholar]
- 112. Freedman LS, Commins JM, Moler JE, Arab L, Baer DJ, Kipnis V, Midthune D, Moshfegh AJ, Neuhouser ML, Prentice RLet al. Pooled results from 5 validation studies of dietary self-report instruments using recovery biomarkers for energy and protein intake. Am J Epidemiol. 2014;180(2):172–88. [DOI] [PMC free article] [PubMed] [Google Scholar]
- 113. Health Canada . Reference guide to understanding and using the data: 2015 Canadian Community Health Survey - Nutrition. Ottawa ON: Health Canada; 2017. [Google Scholar]
- 114. Simpson E, Bradley J, Poliakov I, Jackson D, Olivier P, Adamson AJ, Foster E. Iterative development of an online dietary recall tool: INTAKE24. Nutrients. 2017;9(2):118. [DOI] [PMC free article] [PubMed] [Google Scholar]
- 115. WHO Regional Office for Europe . Body mass index - BMI. Copenhagan, DK: WHO Regional Office for Europe; n.d. Available from[Internet]: https://www.euro.who.int/en/health-topics/disease-prevention/nutrition/a-healthy-lifestyle/body-mass-index-bmi. [Google Scholar]
- 116. Haines J, Ziyadeh NJ, Franko DL, McDonald J, Mond JM, Austin SB. Screening high school students for eating disorders: Validity of brief behavioral and attitudinal measures. J Sch Health. 2011;81(9):530–5. [DOI] [PubMed] [Google Scholar]
- 117. Puhl RM, Latner JD, King KM, Luedicke J. Weight bias among professionals treating eating disorders: Attitudes about treatment and perceived patient outcomes. Int J Eat Disord. 2014;47(1):65–75. [DOI] [PubMed] [Google Scholar]
- 118. Statistics Canada . Canadian Health Measures Survey (CHMS). Ottawa, ON: Statistics Canada; 2014. Available from[Internet]: http://www23.statcan.gc.ca/imdb/p2SV.pl?Function=getSurvey&SDDS=5071. [Google Scholar]
- 119. Izrael D, Hoaglin DC, Battaglia MP, eds. To rake or not to rake is not the question anymore with the enhanced raking macro. In: Proceedings of the Twenty-Ninth Annual SAS Users Group International Conference; SAS Users Group International;2004. [Google Scholar]
- 120. Abt Associates . Raking survey data (a.k.a. sample balancing). Chicago, IL: Abt Associates; 2019. Available from[Internet]: https://www.abtassociates.com/raking-survey-data-aka-sample-balancing. [Google Scholar]
- 121. Izrael D, Battaglia MP, Frankel MR, eds. Extreme survey weight adjustment as a component of sample balancing (aka raking). In: Proceedings from the Thirty-Fourth Annual SAS Users Group International Conference; SAS Users Group International; 2009. [Google Scholar]
- 122. Kontopantelis E, Doran T, Springate DA, Buchan I, Reeves D. Regression based quasi-experimental approach when randomisation is not an option: Interrupted time series analysis. BMJ. 2015;350:h2750. [DOI] [PMC free article] [PubMed] [Google Scholar]
- 123. Lopez Bernal J, Cummins S, Gasparrini A. The use of controls in interrupted time series studies of public health interventions. Int J Epidemiol. 2018;47(6):2082–93. [DOI] [PubMed] [Google Scholar]
- 124. American Association for Public Opinion Research . Standard definitions: Final dispositions of case codes and outcomes for surveys. 7th ed. Lexington, VA: AAPOR; 2011.; 2014. [Google Scholar]
- 125. Hammond D, White CM, Rynard VL, Vanderlee L. International Food Policy Study: Technical report – 2018 survey (wave 2). Waterloo, ON: University of Waterloo; 2021. Available from[Internet]: http://foodpolicystudy.com/methods. [Google Scholar]
- 126. Hammond D, White CM, Rynard VL, Vanderlee L. International Food Policy Study: Technical report – 2019 survey (wave 3). Waterloo, ON: University of Waterloo; 2021. Available from[Internet]: http://foodpolicystudy.com/methods. [Google Scholar]
- 127. Hammond D, White CM, Rynard VL, Vanderlee L. International Food Policy Study: Technical report – 2020 survey (wave 4). University of Waterloo; 2021. Available from[Internet]: http://foodpolicystudy.com/methods. [Google Scholar]
- 128. Organisation for Economic Co-operation and Development (OECD) . Overweight or obese population: Self-reported, 2018. Paris France: OECD; 2018.; Available from[Internet]: https://data.oecd.org/healthrisk/overweight-or-obese-population.htm. [Google Scholar]
- 129. Statistics Canada . Overweight and obese adults, 2018. Ottawa, Canada: Statistics Canada; 2019. Available from[Internet]: https://www150.statcan.gc.ca/n1/en/pub/82-625-x/2019001/article/00005-eng.pdf?st=rgC0tkJ6. [Google Scholar]
- 130. Corvalán C, Reyes M, Garmendia ML, Uauy R. Structural responses to the obesity and non-communicable diseases epidemic: The Chilean law of food labeling and advertising. Obes Rev. 2013;14:79–87. [DOI] [PubMed] [Google Scholar]
- 131. Corvalán C, Reyes M, Garmendia ML, Uauy R. Structural responses to the obesity and non-communicable diseases epidemic: Update on the Chilean law of food labelling and advertising. Obes Rev. 2019;20(3):367–74. [DOI] [PubMed] [Google Scholar]
- 132. Swinburn B, Vandevijvere S, Kraak V, Sacks G, Snowdon W, Hawkes C, Barquera S, Friel S, Kelly B, Kumanyika S. Monitoring and benchmarking government policies and actions to improve the healthiness of food environments: A proposed government healthy food environment policy index. Obes Rev. 2013;14(S1):24. [DOI] [PubMed] [Google Scholar]
- 133. McKay FH, Haines BC, Dunn M. Measuring and understanding food insecurity in Australia: A systematic review. Int J Environ Res Public Health. 2019;16(3):476. [DOI] [PMC free article] [PubMed] [Google Scholar]
- 134. Cafiero C, Viviani S, Nord M. Food security measurement in a global context: The food insecurity experience scale. Measurement. 2018;116:146–52. [Google Scholar]
- 135. Dennis JM, Li R. More honest answers to web surveys? A study of data collection mode effects. J Online Res. 2007;10(07):1–15. [Google Scholar]
- 136. Blumberg SJ, Luke JV. Wireless substitution: Early release of estimates from the National Health Interview Survey, July–December 2019. National Center for Health Statistics; 2020. Available from[Internet]: https://www.cdc.gov/nchs/data/nhis/earlyrelease/wireless202009-508.pdf. [Google Scholar]
- 137. Biemer PP, de Leeuw ED, Eckman S, Edwards B, Kreuter F, Lyberg LE, Tucker NC, West BT. Total survey error in practice. Hoboken, NJ: John Wiley & Sons; 2017. [Google Scholar]
- 138. Subar AF, Freedman LS, Tooze JA, Kirkpatrick SI, Boushey C, Neuhouser ML, Thompson FE, Potischman N, Guenther PM, Tarasuk Vet al. Addressing current criticism regarding the value of self-report dietary data. J Nutr. 2015;145(12):2639–45. [DOI] [PMC free article] [PubMed] [Google Scholar]
- 139. Organisation for Economic Co-operation and Development (OECD) . Overweight or obese population: Measured. Paris France: OECD; 2014. Available from[Internet]: https://data.oecd.org/healthrisk/overweight-or-obese-population.htm. [Google Scholar]
Associated Data
This section collects any data citations, data availability statements, or supplementary materials included in this article.