

Abstract
Vessel models are a first step in developing endovascular medical devices. However, these models, often made from glass or silicone, do not accurately represent the mechanical properties of human vascular tissue, limiting their use to basic training and proof-of-concept testing. This study outlines methods to quantify human vascular tissue mechanical properties and synthetic biomaterials for creating representative vessel models. Human vascular tissue was assessed and compared to silicone and new UV-cured polymers (VC-A30) using the following eight mechanical tests: compressive, shear, tensile dynamic elastic modulus, Poisson’s ratio, hardness, radial force, compliance, and lubricity. Half of these testing methods were nondestructive, allowing for multiple mechanical and histological characterizations of the same human tissue sample. Histological evaluation of the cellular and extracellular matrix of the human vessels verified that the dynamic moduli and Poison’s ratio tests were nondestructive. Fluid absorption by VC-A30 showed statistically significant softening of mechanical properties, stabilizing after 4 days in phosphate-buffered saline (PBS). Human vasculature exhibited notably similar results to VC-A30 in five of eight mechanical tests (≤30% difference) versus two of eight for standard silicone (≤38% difference). Results show that VC-A30 provides a new option for 3D-printing translucent in vitro vascular models with anatomically relevant mechanical properties. These new vessel analogs may simulate patient-specific vessel disease states, improve surgical training models, accelerate new endovascular device developments, and ultimately reduce the need for animal models.
Keywords: human vasculature, hybrid rheometer, in vitro modeling, material characterization, nondestructive testing
1 |. INTRODUCTION
Silicone casting and additive manufacturing techniques have greatly improved the anatomical accuracy of in vitro vascular models used for surgical simulations and endovascular device testing.1–3 While commercial-grade neurovascular models exist, these models are cost-prohibitive, have limited flexibility, and are designed for direct visualization of specific treatment procedures or physician training.4–6 These models have shown value as training models for use with medical imaging.7 Current silicone- and glass-based models simulate hemodynamic conditions and aid in developing treatment strategies. Still, significant differences in the model material properties and actual human vascular tissue properties remain a considerable limitation.8–10 In vitro models that lack accurate human vascular mechanical properties introduce inaccuracies and uncertainties into testing new medical devices and surgical techniques, ultimately increasing our dependency on further validation with in vivo animal models. A redesign of the in vitro vascular model to better mimic the mechanical properties of human vascular tissue could provide more robust pre-clinical data and reduce the need for in vivo models.
Silicone models are popular among cardiovascular researchers but often have mismatched mechanical strength, stiffness, and friction effects compared to human vascular tissue.11 These differences in mechanical properties can potentially hide device-vessel incompatibilities.12,13 Additionally, current models still lack the material properties that provide the physician tactile feedback during device delivery. Even with surfactant additives, silicone models lag behind animal models for effective simulation of the human condition.14
In recent years additive manufacturing has improved neurosurgical training, allowing trainees to practice specific procedures through tortuous landmarks with supervision in a safer environment.15,16 This research assessed the newly available translucent 3D-printable polymers, identified as VeroClear™ and Agilus30™ (VC-A30), as potential biomaterial candidates for use in mechanically relevant in vitro vascular models. In the past few years, VeroClear and Agilus30 have become increasingly popular in the rapid prototyping of rigid and soft components such as actuators, actuator plates, and vessel phantoms compatible with MRI imaging.17 Other investigators have used these biomaterials to 3D-print a multihardness model of the knee joint, including bones, ligaments, cartilage, and tendons.18 These biomaterials have also been used to create patient-specific cancerous anatomies for use in trainings and presurgical assessments.19
The UV-cured, VC-A30 copolymers are mixed at various proportions during the 3D-printing process, altering durometer hardnesses and allowing for real-time adjustments to, and layering of multiple material properties in one print. Although the exact mixtures are proprietary, the printer provides a range of material property options from the preloaded materials. The printer was loaded with three materials for this study: VeroClear, Agilus30, and a water-soluble support material. The 3D-print system can mix the materials to output 10 different hardness values, ranging from soft (pure Agilus30-27 Shore A), medium (mixtures from 30 Shore A to 95 Shore A), and rigid (pure VeroClear–86 Shore D).20 The 3D-print software provides a user interface to select specific durometer hardnesses throughout regions and layers of the printed samples (GrabCAD Print, Boston, MA). All samples were printed using the Northern Arizona University’s (NAU) Objet260 Connex3 3D-printer (Stratasys, Eden Prarie, MN). The UV-cured 3D-print samples remain stable, without leakage, in a liquid environment. The samples also soften further and stabilize after soaking in a water-based fluid for at least 4 days, making them ideal for long-term in vitro bench top vessel modeling.21,22
2 |. METHODS
Several methods exist to determine the mechanical properties of soft polymers and blood vessels. Unfortunately, many of these procedures are ultimately destructive to the samples, requiring large quantities of donor tissues and biomaterial samples to complete a comprehensive testing regime.23,24 Of the eight mechanical tests used to characterize the vessel samples, four were verified as nondestructive: compression, shear, tension, and Poisson’s ratio. The last four mechanical tests were verified as destructive: hardness, radial force, compliance, and lubricity. All mechanical testing, except for compliance, was performed with NAU’s HR-2 hybrid rheometer (TA Instruments, New Castle, DE). Compliance images were acquired with a BV Pulsera C-Arm fluoroscope (Philips, Eindhoven, Netherlands).
This study involved mechanical tests on three individual human donor common carotid arteries (CCAs), both left and right, with an average wall thickness of 1.2 mm. Donor CCAs provide valuable information for neurovascular modeling as CCAs have been shown to have similar material properties to internal carotid arteries (ICAs) and the middle cerebral arteries (MCAs) of the neurovasculature.25 All samples were acquired from recent body donations from a certified tissue donation bank (Science Care, Phoenix, AZ) under NAU’s existing university agreement. Next, three UV-cured copolymer sample sets were tested (1.2 mm wall thickness): VC-A30-30A (30 Shore A), VC-A30: 40A (40 Shore A), VC-A30 Layered (0.6 mm 30 Shore A outer layer and 0.6 mm 40 Shore A inner layer). Last, a casted silicone vessel sample from a commercially available silicone vessel phantom was tested (1.8 mm wall thickness, United Biologics, Santa Ana, CA). All human, VC-A30, and silicone samples were submerged and tested in a physiologically relevant in vitro modeling fluid (PBS–pH 7.2). VC-A30 samples and the silicone sample were submerged for at least 4 days prior to testing. The three human donor samples were acquired, stored in sterile refrigerated PBS, and tested within 12 h of receipt (all within 5-days post-mortem). Equal number of samples from donor and biomaterial were taken, and an equal number of replicates per sample were used between donor and biomaterial for every assay.
2.1 |. Nondestructive compressive and shear modulus of elasticity tests
Three circular samples, from each donor or biomaterial, underwent compression and shear testing with the rheometer, using an 8 mm diameter flat plate and a quick-change Peltier plate set at 37°C. An 8 mm plate was consistent with the sample sizes that could be obtained from the human CCAs, while also offering the largest surface area for improved resolution of the rheometer mechanical testing datasets. The flat and Peltier plates were fitted with 150-grit sandpaper to prevent sample slippage during testing.26 Samples were preloaded with an axial force of 1 N (equivalent to a physiologically relevant pressure of 150 mmHg). For compression, a dynamic axial strain (100 μm) was applied and released across a linear frequency sweep from 1.0 rad/s (0.16 Hz) to 20.0 rad/s (3.2 Hz–physiological range of 10–192 BPM–Figure 1A). For shear (Figure 1B), a dynamic shear strain (1%) was applied and released across the linear frequency sweep from 1.0 to 20.0 rad/s. The rheometer reported modulus as the change in stress over the change in strain (slope) with respect to frequency. For each sample, three repeat moduli measurements were recorded (n = 9 for each donor/biomaterial).
FIGURE 1.

(A) Compressive modulus: vertical motion of an 8 mm head on the sample. (B) Shear modulus: rotational motion of an 8 mm head on the sample. (C) Poisson’s ratio: vertical motion of a 40 mm mirror head on the sample with an optics plate lower geometry. (D) Tensile modulus: vertical motion of clamps holding a 10 × 5 mm2 sample
2.2 |. Nondestructive Poisson’s ratio test
The three circular samples, from each donor or biomaterial, were then compressed with the rheometer at a known displacement to determine the relationship to diameter increase. Diameter change was monitored from an optics plate (replacing the Peltier plate) and a 40 mm flat-mirrored plate (Figure 1C). Samples were compressed at a constant linear rate of 100 μm/s up to a max normal force of 10 N (~1000 mmHg) and a maximum vessel wall compression of less than 60%. A Dino-Lite high-resolution camera (2 MP, 90 pixels/mm) recorded the diameter change. Poisson’s ratio is the change in sample diameter over the change in sample thickness. For each sample, three repeat Poisson’s ratio measurements were recorded (n = 9 for each donor/biomaterial).
2.3 |. Nondestructive tensile modulus of elasticity test
Two rectangular samples, from each donor or biomaterial, were mounted with the rheometer tension clamps (sample height: 10 mm, sample width: 5 mm). Sections were preloaded to a tension of 100 mmHg. A tensile axial strain (100 μm) was applied and released across the linear frequency sweep from 1.0 to 20.0 rad/s (Figure 1D). Sections were then preloaded to a second tensile load of 160 mmHg. The axial strain (100 μm) and linear frequency sweep (1.0–20.0 rad/s) were repeated. Tensile modulus was reported as the change in stress over the change in strain (slope). For each sample, three repeat tensile measurements were recorded (n = 6 for each donor/biomaterial).
2.4 |. Hardness test
Hardness was measured using the Peltier plate and a 5 mm ball indenter attached to a rheometer head (Figure 2A). The three circular samples, from each donor or biomaterial, were used for the hardiness test. The circular samples were centered, and the ball indenter compressed the sample at a linear rate of 25 μm/s, up to a normal force of 10 N (near 100% compression, >5250 mmHg). The average change in stress over the change in strain (modulus) was determined prior to sample penetration or sample rupture from the ball indenter. Hardness was reported as the modulus at the % compression of vessel rupture. For each sample, one hardness measurement was recorded (n = 3 for each donor/biomaterial).
FIGURE 2.

(A) Hardness test: vertical motion of a 20 mm head with a 5 mm ball indenter. (B) Radial force flat plate: vertical motion of a 40 mm mirror head on the sample OD compressed beyond 50%. (C) Lubricity: 3 cm vessel/tube samples affixed to a wheel with a microcatheter under tension dragged along the luminal surface. (D) Compliance: vessel/tube samples fitted with a pressure transducer injected with liquid contrast agent to pressure up to 300 mmHg. OD, outer diameter
2.5 |. Radial force flat plate test
Three vessel tube samples, from each donor or biomaterial, were used for radial force testing. A commonly used method for measuring the radial force of tubes and stents is the “radial force flat plate test,” which compares the forces at 50% compression of a tube sample outer diameter (OD) per unit length of the tube.27,28 This technique was adopted to measure the radial force of the human vessels and the biomaterial tube samples. Force and displacement were measured using a 40 mm mirrored rheometer plate (Figure 2B). The plate was lowered to the top of the vessel to record the vessel OD. Force was recorded as the rheometer compressed the vessel at a rate of 2.1 mm/min. The force at 50% compression of the vessel/tube OD was reported per unit length of the tube (in N/mm). For each sample, one radial force measurement was recorded (n = 3 for each donor/biomaterial).
2.6 |. Lubricity test
One vessel tube sample, from each donor or biomaterial, was used for compliance testing. Vessel and biomaterial tube samples were cut to 3 cm long and sutured to a 3D printed, 6 cm diameter vessel wheel. The 3 cm tube length allowed for uninterrupted contact between catheter and sample during the test. A microcatheter was positioned along the inner lumen of the vessel and attached to the lower edge of the vessel wheel (Figure 2C). A 20 g weight (0.20 N) was hung from the end of the microcatheter to maintain tension in the microcatheter. The vessel wheel was positioned at an angle of 27° below horizontal to maintain a normal force on the vessel of 0.091 N and keep the vessel and microcatheter submerged in PBS at 22°C (room temperature) for all tests. Low-friction bearings redirected the microcatheter’s near-horizontal 27° position to 90° so the microcatheter could be mounted to the rheometer’s vertical force head. The rheometer head pulled the microcatheter at a constant rate of 500 μm/s for 5 cm. The frictional force was measured every half-second by the rheometer head. The pull-test was repeated without the tube sample and vessel wheel to determine the baseline friction of the bearings. The final frictional force was the average of the measured force minus the baseline force. A coefficient of friction was then calculated (frictional force divided by the applied 0.091 N normal force). For each sample, 100 force measurements (n = 100) were recorded for each donor/biomaterial.
2.7 |. Compliance test
One vessel tube sample, from each donor or biomaterial, was used for compliance testing. Axial and longitudinal changes in vessel dimensions, with respect to pressure, were measured using tube samples attached at the proximal and distal ends with a barb-lure adapter (Figure 2D). A 5-cc syringe filled with radiopaque liquid was connected to the proximal barb-lure adapter. A pressure transducer (Deltran®, Utah Medical, Midvale, UT) was connected to a stopcock and the distal barb-lure adapter. Syringe injection pressures were measured between 80 and 300 mmHg, and corresponding tube images were acquired with the C-arm fluoroscope. Tube axial diameters and longitudinal lengths at each pressure increment were used to calculate volume change. Compliance is the change in tube sample volume over the change in pressure. For each sample, six pressures and volumes (n = 6) were recorded.
2.8 |. Histology preparation
After the human vessel samples underwent nondestructive mechanical testing, histological analysis was used to verify the integrity of the extracellular matrix (ECM) and the intraluminal endothelial layer (EL). Histology was performed on the control vessel samples, the nondestructive test samples, and the destructive hardness samples. Samples were processed, paraffin-embedded, sliced (10 μm), stained (alternating hematoxylin and eosin–H&E and Masson’s trichrome–MT stains within 50 μm of the same tissue area).
The H&E and MT staining procedure followed standard protocols. Slides were analyzed for damage to the tissue layers and cellular structures with a Zeiss Axio A1 light microscope (Zeiss, Jena, Germany) and scanned with a Leica Aperio ScanScope CS2 digital slide scanner (Leica Biosystems, Buffalo Grove, IL). H&E stain provided a general assessment of cellular structures and the integrity of the EL. MT stain provided a general assessment of the vessel ECM in the same tissue region.
2.9 |. Statistical analysis
Each sample and repeat test was reported with the average and standard deviation. The donor samples were compared to each biomaterial sample via a statistical t-test. For rheometer tests across a frequency sweep, the data from 6 rad/s (equivalent to ~1 Hz or 60 BPM) was analyzed with the t-test. Calculated p values and % difference between the donor and biomaterial results were tabulated. A positive % difference implies the donor result was greater than the biomaterial result by the noted percent. Conversely, a negative % difference implies the donor result was lower than the biomaterial result by the noted percent. The difference was considered statistically different if the p value was <.05 (95% confidence).
3 |. RESULTS
The three vessel samples spanned a physiologically relevant range of vessel properties from a gross inspection of donor samples. Donor 1 carotid vessels (~80 y/o male, healthy) had relatively healthy vessels, with little evidence of fatty tissue and plaque buildup (minimal atherosclerosis). Donor 2 carotid vessels (~60 y/o female, keto-acidosis) had soft, collapsible vessels with some surface lesions. Finally, donor 3 carotid vessels (~70 y/o male, moderate atherosclerosis) had stiff vessels with large amounts of fatty deposits and plaques throughout. The results of the donor vessel, VC-A30, and silicone material characterizations are summarized below:
3.1 |. Nondestructive compressive moduli results
Compressive moduli of all samples determined across a physiological equivalent dynamic range of 1.0–20.0 rad/s (10–192 BPM–Figure 3). Comparison of properties at 6.0 rad/s (~1 Hz), donor vessel compressive moduli ranged from 133 to 472 KPa. The compressive moduli of VC-A30 ranged from 569 to 653 KPa with a percentage difference of 20.5% between donor 1 and VC-A30-layered. Although statistically different, VC-A30-30A and VC-A30-layered had less than 23% difference compared to donor 1 (p value <.001–Table 1(A)). Compared to donor vessels, the silicone sample modulus (219 KPa) was 53.7%–64.6% different. VC-A30 biomaterials had similar compressive moduli to donor 1 at low frequencies (<3 rad/s).
FIGURE 3.

Compressive modulus trends of the frequency sweep performed on 8 mm disks of human vessels and biomaterial samples (VC-A30 and silicone). Mean and SD (error bars) were recorded for each point, n = 9
TABLE 1.
Nondestructive testing–comparison of biomaterial properties to donor tissues, with % difference (% diff.) and corresponding p-values
| VC-A30-30A | VC-A30-40A | VC-A30-layered | Silicone | |||||
|---|---|---|---|---|---|---|---|---|
| % diff. | p value | % diff. | p value | % diff. | p value | % diff. | p value | |
| (A) Nondestructive compressive moduli | ||||||||
| Donor 1 | −22.5 | <.001 | −37.9 | <.001 | −20.5 | <.001 | 53.7 | <.001 |
| Donor 2 | −336 | <.001 | −390 | <.001 | −328 | <.001 | −64.6 | <.001 |
| Donor 3 | −310 | <.001 | −361 | <.001 | −303 | <.001 | −54.9 | .005 |
| (B) Nondestructive shear moduli | ||||||||
| Donor 1 | −823 | <.001 | −790 | <.001 | −841 | <.001 | −387 | <.001 |
| Donor 2 | −2850 | <.001 | −2740 | <.001 | −2900 | <.001 | −1450 | <.001 |
| Donor 3 | −1650 | <.001 | −1590 | <.001 | −1680 | <.001 | −823 | <.001 |
| (C) Nondestructive Poisson’s ratio | ||||||||
| Donor 1 | −15.6 | .356 | 8.1 | .560 | −13.0 | .146 | 3.96 | .828 |
| Donor 2 | 16.5 | .128 | 33.6 | .002 | 18.4 | .007 | 30.6 | .015 |
| Donor 3 | −4.32 | .774 | 17.1 | .195 | −1.92 | .847 | 13.4 | .391 |
| (D) Nondestructive tensile moduli | ||||||||
| Donor 1 | −47.4 | <.001 | −51.5 | <.001 | −66.4 | <.001 | −97.6 | <.001 |
| Donor 2 | −418 | <.001 | −432 | <.001 | −485 | <.001 | −595 | <.001 |
| Donor 3 | −266 | <.001 | −276 | <.001 | −313 | <.001 | −391 | <.001 |
Note: Values in bold/italics represent significant results and/or % diff. less than 30%.
3.2 |. Nondestructive shear moduli results
Shear moduli of all samples were determined across a dynamic range of 1–20 rad/s (10–192 BPM) and then compared at a physiological relevant 6 rad/s (~60 BPM–Figure 4). The biomaterial samples were statistically different from the donor vessels. Donor vessel shear moduli ranged from 8 to 15 KPa. The shear moduli of VC-A30 ranged from 133 to 141 KPa. Both VC-A30 and silicone had shear moduli 790%–2900% higher than the donor vessel. The silicone sample modulus was also higher than the donor moduli: 73 KPa with a percentage difference of 387%–1450%. All p values were <.001 (Table 1(B)).
FIGURE 4.

Shear modulus trends of the frequency sweep performed on 8 mm disk samples of human vessels and biomaterial samples (VC-A30 and silicone). Mean and SD (error bars) were recorded for each point, n = 9
3.3 |. Nondestructive Poisson’s ratios results
Donor vessel Poisson’s ratios ranged from 0.37 to 0.51. The Poisson’s ratios of VC-A30 ranged from 0.34 to 0.43 (Figure 5). The Poisson’s ratio of silicone was 0.35. Poisson’s ratio for VC-A30-30A (0.43) was not statistically different from donors 1, 2, or 3 (p values: .356, .128, and .774 respectively), while VC-A30–40A and VC-A30-layered Poisson’s ratios were not statistically different from donors 1 or 3 (Table 1C). The percentage difference of the VC-A30 samples was less than 19%. The Poisson’s ratio of the Silicone sample (0.35) was not statistically different from donors 1 and 3 (p values: 0.828 and 0.391 respectively–Table 1(C)).
FIGURE 5.

Poisson’s ratio of human vessels and biomaterial samples (VC-A30 and silicone). Mean and SD (error bars) were recorded for each displayed value, n = 9
3.4 |. Nondestructive tensile moduli results
Tensile moduli of all samples, prestressed to 100 and 160 mmHg respectively, were determined across a physiological equivalent dynamic range of 1.0–20.0 rad/s (10–192 BPM) and compared at 6 rad/s (~60 BPM–Figure 6). Donor vessel tensile moduli ranged from 2000 to 7000 KPa. For VC-A30-30A, tensile moduli ranged from 11,000–12,000 KPa. The silicone sample modulus was 16,000 KPa. Both VC-A30 and silicone had tensile moduli that were 47.4%–595% different, compared to donor vessels (p values <.001–Table 1(D)). The tensile moduli of the VC-A30 biomaterials were similar to donor 1 at low frequencies (<3 rad/s–Figure 6), but VC-A30 moduli increased with increased frequency while donor moduli remained relatively constant across all frequencies.
FIGURE 6.

Tensile modulus trends of the frequency sweep performed on 10 × 5 mm2 rectangular samples of human vessels and biomaterial samples (VC-A30 and silicone). Mean and SD (error bars) were recorded for each point, n = 6
3.5 |. Hardness results
Hardness was graphed as compressive modulus versus percentage compression prior to sample damage (Figure 7). Donor 1 hardness modulus was 5200 kPa at 79% compression. Donors 2 and 3 hardness modulus was 2600 kPa at 82% compression and 2400 kPa at 75% compression, respectively. Donor 1 was not statistically different from VC-A30-30A (−2.44% difference, p value of .796). Neither VC-A30–40A nor VC-A30-layered were statistically different from donors 2 and 3, with <16% difference (p values: .485–.610–Table 2(A)). Silicone was statistically different from all donors (−50.1% to −77.1% difference, p values <.05).
FIGURE 7.

Hardness determination via modulus and percent strain of human vessels and biomaterial samples (VC-A30 and silicone) at sample fracture from 10 N of force applied with a 5 mm ball indenter. Mean and SD (error bars) were recorded for each point, n = 3
TABLE 2.
Destructive testing–comparison of biomaterials to donor tissues, with % difference (% diff.) and corresponding p-values
| VC-A30-30A | VC-A30-40A | VC-A30-layered | Silicone | |||||
|---|---|---|---|---|---|---|---|---|
| % diff. | p value | % diff. | p value | % diff. | p value | % diff. | p value | |
| (A) Hardness moduli | ||||||||
| Donor 1 | 2.44 | .796 | 48.2 | .001 | 47.0 | .002 | −77.1 | <.001 |
| Donor 2 | −100 | .002 | −6.35 | .610 | −8.82 | .498 | −52.9 | .004 |
| Donor 3 | −112 | .009 | −12.6 | .555 | −15.2 | .485 | −50.1 | .048 |
| (B) Radial force | ||||||||
| Donor 1 | −318 | .001 | −335 | .023 | −378 | .001 | −5570 | .003 |
| Donor 2 | −11,500 | <.001 | −12,000 | .002 | −13,200.0 | <.001 | −157,000 | <.001 |
| Donor 3 | −169 | .020 | −180 | .110 | −208 | .009 | −3550 | .003 |
| (C) Lubricity | ||||||||
| Donor 1 | 26.2 | <.001 | 15.3 | <.001 | 28.6 | <.001 | 64.5 | <.001 |
| Donor 2 | 3.93 | <.001 | −10.3 | <.001 | 7.05 | <.001 | 53.8 | <.001 |
| Donor 3 | 17.6 | <.001 | 5.39 | <.001 | 20.2 | <.001 | 60.4 | <.001 |
| (D) Compliance | ||||||||
| Donor 1 | −202 | <.001 | −202 | <.001 | −3.77 | .793 | 38.4 | .249 |
| Donor 2 | 27.3 | .070 | 27.3 | .074 | 75.0 | <.001 | 85.2 | <.001 |
| Donor 3 | −102 | .002 | −102 | .003 | 30.4 | .077 | 58.7 | .041 |
3.5.1 |. Radial force flat plate results
All donor vessel samples had significantly lower resistance to radial force than the biomaterial samples (all p values <.02–Table 2(B)). Donor 2 (keto-acidosis patient) had the softest vessels, with radial force measurements at least 115× lower than the biomaterial samples. However, all three VC-A30 samples had radial force measurements of only 169%–378% difference compared to donor 1 and 2, whereas silicone was over 3550% different than donor 1 and 2 (Figure 8).
FIGURE 8.

Radial force flat plate test at 50% compression of human vessels and biomaterial tube samples (VC-A30 and silicone). Mean and SD (error bars) were recorded for each displayed value, n = 3
3.5.2 |. Lubricity results
The rheometer frictional pull test resulted in a highly sensitive test, with 100 force measurements taken per trial. Results showed that the donor vessels exhibited a coefficient of friction range of 0.36–0.47 under simulated catheter tracking in a PBS fluid bath at 22°C (Figure 9). All VC-A30 biomaterials were comparable to all three donors, ranging from −10.3% to 28.6% difference. Although these results were considered comparable and highly significant, they are statistically different due to the t-test result from the large sample size (p values: <.001–Table 2(C)). The silicone samples had a much higher percentage difference of 53.8%–64.5%.
FIGURE 9.

Coefficient of friction of human vessels and biomaterial tube samples (VC-A30 and silicone) measured with a microcatheter dragged along the vessel lumen with a 0.091 N normal force. Mean and SD (error bars) were recorded for each displayed value, n = 100
3.5.3 |. Compliance results
Donor vessel compliance ranged from 0.0065 to 0.0015 cm3/mmHg due to the observed anatomical variances in the donor tissue types (from keto-acidosis to moderate atherosclerosis–Figure 10). Donor 1 was not statistically different from VC-A30-layered (3.77% difference, p value .793). One or more donor vessel samples were not considered statistically different from each VC-A30 biomaterial, with a percentage difference range of 27.3%–30.4% (p values: .070–.077, Table 2(D)). The silicone sample was not statistically different from donor 1 (p value = .249); however, the percentage difference was high (38.4%).
FIGURE 10.
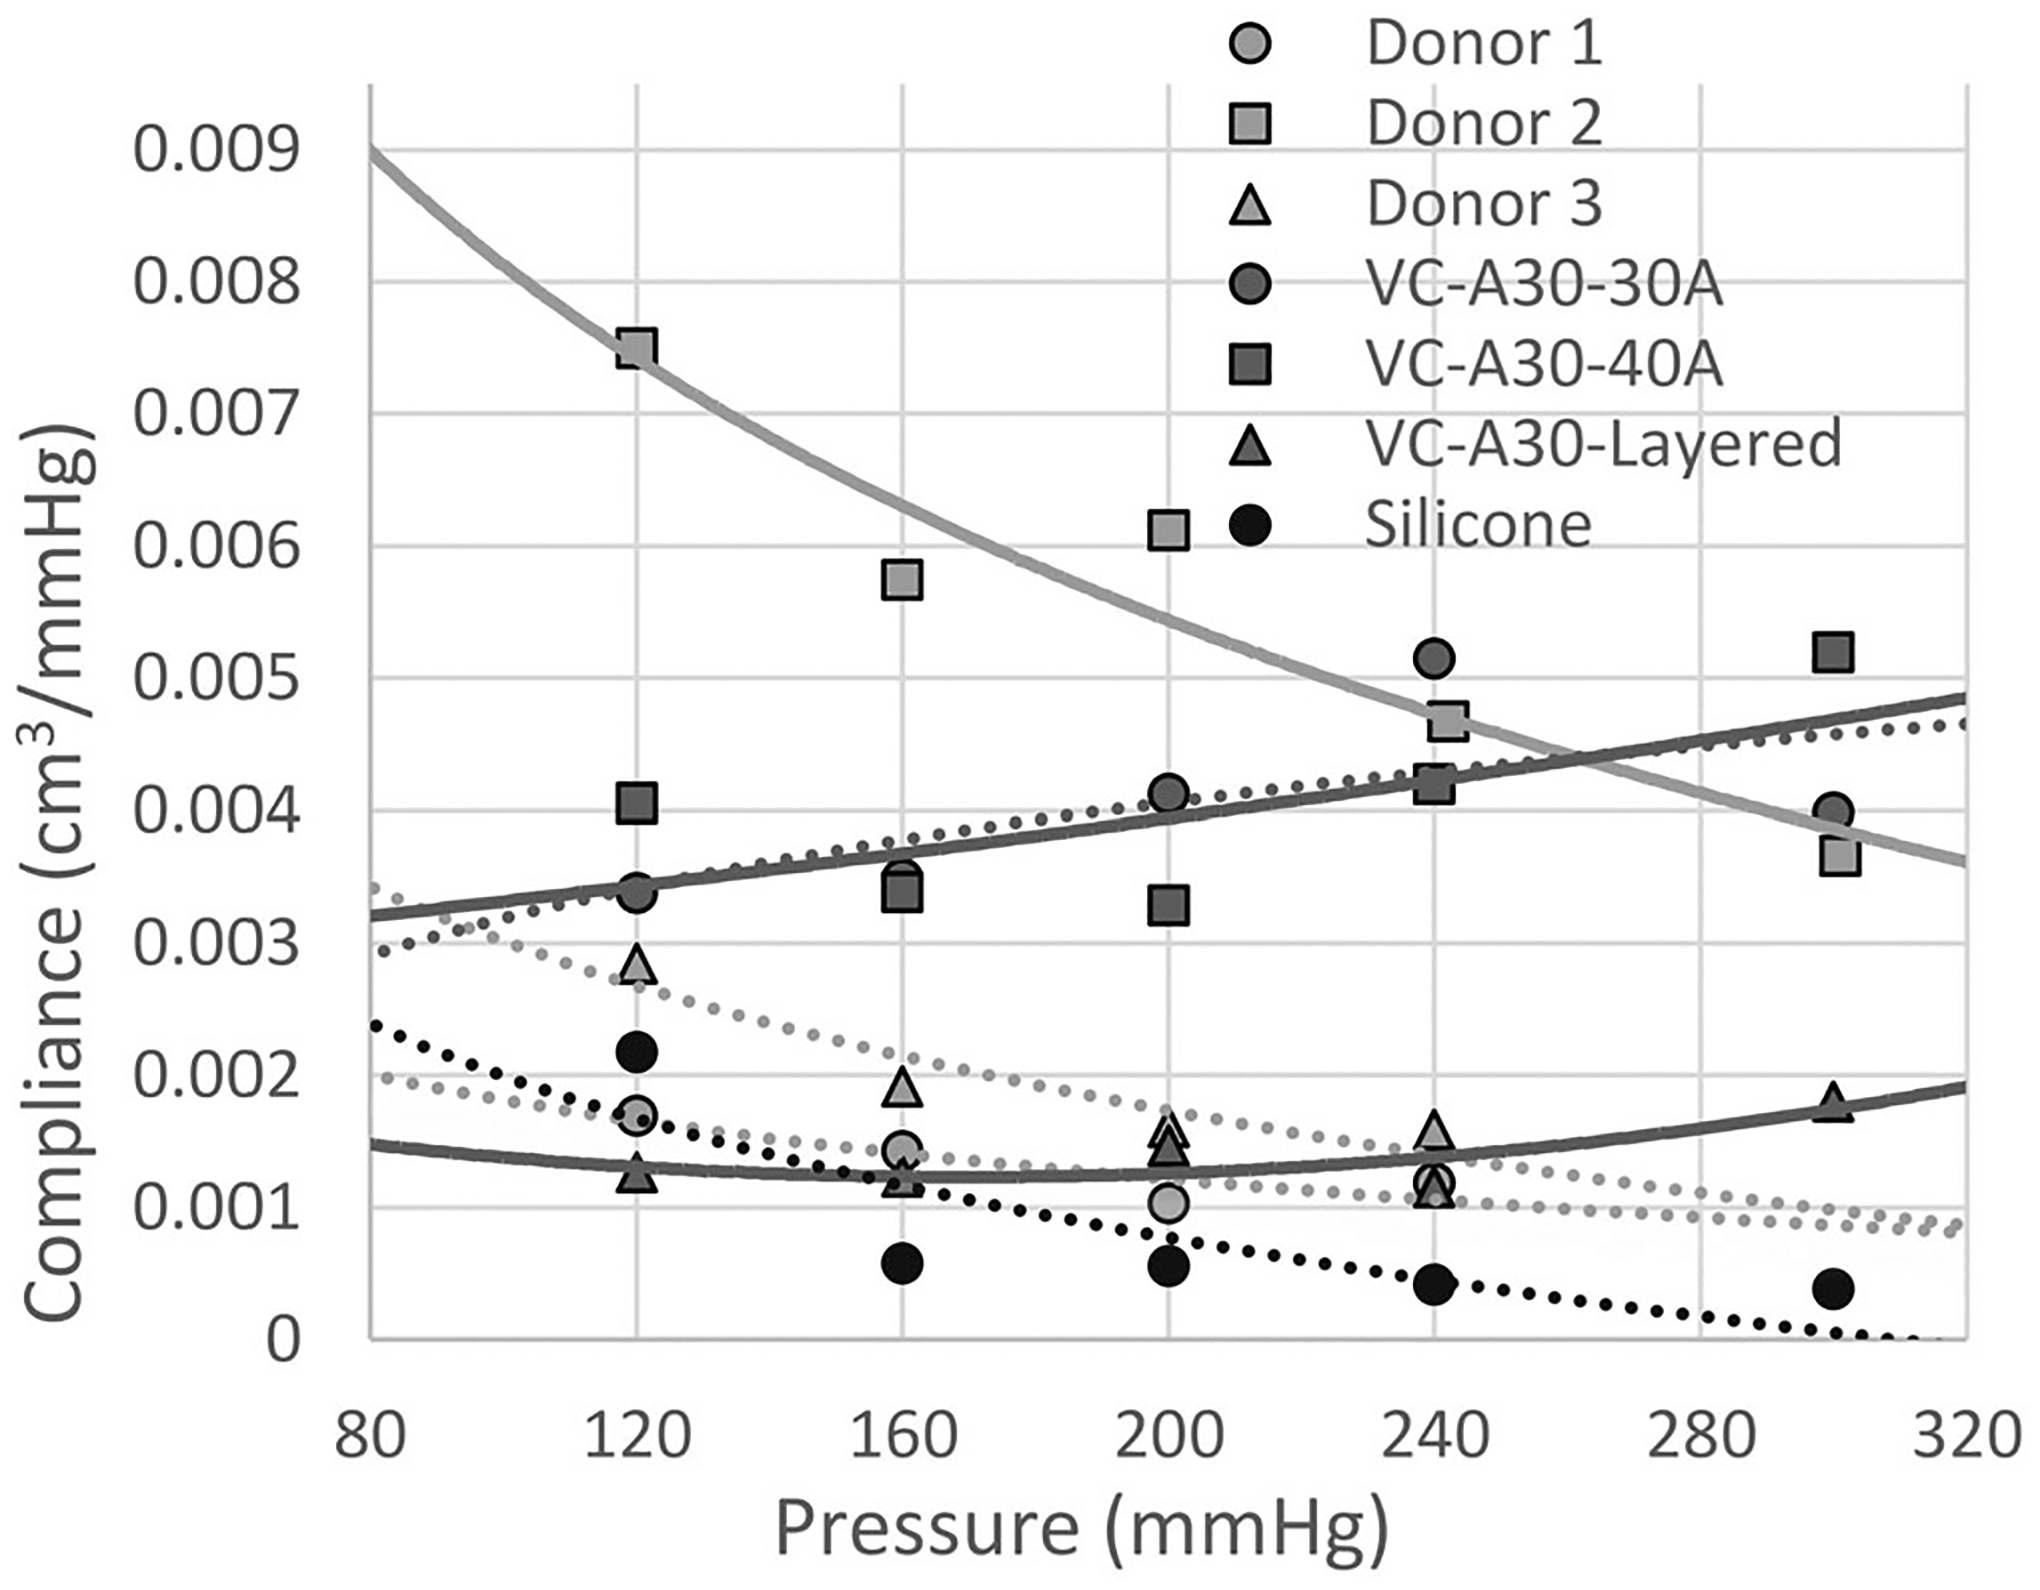
Compliance (ΔV/ΔP) of human vessels and biomaterial tube samples (VC-A30 and silicone). Means were recorded for each displayed value, n = 6
3.5.4 |. Histological analysis of donor samples
H&E stains of the donor vessels were used to identify potential EL damage (Figure 11A–C), and MT stains were used to identify potential ECM damage (Figure 11D–F). The histological analysis showed that the donor samples that underwent the four nondestructive test methods (Figure 11B,E) resembled the untested control samples (Figure 11A,D) with little or no identified damage to the ECM and EL. However, ECM damage (tearing of the ECM) and EL disruption (loss of the cellular monolayer) was identified on the hardness tested donor samples (Figure 11C,F). Although slight disruptions of the elastic lamellae can arise from the tissue sectioning process, damage at the cellular level was not evident in the control and nondestructive tests. In contrast, lamellae disruptions and cellular damage were prevalent in the hardness tests.
FIGURE 11.

(A) H&E control showing undamaged EL. (B) H&E nondestructively tested sample with undamaged EL. (C) H&E destructively tested sample (hardness) with heavily damaged EL. (D) MT control showing undamaged ECM. (E) MT nondestructively tested sample with undamaged ECM. (F) MT destructively tested sample (hardness) with heavily damaged ECM. ECM, extracellular matrix; EL, endothelial layer; H&E, hematoxylin and eosin; MT, Masson’s trichrome
4 |. DISCUSSION
This study set out to investigate the feasibility of VC-A30 3D-print materials for in vitro neurovascular modeling. The human CCA data acquired is valuable, even though neurovascular complications such as intracranial aneurysms occur in a wide range of age groups and ethnicities. The average ages of patients in neurovascular clinical studies are typically 55 or older.29–31 The human tissues samples in this study were among the typical age range, varying from 60 to 80 years old. Results showed that the VC-A30-30A and VC-A30-Layered samples displayed notably similar results in five of eight mechanical tests (within 30% difference) when compared to unfixed human carotid vessels. VC-A30–40A displayed notably similar results in four of eight mechanical tests (within 27% difference) when compared to unfixed human carotid vessels. (Tables 1 and 2). In addition, VC-A30 material properties can be adjusted with 3D-print layering and post-manufacture submersion in a fluid bath. The research also verified that four of eight mechanical tests were nondestructive to the human vessel samples through histological analysis. These methods allow for the performance of multiple tests on the same sample, thereby requiring less human tissue to be acquired, excised, prepared, and tested.
Histological stain intensity between slides was consistent, and control vessel samples resembled the nondestructively tested vessel samples in all three human donors. In contrast, the destructive hardness test exhibited tissue layer, ECM, and EL damage. The provided representation of these control and tested vessel samples in Figure 11 are from donor 3. The combination of both lamellae and cellular disruption in the hardness tests, but not in the control or nondestructive tests, provides a clear verification of the destructive versus nondestructive material testing protocols.
Implementing these nondestructive test methods notably decreased the amount of donor tissue needed to conduct vascular mechanical characterization. Thereby improving the efficiency of the testing procedures and allowing the completion of all mechanical tests within 5 days post-mortem and within 12 h of removing the first human donor samples from their refrigerated (unfrozen) and unfixed state.
Biomaterial analogs were submerged in PBS, as this is common for use in a benchtop fluid flow model to simulate the human blood vessel environment without inducing biohazard or shelf life concerns typical when using blood or blood components. The PBS step resulted in “softening” of the biomaterial and a similar performance to human vessel tissue. Although long-term performance tests are not complete, this study did not identify changes in properties and performance after 4 days. Many options exist for in vitro model fluids, but the use of PBS for testing lead to the recommendation of PBS for use in the final in vitro flow model.
The latest 3D-printer capabilities utilized in this study can replicate slight structural variations and tortuosity of the neurovasculature and replicate most vessel mechanical properties. In addition, these model prints can be adjusted or “tuned” to replicate human vascular properties that range from soft and compliant to stiff and atherosclerotic. In comparison, the silicone vessel phantom showed notable mechanical similarities in only two of eight mechanical tests, with a higher overall percentage difference (38% difference or less–Tables 1 and 2). The observed polymers, as expected, do not follow the same graphical trends as human vasculature. However, isolating physiological frequency ranges and matching vascular properties at these set frequencies would help improve current in vitro testing limitations.
Destructive test methods reveal maximal mechanical properties, such as hardness and fracture strengths. However, nondestructive methods help us understand cyclic stresses and fatigue effects within physiologically relevant conditions. These tests also require fewer samples, are cost-effective, and can provide statistically significant results. Results show that shear and tensile moduli are often an order of magnitude higher than human vessel samples, which may ultimately improve biomaterial sample long-term integrity. However, adjusting material properties to a safety factor of 1–2X maximal physiological ranges, one can avoid over engineering of material properties such as radial force, hardness, compliance, and lubricity—all of which are significantly higher for silicone models than for VC-A30, when compared to human vessel samples. In addition, live vascular tissue is in a state of constant repair, so in vitro models must exhibit fatigue resistance for use in long-term studies. Thus, an opportunity exists to optimize in vitro models to replicate the material property “feel” of tissue while retaining maximal fatigue resistance.
Although it is still difficult to interpret and compare results from other studies, as there are numerous methods of assessing tissue properties, the reported results support the use of VC-A30 for creating in vitro vessel models with complex anatomical tortuosity and representative mechanical properties of human vessels.11 As seen from the three human donor tissues, vessel mechanical properties vary significantly from donor to donor due to donor-specific anatomical and pathological conditions. Future studies will further investigate multiple layering (two or more layers) and varying the thicknesses of layers to create vessel models tuned to replicate specific human vascular conditions or diseases states. This new line of models could bolster the comprehensive study of disease states not easily replicated in animals and reduce further dependencies on animal studies.
ACKNOWLEDGMENTS
We want to thank Aubry Funke and Ronald Allen of the NAU’s Institutional Histology Core Facility (IHCF) for their assistance with preparing the histology slides. Funding for this project was provided by a research grant from the Brain Aneurysm Foundation (BAF) and support by Aneuvas Technologies, Inc. (ATI). Timothy A. Becker PhD has a financial interest in ATI, and Nicholas Norris is employed by ATI, which manufactures medical devices for endovascular treatments. However, Northern Arizona University has no commercial collaboration with ATI in producing, distributing, or marketing any medical devices or flow models.
Funding information
Brain Aneurysm Foundation, Grant/Award Number: 2018 BAF Research Grant Award; Aneuvas Technologies, Inc. (ATI)
DATA AVAILABILITY STATEMENT
The data that support the findings of this study are available from the corresponding author upon reasonable request.
REFERENCES
- 1.Itagaki MW. Using 3D printed models for planning and guidance during endovascular intervention: a technical advance. Diagn Interv Radiol. 2015;21:338–341. [DOI] [PMC free article] [PubMed] [Google Scholar]
- 2.Torres I, De Luccia N. Artificial vascular models for endovascular training (3D printing). Innovative Surg Sci. 2020;3:225–234. [DOI] [PMC free article] [PubMed] [Google Scholar]
- 3.Nagassa RG, McMenamin PG, Adams JW, Quayle MR, Rosenfeld JV. Advanced 3D printed model of middle cerebral artery aneurysms for neurosurgery simulation. 3D Print Med. 2019;5(1). 10.1186/s41205-019-0048-9 [DOI] [PMC free article] [PubMed] [Google Scholar]
- 4.Ploch CC, Mansi CSSA, Jayamohan J, Kuhl E. Using 3D printing to create personalized brain models for neurosurgical training and preoperative planning. World Neurosurg. 2016;90:668–674. 10.1016/j.wneu.2016.02.081 [DOI] [PubMed] [Google Scholar]
- 5.Rehder R, Abd-El-Barr M, Hooten K, Weinstock P, Madsen JR, Cohen AR. The role of simulation in neurosurgery. Childs Nerv Syst. 2016;32:43–54. [DOI] [PubMed] [Google Scholar]
- 6.Weinstock P, Rehder R, Prabhu SP, Forbes PW, Roussin CJ, Cohen AR. Creation of a novel simulator for minimally invasive neurosurgery: fusion of 3D printing and special effects. J Neurosurg Pediatr. 2017;20:1–9. [DOI] [PubMed] [Google Scholar]
- 7.Govsa F, Yagdi T, Ozer MA, Eraslan C, Alagoz AK. Building 3D anatomical model of coiling of the internal carotid artery derived from CT angiographic data. Eur Arch Oto-Rhino-Laryngol. 2017;274:1097–1102. [DOI] [PubMed] [Google Scholar]
- 8.Kono K, Shintani A, Okada H, Terada T. Preoperative simulations of endovascular treatment for a cerebral aneurysm using a patient-specific vascular silicone model. Neurol Med Chir (Tokyo). 2013;53:347–351. [DOI] [PubMed] [Google Scholar]
- 9.Gao BL, Wang YL, Zhang XJ, Fan QY, Hao WL, Zhang DH. Construction of an in vivo carotid siphon model for testing endovascular devices for neuro-interventions. Interv Neuroradiol. 2017; 23:325–329. [DOI] [PMC free article] [PubMed] [Google Scholar]
- 10.Makaloski V, Rohlffs F, Spanos K, Debus S, Tsilimparis N, Kölbel T. Bubble counter for measurement of air bubbles during thoracic stent-graft deployment in a flow model. J Surg Res. 2018;232:121–127. [DOI] [PubMed] [Google Scholar]
- 11.Griffin M, Premakumar Y, Seifalian A, Butler PE, Szarko M. Biomechanical characterization of human soft tissues using indentation and tensile testing. J Vis Exp. 2016;118. 10.3791/54872 [DOI] [PMC free article] [PubMed] [Google Scholar]
- 12.Geoghegan PH, Buchmann NA, Soria J, Jermy MC. Time-resolved PIV measurements of the flow field in a stenosed, compliant arterial model. ExpFluids. 2013;54(5). 10.1007/s00348-013-1528-0 [DOI] [Google Scholar]
- 13.Geoghegan PH, Jermy MC, Nobes DS. A piv comparison of the flow field and wall shear stress in rigid and compliant models of healthy carotid arteries. J Mech Med Biol. 2017;17(03):1750041. 10.1142/s0219519417500415 [DOI] [Google Scholar]
- 14.Sandmann J, Müschenich FS, Riabikin A, Kramer M, Wiesmann M, Nikoubashman O. Can silicone models replace animal models in hands-on training for endovascular stroke therapy? Interv Neuroradiol. 2019;25:397–402. [DOI] [PMC free article] [PubMed] [Google Scholar]
- 15.Mafeld S, Nesbitt C, McCaslin J, et al. Three-dimensional (3D) printed endovascular simulation models: a feasibility study. Ann Transl Med. 2017;5:1–8. [DOI] [PMC free article] [PubMed] [Google Scholar]
- 16.Li C, Cheung TF, Fan VC, Sin KM, Wong CWY, Leung GKK. Applications of three-dimensional printing in surgery. Surg Innov. 2017;24:82–88. [DOI] [PubMed] [Google Scholar]
- 17.Berijanian MM. Estimation of hepatic tumors respiratory motion using learning algorithms and surrogates. 2018.
- 18.Magistrale L Three-dimensional printing of a multi-material model of the knee joint. 2019.
- 19.Campelo S, Subashi E, Meltsner SG, Chang Z, Chino J, Craciunescu O. Multimaterial three-dimensional printing in brachytherapy: prototyping teaching tools for interstitial and intracavitary procedures in cervical cancers. Brachytherapy. 2020;19:767–776. [DOI] [PMC free article] [PubMed] [Google Scholar]
- 20.Stratasys. PolyJet 3D printers systems and materials overview. 2018; 1–10. https://www.stratasys.com/-/media/files/printer-spec-sheets/polyjet-3d-printers-systems-materials-spec-sheet.pdf
- 21.Chen G, Zhou S, Gu G, Wu L. Modification of colloidal silica on the mechanical properties of acrylic based polyurethane/silica composites. Colloids Surf A Physicochem Eng Asp. 2007;296:29–36. [Google Scholar]
- 22.Zheng P, Li L, Hu X, Zhao X. Sol-gel transition of methylcellulose in phosphate buffer saline solutions. J Polym Sci Part B Polym Phys. 2004;42:1849–1860. [Google Scholar]
- 23.Monson KL, Barbaro NM, Manley GT. Biaxial response of passive human cerebral arteries. Ann Biomed Eng. 2008;36:2028–2041. [DOI] [PMC free article] [PubMed] [Google Scholar]
- 24.Kamenskiy AV, Dzenis YA, Kazmi SAJ, et al. Biaxial mechanical properties of the human thoracic and abdominal aorta, common carotid, subclavian, renal and common iliac arteries. Biomech Model Mechanobiol. 2014;13:1341–1359. [DOI] [PubMed] [Google Scholar]
- 25.Wagner HP, Humphrey JD. Differential passive and active biaxial mechanical behaviors of muscular and elastic arteries: basilar versus common carotid. J Biomech Eng. 2011;133:1–11. [DOI] [PubMed] [Google Scholar]
- 26.Merritt W, Holter AM, Beahm S, et al. Quantifying the mechanical and histological properties of thrombus analog made from human blood for the creation of synthetic thrombus for thrombectomy device testing. J Neurointerv Surg. 2018;10(12):1168–1173. 10.1136/neurintsurg-2017-013675 [DOI] [PMC free article] [PubMed] [Google Scholar]
- 27.Duerig TW, Pelton AR. An overview of superelastic stent design. Mater Sci Forum. 2002;394–395:1–8. [Google Scholar]
- 28.Krischek Ö, Miloslavski E, Fischer S, Shrivastava S, Henkes H. A comparison of functional and physical properties of self-expanding intracranial stents [Neuroform3, wingspan, solitaire, Leo(+), Enterprise]. Minim Invasive Neurosurg. 2011;54:21–28. [DOI] [PubMed] [Google Scholar]
- 29.Lee G-J, Eom K-S, Lee C, Kim D-W, Kang S-D. Rupture of very small intracranial aneurysms: incidence and clinical characteristics. J Cerebrovasc Endovasc Neurosurg. 2015;17:217. [DOI] [PMC free article] [PubMed] [Google Scholar]
- 30.Lubicz B, Klisch J, Gauvrit JY, et al. WEB-DL endovascular treatment of wide-neck bifurcation aneurysms: short- and midterm results in a European study. Am J Neuroradiol. 2014;35:432–438. [DOI] [PMC free article] [PubMed] [Google Scholar]
- 31.Gillani RL, Podraza KM, Luthra N, Origitano TC, Schneck MJ. Factors Influencing the management of unruptured intracranial aneurysms. Cureus. 2016. 10.7759/cureus.601 [DOI] [PMC free article] [PubMed] [Google Scholar]
Associated Data
This section collects any data citations, data availability statements, or supplementary materials included in this article.
Data Availability Statement
The data that support the findings of this study are available from the corresponding author upon reasonable request.