Abstract
Studies of genome regulation routinely use high-throughput DNA sequencing approaches to determine where specific proteins interact with DNA, and they rely on DNA amplification and short-read sequencing, limiting their quantitative application in complex genomic regions. To address these limitations, we developed Directed Methylation with Long-read sequencing (DiMeLo-seq), which uses antibody-tethered enzymes to methylate DNA near a target protein’s binding sites in situ. These exogenous methylation marks are then detected simultaneously with endogenous CpG methylation on unamplified DNA using long-read, single-molecule sequencing technologies. We optimized and benchmarked DiMeLo-seq by mapping chromatin-binding proteins and histone modifications across the human genome. Furthermore, we identified where centromere protein A (CENP-A) localizes within highly repetitive regions that we re unmappable with short sequencing reads, and we estimated the density of CENP-A molecules along single chromatin fibers. DiMeLo-seq is a versatile method that provides multimodal, genome-wide information for investigating protein-DNA interactions.
Introduction
Genomic DNA needs to be decoded and maintained by proteins that read, regulate, replicate, recombine, and repair it. Mapping where and how proteins interact with DNA can provide key insights into how they function or malfunction in healthy and diseased cells. Several powerful approaches have been developed to map where individual target proteins interact with DNA genome-wide, including DamID, ChIP-seq, CUT&RUN, and their derivatives 1–6. These approaches involve selectively amplifying short DNA fragments from regions bound by a particular protein of interest, determining the sequence of those DNA molecules using next generation sequencing (NGS), and mapping those sequences back to a reference genome, using sequencing coverage as a measure of protein-DNA interaction frequency. While these methods have proven to be extremely useful for studying DNA-binding proteins and chromatin modifications 7, they suffer from several limitations.
Firstly, the process of DNA amplification fails to copy DNA modification information, e.g., methylation and oxidation, from the native DNA molecules to the amplified and sequenced library DNA. This prevents simultaneous measurement of protein-DNA interactions and DNA modifications and limits the amount of information that can be gleaned about the relationship between these regulatory elements. Secondly, amplification-based enrichment methods often rely on PCR, and have intrinsic biases. Therefore, the sequencing coverage produced by these techniques provides only a semi-quantitative readout of protein-DNA interaction frequencies.
Furthermore, these approaches rely on digesting or shearing DNA into short fragments for enrichment, followed by NGS, which produces short sequencing reads typically under 250 bp in length. Short fragment lengths are often necessary for achieving adequate binding site resolution with these techniques.Although it is possible to map multiple protein-DNA interactions on short reads 8, shearing the DNA into short fragments can destroy joint long-range binding information, and it hinders the ability to phase reads to measure haplotype-specific protein-DNA interactions. Additionally, repetitive regions of the human genome have presented a major challenge for genome assembly and mapping methods due to the difficulty of unambiguously assigning short DNA sequencing reads to their unique positions in the genome. These limitations hinder our ability to address lingering biological questions about the roles of repetitive sequences in cell division, protein synthesis, aging, and genome regulation.
These limitations underline the need for protein-DNA interaction mapping methods that fully leverage the power of long-read, single-molecule sequencing technologies, including their ability to interrogate assembled repetitive regions9 and to read out DNA modifications directly. To address this need, we developed Directed Methylation with Long-read sequencing (DiMeLo-seq; from dímelo, pronounced DEE-meh-low). DiMeLo-seq provides the ability to map protein-DNA interactions with high resolution on native, long, single, sequenced DNA molecules, while simultaneously measuring endogenous DNA modifications and sequence variation. These features provide an opportunity to study genome regulation in unprecedented ways. Recent technologies have begun to take advantage of long-read sequencing to identify accessible regions and CpG methylation on native single molecules, but they cannot directly target specific protein-DNA interactions 10–14. Here we extend these capabilities to map specific regulatory elements and demonstrate the advantages of DiMeLo-seq by mapping lamina-associated domains, CTCF binding sites, histone modifications/variants, and CpG methylation across the genome including complex repetitive domains.
Results
1. DiMeLo-seq workflow
DiMeLo-seq combines elements of antibody-directed protein-DNA mapping approaches 6,15,16 to deposit methylation marks near a specific target protein, then uses long-read sequencing to read out these exogenous methylation marks directly 10–14. Taking advantage of the low abundance of N6-methyl-deoxyadenosine (hereafter mA) in human DNA 17, we fused the antibody-binding Protein A to the nonspecific deoxyadenosine methyltransferase Hia5 11,18 (pA-Hia5) to catalyze the formation of mA in the DNA proximal to targeted chromatin-associated proteins (Fig. 1a). First, nuclei are permeabilized, primary antibodies are bound to the protein of interest, and any unbound antibody is washed away. Next, pA-Hia5 is bound to the antibody, and any unbound pA-Hia5 is washed away. The nuclei are then incubated in a buffer containing the methyl donor S-adenosyl methionine (SAM) to activate adenine methylation in the vicinity of the protein of interest 16. Finally, genomic DNA is isolated and sequenced using modification-sensitive, long-read sequencing with mA basecalls providing a readout of the sites of protein-DNA interactions (Fig. 1a, Supplementary Fig. 1). This approach provides a distinct advantage in the ability to detect multiple binding events by the target protein on each long, single DNA molecule, which would not be possible with short-read sequencing (Fig. 1b). This protocol also avoids amplification biases, enabling improved estimation of absolute protein-DNA interaction frequencies at each site in the genome across a population of cells (Fig. 1c). Modification-sensitive readout allows for the simultaneous detection of both exogenous antibody-directed adenine methylation and endogenous CpG methylation on single molecules (Fig. 1d). Additionally, DiMeLo-seq’s long sequencing reads often overlap multiple heterozygous sites, enabling phasing and measurement of haplotype-specific protein-DNA interactions (Fig 1e). Finally, long reads enable mapping of protein-DNA interactions within highly repetitive regions of the genome (Fig. 1f).
Figure 1. Genome-wide mapping of protein-DNA interactions with DiMeLo-seq.
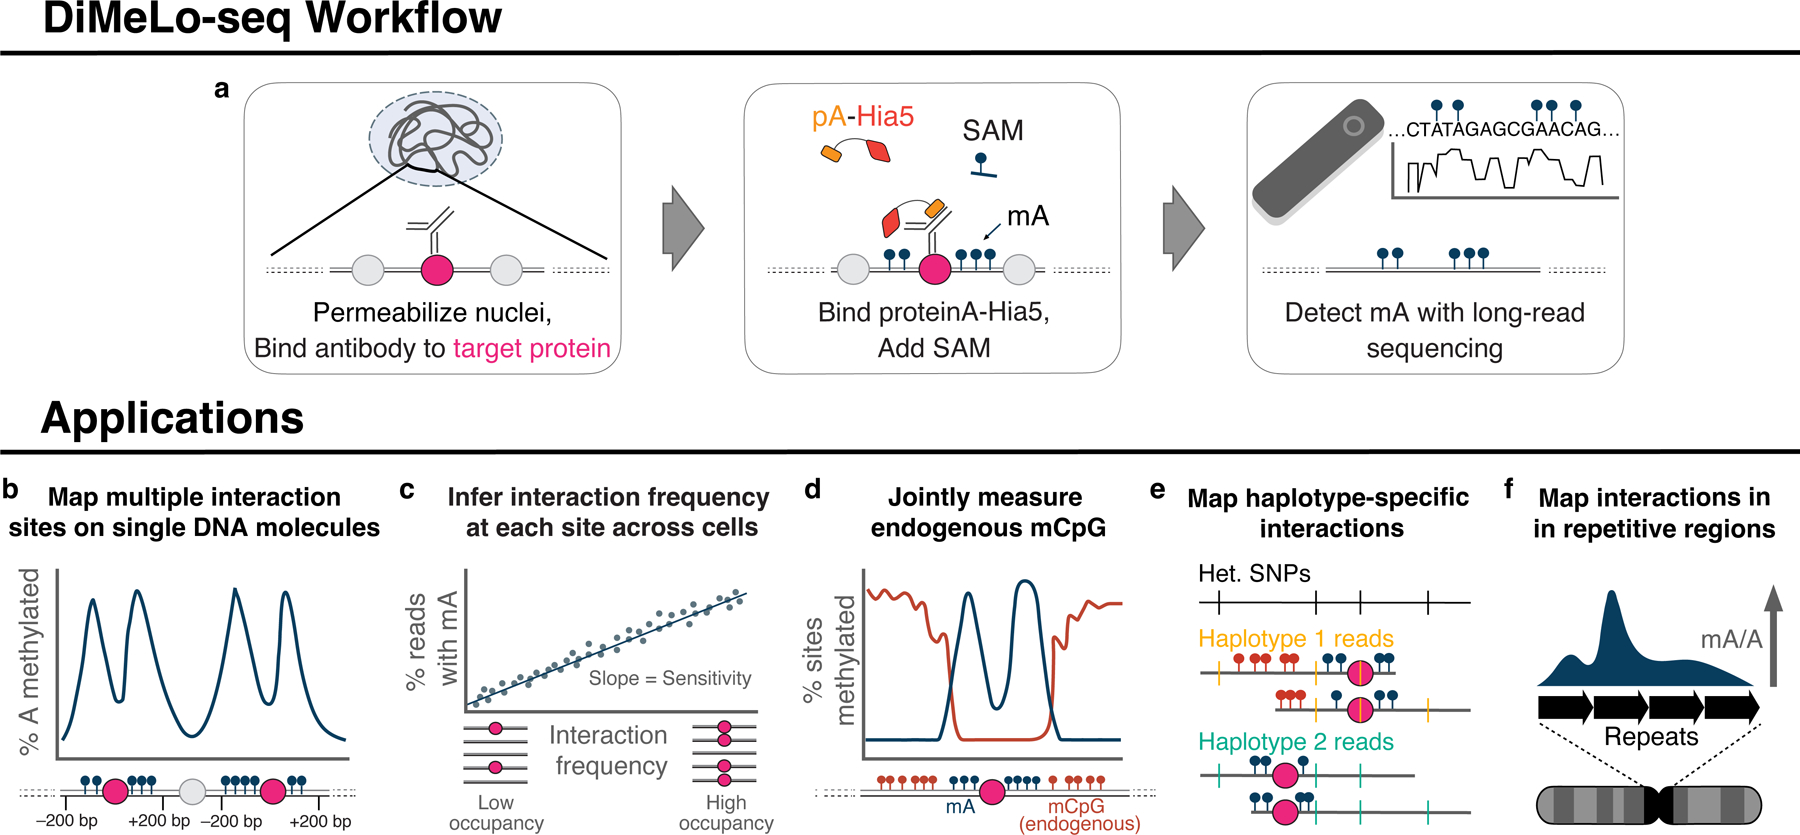
a, Schematic of the DiMeLo-seq workflow for mapping protein-DNA interactions b-f DiMeLo-seq can be used to map multiple interaction sites for a protein of interest on each chromatin fiber (b), estimate protein-DNA interaction frequencies (c), study the joint relationship between endogenous DNA methylation and protein binding (d), study genetic or epigenetic effects on protein binding between parental haplotypes (e), map protein-DNA interactions across repetitive regions (f).
2. Antibody-directed histone-specific DNA adenine methylation of reconstituted chromatin in vitro
We expressed and purified recombinant pA-Hia5 and tested its methylation activity on purified DNA using the methylation-sensitive restriction enzyme DpnI, which only cuts GATC sites when adenine is methylated. DNA incubated with Hia5, pA-Hia5, or Protein A/G Hia5 (pAG-Hia5) in the presence of SAM became sensitive to DpnI digestion, confirming the methyltransferase activity of the purified fusion proteins (Supplementary Note 1, Extended Data Fig. 1a,b). To test the ability of pA-Hia5 to target chromatin and methylate accessible DNA in vitro, we reconstituted chromatin containing the histone variant CENP-A using the nucleosome-positioning DNA sequence referred to as “601” 19 (Extended Data Fig. 1c,d, Supplementary Note 2). Incubating mononucleosomes together with free-floating pA-Hia5 and SAM, followed by long-read sequencing and methylation-sensitive basecalling, showed methylation on 97.1 ± 0.8% of reads (mean ± s.e.m., n=3) (Supplementary Notes 3,4, Fig. 2c,d, Extended Data Fig. 1e–k). Moreover, we observed almost no methylation at the expected nucleosome-protected region (Fig. 2c,d, Extended Data Fig. 1j).
Figure 2. Application of DiMeLo-seq in artificial chromatin.
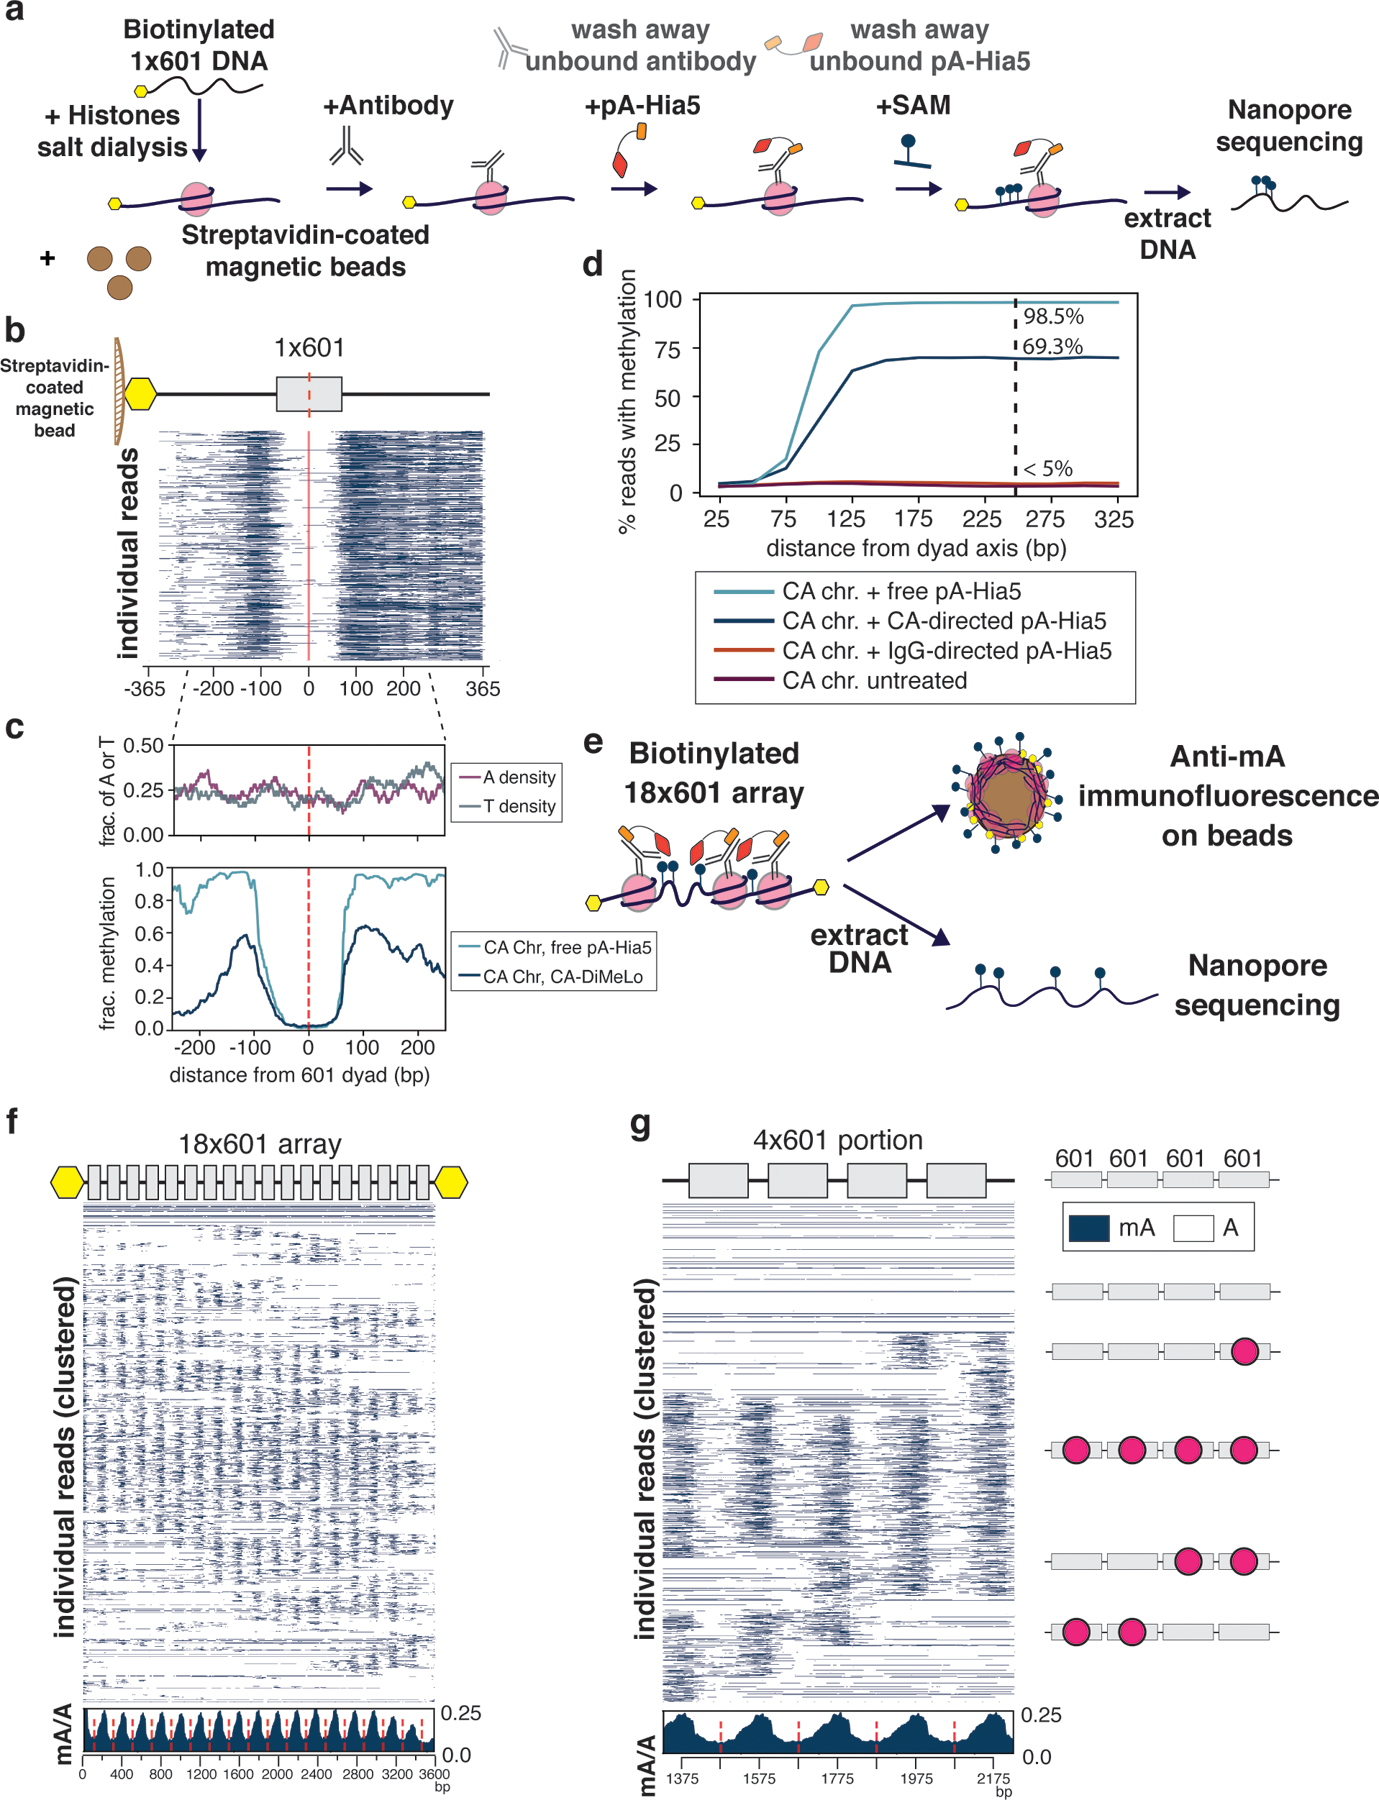
a, Schematic of antibody-directed methylation of artificial chromatin. b. Heatmap of 5000 individual 1×601 reads from chromatin containing CENP-A mononucleosomes methylated with CENP-A-directed pA-Hia5 (red dashed line indicates 601 dyad position). c, Plots of A or T density (top) and average mA/A on base position of 1×601 containing DNA (bottom) (red dashed line indicates 601 dyad position). d, Plot of percentage of reads with methylation as a function of the distance from dyad axis. e, Schematic of directed methylation of 18×601 chromatin array. f,g, Heatmap of 2000 individual reads from CENP-A chromatin methylation with CENP-A-directed pA-Hia5, hierarchically clustered by jaccard distances of inferred nucleosome positions over the entire 18×601 array (f) or a subset 4×601 region (g) along with cartoons depicting predicted nucleosome positions (red circles). Insets (below) show average mA/A on every base position of 18×601 array or 4×601 portion (red dashed line indicates 601 dyad position).
We reconstituted CENP-A chromatin on biotinylated DNA, bound it to streptavidin-coated magnetic beads, incubated it with CENP-A antibody and pA-Hia5, and washed away any unbound antibody and pA-Hia5 prior to activating methylation with SAM (Fig. 2a, Extended Data Fig. 1c). We observed methylation on 65.0 ± 10.0% of CENP-A DiMeLo-seq reads (mean ± s.e.m., n=3) (Fig. 2b–d, Extended Data Fig. 1e–h,k), with methylation levels decaying with distance from the nucleosome footprint (Fig. 2c). We observed only background levels of methylation on IgG control DiMeLo-seq reads (5.1 ± 0.6% of IgG reads, (mean ± s.e.m., n=2), compared to 4.1 ± 0.5 % of untreated reads, (mean ± s.e.m., n=3)) (Fig. 2d, Extended Data Fig. 1e,k). While reads from either free-floating pA-Hia5 or antibody-tethered pA-Hia5 conditions showed nucleosome-sized protection from methylation (~150 – 180 bp centered at the dyad, Fig. 2c,d, Extended Data Fig. 1j), ~70% of all methylation on reads from antibody-tethered pA-Hia5 fell within 250 bp on either side of the dyad. This result demonstrates that antibody- tethered pA-Hia5 can methylate accessible DNA close to target nucleosomes in vitro.
To test the specificity of DiMeLo-seq to identify target nucleosomes on chromatin fibers, we first assessed the ability of pA-Hia5 to methylate accessible regions of DNA on in vitro reconstituted chromatin assembled on an 18x array of the 601 nucleosome positioning sequence (Extended Data Fig. 2a–c). Co-incubation of chromatin together with free-floating pA-Hia5 and SAM resulted in structured patterns of oligonucleosome footprinting (Extended Data Fig. 2b,g,h), as reported previously for reconstituted chromatin incubated with another exogenous methyltransferase, EcoGII 10.
We then tested antibody-directed methylation of chromatin arrays reconstituted with either CENP-A or histone H3 containing nucleosomes. We incubated chromatin with CENP-A antibody and pA-Hia5, washed away unbound antibody, and activated methylation with SAM (Fig. 2e). Following activation, we immunostained chromatin-conjugated beads with an anti-mA antibody, demonstrating a significant increase in mA signal when CENP-A chromatin, but not H3 chromatin, was incubated with pA-Hia5 and CENP-A antibody (Extended Data Fig. 2d,e, Supplementary Note 5), indicating antibody-directed methylation. Long-read sequencing detected mA on DNA after CENP-A-directed methylation of CENP-A chromatin (but not H3 chromatin) (Extended Data Fig. 2f). On average, CENP-A-directed methylation of CENP-A chromatin was depleted at the central axis of the nucleosome where the 601 sequence positions the nucleosome dyad (Fig. 2f,g). On individual reads, we observed protection from methylation centered at 601 dyad positions, consistent with nucleosome occupancy protecting the DNA from antibody-directed methylation (Fig. 2f,g) and similar to the free pA-Hia5 condition (Extended Data Fig. 2g,h). In contrast to the free pA-Hia5 condition, for which we observed a high prevalence of methylation on any region not protected by nucleosomes, in the antibody-directed pA-Hia5 condition, we observed ~4-fold lower average probability of methylation (Fig. 2f (inset), Extended Data Fig. 2g (inset)), consistent with the expectation that tethering of pA-Hia5 produces preferential methylation of deoxyadenosines closest to the antibody-bound nucleosome. Despite this reduction in total methylation of accessible DNA in CENP-A DiMeLo-seq reads compared to free pA-Hia5 treated reads, we detect a similar distribution of nucleosome densities in our chromatin array population (Extended Data Fig. 2i). We observed similar results for H3-antibody-directed methylation of H3 chromatin using pAG-Hia5 (Extended Data Fig. 2j–l). We conclude that directing pA-Hia5 activity using a histone-specific antibody targets specific methylation in proximity to the nucleosome of interest in vitro.
3. Optimization of LMNB1 mapping in situ
We next optimized DiMeLo-seq for mapping protein-DNA interactions in situ in permeabilized nuclei from a human cell line (HEK293T). To do this, we mapped the interaction sites of lamin B1 (LMNB1), which is often targeted in DamID studies to profile lamina associated domains (LADs) 20. Large regions of the genome that are almost always in contact with the nuclear lamina across cell types are called constitutive lamina associated domains (cLADs). Regions that are rarely in contact with the nuclear lamina across cell types and instead reside in the nuclear interior are called constitutive inter-LADs (ciLADs) (Fig. 3a). Other regions can vary in their lamina contact frequency between cell types and/or between cells of the same type. We chose LMNB1 as an initial target because (i) cLADs and ciLADs provide well-characterized on-target and off-target control regions, respectively; (ii) LMNB1 has a very large binding footprint (LADs have a median size of 500 kb and cover roughly 30% of the genome 21), so DNA-LMNB1 interactions can be detected even with very low sequencing coverage; (iii) LMNB1 localization at the nuclear lamina can be easily visualized by immunofluorescence, allowing for intermediate quality control using microscopy during each step of the protocol (Extended Data Fig. 3c,d); and (iv) we have previously generated LMNB1 DamID data from HEK293T cells using bulk and single-cell protocols, providing ample reference materials 22.
Figure 3. Optimization of DiMeLo-seq targeting Lamin B1 in situ.
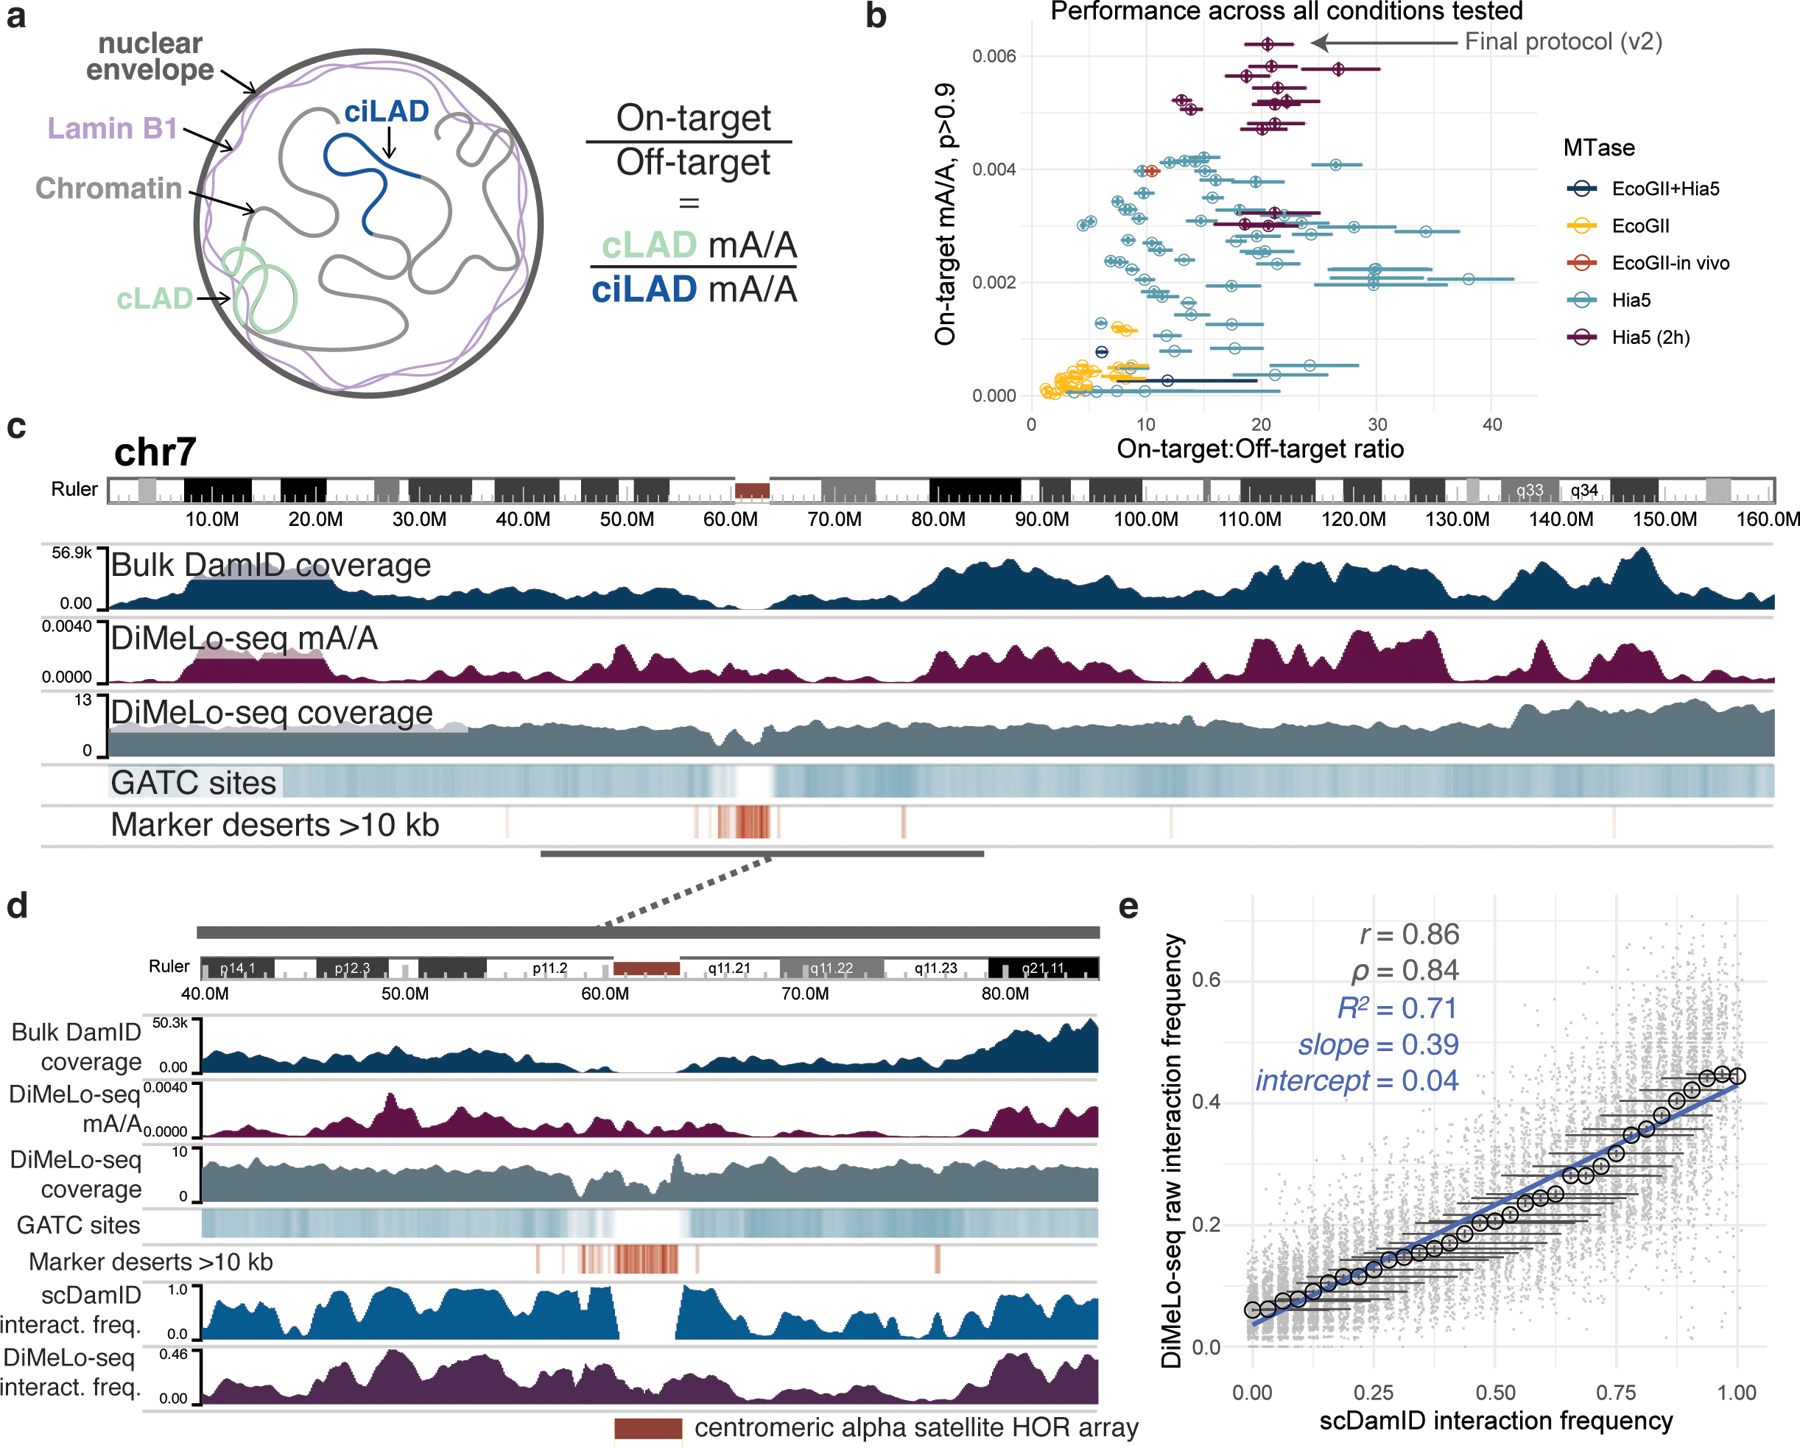
a, Schematic of interactions between LMNB1 and lamina-associated domains, and the use of mA levels in cLADs and ciLADs to estimate on-target and off-target mA. b, Scatterplot of each protocol condition tested the proportion (y-axis) of all A bases (basecalling q>10, n = min 1.4M, max 28M A bases per condition) called as methylated (stringent threshold p>0.9; abbreviated mA/A) across all reads in on-target (cLAD) regions and the ratio (x axis) of these mA levels compared to off-target (ciLAD) regions. Circles are colored by the methyltransferase condition used. Error bars provide a measure of uncertainty due to each condition’s sequencing coverage (described below). Complete data are in Supplementary Table 1. c, A browser image across all of chromosome 7 comparing in situ LMNB1-targeted DiMeLo-seq (protocol v1) to in vivo LMNB1-tethered DamID data (blue) 22. The coverage of each region by simulated DpnI digestion fragments (splitting reference at GATC sites) between 150 and 750 bp (sequenceable range) is indicated by a teal heatmap track (range 0 to 0.7). The presence of intervals longer than 10 kb between unique 51-mers in the reference, a measure of mappability, is indicated with an orange heatmap track. d, A zoom-in view of the centromere on chr7, with added tracks at the bottom illustrating LMNB1 interaction frequencies from single-cell DamID data 22, as well as from DiMeLo-seq data (protocol v1). e, For a quality-filtered set of 100 kb genomic bins (gray points, Supplementary Note 7, n = 11292 total bins), a comparison of LMNB1 interaction frequency estimates from DiMeLo-seq (protocol v1; black circles indicate mean across n = 94 to 663 genomic bins, computed for each genomic bin as the prop. of n = 61 to 335 overlapping reads with at least 1 mA call with p>0.9) versus scDamID (prop. of n = 32 cells with detected interactions in each genomic bin). A linear regression line computed across all bins is overlaid (blue). Error bars in (b) and (e) represent 95% credible intervals determined for each proportion, mean of proportions, or ratio of proportions by sampling from posterior beta distributions computed using uninformative priors.
To assess the performance of the LMNB1-targeted DiMeLo-seq protocol, we quantified the proportion of adenines that were called as methylated across all reads mapping to cLADs (on-target regions), and across all reads mapping to ciLADs (off-target regions). We evaluated the performance of each iteration of the protocol using both the on-target methylation rate (as a proxy for sensitivity) and the on-target:off-target ratio (as a proxy for signal-to-background), aiming to increase both. We developed a rapid pipeline for testing variations of many components of the protocol, allowing us to go from harvested cells to fully analyzed data in under 60 hours (Methods and Supplementary Notes 6–8). With this optimization pipeline, we tested over 100 different conditions (Fig. 3b), varying the following: methyltransferase type (Hia5 vs. EcoGII), input cell numbers, detergents, primary antibody concentrations, the use of secondary antibodies, enzyme concentrations, incubation temperatures, methylation incubation times, methylation buffers, and SAM concentrations (Supplementary Note 8, Supplementary Table 1). We validated an initial version of the protocol (v1(https://dx.doi.org/10.17504/protocols.io.bv8tn9wn), and then further optimized the methyltransferase activation conditions to increase the amount of on-target methylation 50–60% without sacrificing specificity (v2 (https://dx.doi.org/10.17504/protocols.io.b2u8qezw); see Extended Data Fig. 3–4, Supplementary Note 8, and Fig. 3b). To confirm that this optimization would apply to other types of proteins, we also examined the results of different protocol variations targeting the protein CTCF and found them to be concordant (Extended Data Fig. 5a).
We also verified that there is very little loss of performance when using cells that were cryopreserved in DMSO-containing media or lightly fixed in paraformaldehyde, when using between 1–5 million cells per replicate, or when using concanavalin-A coated magnetic beads to carry out cell washing steps by magnetic separation instead of centrifugation (Methods, Supplementary Notes 9–10, Supplementary Table 1). To confirm antibody specificity, we performed IgG isotype controls and free-floating Hia5 controls to measure nonspecific methylation and DNA accessibility, respectively (Methods, Supplementary Table 2). We also generated a stably transduced line expressing a direct fusion between EcoGII and LMNB1 in vivo, as in MadID 23, then we detected mAs with nanopore sequencing (Extended Data Fig. 4a and Supplementary Note 10). This in vivo approach produced threefold more on-target methylation compared to in situ DiMeLo-seq with pAG-EcoGII (Fig. 3b), though this performance is expected to vary with different fusion proteins and their expression levels (Supplementary Note 10).
We found that DiMeLo-seq and conventional bulk DamID are highly concordant in the non-repetitive parts of the genome (Spearman correlation = 0.71 in 1 Mb bins), but conventional DamID achieves little-to-no coverage across pericentromeric regions (Fig. 3c). This is due in part to the low availability of unique sequence markers to map short reads to in the pericentromere, but also to the low frequency of GATC (the binding motif for Dam and DpnI in the DamID protocol) within centromeric repeats (Fig. 3c) 23. DiMeLo-seq, unlike DamID, produces long reads that can be uniquely mapped across the centromeric region of chromosome 7, revealing that this region has an intermediate level of contact with the nuclear lamina (Fig. 3c,d).
Because DiMeLo-seq directly probes unamplified genomic DNA, each sequencing read represents a single, native DNA molecule from a single cell, sampled independently and with near-uniform probability from the population of cells. This allows for estimation of absolute protein-DNA interaction frequencies, i.e. the proportion of cells in which a site is bound by the target protein, without needing to account for the amplification bias inherent to other protein-DNA mapping methods. We leveraged single-cell Dam-LMNB1 DamID data from the same cell line 22 to assess the relationship between DiMeLo-seq methylation and an orthogonal estimate of protein-DNA interaction frequencies. This revealed a nearly linear relationship between the two interaction frequency estimates, with a simple linear model achieving an R2 of 0.71, compared to an R2 of 0.31 when scDamID-based interaction frequencies are compared to bulk conventional DamID coverage (Fig. 3e, Extended Data Fig. 4f). We note that scDamID tends to slightly overestimate intermediate interaction frequencies compared to DiMeLo-seq, attributable to the in vivo vs. in situ nature of the two protocols 16, as well as to the fact that homolog-specific information is collapsed within each hypotriploid HEK293T cell 22,24. This analysis demonstrates that DiMeLo-seq is capable of estimating absolute protein-DNA interaction frequencies without needing to account for amplification bias, while capturing heterogeneity in protein-DNA interactions at the single-cell level.
4. Joint analysis of CTCF binding and CpG methylation on single molecules
DiMeLo-seq measures protein-DNA interactions in the context of the local chromatin environment by simultaneously detecting endogenous CpG methylation, nucleosome occupancy, and protein binding. To highlight this feature of DiMeLo-seq, we targeted CTCF, a protein that strongly positions surrounding nucleosomes and whose binding is inhibited by CpG methylation 25. We first validated that targeted methylation is specific to CTCF in GM12878 cells by calculating the fraction of adenines that are methylated within GM12878 CTCF ChIP-seq peaks relative to the fraction of adenines methylated outside of these peaks. We chose to target CTCF in GM12878 cells because GM12878 is an ENCODE Tier 1 cell line with abundant ChIP-seq reference datasets. We measured a 16-fold increase in targeted methylation over background in our CTCF-targeted sample (Extended Data Fig. 5b). We also measured a 6-fold mA/A enrichment in the free pA-Hia5 control in CTCF ChIP-seq peaks, which reflects the fact that many CTCF binding sites overlap with accessible regions of the genome where pA-Hia5 can methylate more easily 26. However, both the free pA-Hia5 and the IgG controls produced significantly less targeted methylation than the CTCF-targeted sample (Extended Data Fig. 5b). We confirmed that signal enrichment is caused by CTCF-targeted methylation and not accessibility of CTCF sites by measuring a 1.8X greater proportion of mA in ChIP-seq peaks compared to regions of open chromatin measured by ATAC-seq (Extended Data Fig. 5c).
As further validation of DiMeLo-seq’s concordance with ChIP-seq data and to visualize protein binding on single molecules, we analyzed mA and mCpG across individual molecules spanning CTCF motifs within ChIP-seq peaks of various strengths (Fig. 4a). DiMeLo-seq signal tracks with ChIP-seq signal strength, with mA density decreasing from the top to bottom quartiles of ChIP-seq peak signal. We observed an increase in local mA surrounding the binding motif, with a periodic decay in methylation from the peak center, indicating methylation of neighboring linker DNA between strongly positioned nucleosomes (Extended Data Fig. 5d). The 88 bp dip at the center of the binding peak reflects CTCF’s binding footprint 27–29 and is evident even on single molecules. CTCF binds to ~50 bp of DNA as determined by DNase I footprinting and ChIP-exo 30–32. The larger footprint observed with DiMeLo-seq is likely due to steric hindrance with Hia5 unable to methylate DNA within ~20 bp of the physical contact between CTCF and DNA as efficiently. We also observed an asymmetric methylation profile, with stronger methylation 5’ of the CTCF motif. This increased methylation relative to 3’ of the motif extends beyond the central peak to the neighboring linker DNA. We hypothesized that this asymmetry was a result of the antibody binding the C-terminus of CTCF, thereby positioning pA-Hia5 closer to the 5’ end of the binding motif. To test this hypothesis, we compared DiMeLo-seq binding profiles in top quartile ChIP-seq peaks when using an antibody targeting the C-terminus of CTCF, as is used in Figure 4, and an antibody targeting the N-terminus of CTCF. We observed methylation enrichment 5’ to the binding motif with C-terminus targeting and 3’ to the motif with N-terminus targeting (p-value: 0.00010, Supplementary Note 11, Extended Data Fig. 5e). The free pA-Hia5 control profile supports this finding that the antibody binding site is causing the peak asymmetry, as there is no significant asymmetry in this untargeted case (Extended Data Fig. 6).
Figure 4. Single-molecule CTCF binding and CpG methylation profiles.
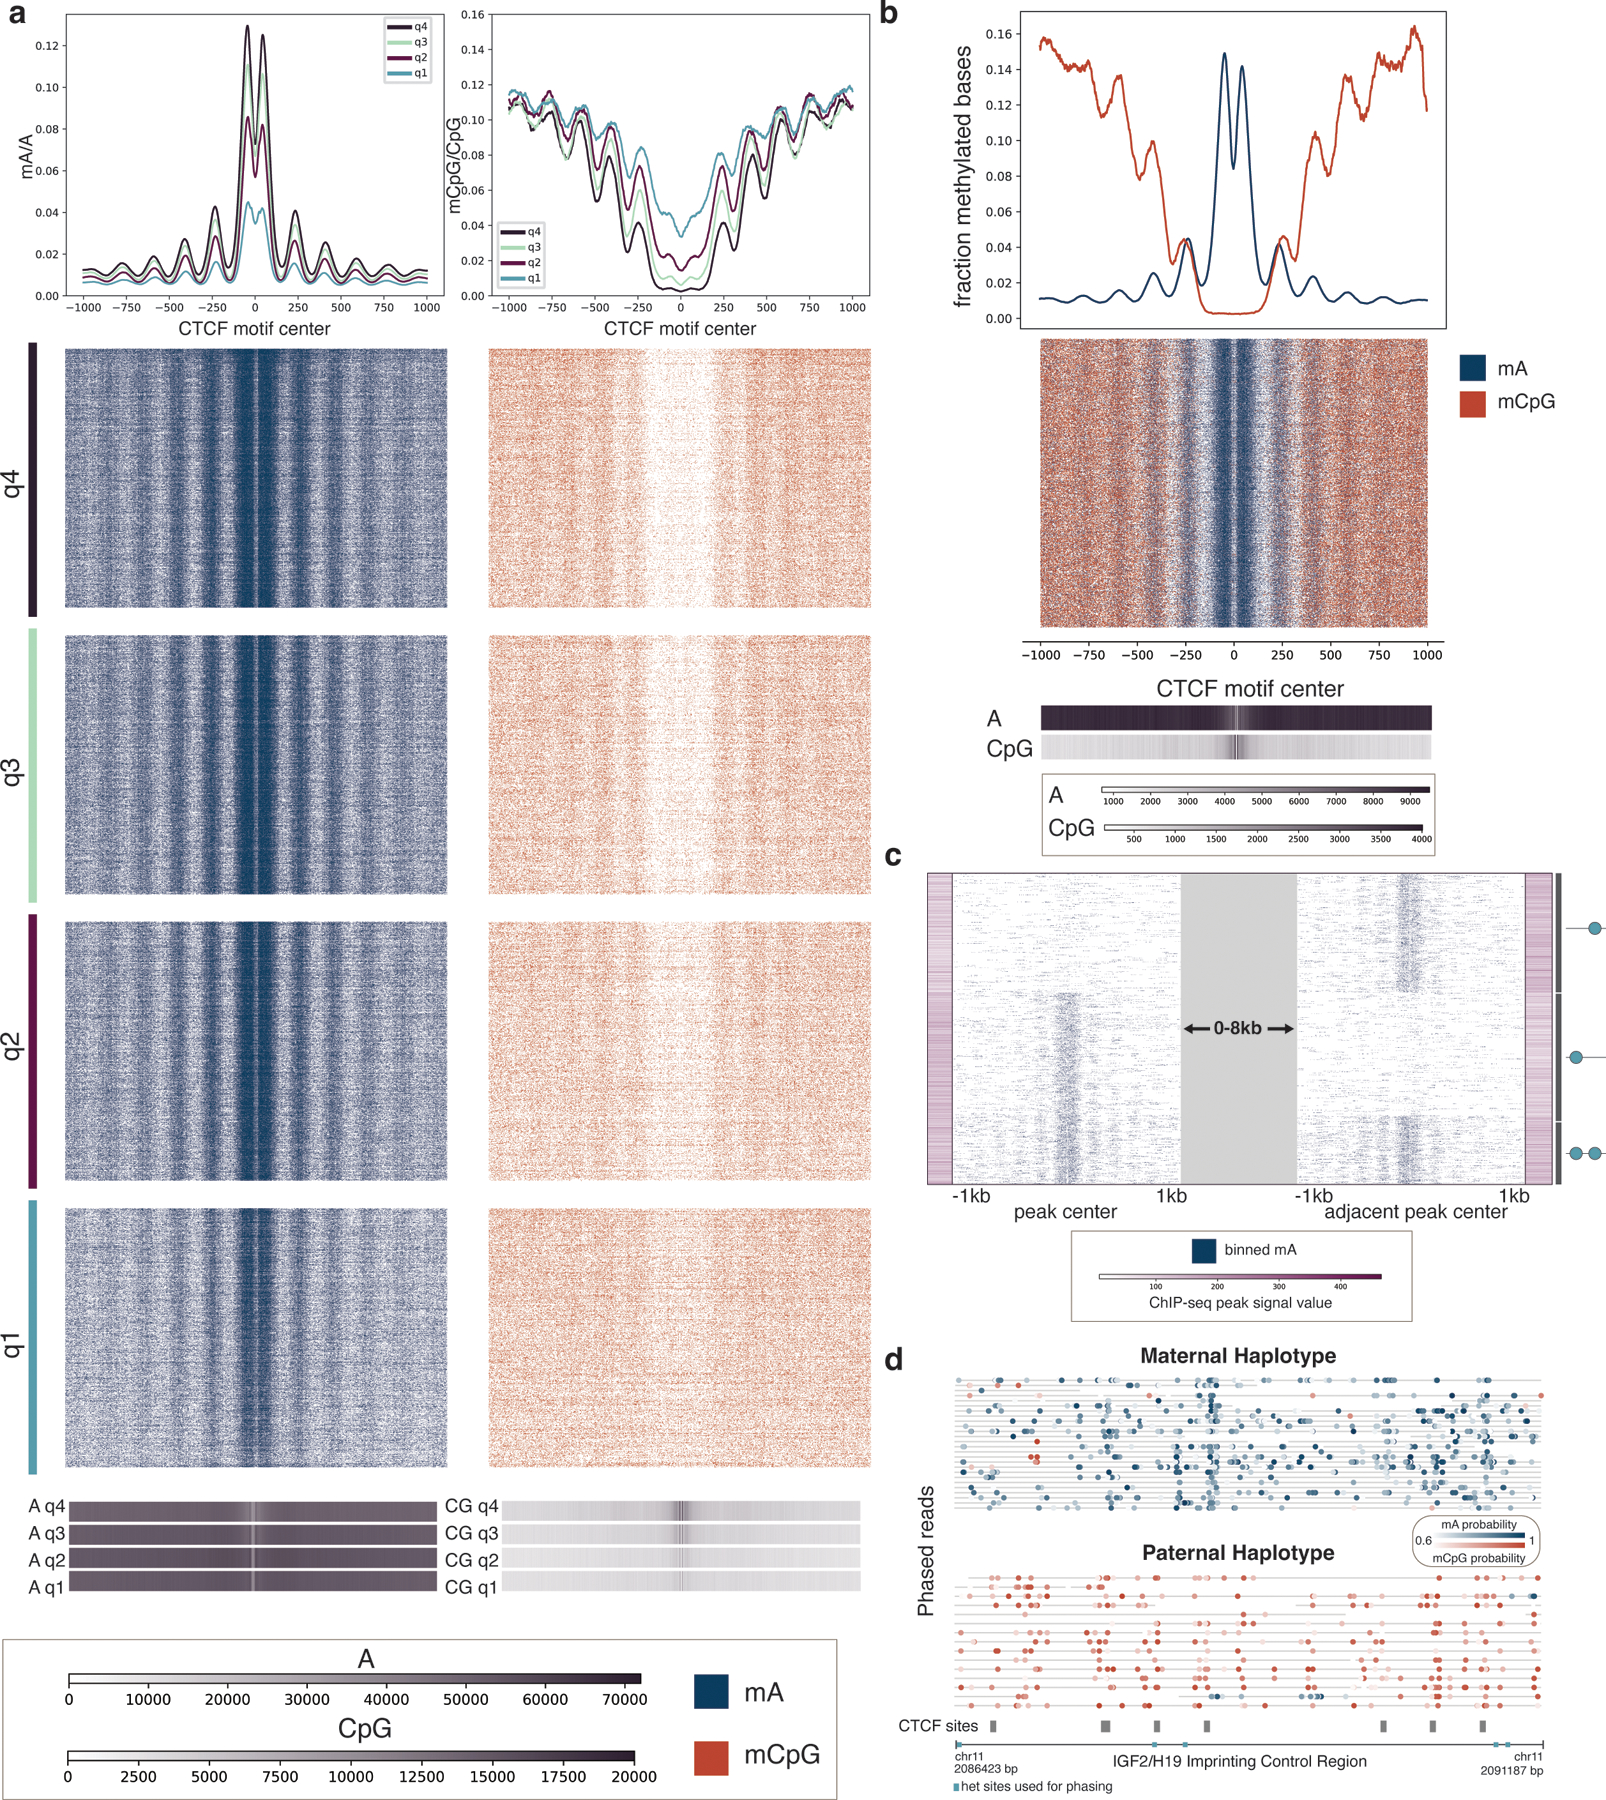
a, Single molecules spanning CTCF ChIP-seq peaks are shown across quartiles of ChIP-seq peak strength. Q4, quartile 4, are peaks with the strongest ChIP-seq peak signal, while Q1, quartile 1, are peaks with the weakest ChIP-seq peak signal. Blue show mA called with probability ≥ 0.75, while orange indicate mCpG called with probability ≥ 0.75. Aggregate curves for each quartile were created with a 50 bp rolling window. Base density across the 2 kb region for each quartile is indicated in the 1D heatmaps; the scale bar indicates the number of adenine bases and CG dinucleotides sequenced at each position relative to the motif center. b, Joint mA and mCpG calls on the same individual molecules spanning CTCF ChIP-seq peaks. Molecules displayed have at least one mA called and one mCpG called with probability ≥ 0.75. Aggregate curves were created with a 50 bp rolling window. Base density is indicated as in (a). c, CTCF site protein occupancy is measured on single molecules spanning two neighboring CTCF motifs within 2–10 kb of one another. CTCF motifs are selected from all ChIP-seq peaks, and molecules are shown that have a peak at at least one of the two motifs. Each row is a single molecule, and the molecules are anchored on the peaks that they span, with a variable distance between the peaks indicated by the grey block. ChIP-seq peak signal for each of the motif sites is indicated with the purple bars. The graphic on the side illustrates the CTCF binding pattern for each cluster. d, Phased reads across the IGF2/H19 Imprinting Control Region with CTCF sites indicated in grey. Blue dots represent mA calls and orange dots represent mCpG calls. Heterozygous sites used for phasing are indicated in turquoise.
To evaluate the use of DiMeLo-seq for de novo peak detection, we called CTCF peaks using DiMeLo-seq data alone and created ROC curves at increasing sequencing depth using ChIP-seq peaks as ground truth (Supplementary Note 11, Extended Data Fig. 5f). At ~25X coverage, we detected 60% of ChIP-seq peaks (FPR 1.6%) and measured an AUC of 0.92 (Supplementary Note 11). Among the peaks detected with DiMeLo-seq that were not annotated ChIP-seq peaks, ten percent overlapped 1 kb marker deserts and gaps in the hg38 reference and are undetectable by ChIP-seq. Another 12% of these peaks fell within 500 bp of a known CTCF motif.
We next probed the relationship between CTCF binding and endogenous CpG methylation. Single molecules spanning CTCF binding sites in stronger ChIP-seq peaks exhibited a larger dip in mCpG around the motif compared to the shallower dip in weaker ChIP-seq peaks (Fig. 4a). This inverse relationship between CpG methylation and CTCF-targeted methylation reflects previous findings that mCpG inhibits CTCF binding 25. We measured both mA and mCpG on the same single molecules and also observed that both A and CpG are preferentially methylated in linker DNA (Fig. 4b). The increased methylation of CpG in linker DNA relative to nucleosome-bound DNA surrounding CTCF sites is supported by previous studies that have similarly reported higher levels of mCpG in linker DNA than nucleosomal DNA around CTCF sites 33.
CTCF’s known binding motif and abundance genome-wide make it a good target for characterizing the resolution of DiMeLo-seq. To characterize resolution, we estimated the peak center on single molecules spanning the top decile of CTCF ChIP-seq peaks (Supplementary Note 11). The mean single-molecule peak center was 6 bp 5’ of the CTCF motif center, and the peak center on approximately 70% of the reads fell within +/− 200 bp of the motif center (Extended Data Fig. 5g). This systematic bias towards predicting the peak center 5’ of the motif can be explained by the observed asymmetry in methylation when targeting the C-terminus of CTCF. Another factor that impacts the resolution of DiMeLo-seq is the reach of the methyltransferase, which can be characterized by measuring the decay rate of methylation density from the peak center. To do this, we fit the average adenine methylation density with respect to the motif center to an exponential function and calculated a half-life of 169 bp (Extended Data Fig. 5d). Together, this analysis suggests that DiMeLo-seq can resolve binding events to within about 200 bp; however, this metric is likely dependent on the protein target and influenced by the local chromatin environment.
To characterize the sensitivity of DiMeLo-seq for detecting CTCF binding events on single molecules, we performed a binary classification of individual CTCF-targeted DiMeLo-seq reads based on each read’s proportion of methylated adenines within CTCF peak regions, defined as +/− 150 bp around the CTCF binding motif center. For top-decile ChIP-seq peaks, which are regions that are most likely to contain CTCF binding, we classified reads containing CTCF binding events with 54% sensitivity (5.7% FPR, Extended Data Fig. 5h,i, Supplementary Note 11).
We next investigated the ability of DiMeLo-seq to measure protein binding at adjacent sites on single molecules. We first characterized CTCF occupancy across two binding sites that were spanned by a single molecule. We were able to detect neighboring CTCF motifs that are bound by CTCF at both sites or just one of the two sites, and the detected binding appears to track with ChIP-seq peak strength (Fig. 4c). This analysis demonstrates the potential of DiMeLo-seq to analyze coordinated binding patterns on long single molecules, which is not possible with short-read methods. We further investigated this potential within a specific HLA locus on chr6 where haplotype-specific SNPs within the CTCF binding motif prevent CTCF binding at one of the two neighboring sites (Extended Data Fig. 7a). DiMeLo-seq can map haplotype-specific interactions because long reads often span multiple heterozygous sites, allowing reads to be phased. Importantly, at 25X coverage, we were able to detect the binding patterns of both sites on the same single molecule and could attribute the lack of detected binding at one of the two sites to a mutation within the binding motif. The ability to map haplotype-specific interactions is also useful in studying imprinted genomic regions such as the IGF2/H19 Imprinting Control Region, where CpG methylation on the paternal allele prevents CTCF binding, while on the maternal allele, CTCF is able to bind (Fig. 4d). We also reported haplotype-specific CTCF binding profiles at specific sites and broadly across the active and inactive X chromosomes (Extended Data Fig. 7b–d). These results demonstrate that DiMeLo-seq can measure the effect of haplotype-specific genetic or epigenetic variation on protein binding.
To test the compatibility of DiMeLo-seq with other long-read sequencing platforms capable of modification calling, we performed Pacific Biosciences (PacBio) sequencing of DNA from a CTCF-targeted DiMeLo-seq sample and from an unmethylated control (Supplementary Note 12). We found similar enrichment profiles using both methods (Extended Data Fig. 8), indicating that DiMeLo-seq is compatible with PacBio’s circular consensus sequencing technique. However, while PacBio sequencing has reported improved base calling accuracy 34, this approach detected more methylation in the unmethylated control than Nanopore, slightly reducing the signal-to-noise ratio of the measurement (Extended Data Fig. 8).
5. Mapping protein-DNA interactions in centromeric regions
Mapping histone modifications in heterochromatin with DiMeLo-seq
To test DiMeLo-seq’s ability to measure protein occupancy in heterochromatic, repetitive regions of the genome we targeted H3K9me3, which is abundant in pericentric heterochromatin. We chose to target H3K9me3 in HG002 cells because the chromosome X centromere has been completely assembled for this male-derived lymphoblast line 9, and many different sequencing data types are available for it 35. To validate the specificity of targeted methylation, we calculated the fraction of adenines methylated within HG002 CUT&RUN H3K9me3 peaks 36 compared to the fraction of adenines methylated outside of broadly defined peaks (Supplementary Note 13). For H3K9me3 targeting in HG002 cells, the enrichment of mA/A in CUT&RUN peaks was 3.6-fold over background (Fig. 5a), indicating enrichment of methylation within expected H3K9me3-containing regions of the genome.
Figure 5. Detecting H3K9me3 in centromeres.
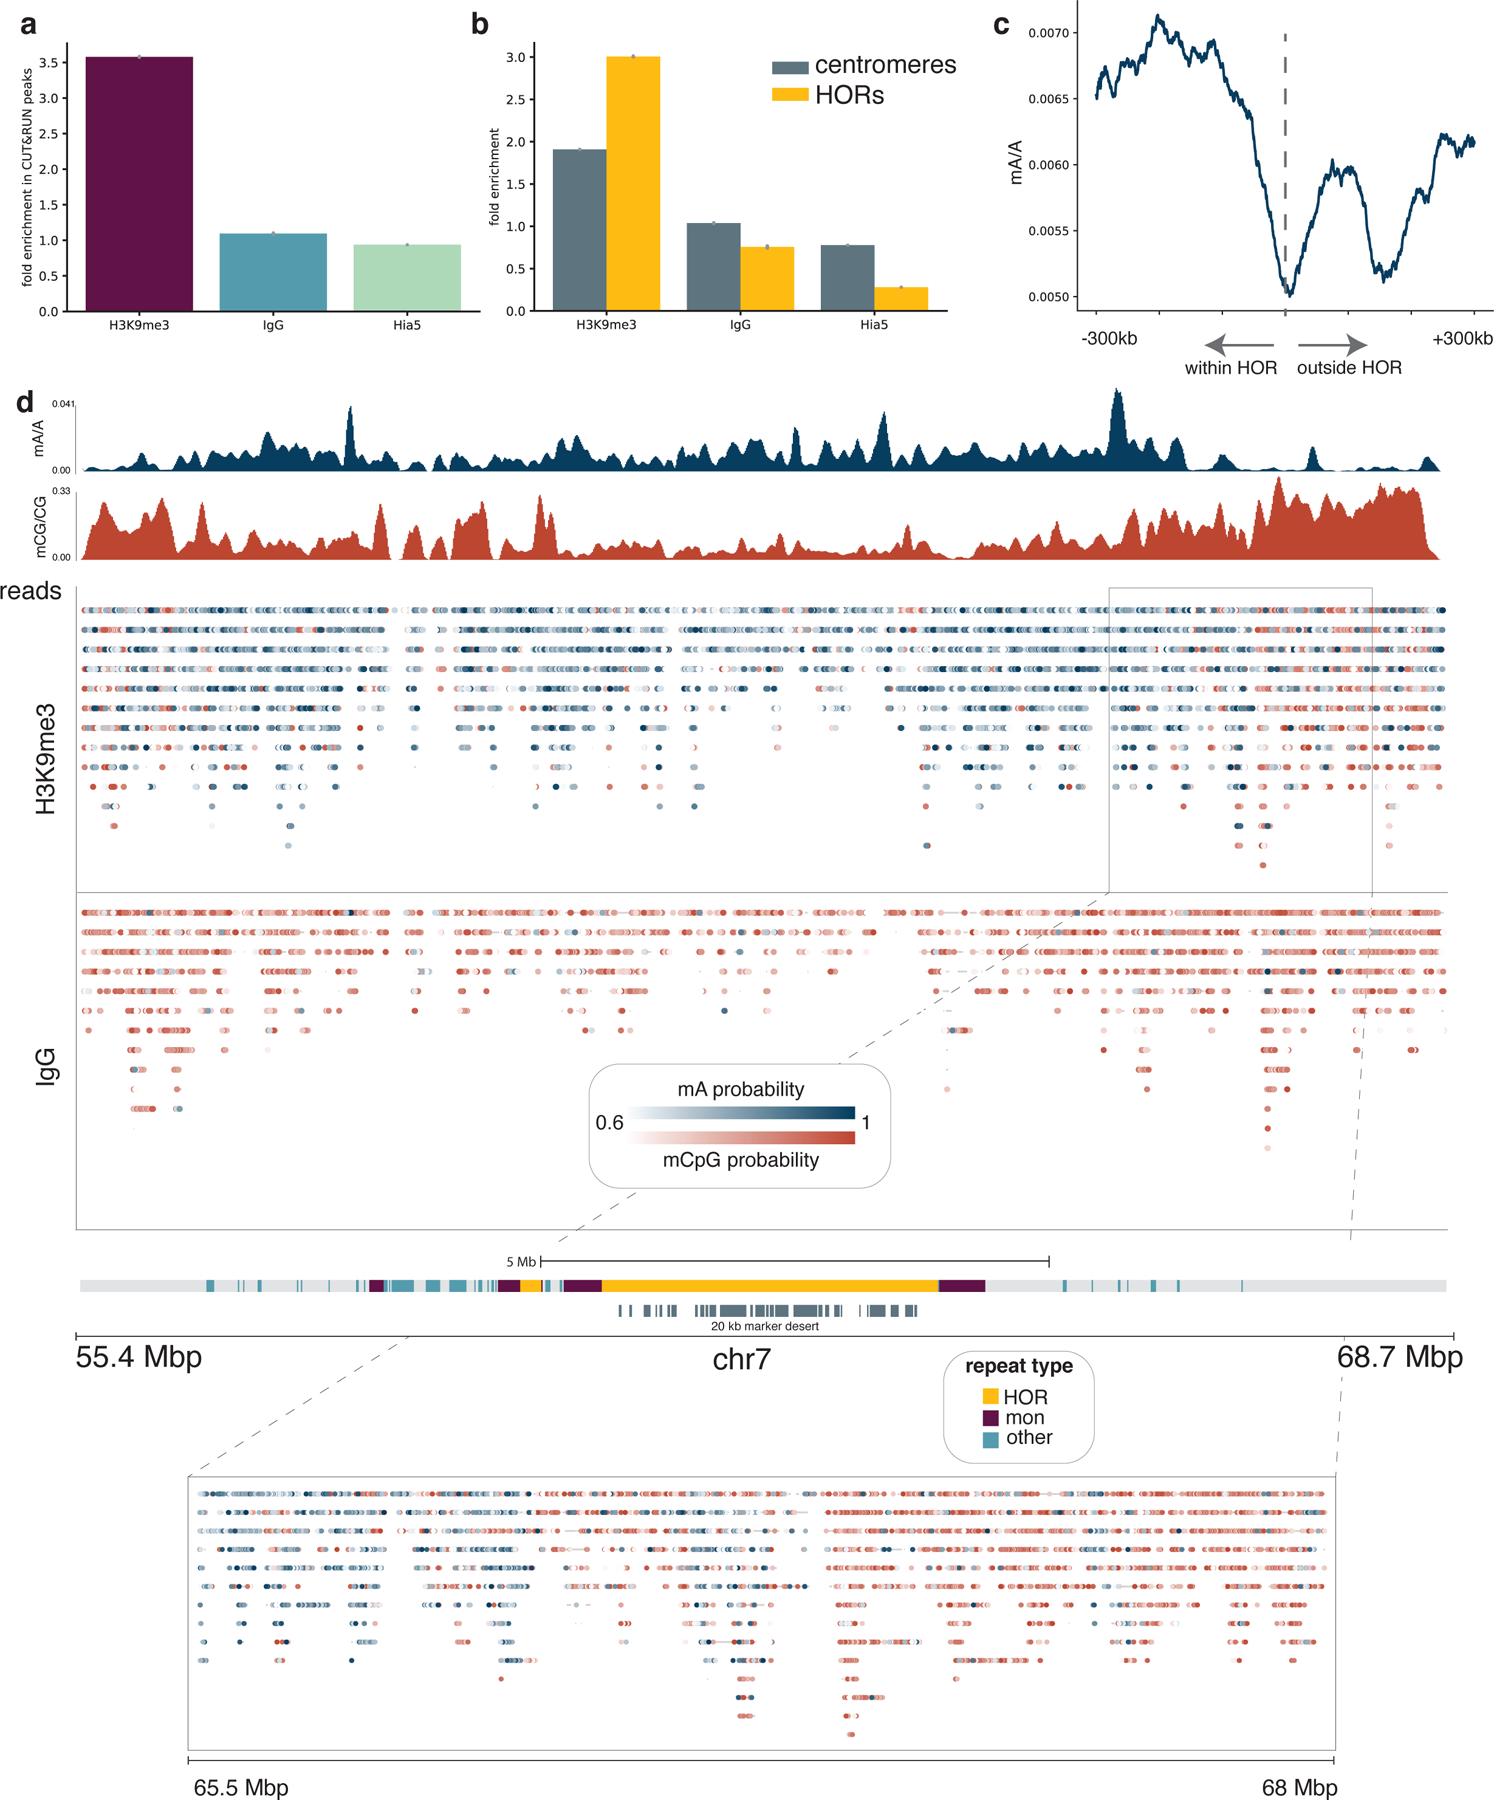
a, The proportion of adenines methylated within CUT&RUN peaks relative to the proportion of adenines methylated outside of CUT&RUN broad peak regions is reported for the H3K9me3-targeted sample as well as IgG and free pA-Hia5 controls. Error bars represent 95% credible intervals determined for each ratio by sampling from posterior beta distributions computed with uninformative priors. b, The fraction of adenines methylated within centromeres relative to non-centromeric regions, and similarly the fraction of adenines methylated within active HOR arrays relative to non-centromeric regions are displayed for the H3K9me3-targeted sample as well as the IgG and free pA-Hia5 controls. Error bars are defined as in (a). c, The decline in mA/A for the H3K9me3-targeted sample in a rolling 100 kb window from −300 kb within the HOR array to 300 kb outside of the HOR array. HOR array boundaries that transition quickly into non-repetitive sequences were considered: 1p, 2pq, 6p, 9p, 13q, 14q, 15q, 16p, 17pq, 18pq, 20p, 21q, 22q. d, Single molecules are displayed across the centromere of chromosome 7 for the H3K9me3-targeted sample and the IgG control. Reads mapping to the same position are displayed vertically, and modified bases are colored by the probability of methylation at that base for probabilities ≥ 0.6. Aggregate tracks show mA/A and mCpG/CpG in the H3K9me3-targeted sample in 10 kb bins. Grey bars below centromere annotation indicate regions with >20 kb marker deserts.
Human centromeres are located within highly repetitive alpha-satellite sequences, which are organized into higher order repeats (HORs) 36–39. To validate enrichment of H3K9me3-directed mA signal in centromeres, and in particular in HOR arrays, we similarly calculated the fold increase in mA/A and found 1.9-fold enrichment in centromeres and 3.0-fold enrichment in active (kinetochore-binding) HOR arrays 36 over non-centromeric regions (Fig. 5b). We next looked at HOR array boundaries and observed a decrease in H3K9me3 across the boundary moving from within to outside of HOR arrays (Fig. 5c). In contrast, for the free pA-Hia5 control, mA/A increases moving from within to outside of the HOR array, as chromatin becomes more accessible (Extended Data Fig. 9a) 35.
We mapped heterochromatin not only in aggregate across HOR array boundaries, but also in single molecules across the centromere. H3K9me3-targeted DiMeLo-seq reads map across the centromere of chromosome 7, even in regions with over 20 kb between unique markers (Fig. 5d). An IgG isotype control confirmed that adenine methylation in the H3K9me3-targeted sample was not caused by background methylation (Fig. 5d, Extended Data Fig. 9b). Unlike methods which rely on amplifying short DNA fragments, such as ChIP-seq and CUT&RUN, we are able to detect single-molecule heterogeneity in chromatin boundaries, as highlighted in the transition from 65.5 Mb to 68 Mbp, where H3K9me3 signal drops as CpG methylation increases (Fig. 5d). However, lower methylation efficiency in heterochromatin and the challenges of mapping even moderately long reads in repetitive regions can still lead to uneven and low coverage in these regions (Extended Data Fig. 9c). To improve sensitivity for targeted DiMeLo-seq applications in the centromere, we developed a centromere enrichment method to enhance coverage in active HOR arrays and applied this method to study CENP-A.
Restriction-based enrichment strategy improves centromere coverage
Within alpha satellite HOR arrays, the centromere-specific histone variant CENP-A delineates the site where the functional centromere and kinetochore will form. Population-level studies demonstrate that CENP-A nucleosomes are found at the core of these repeat units where the repeats are the most homogeneous 36,40–42. However, it has not been possible to resolve the positions of CENP-A nucleosomes on single chromatin fibers to determine the one-dimensional organization and density of CENP-A at centromeres. To map the positions of CENP-A nucleosomes at centromeres using DiMeLo-seq, we developed a strategy to enrich specifically for human centromeric DNA in order to avoid sequencing the entire genome.
Our enrichment strategy, called AlphaHOR-RES (alpha higher-order repeat restriction and enrichment by size; from alfajores), is based on classic centromere enrichment strategies 43 that involve digesting the genome with restriction enzymes that cut frequently outside centromeric regions but rarely inside them, then removing short DNA fragments (Methods, Extended Data Fig. 10a). We added AlphaHOR-RES to our DiMeLo-seq workflow and observed at least 20-fold enrichment of sequencing coverage at centromeres while preserving relatively long read lengths (mean ~8 kb; Fig. 6a,b, Extended Data Fig. 10b–d, Methods). Thus, this enrichment strategy significantly increases the proportion of molecules sequenced that are useful for investigating CENP-A distribution, saving substantial sequencing time and costs. Furthermore, because AlphaHOR-RES targets the DNA and not the protein in the protein-DNA interaction, and because it is performed after directed methylation is complete, it is unlikely to bias our inferences of protein-DNA interaction frequencies in these regions.
Figure 6. CENP-A-directed methylation within chromosome X centromeric higher order repeats.
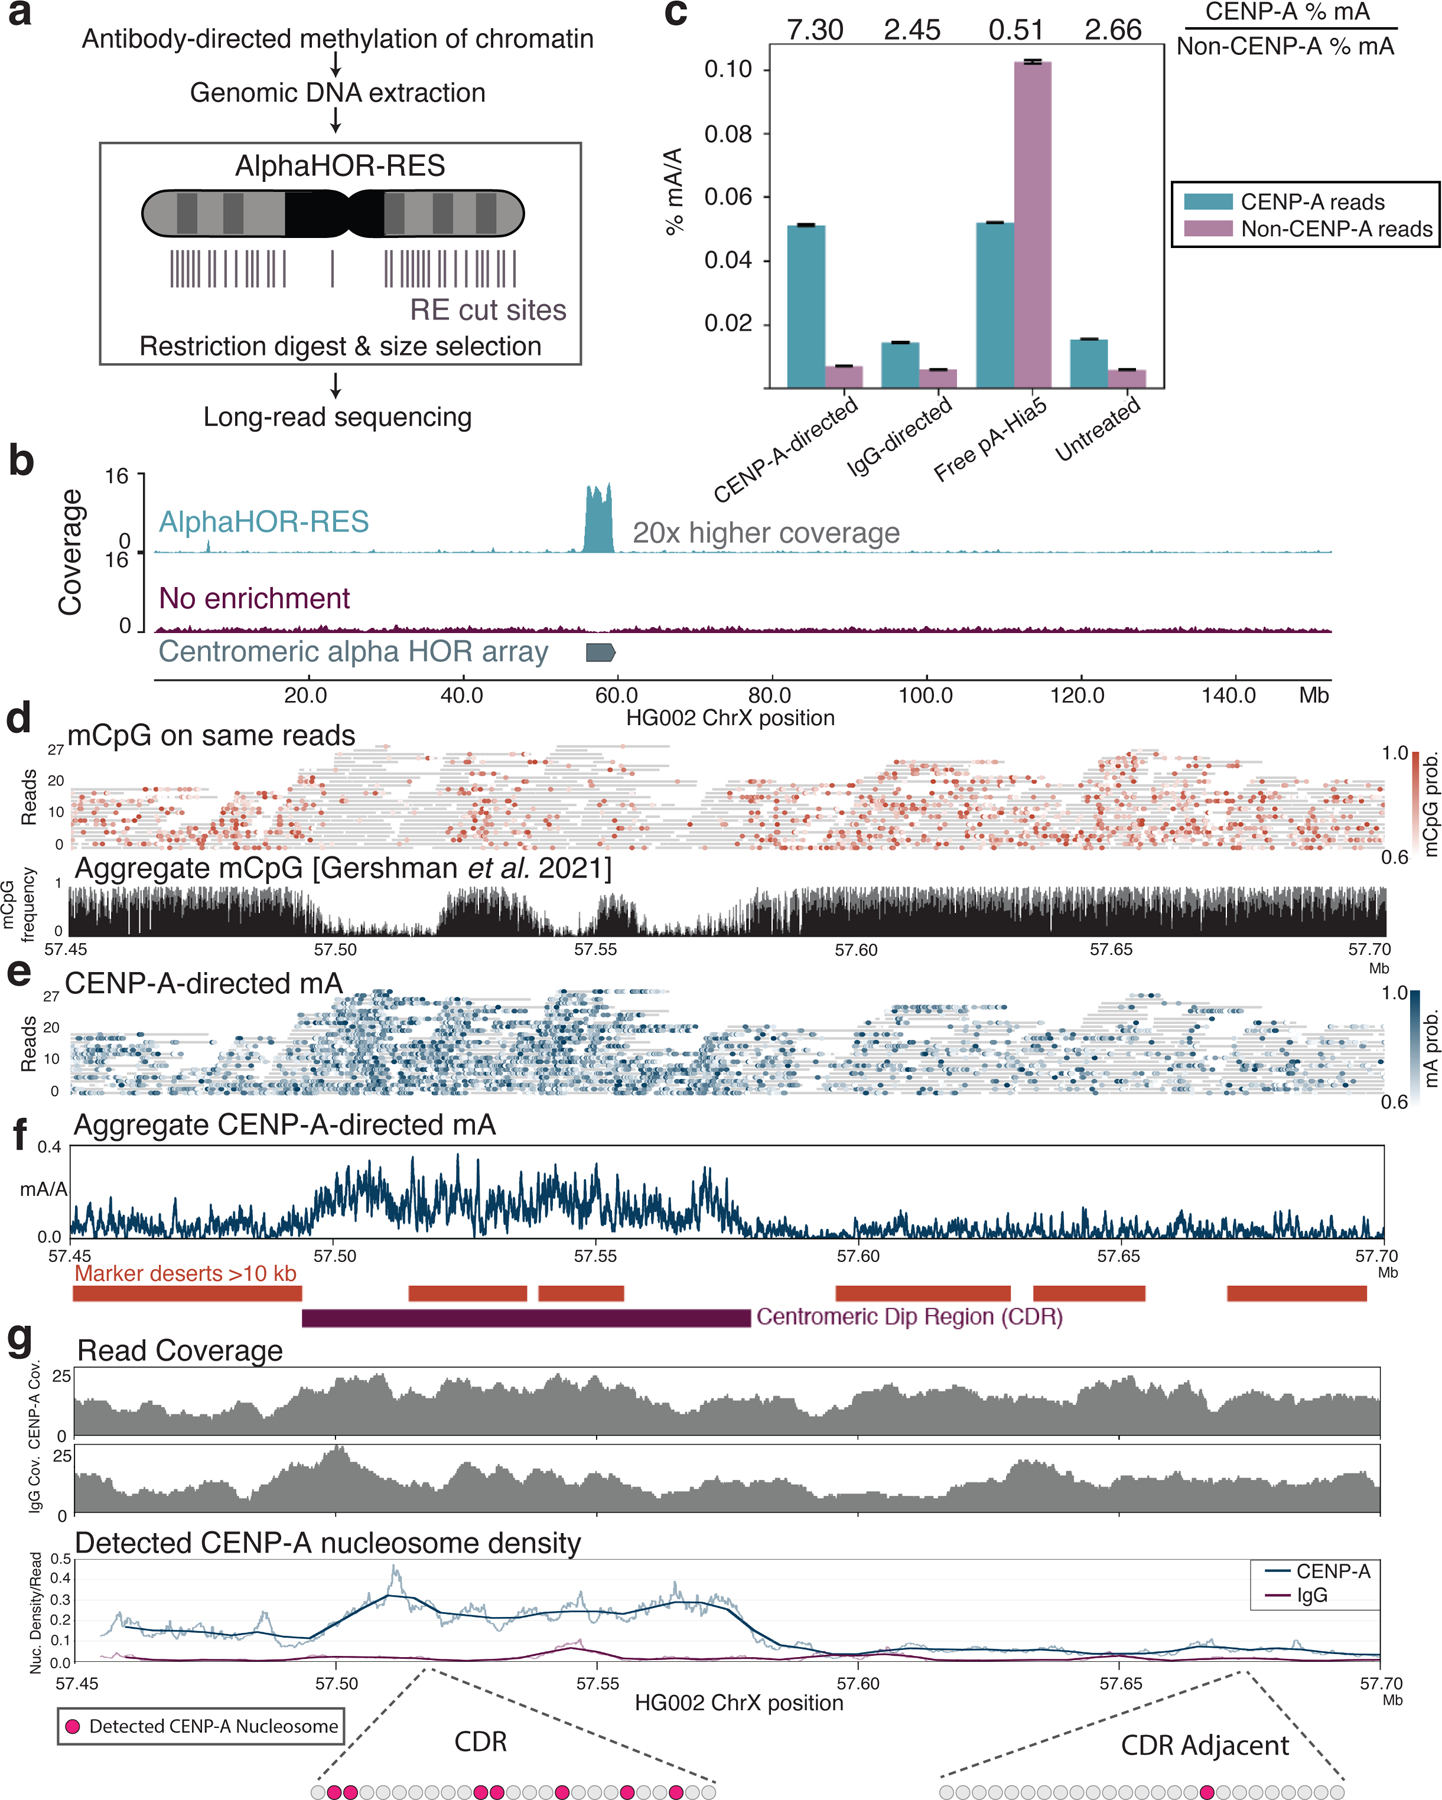
a, Schematic of DiMeLo-seq with AlphaHOR-RES centromere enrichment. b, Genome browser plot on HG002 chromosome X of read coverage from DiMeLo-seq libraries with centromere enrichment (top) or without (middle). Bottom track depicts the region of the alpha satellite array. c, Barplot of percentage mA/A (using a stringent Guppy probability threshold of 0.95) for reads from each library that contain or do not contain CENP-A enriched k-mers. Fold enrichment of methylation percentage on CENP-A reads over Non-CENP-A reads reported on top. Error bars represent 95% confidence intervals. d, View of a 250 kb region spanning the CDR within the active chrX HOR array. (top) Single-molecule view, with individual reads as gray lines and mCpG positions as orange dots shaded by Guppy’s methylation probability. (bottom) CpG methylation frequency from nanopore sequencing reported in 35. e, Single-molecule view of reads in (d). mA positions are depicted as blue dots shaded by Guppy’s methylation probability. f, Aggregate view of mA. mA/A plot indicates the fraction of reads with a Guppy methylation probability above 0.6 at each adenine position (averaged over a 250 bp rolling window for visualization). Marker deserts (regions of at least 10 kb without unique 51 bp k-mers) are shown in orange to illustrate difficult-to-map locations for short-read sequencing. g, For CENP-A or IgG control DiMeLo-seq, read coverage (top plots) and average fraction of nucleosomes detected as CENP-A (bottom plot) per read in sliding 5 kb windows (step size 1 bp), providing a measure of the density of CENP-A nucleosomes within single DNA molecules across the region. Thick lines indicate a 25 kb rolling average. Cartoon below shows representations of detected CENP-A nucleosomes within a 5 kb region corresponding to the CDR or CDR-adjacent region.
DiMeLo-seq reveals variable CENP-A nucleosome density across centromeres
We performed CENP-A-directed DiMeLo-seq on HG002 cells. After extraction of total genomic DNA, we used AlphaHOR-RES to enrich centromeric sequences before sequencing (Fig. 6a,b). In an alignment-independent manner 44, we classified DiMeLo-seq reads based on the presence or absence of CENP-A-enriched k-mers from an available short-read sequencing dataset 42. CENP-A-directed DiMeLo-seq reads with CENP-A enriched k-mers had ~7 fold more adenine methylation when compared to reads without CENP-A-enriched k-mers (Fig. 6c). We observed similar absolute methylation levels in DiMeLo-seq reads containing CENP-A k-mers when comparing CENP-A-targeted samples to free pA-Hia5 samples. However, the free pA-Hia5 samples also had a higher percentage of mA/A in reads that did not contain CENP-A k-mers, indicating a lack of CENP-A specificity in the absence of targeting.
To examine the positions of CENP-A nucleosomes within centromeric repeat arrays, we aligned our reads to a hybrid complete human assembly containing a fully assembled chromosome X from the HG002 cell line (Supplementary Note 14) 9,35. We investigated the recently described chromosome X centromere dip region (CDR), a hypomethylated region in the centromeric alpha HOR array where short-read CENP-A datasets align 35,36,42,45. We confirmed low endogenous CpG methylation within the CDR as expected (Fig. 6d). CENP-A-directed mA was found to be higher within both large and small CDRs compared to their adjacent CpG methylated regions, consistent with short-read data for this cell line (Fig. 6e,f) 35,36. We found that the density of detected CENP-A nucleosomes increased 5-fold within ChrX CDRs compared to neighboring regions (Fig. 6g). We estimate that 26 ± 5 % of nucleosomes contain CENP-A within the ChrX CDR, whereas only 5 ± 2 % of nucleosomes contain CENP-A within a neighboring region (mean ± standard deviation) (Supplementary Note 14, Fig. 6g) confirming what ensemble short-read methods cannot: the density of CENP-A nucleosomes on single DNA molecules increases in CDRs. IgG isotype controls confirm that this signal is not due to background methylation (2 ± 1 % (mean ± standard deviation) of nucleosomes detected on IgG control reads within ChrX CDR (Fig. 6g, Extended Data Fig. 10e)). A previous study estimated the average CENP-A density across endogenous human centromeres to be 1 in 25 nucleosomes, assuming a mean centromere size of ~1 Mb 46. In contrast, we estimate that at least 1 in 4 nucleosomes contains CENP-A within the smaller ~100 kb CDR on ChrX. This demonstrates that CENP-A nucleosome occupancy varies considerably across a human centromere, and further we show that the region with the highest CENP-A density coincides with the CDR. We observe a similar distribution of CENP-A-directed methylation on chromosome 3, where only one of the two HOR arrays was observed to have clear CENP-A-directed methylation (Extended Data Fig. 10 f,g). These observations support the finding of one active HOR array per chromosome 36,47. These findings illuminate the density and positioning of CENP-A nucleosomes within HOR sequences on individual chromatin fibers, which was not previously attainable with existing techniques.
Discussion
Here, we have developed, optimized, and validated DiMeLo-seq, a long-read method for mapping protein-DNA interactions genome-wide. DiMeLo-seq can map a protein’s binding sites within hundreds of base pairs at multiple loci on single molecules of sequenced DNA up to hundreds of kilobases in length. This long read length improves mappability in highly repetitive regions of the genome, opening them up for future studies of their regulation and function. Because DiMeLo-seq involves no amplification, it can be used to better estimate the absolute protein-DNA interaction frequency at each site in the genome. It also provides joint information about endogenous CpG methylation and protein-DNA interactions on the same long single molecules, which can be phased to reveal haplotype-specific binding and methylation patterns.
By mapping individual CENP-A nucleosomes on long, sequenced DNA molecules, we found that CENP-A nucleosome density increases on single chromatin fibers in mCpG depleted regions within centromeres. The sensitivity of CENP-A DiMeLo-seq on CENP-A chromatin in vitro was measured to be ~65%, suggesting that the estimates of CENP-A nucleosome densities within the ChrX CDR are lower limits, and the actual CENP-A density within CDRs could be even higher than ~25% (Fig. 6g). A source of variation in CENP-A positions is the cell cycle state of chromatin. Because pre-existing CENP-A nucleosomes are thought to epigenetically direct the assembly of new CENP-A nucleosomes in each cell cycle, it will be interesting to understand how CENP-A density varies along the sequence of the active centromere after cell cycle synchronization. We estimated the single-molecule sensitivity of DiMeLo-seq to be between 54–59% for CTCF and LMNB1, at thresholds that achieve 94% specificity compared to off-target regions. However, sensitivity may vary by target protein and antibody, perhaps owing to differences in local steric effects, or to differences in the binding strength of the target protein, antibody, or pA.
This study also allowed us to characterize the benefits and tradeoffs of using DiMeLo-seq compared to short-read ensemble methods. Because DiMeLo-seq is an amplification-free method that sequences single native DNA molecules, and because it relies on centrifugation for washing steps, it requires a relatively large amount of starting material to produce cell pellets big enough to easily handle (1–2 million cells per replicate). Using concanavalin-A coated magnetic beads, which we demonstrated to be compatible with the DiMeLo-seq protocol, may help to reduce these cell input requirements in the future (Supplementary Note 9). Additionally, the standard DiMeLo-seq protocol requires the entire genome to be sequenced uniformly, potentially wasting sequencing reads in regions of the genome that are irrelevant for the target protein’s binding domain. For proteins that only target small regions, it is possible to perform targeted DNA sequencing 48,49 or to use DNA enrichment methods like AlphaHOR-RES, the centromere enrichment method we demonstrated here. Another group recently described a complementary approach using a distinct set of restriction enzymes to enrich for centromeric DNA, which may serve as an important alternative to Alpha-HOR-RES 50. It is also possible to use immunoprecipitation to enrich for methylated DNA or DNA bound to a protein of interest, but this would no longer sample DNA molecules uniformly from the cell population, potentially diminishing the ability to infer protein-DNA interaction frequencies from read methylation frequencies.
Because Hia5 tends to methylate unbound linker DNA, DiMeLo-seq provides information about local nucleosome occupancy along with the target protein’s footprint. This also means that highly inaccessible regions can be more difficult to methylate, and they may require higher sequencing coverage. Additionally, because DiMeLo-seq is performed in situ in conditions meant to preserve chromatin conformation, it may methylate unbound DNA in trans if it is close enough to the target protein’s binding sites in 3D space, as does CUT&RUN 6. These 3D interactions, and the factors that mediate them, can potentially be investigated by perturbing 3D chromatin structure prior to performing DiMeLo-seq, which may also be a useful approach for improving DNA accessibility in highly condensed regions.
We anticipate that DiMeLo-seq will be useful for investigating a wide range of biological questions. For example, because it can allow one to explore the density of a protein’s binding along a single chromatin fiber from a single cell, it can be used to investigate how the exact boundaries between chromatin states vary among single cells, or perhaps how the stoichiometry of a DNA-binding protein in enhancers affects the transcription of nearby genes. We also demonstrated that DiMeLo-seq can read out methyladenines deposited by in vivo expression of protein-MTase fusions, as in conventional DamID 1 or MadID 23, instead of antibody targeting in situ. This may prove useful for investigating more transient protein-DNA interactions, or proteins that lack suitable antibodies, in cases where the biological system being studied can be readily genetically modified. One can also imagine adding exogenous cytosine methylation marks to provide joint information about DNA accessibility or about a second protein’s binding profile. Although we primarily used Oxford Nanopore Technologies sequencing in this study, we also demonstrated that DiMeLo-seq is compatible with Pacific Biosciences HiFi sequencing, which may be preferred for applications that require highly accurate base calls, such as genome assembly. With this study, we show that DiMeLo-seq provides a versatile approach for characterizing protein-DNA interactions on individual molecules spanning difficult-to-interrogate genomic regions.
Methods
Protocols/Materials availability
For detailed and updated protocols, please refer to the following protocols.io web pages:
DiMeLo-seq v1: dx.doi.org/10.17504/protocols.io.bv8tn9wn
DiMeLo-seq v2: dx.doi.org/10.17504/protocols.io.b2u8qezw
pA-Hia5 Protein Purification: dx.doi.org/10.17504/protocols.io.bv82n9ye
AlphaHOR-RES: dx.doi.org/10.17504/protocols.io.bv9vn966
Plasmids are available on Addgene: pA-Hia5 expression plasmid (pET-PA-Hia5, Addgene #174372) and pAG-Hia5 expression plasmid (pET-pAG-Hia5, Addgene #174373).
Sample summary metrics
Sequencing summary metrics for samples included in this study can be found in Supplementary Table 1, Supplementary Table 2, Supplementary Table 3, and Supplementary Figure 2.
Cell culture
HEK293T cells (CRL-3216, ATCC, Manassas, VA; validated by microsatellite typing and mycoplasma tested) were maintained in DMEM (high glucose, with GlutaMAX, with phenol red, without sodium pyruvate; Gibco 10566016) supplemented with 10% Fetal Bovine Serum (VWR 89510-186) and 1% Pen Strep (Gibco 15070063) at 37°C in 5% CO2. GM12878 cells (GM12878, Coriell Institute, Camden, NJ; mycoplasma tested) and HG002 cells (GM24385, Coriell Institute, Camden, NJ; mycoplasma tested) were maintained in RPMI-1640 with L-glutamine (Gibco 11875093) supplemented with 15% Fetal Bovine Serum (VWR 89510-186) and 1% Pen Strep (Gibco 15070063) at 37°C in 5% CO2.
Cloning of pET-pA-Hia5 and pET-pAG-Hia5
The pHia5ET vector was generously provided by Andrew Stergachis and John Stamatoyannopoulos 11. Protein A (pA) was amplified from pK19pA-MN (ASP4062, Addgene plasmid #86973, ref: 15) and Protein AG (pAG) was amplified from pAG/MNase (ASP4154, Addgene plasmid #123461, ref: 51). The pHia5ET vector was linearized via NdeI restriction digest. pA or pAG was inserted in front of the Hia5 cassette in pHia5ET using Gibson Assembly. Peptide linker between protein A (or protein A/G) and Hia5 in pET-pA-Hia5 and pET-pAG-Hia5 plasmids is DDDKEFA. All plasmid sequences were verified using Sanger sequencing. Plasmids pET-pA-Hia5 and pET-pAG-Hia5 are available from Addgene (plasmid number 174372 and 174373 respectively).
Purification of Hia5, pA-Hia5 and pAG-Hia5
pA-Hia5, pAG-Hia5, and Hia5 purification were adapted from 11. Please refer to Supplementary Note 15 for detailed protocol.
DiMeLo-seq
All reagents were prepared fresh, syringe filtered through a 0.2 μm filter, and kept on ice. Cells (1M-5M per condition) were pelleted at 300 × g for 5 minutes and washed with PBS. While live cells were used for experiments targeting CTCF, H3K9me3, CENP-A, and the accompanying controls, both frozen and fixed cells are also compatible with the DiMeLo-seq protocol. Frozen cells stored in freezing medium with DMSO in liquid nitrogen should be thawed on ice and prepared with the same protocol as fresh cells. For optional light fixation, cells can be fixed with 0.1% PFA for 2 minutes with gentle vortexing, followed by the addition of 1.25 M glycine to twice the molar concentration of PFA, a 3 minute spin at 500 × g at 4°C, and then continuation with standard DiMeLo-seq protocol’s nuclear isolation. Pelleted cells were resuspended in 1 ml of Dig-Wash buffer (0.02% digitonin, 20 mM HEPES-KOH, pH 7.5, 150 mM NaCl, 0.5 mM Spermidine, 1 Roche Complete tablet -EDTA (11873580001) per 50 ml buffer, 0.1% BSA) and incubated on ice for 5 minutes. Note: use of detergents other than digitonin and Tween may reduce methylation efficiency (Supplementary Note 8). The nuclei suspension was then split into separate tubes for each condition and spun down at 4°C at 500 × g for 3 minutes. All subsequent spins were performed with these same conditions, and all steps involving pipetting nuclei were performed with wide bore tips. The supernatant was removed and the pellet was gently resolved in 200 μl Tween-Wash (0.1% Tween-20, 20 mM HEPES-KOH, pH 7.5, 150 mM NaCl, 0.5 mM Spermidine, 1 Roche Complete tablet -EDTA per 50 ml buffer, 0.1% BSA) containing the primary antibody at a 1:50 dilution. Note: ensure primary antibody species is compatible with protein A. Antibodies targeted the following: LMNB1 (ab16048), CTCF (targeting C-terminus, ab188408), CTCF (targeting N-terminus, Active Motif 61312), H3K9me3 (Active Motif 39162), CENP-A (targeting Cenp-A N-terminus (amino acids 1–42), Aaron Straight, Stanford University, 52,53), and rabbit IgG isotype control (ab171870). Samples were placed on a rotator at 4°C for 2 hours. Nuclei were then pelleted and washed twice with 0.95 ml Tween-Wash. For each wash, the pellet was completely resolved by pipetting up and down ~10 times and placed on a rotator at 4°C for 5 minutes before spinning down. Following the second wash, the nuclei pellet was gently resolved in 200 μl Tween-Wash containing 200 nM pA-Hia5. pA-Hia5 concentration was measured using the Qubit Protein Assay Kit (Q33211). For pA-Hia5 binding, the nuclei were placed on the rotator at room temperature for 1 hour. Nuclei were then spun down and washed twice with 0.95 ml Tween-Wash with a 4°C rotating incubation for 5 minutes between spins, as in the wash following antibody binding. For the free pA-Hia5 control, nuclei were kept on the rotator at 4°C during antibody binding and pA-Hia5 binding steps, and pA-Hia5 was added at the time of activation. Nuclei were then resuspended in 100 μl of Activation Buffer (15 mM Tris, pH 8.0, 15 mM NaCl, 60 mM KCl, 1 mM EDTA, pH 8.0, 0.5 mM EGTA, pH 8.0, 0.5 mM Spermidine, 0.1% BSA, 800 μM SAM) and incubated at 37°C for 30 minutes before spinning and resuspending in 100 μl of cold PBS. To increase methylation efficiency, the following protocol changes were made and used when targeting LMNB1 and CTCF for experiments indicated in Supplementary Table 1 and Supplementary Table 3: (1) changed pA-Hia5 binding to 2 hours at 4°C, (2) increased activation time to 2 hours, (3) replenished SAM halfway through activation by adding an additional 800 μM final concentration, (4) reduced Spermidine in the activation buffer from 0.5 mM to 0.05 mM. We refer to the protocol with these changes as protocol v2. DiMeLo-seq protocol v2 requires ordinary lab equipment to prepare sequencing libraries (Supplementary Fig. 1). This protocol is also compatible with cryogenically frozen and lightly fixed samples, expanding the range of potential samples and targets (Supplementary Table 1; interactive, updated protocol on protocols.io).
Depending on the desired read length, either the NEB Monarch Genomic DNA Purification Kit (T3010S) or the NEB Monarch HMW DNA Extraction Kit (T3050L) with 2000 rpm agitation was used to extract DNA from the nuclei. If fixation was performed, the incubation was performed at 56°C for 1 hour for lysis to reverse crosslinks. For T3050L, we agitated the sample for the first 10 minutes of lysis and then kept the samples at 56°C without agitation for 50 minutes. DNA yield was quantified using the Qubit dsDNA BR Assay Kit (Q32850).
Immunofluorescence imaging following binding with pA/G-MTase (i.e. pA-Hia5 or pAG-Hia5 or pAG-EcoGII) was performed to evaluate cell permeabilization, nuclear integrity, primary antibody on-target and background binding. For detection of pA/G-MTase binding, two different fluorophore-conjugated antibodies were used: a goat anti-mouse IgG antibody conjugated to AlexaFluor647 (Invitrogen A32728), which is not expected to bind to the rabbit primary or goat secondary antibodies but is expected to be bound by pA/G, and a goat anti-V5 antibody conjugated to FITC (Abcam 1274), which is expected to bind to the C-terminal V5 tag on pA/G-MTase. It is also possible to use a chicken anti-HisTag FITC-conjugated antibody (Abcam 3554) to avoid any binding by pA or pG. All antibodies were diluted 1:1000 for immunofluorescence imaging.
Nanopore library preparation and sequencing
For each sample, 3 μg DNA was input into library preparation using one of the following library preparation kits: (1) Ligation Sequencing Kit (ON SQK-LSK109) with Native Barcoding Expansion 1–12 (ON EXP-NBD104) and Native Barcoding Expansion 13–24 (ON EXP-NBD114) for optimization experiments and CENP-A targeted experiments after AlphaHOR-RES, or (2) Ligation Sequencing Kit (ON SQK-LSK110) for CTCF targeting, H3K9me3 targeting, and the corresponding IgG and free pA-Hia5 controls in GM12878 and HG002.
For method (1), the protocol was performed as described in the LSK109 documentation with the following modifications. End repair incubation time was increased to 10 minutes. 1 μg of end repaired DNA was loaded into barcode ligation. All ligation incubation times were increased to at least 20 minutes. Elution following barcode ligation reaction cleanup was decreased to 18 μl to allow for loading 3 μg of pooled barcoded material into the final ligation. If DNA was not sufficiently concentrated, the speedvac was used to concentrate the DNA. LFB was used for the final cleanup and elution was performed with 13 μl EB. 1 μg of DNA was loaded onto the sequencer.
For method (2), initial runs following high molecular weight extraction using NEB Monarch HMW DNA Extraction Kit with 2000 rpm agitation during lysis suffered from bead clumping during library preparation cleanups, resulting in low yields and reduced fragment size. To preserve longer fragments with the LSK110 kit, the following modifications were made to the standard LSK110 protocol 54. End preparation incubation time was increased to 1 hour with a 30 minute deactivation. The cleanup following end preparation was performed by combining 60 μl SRE buffer (Circulomics SS-100-101-01) with the 60 μl end prep reaction, centrifuging at 10,000 × g at room temperature for 30 minutes, or until the DNA had pelleted, and washing with 150 μl 70% ethanol two times with a 2 minute spin at 10,000 × g between washes. The pellet was resuspended in 31 μl EB, and incubated at 50°C for 1 hour and then 4°C for at least 48 hours. Ligation volume was reduced by half for a total of 30 μl DNA in a 50 μl reaction volume. The ligation incubation was increased to 1 hour. The DNA was pelleted at 10,000 × g at room temperature for 30 minutes. The pellet was washed twice with 100 μl LFB, with a 2 minute spin at 10,000 × g between washes. The pellet was resuspended in 31 μl EB and incubated at least 48 hours at 4°C. For sequencing, 500 ng of the final library was loaded, with a wash using the Flow Cell Wash Kit (ON EXP-WSH004) and reload every 24 hours. Other approaches, such as using Zymo Genomic DNA Clean & Concentrator (D4065) for cleanup between reaction steps in the LSK110 protocol and and using the Rapid Barcoding Kit (ON SQK-RBK004) were performed; however, LSK110 with pelleting DNA for cleanup resulted in the best throughput with the longest reads.
Sequencing was performed on an Oxford Nanopore MinION sequencer with v9.4 flow cells (ON FLO-MIN106.1) with MinKNOW software (v21.02.1). N50 varied with library preparation method, with a range from ~20 kb with LSK110 without modification to ~50 kb with LSK110 with the modifications for pelleting for DNA cleanup. See Supplementary Table 3 for summary sequencing metrics for each sample and Supplementary Figure 2 for read length distributions.
PacBio library preparation and sequencing
We performed PacBio sequencing on a DiMeLo-seq sample targeting CTCF in GM12878 and on unmethylated GM12878 DNA as a control. To fragment the DNA before library preparation, we targeted 20 kb fragments using a g-Tube (Covaris 520079) with 60-second spins at 4200 rpm. We prepared PacBio libraries for sequencing using the SMRTbell® Express Template Prep Kit 2.0 (100-938-900) with 1 μg input to library preparation. DNA size was determined using the TapeStation Genomic DNA ScreenTape Analysis (Agilent 5067–5365 & 5067–5366) and DNA quantification was performed using the Qubit (Invitrogen Q32853).
Primer annealing and polymerase binding to the SMRTbell libraries were performed using the Sequel II® Binding Kit 2.2 (102-089-000). An internal control complex (v 1.0) was added for sequencing quality control check. Each library was sequenced on a single SMRT cell at a loading concentration of 70 pM, as recommended for HiFi sequencing on a PacBio Sequel IIe. Sequencing runs were set up with a movie time of 30 hrs per SMRT Cell. The new adaptive loading feature in SMRTLink v10.1 was set to a loading target (P1+P2) of 0.75 and a maximum loading time of 2 hrs, as recommended for the HiFi sequencing application. CCS analysis was performed in SMRT Link v 10.1 to generate consensus reads, with the option to include kinetics information for further analysis. SMRT Cell runs produced 19.6 GB (CTCF-targeted) and 21.9 GB (untreated) of HiFi data, with a high productivity rate (P1)(% of zero-mode-waveguides with a high quality read detected) of 77.2% and 82.7%, respectively. For the CTCF-targeted sample, we sequenced 1,399,946 reads with a mean read length of 13,972 bp and a median quality score of Q33. For the untreated sample, we sequenced 1,817,035 reads with a mean read length of 12,048 bp and a median quality score of Q35.
Centromere enrichment using AlphaHOR-RES
The T2T-CHM13v1.0 reference genome was in silico digested with all 4–6 bp restriction enzymes available from New England Biolabs annotated as insensitive to dam or CpG methylation. A subset of these enzymes were selected based on the criteria of having less than 5% of the generated fragments map back to the alpha-satellite region of the genome and for which the genome was fragmented into at least 200,000 total fragments. Centromere enrichment was calculated after artificially removing fragments under 20 kb to simulate a size selection step and determining the fraction of remaining fragments that map to centromeric regions, as well as the loss of alpha satellite containing sequences (Extended Data Fig. 10a). Combinations of digests were then evaluated and MscI and AseI were identified as an optimal pair for centromere enrichment, predicted to yield over 20-fold enrichment when using a 20 kb size cutoff.
Genomic DNA was extracted from ~25 million cells using an NEB HMW DNA extraction kit using 300 rpm rotation during lysis (#T3050L). The DNA was eluted in a total of 300 μl elution buffer and allowed to relax at 4 °C for 2 days, although it remained viscous until it was solubilized. 37 μl NEBuffer 2.1 was added, along with 100 units of MscI and 100 units of AseI (NEB #R0534M and #R0526M) to a total volume of 370 μl in a 1.5 ml lo-bind Eppendorf tube. This was placed on a rotator at 12 rpm at 37 °C overnight. DNA concentration was then quantified using a Qubit Broad Range DNA kit (Thermo Fisher #Q32850). DNA was then mixed with orange loading buffer and loaded on a 0.3% TAE agarose gel made with Lonza SeaKem Gold agarose (# 50512) and 15 μl SYBRSafe gel stain (Thermo Fisher #S33102) per 100 ml gel. A GeneRuler High Range DNA Ladder (Thermo Fisher SM1351) was loaded in an adjacent lane. To avoid overloading, DNA was loaded with no more than 250 ng per mm of lane width (~30 μg per sample). The gel was run at 2 V/cm for 1 hour and imaged over a blue light transilluminator. The gel was cut to remove fragments smaller than 20 kb, while keeping everything larger, up to the well itself. DNA was purified from the resulting gel slice using a Zymoclean Large Fragment DNA Recovery Kit (Zymo # D4045), with modifications: the gel slice was melted at room temperature on a rotator at 12 rpm, and DNA was eluted from the column twice with the elution buffer heated to 70 °C. The DNA was then quantified by Qubit again. DNA was prepared for sequencing using an ONT LSK-109 native library prep kit, and sequenced on a v9.4 MinION flow cell. CENP-A-targeted DiMeLo-seq was performed on unfixed HG002 cells processed in parallel with IgG-targeted, free-floating pA-Hia5, and untreated samples. For each treatment ~25 million cells were processed in 5 tubes of ~5 million cells each. DiMeLo-seq was initially performed as described above. AlphaHOR-RES was performed on these samples and 250 ng to 1 ug of recovered DNA from each sample was then processed for Nanopore sequencing using method (1), described above.
Data availability
All raw fast5 sequencing data are available in the SRA with BioProject accession PRJNA752170. These data were used to produce Figures 2–6, Extended Data Figures 1–10, Supplementary Tables 1–3, and Supplementary Figure 2. CTCF ChIP-seq peak bed file for GM12878 is available from ENCODE Project Consortium with accession code ENCFF797SDL. ATAC-seq peak bed file for GM12878 is available from ENCODE Project Consortium with accession code ENCFF748UZH. Bulk and single-cell DamID data were obtained from GEO with accession GSE156150. H3K9me3 CUT&RUN data are from Altemose et al.36 and accessible in the SRA with BioProject accession PRJNA752795. Data for Figure 6c used CHM13 CENP-A ChIP-seq data for CENP-A kmer analyses which are available at Bioproject accession number PRJNA559484 from Logsdon et al.42. Data for the CpG methylation track in Figure 6d were obtained from data available at https://github.com/nanopore-wgs-consortium/CHM13 35.
Code availability
The code to reproduce the results in this manuscript is available on Github: https://github.com/amaslan/dimelo-seq
Extended Data
Extended Data Fig. 1. In vitro assessment of methylation of DNA and chromatin by pA-Hia5 and pAG-Hia5.
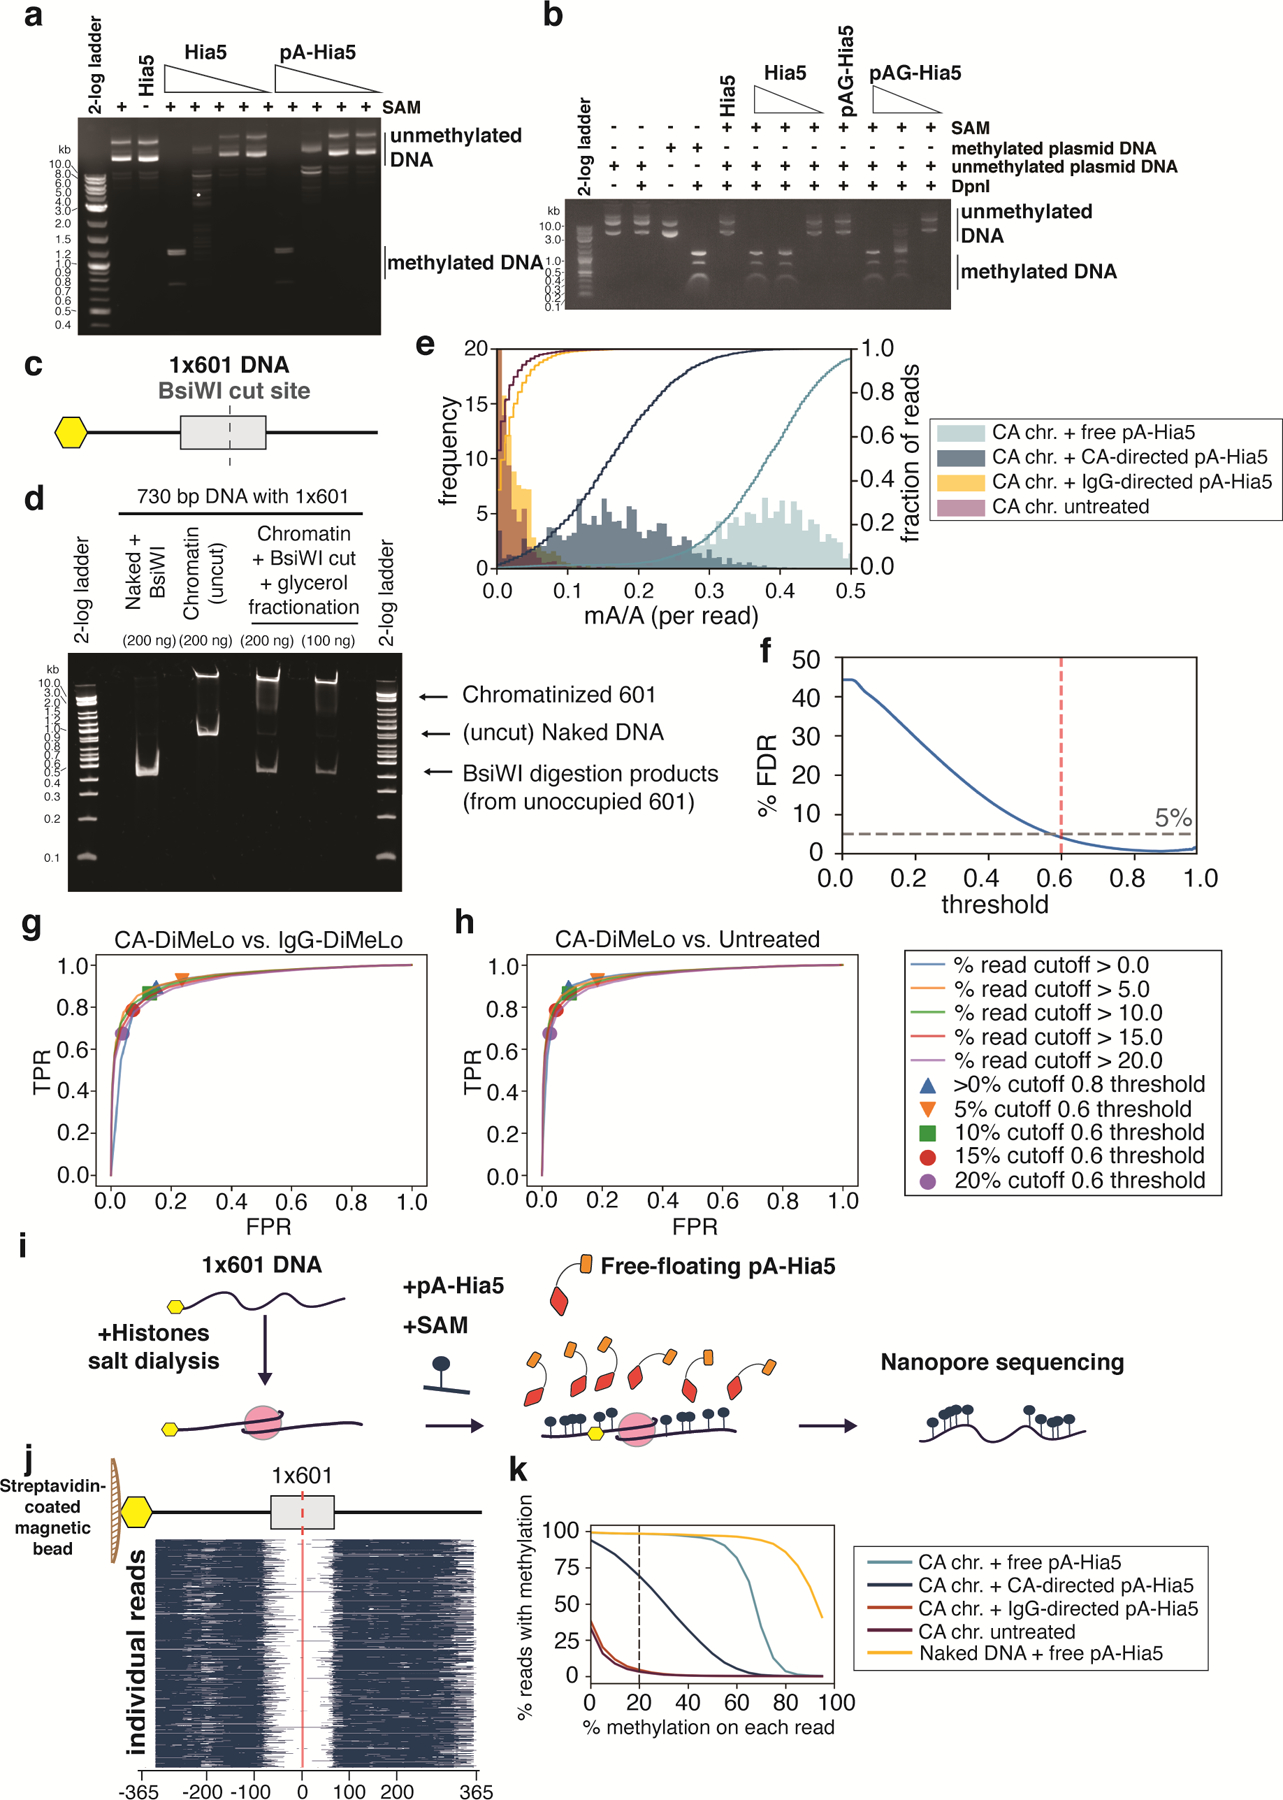
a,b, Agarose gel electrophoresis image of DpnI digestion of (unmethylated) plasmid DNA following incubation with Hia5, pA-Hia5 (a), or pAG-Hia5 (b) (Supplementary Note 1). Representative images of at least 2 replicates. c, Schematic of 1×601 DNA sequence. Grey box indicates 601 sequence, Yellow hexagon indicates end with biotin. d, Native polyacrylamide gel electrophoresis of naked 1×601 DNA or chromatinized 1×601 DNA before and after BsiWI digestion and glycerol gradient fractionation. Representative image of at least 2 replicates. e, Histogram (filled bars, left axis) and cumulative distribution (line traces, right axis) of fraction of methylation (mA/A) on reads from CENP-A 1×601 chromatin methylated with free pA-Hia5, CENP-A-directed pA-Hia5, IgG-directed pA-Hia5, or untreated. Left y-axis is truncated at 20 for better visualization. f, Plot showing percentage false discovery rate plotted against binned minimum mA probability score (Supplementary Note 4). Dotted lines indicates threshold - 0.6, 5% FDR. g,h, Receiver Operator Characteristic (ROC) curves comparing fraction of methylated reads from 1×601 CENP-A chromatin after CENP-A-directed methylation (True Positive Rate) to IgG-directed methylation (g) or no treatment (h) (False Positive Rate). Areas under the curves (AUC) for the ROC curves range between 0.92 and 0.94 for (g), and between 0.92 and 0.95 for (h). i, Schematic of methylation of accessible DNA on 1×601 CENP-A chromatin co-incubated with free pA-Hia5 and SAM. j, Heatmap showing methylation on 5000 individual reads from CENP-A chromatin following incubation with free pA-Hia5. Blue indicates methylation above threshold (0.6). k, Line plot showing percentage of reads with methylation as a function of the minimum percentage of methylation on each read. (methylation threshold - 0.6). Dotted line corresponds to methylation on at least 20% of each read (used in figure 2d).
Extended Data Fig. 2. In vitro assessment of methylation of 18×601 array chromatin by pA-Hia5 and pAG-Hia5.
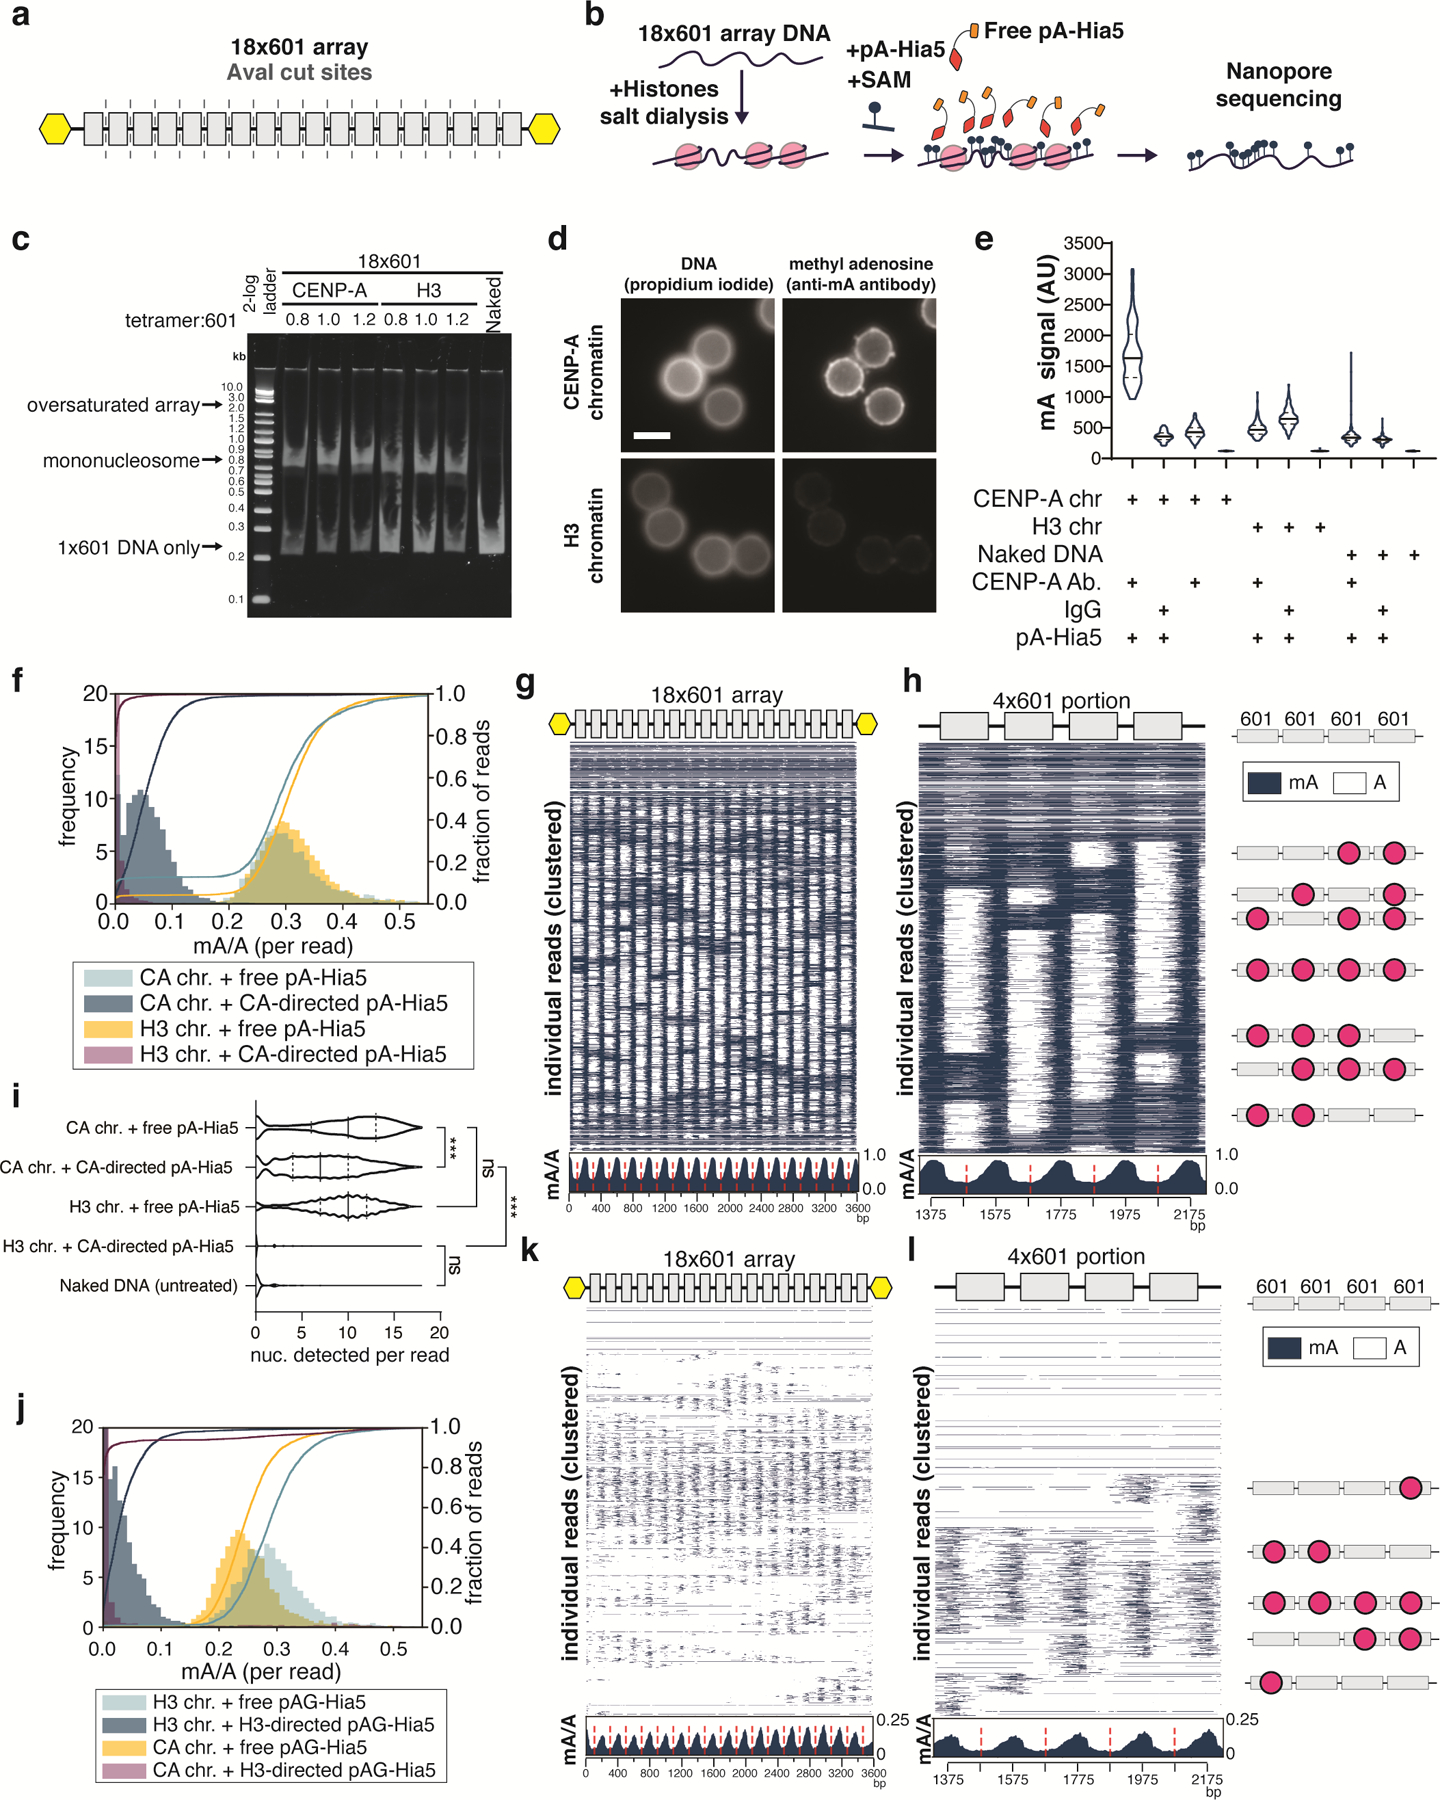
a, Schematic showing the location of 601 sequences (grey boxes) and AvaI digestion sites (dashed line) in between 601 sequences on the 18×601 array. Yellow hexagons indicate biotinylation. b, Schematic of methylation of 18×601 chromatin reconstitution, incubation with free pA-Hia5 and SAM, and long-read sequencing of methylated DNA extracted from chromatin. c, Native polyacrylamide gel electrophoresis showing AvaI digested naked 18×601 array DNA or 18×601 chromatin array reconstituted with CENP-A or H3 (Supplementary Note 2). Representative gel image of at least 3 replicates. d, Representative immunofluorescence images of chromatin-coated beads following methylation using CENP-A-directed pA-Hia5. Scale bar - 3 microns. e, Violin plots of immunofluorescence signal on (denatured) chromatin-coated beads following antibody-directed methylation. Solid line - median, dashed line - quartiles. n > 90 beads/condition. (Supplementary Note 5) f, Histogram (filled bars, left axis) and cumulative distribution (line traces, right axis) of fraction of methylation (mA/A) on reads from CENP-A or H3 chromatin methylated with free pA-Hia5 or CENP-A-directed pA-Hia5. Left y-axis is truncated at 20 for better visualization. g,h, Heatmap showing methylation on 2000 individual reads from CENP-A chromatin methylation with free pA-Hia5, clustered over the entire 18×601 array (g) or a subset 4×601 region (Supplementary Note 4) along with cartoons depicting predicted nucleosome positions (red circles) (h). Insets below heatmaps show average mA/A on every base position of 18×601 array or 4×601 portion. (red dashed line indicates 601 dyad position). i, Violin plot of nucleosomes detected per read on reads from CENP-A or H3 18×601 chromatin array methylated with free pA-Hia5, or CENP-A-directed pA-Hia5. Solid line - median, dashed lines - quartiles. n = 3000 reads. Statistical significance was calculated using Kruskal-Wallis test. *** - P-value < 0.0001 ns - P-value > 0.05. j, Histogram (filled bars, left axis) and cumulative distribution (line traces, right axis) of fraction of methylation (mA/A) on reads from CENP-A or H3 chromatin methylated with free pA-Hia5 or CENP-A-directed pA-Hia5. Left y-axis is truncated at 20 for better visualization. K,l, Same as g,h, but corresponding to H3 chromatin methylation with H3-directed pAG-Hia5.
Extended Data Fig. 3. Assessment of mA calling and LMNB1 targeting.
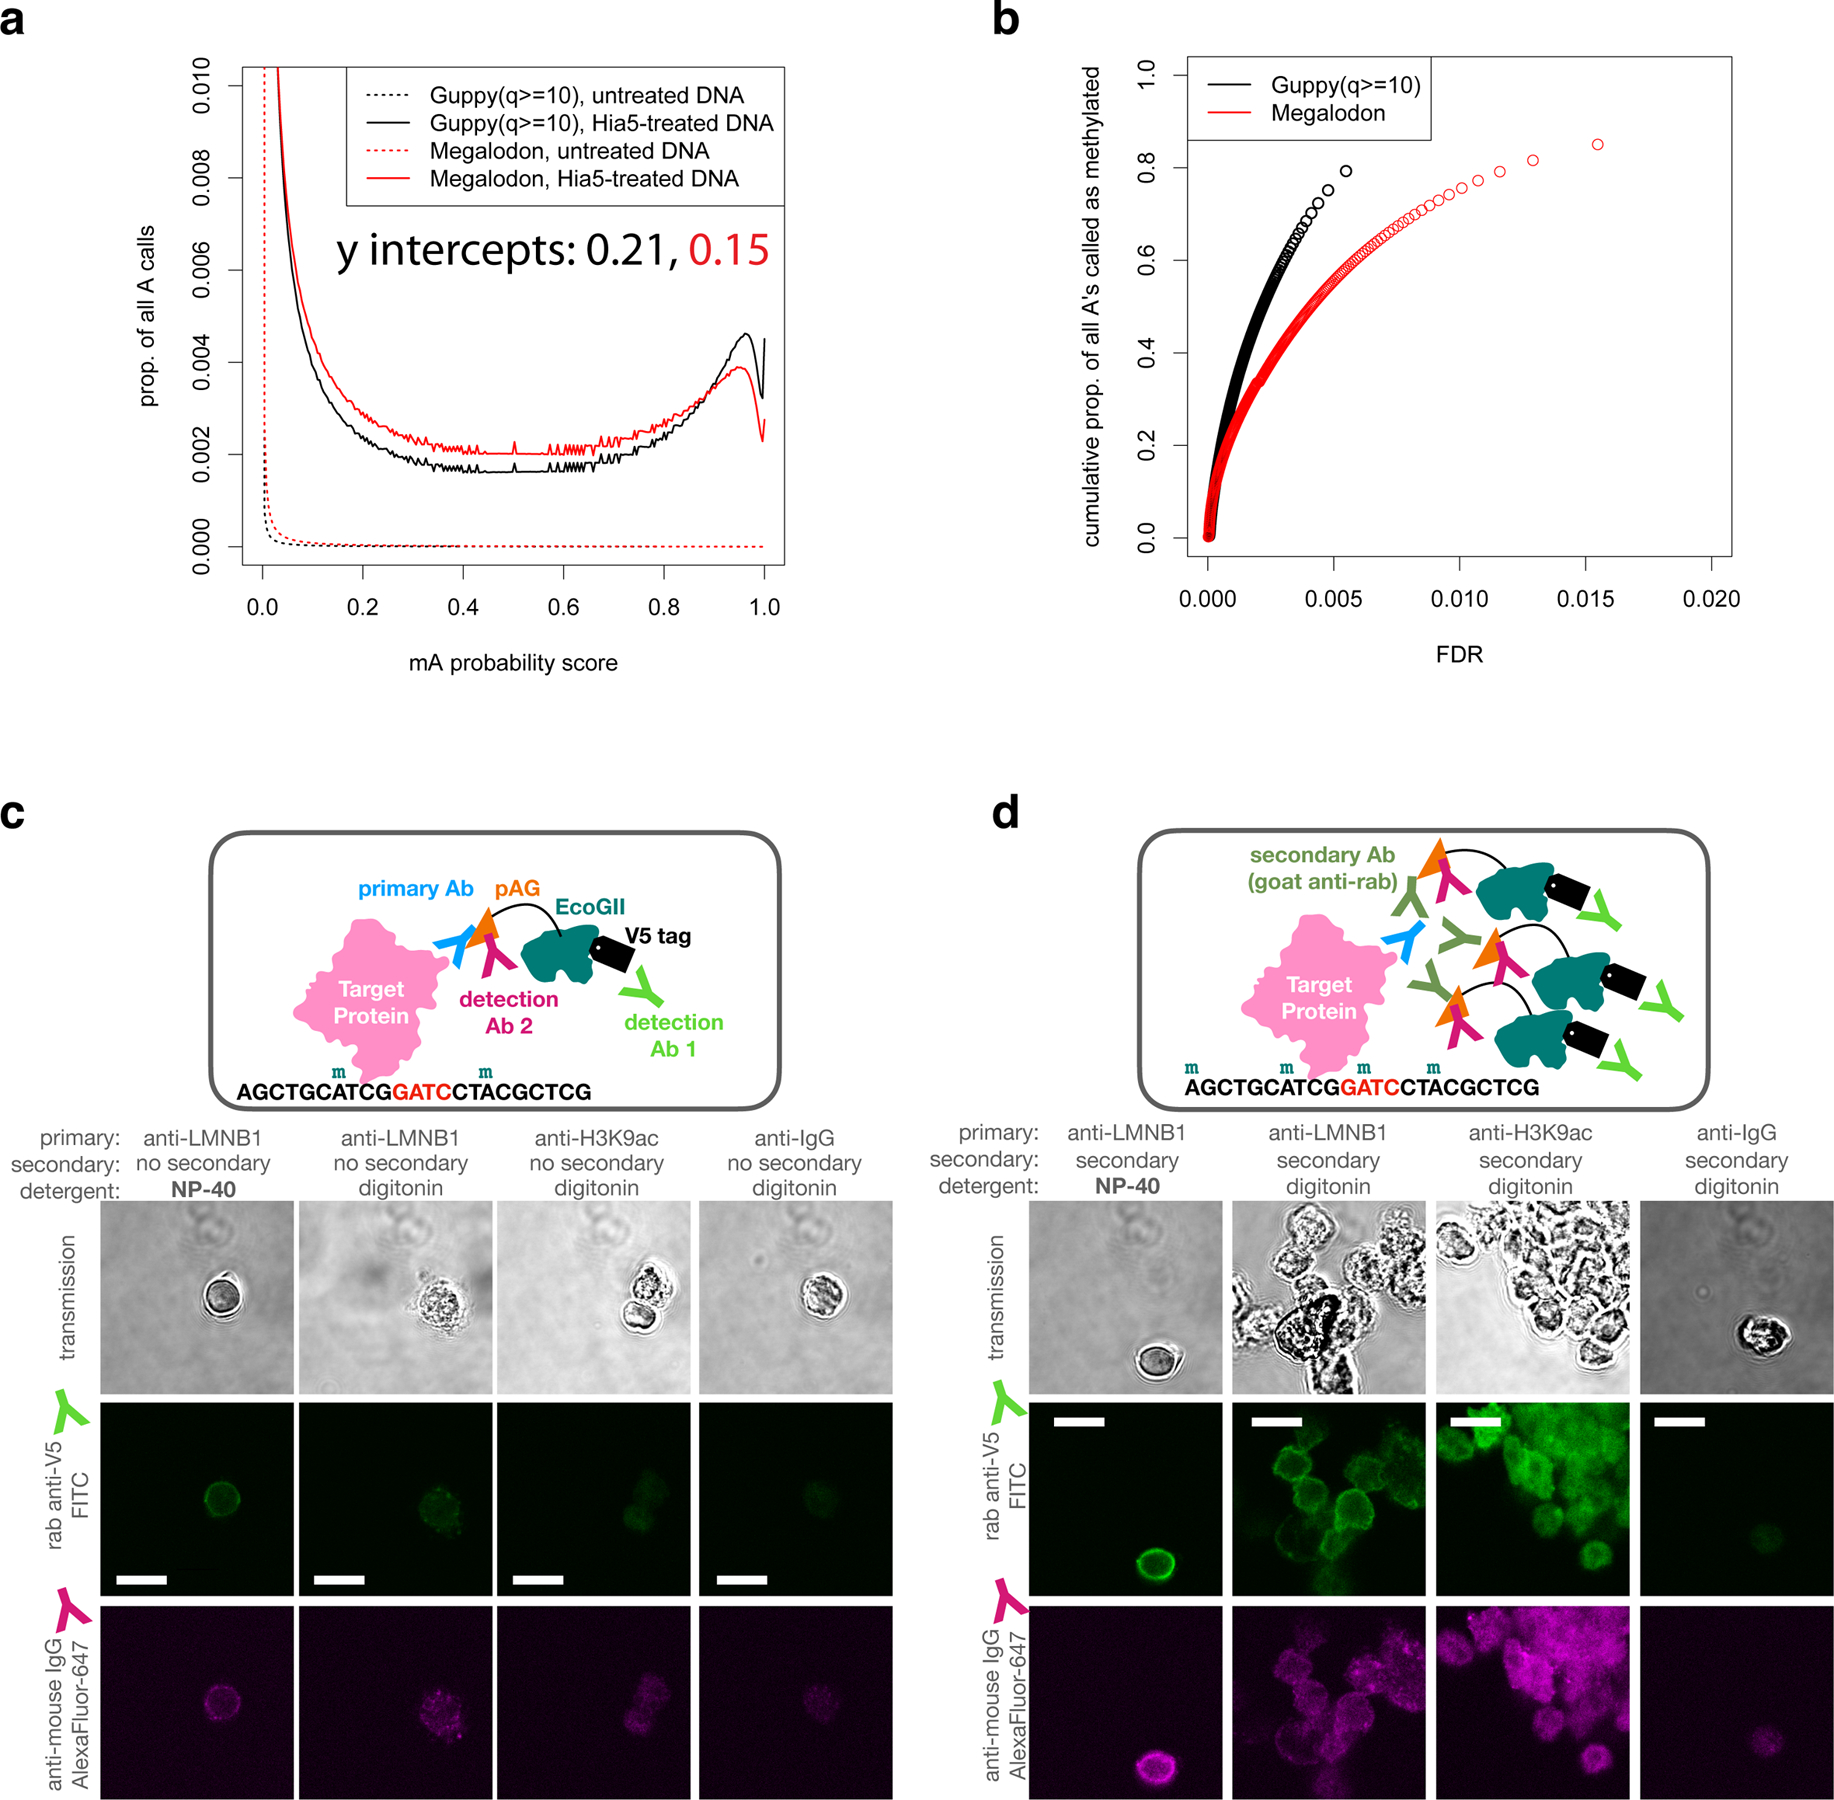
a, The proportion of all adenines called as methylated at each possible probability mA probability score using two different software packages on ONT reads from two GM12878 DNA samples: untreated genomic DNA and purified genomic DNA methylated by Hia5 in vitro. The untreated DNA provides a measure of the false positive rate (FPR) at each score, since it contains few or no methyl adenines. The Hia-5 treated DNA provides a lower bound on the true positive rate (TPR) at each threshold. b, Estimates of the proportion of As methylated in the Hia5-treated DNA sample at each false discovery rate (FDR) threshold (FDR=FPR/(TPR+FPR), determined from a). At least 80% of the adenines on the Hia5-treated DNA appear to be methylated. c-d, In the DiMeLo-seq workflow, following the primary antibody and pA/G-MTase binding and wash steps, a sample of nuclei can be taken for quality assessment by immunofluorescence. One can determine the locations and relative quantity of pA/G-MTase molecules using fluorophore-conjugated antibodies that bind to the pA/G-MTase but not to the primary antibody. In these representative images, the results for pAG-EcoGII are shown, comparing different antibodies, detergents, and samples with (d) and without (c) the use of an unconjugated secondary antibody to recruit more pA/G-MTase molecules to the target protein. Scale bars representing 10 microns are shown in the FITC channel images as white lines.
Extended Data Fig. 4. Demonstration of in vivo LMNB1-targeting and estimation of in situ sensitivity and specificity.
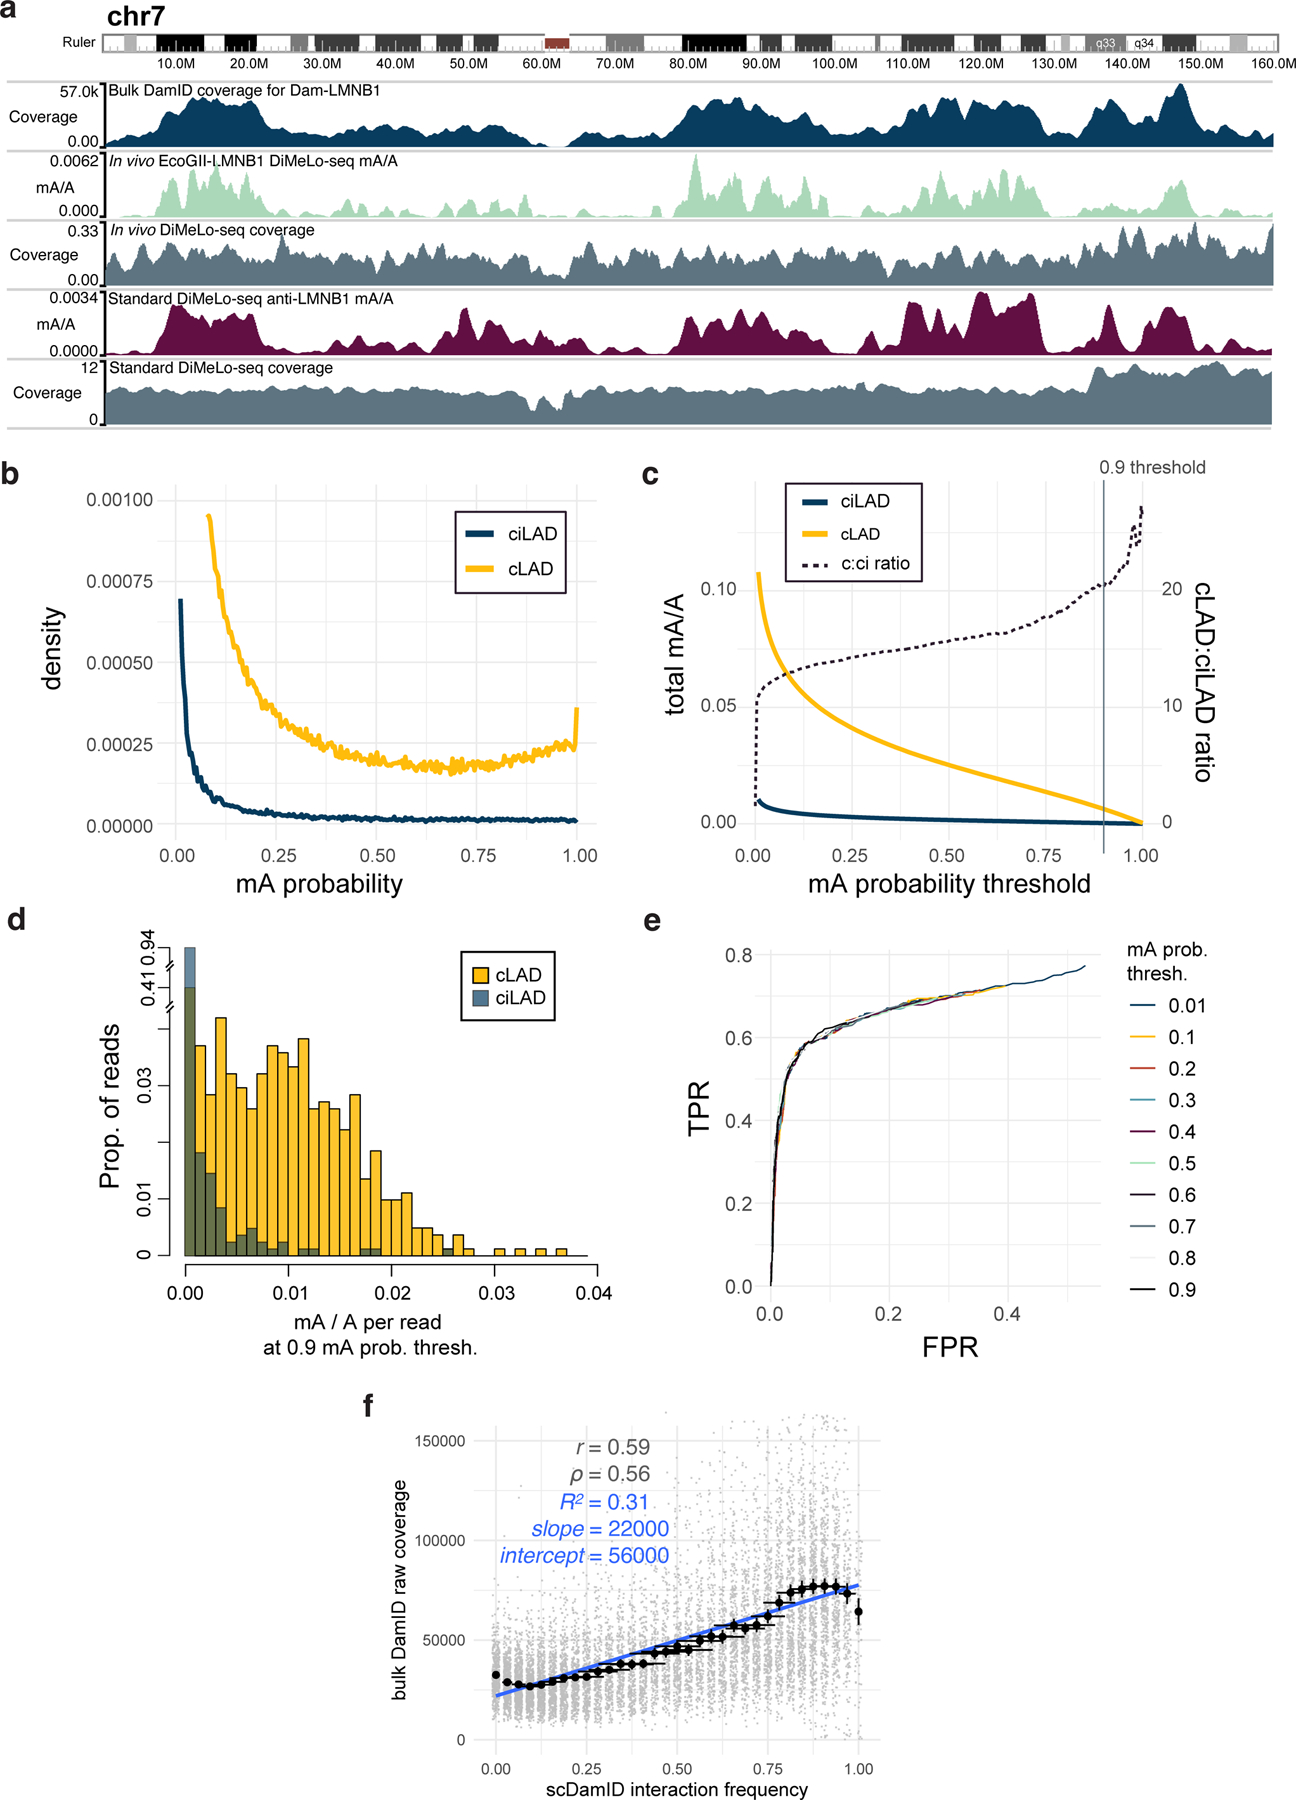
a, A browser view of chr7 comparing in vivo EcoGII-LMNB1 DamID (second track, green) to conventional LMNB1 in vivo DamID (first track, blue), and to LMNB1-targeted in situ DiMeLo-seq (fourth track, dark red). b, For an in situ LMNB1-targeting experiment using the final v2 protocol (#120 in Supplementary Table 1), the distributions of guppy mA probability scores across all A bases (q>10) on all reads mapping to cLADs (gold, representing on-target methylation; n = 2.8M) or ciLADs (blue, representing off-target methylation; n = 2.1M). c, As in b, but showing the cumulative distributions for all mA calls above each probability score threshold, with the ratio between these plotted as a dotted line (using the right-hand y-axis). Vertical line indicates the stringent threshold of 0.9, at which cLADs have 20 times more mA as a proportion of all As (0.6%) than do ciLADs. If the threshold is reduced to 0.5, the fraction of As called as methylated increases to 2.5% but the cLAD:ciLAD ratio decreases to 15.6. d, On a per-read basis, for all reads with at least 500 A basecalls (q>10) and using a mA probability threshold of 0.9, the distribution of mA/A called on each read for cLADs (n = 812 reads) vs. ciLADs (n = 827 reads). e, Receiver-Operator Characteristic (ROC) curve showing, for different mA calling thresholds, the ability to classify individual reads from (d) as originating from cLADs or ciLADs using a simple linear threshold on mA/A. At a false positive rate of 6%, reads can be classified with a true positive rate of 59%, and this is similar for all mA thresholds used. The total Area Under the Curve (AUC) for the p>0.9 curve is 0.78. f, As in Fig. 3e, but for bulk conventional DamID raw coverage. The y axis is truncated to omit outliers for visualization (max = 300000), but these were not omitted for linear model and correlation computation. Error bars in x represent the proportion of 32 cells +/− 2 standard errors of the proportion. Error bars in y represent the mean of n = 94 to 663 genomic bins +/− 2 standard errors of the mean.
Extended Data Fig. 5. Analysis of CTCF targeting performance.
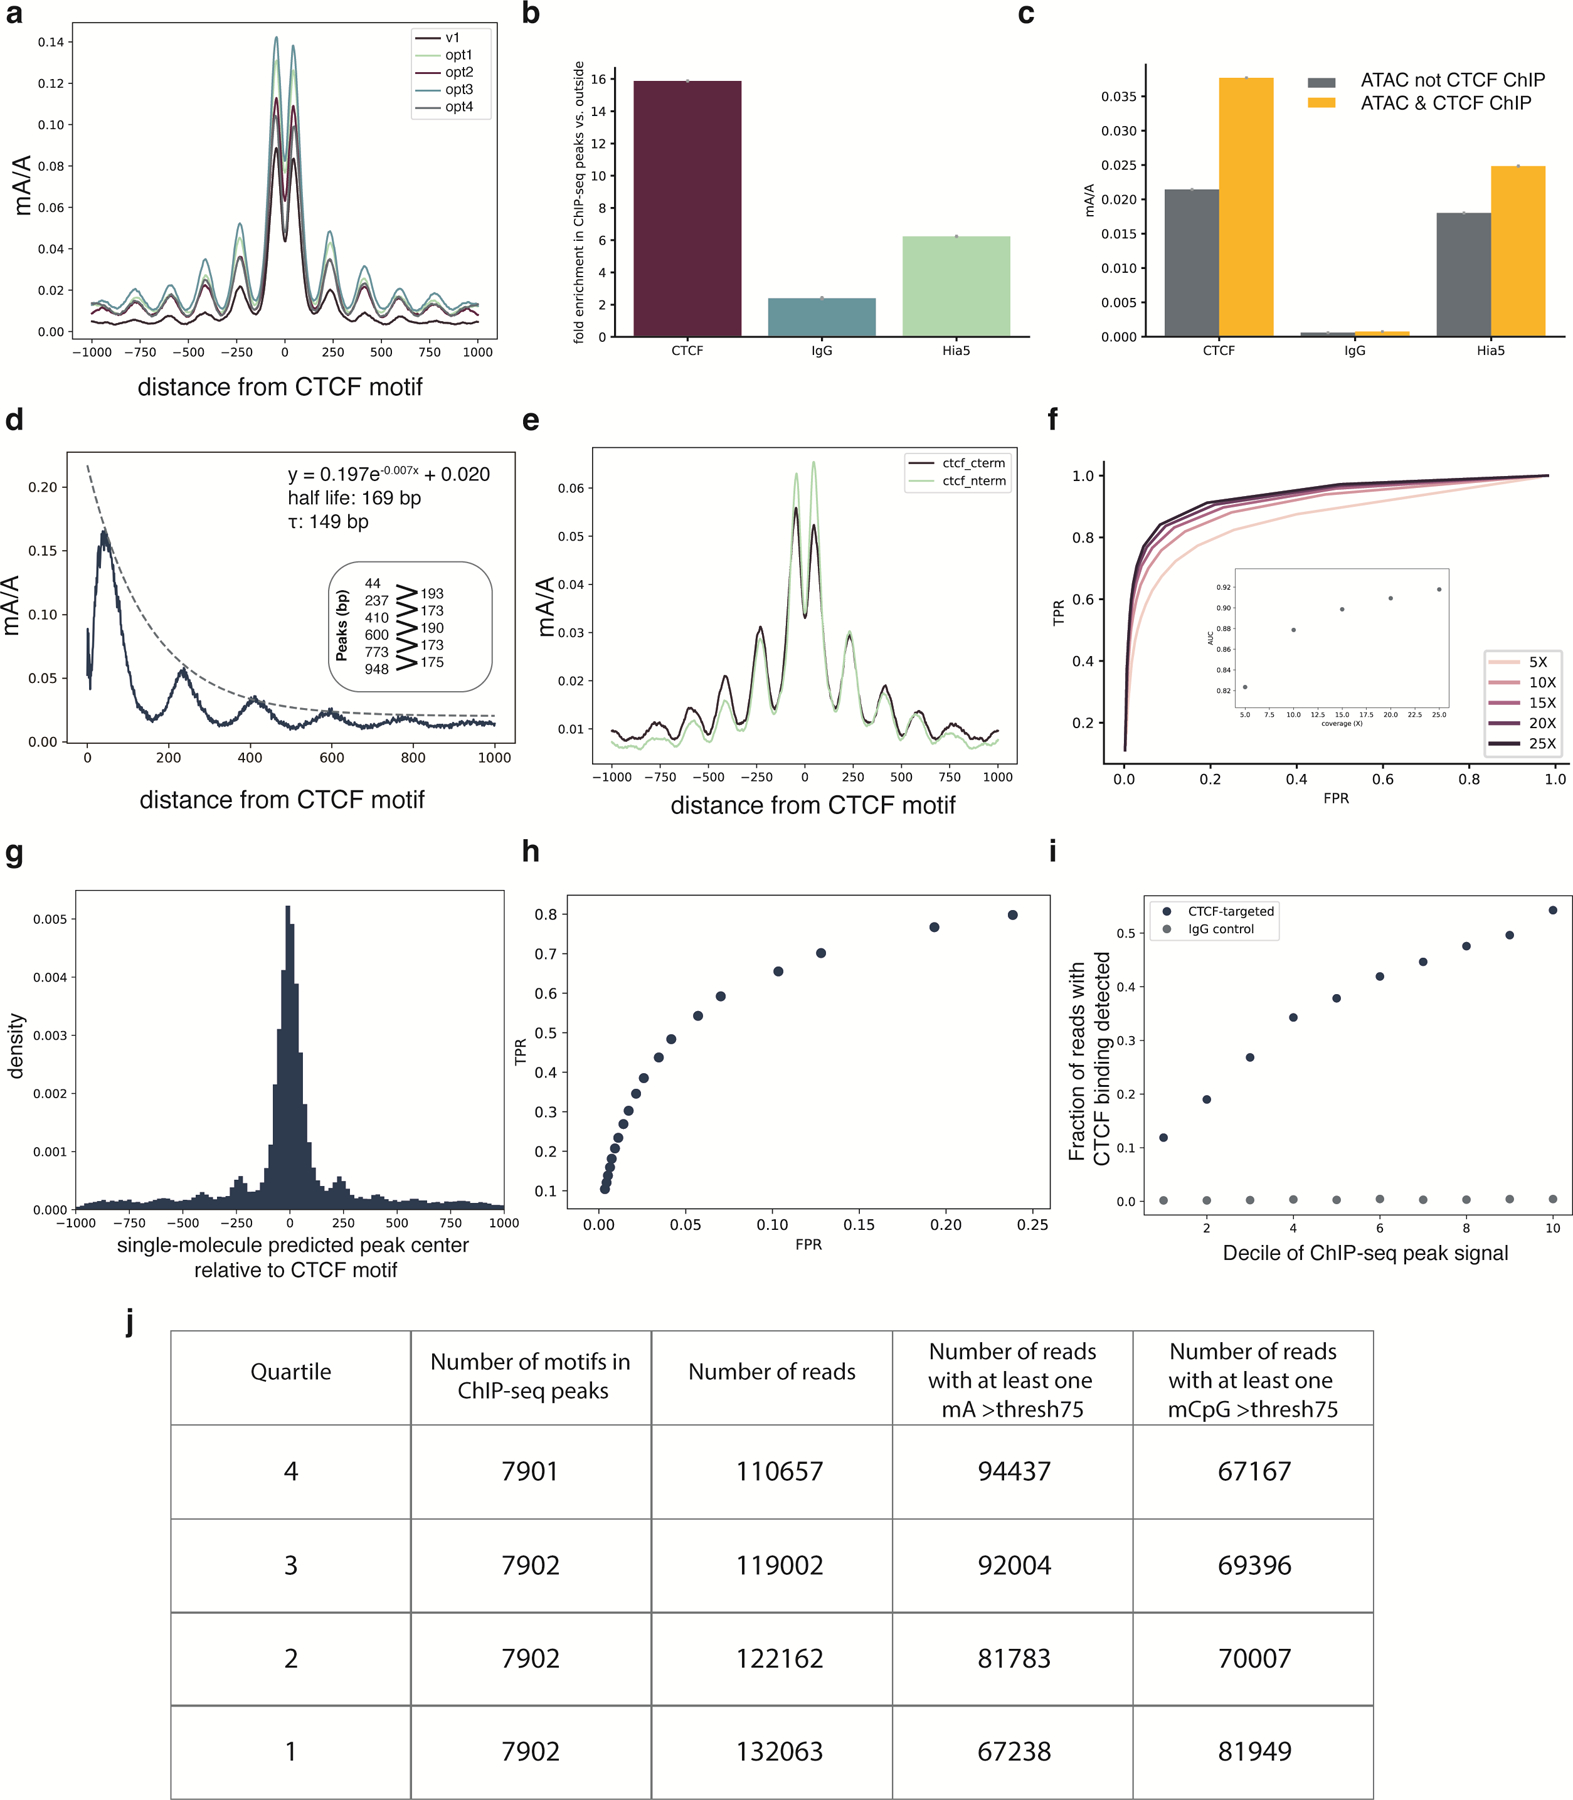
a, Enrichment profiles with mA probability threshold of 0.75 at the top quartile of ChIP-seq peaks for the DiMeLo-seq protocol v1 compared to four optimization conditions (opt1: 2 hour activation, 0.05 mM spermidine at activation, replenish SAM; opt2: 2 hour activation, 0.05 mM spermidine at activation, replenish SAM, 500 nM pA-Hia5; opt3: 2 hour activation, 0.05 mM spermidine at activation, replenish SAM, pA-Hia5 binding at 4°C for 2 hours; opt4: 2 hour activation, no spermidine, 1 mM Ca++ and 0.5 mM Mg++ buffer) (Supplementary Note 11). b, Fold enrichment over background of mA/A in ChIP-seq peak regions. Error bars represent the 95% credible interval for each ratio of proportions determined by sampling proportions from posterior beta distributions computed with uninformative priors. c, mA/A in ATAC-seq peaks that do not overlap CTCF ChIP-seq peaks (grey) and mA/A in ATAC-seq peaks that do overlap CTCF ChIP-seq peaks (yellow). Error bars are computed as in (b) d, Methylation decay from the CTCF motif center for the top decile of ChIP-seq signal is fit with an exponential decay function. The positions of the peaks are indicated, with the spacing between peaks also noted. e, Methylation profiles at top quartile of ChIP-seq peaks when targeting the C-terminus or N-terminus of CTCF. The difference between antibody binding site produces significantly different profiles (Supplementary Note 11). f, Receiver-Operator Characteristic (ROC) curves from aggregate peak calling with DiMeLo-seq targeting CTCF at 5–25X coverage using ChIP-seq as ground truth. Inset shows Area Under the Curve (AUC) as a function of coverage. g, The distribution of differences between our single-molecule predicted peak center and the known CTCF motif are plotted for single molecules within top decile ChIP-seq peaks. h, ROC curve for binary classification of CTCF-targeted DiMeLo-seq reads to identify CTCF-bound molecules based on each read’s proportion of methylated adenines in peak regions (Supplementary Note 11). At a FPR of 5.7%, a TPR of 54% is achieved. i, Fraction of reads that have a CTCF binding event detected in the peak region for each decile of ChIP-seq peak strength for the CTCF-targeted sample and IgG control. Calculated using thresholds determined from analysis in (h). Error bars do not extend beyond the points themselves so are not shown. j, Number of motifs and reads displayed in Figure 4a.
Extended Data Fig. 6. Control mA and mCpG profiles at CTCF peaks.
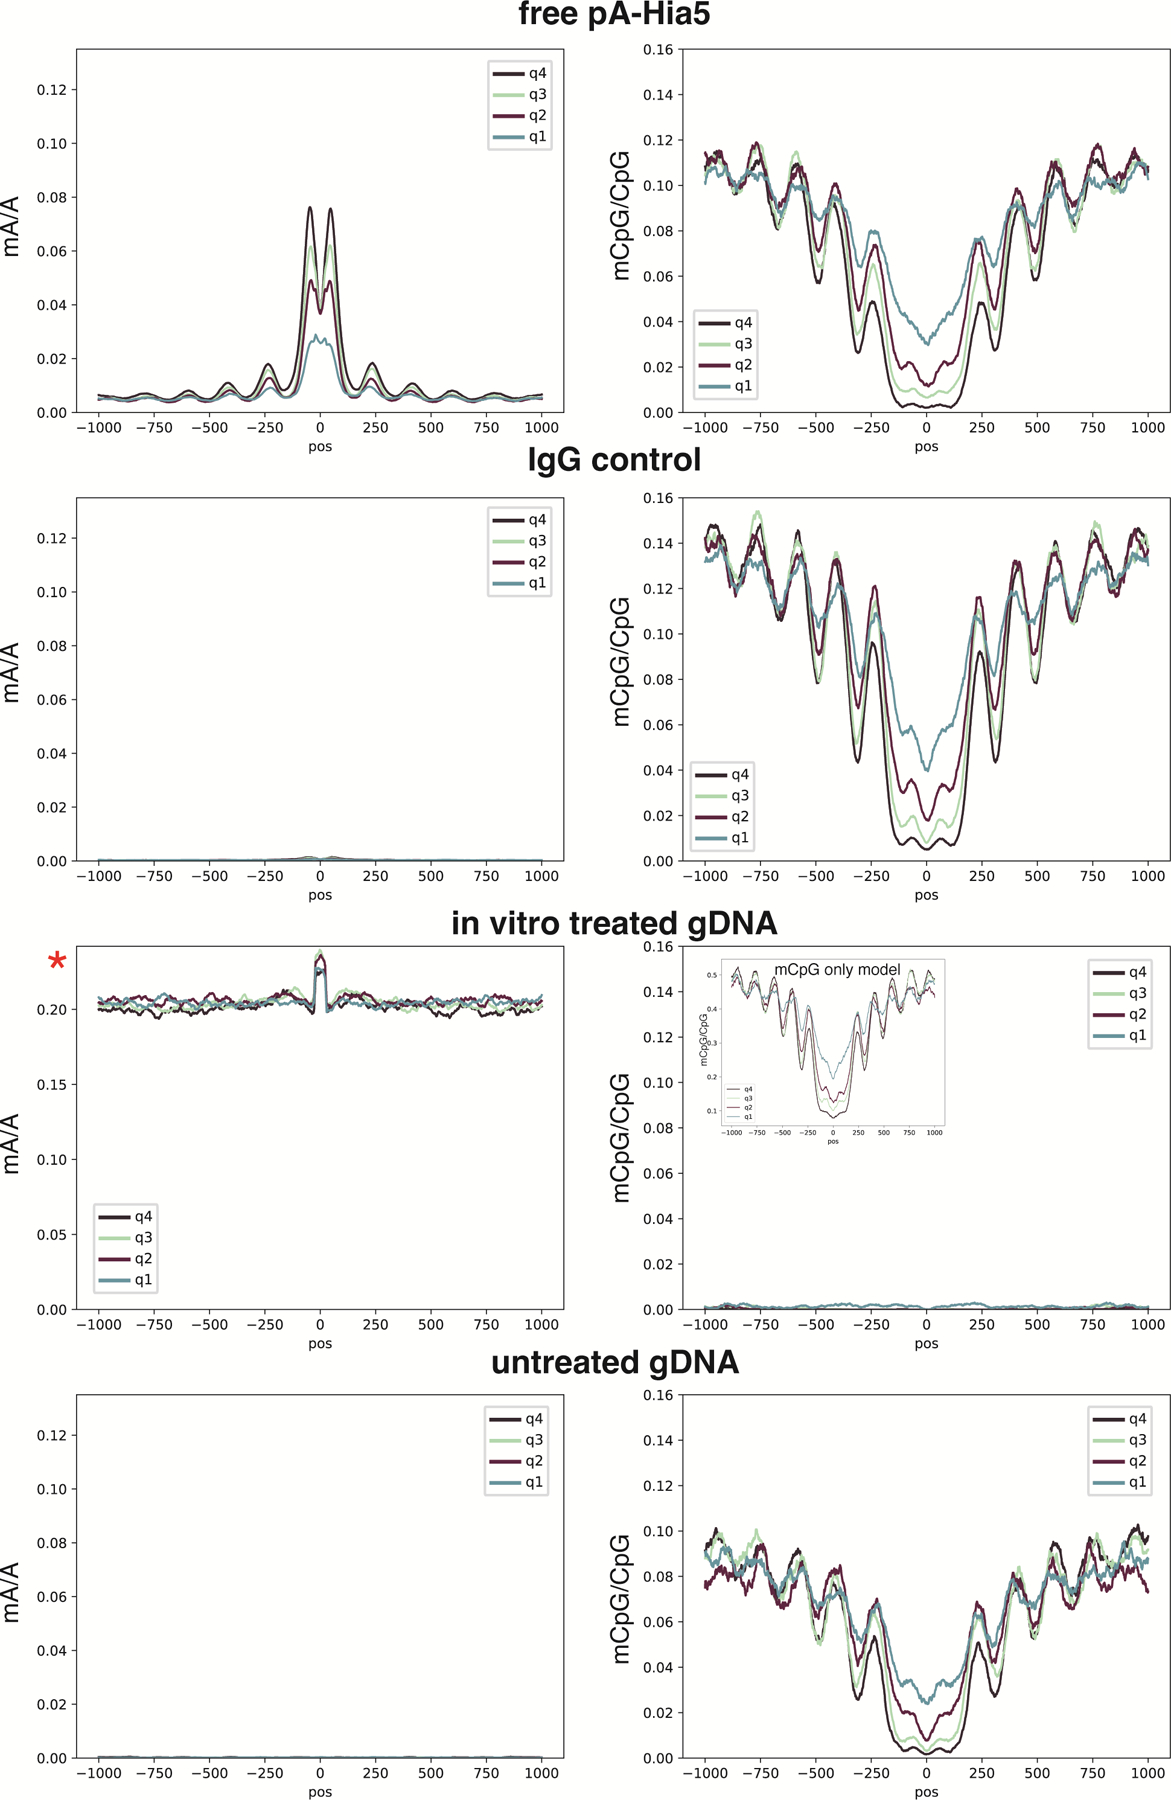
Profiles at CTCF ChIP-seq peaks for free pA-Hia5, IgG control, in vitro treated genomic DNA, and untreated genomic DNA. Quartiles indicate rank of ChIP-seq peak strength. All axes are the same scaling as in Figure 4a, except for mA/A of in vitro treated gDNA. With high mA levels achieved only with this in vitro methylated control, mC basecalling fails. However, if the Rerio model res_dna_r941_min_modbases_5mC_CpG_v001.cfg is used for calling mCpG separately from mA, the mCpG profile is restored, as seen in the inset for the in vitro treated gDNA sample. Importantly, as indicated by the y-axis scale in the inset, if mCpG is called separately from mA, the detected mCpG levels are higher.
Extended Data Fig. 7. Phased CTCF-targeted DiMeLo-seq reads.
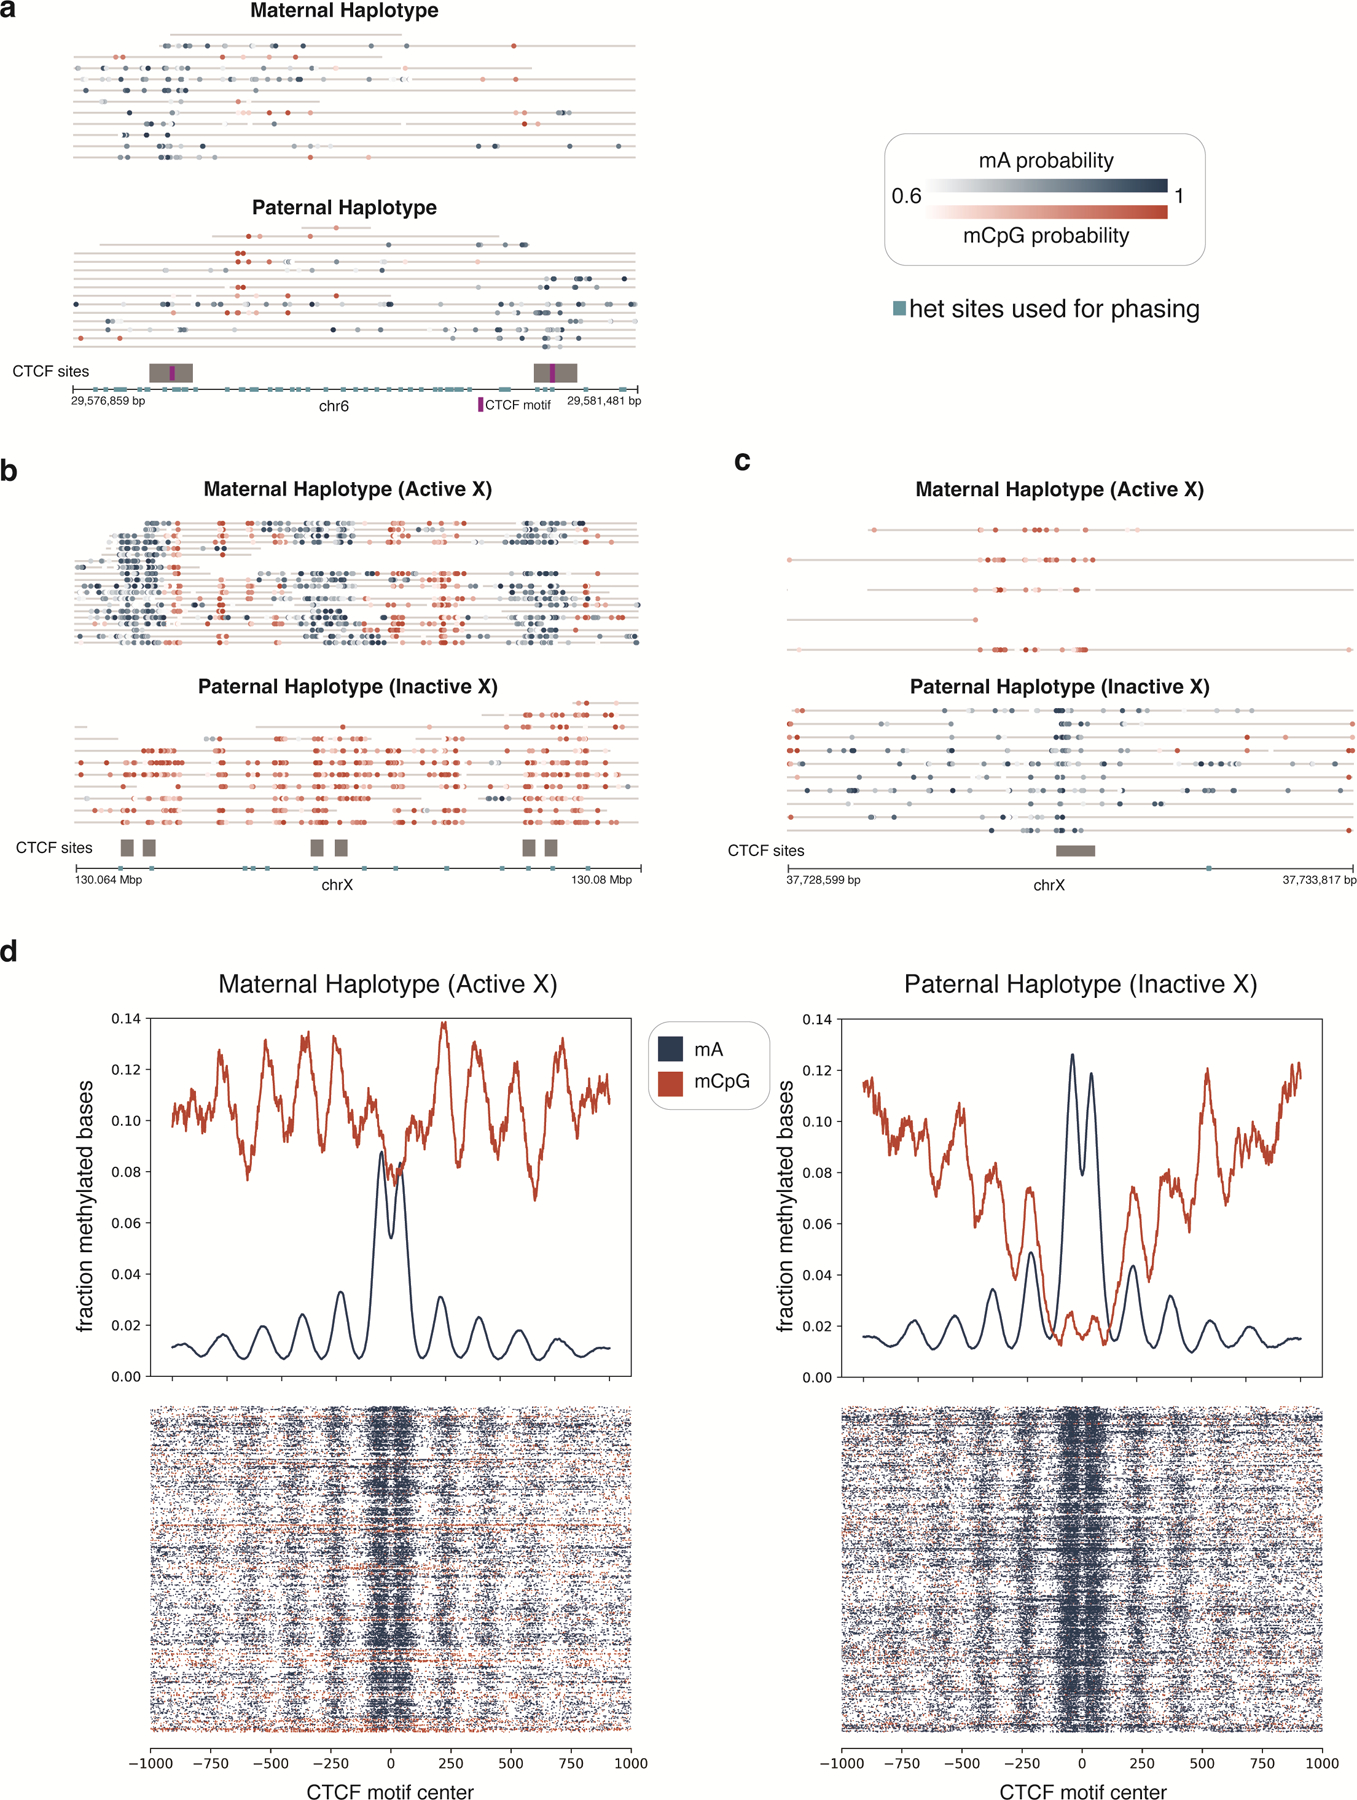
Phased reads across one region on chr6 and two regions on chrX illustrate haplotype-specific CTCF binding due to genetic and epigenetic differences between haplotypes. a, A region on chr6 within the human leukocyte antigen (HLA) locus which contains two CTCF binding sites and many heterozygous SNPs useful for phasing reads. Both CTCF binding sites overlap a het SNP within their binding motif. At the first CTCF site, the paternal SNP allele within the motif is associated with weak or no CTCF binding on the paternal haplotype, and the opposite is true at the second CTCF site. Thus, only one of these two neighboring sites tends to be bound on each haplotype, which is clearly visible on reads spanning both CTCF sites. Further, because CpG methylation patterns are similar between the two haplotypes, these binding differences likely owe to the genetic differences present in/near the CTCF binding motifs themselves. b-c, Because the GM12878 cell line has two X chromosomes and was clonally derived, one X homolog (the paternally inherited X homolog for this cell line) has undergone X inactivation and remains inactive in all cells. Shown here are one region with CTCF binding on the active X only (b) and one region with CTCF binding on the inactive X only (c). The haplotype-specific CTCF binding patterns in these chrX regions appear to be associated with haplotype-specific CpG methylation, as similarly seen for the imprinted H19 locus shown in Fig. 4d. d, Aggregate enrichment profiles from DiMeLo-seq reads across all CTCF sites on chrX are shown, as in Fig. 4b. Each row in the heatmaps below the aggregate plots represents a single molecule centered at the CTCF motif. Notable strips of CpG hypermethylated reads are visible on the active X, as observed previously 12,55.
Extended Data Fig. 8. Comparison of PacBio and Nanopore sequencing platforms for detecting mA from DiMeLo-seq.
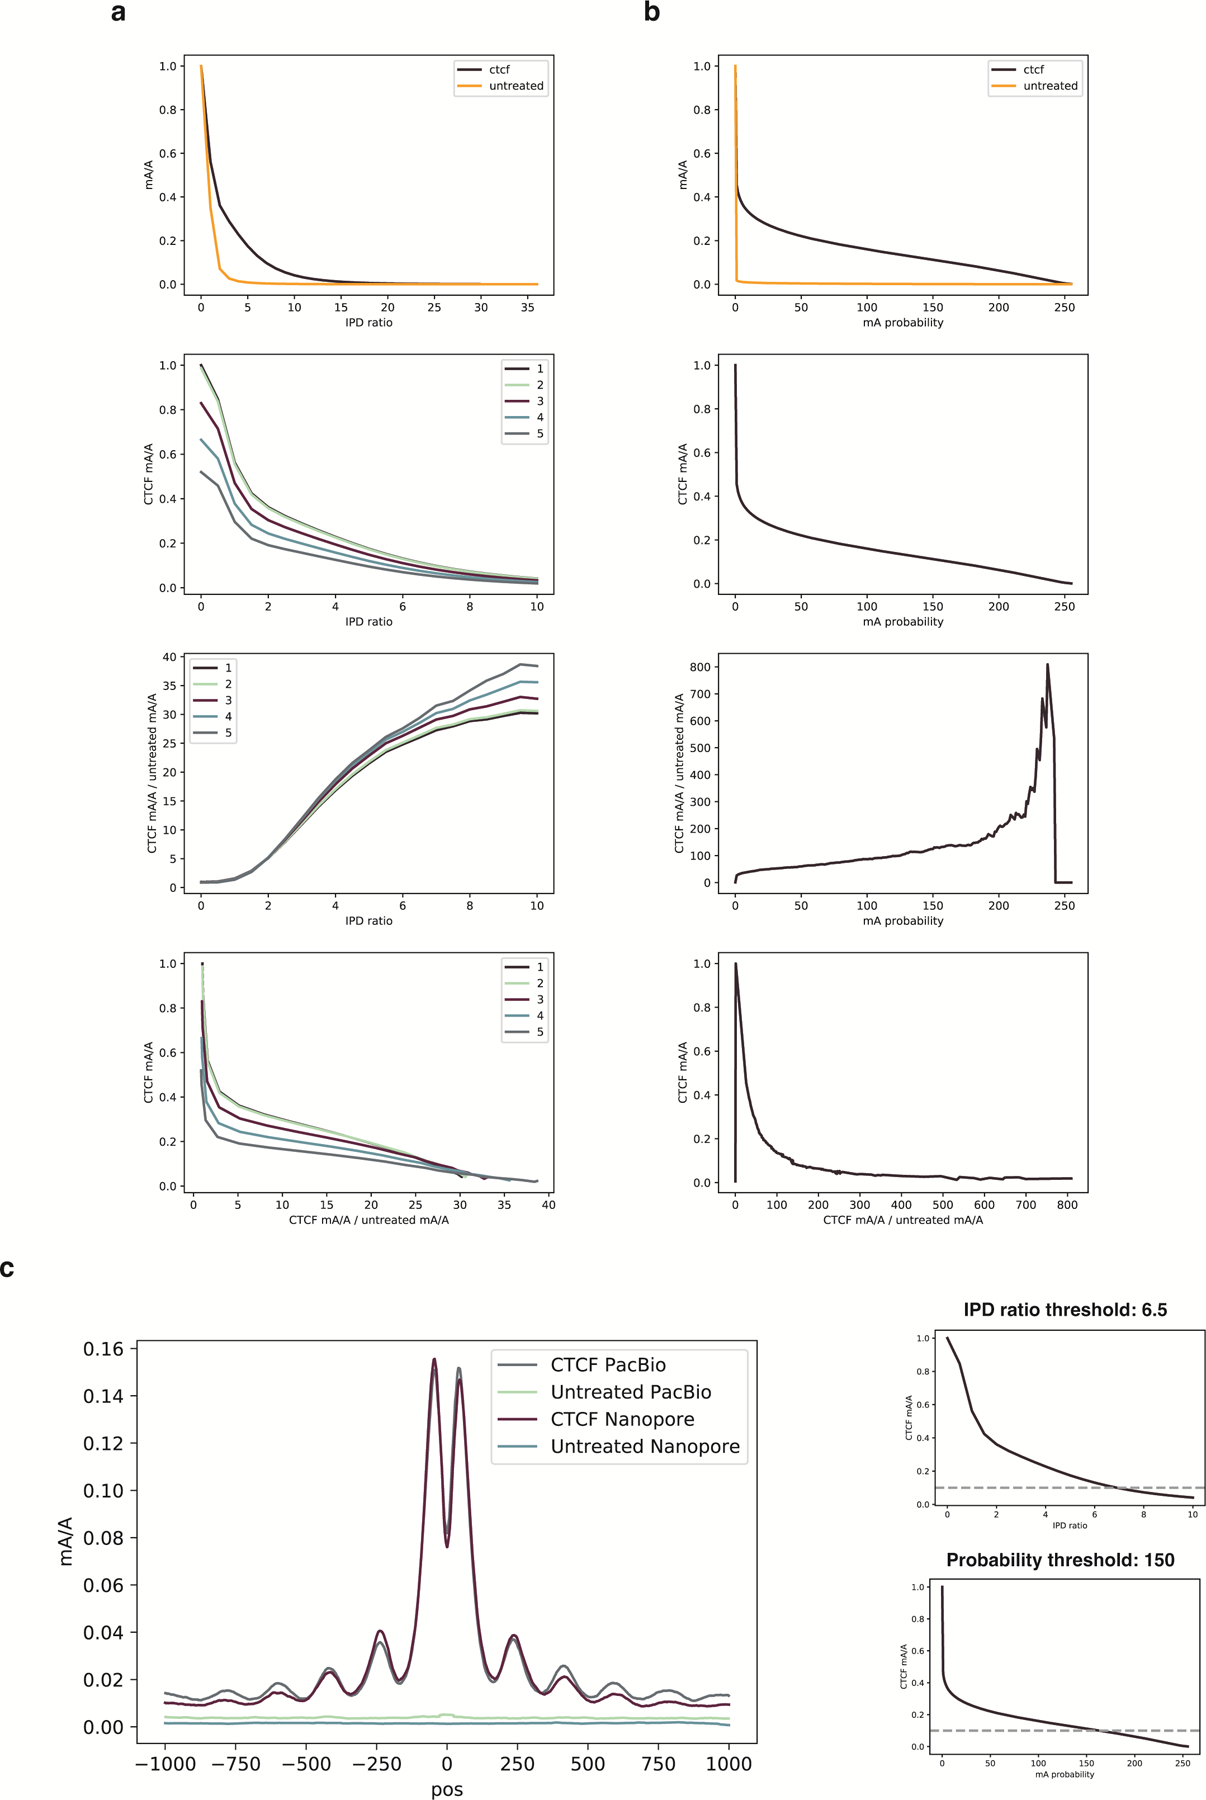
The same DNA from a DiMeLo-seq experiment targeting CTCF in GM12878 cells was sequenced on both PacBio and Nanopore. The same untreated GM12878 DNA was also sequenced on both platforms. Methylated base calls for reads spanning the top decile of CTCF ChIP-seq peaks are analyzed. a, PacBio data. (i) Fraction of adenines methylated +/− 100 bp (“peak region”) from CTCF motif center as a function of IPD ratio for the CTCF-targeted sample and the untreated control. (ii) Fraction of adenines methylated for CTCF-targeted sample in the peak region for various IPD ratio thresholds and number of pass thresholds (indicated in legend from 1 to 5). (iii) Fraction of adenines methylated in the peak region for CTCF-targeted sample over the fraction for the untreated control as a function of IPD ratio and number of passes (indicated in legend from 1 to 5). (iv) Fraction of adenines methylated in the peak region for CTCF-targeted sample versus the enrichment of CTCF-targeted methylation over the untreated control. b, Nanopore data. Same as in (a), but probability of methylation is the threshold that varies rather than IPD ratio and number of passes. c, For a given fraction of adenines methylated in the peak region, here 0.1 for illustration, the PacBio and Nanopore enrichment profiles are overlaid. The thresholds for each platform for 10% peak methylation are indicated and the number of passes threshold for PacBio is one.
Extended Data Fig. 9. H3K9me3 control analysis at HOR boundaries and in centromere 7.
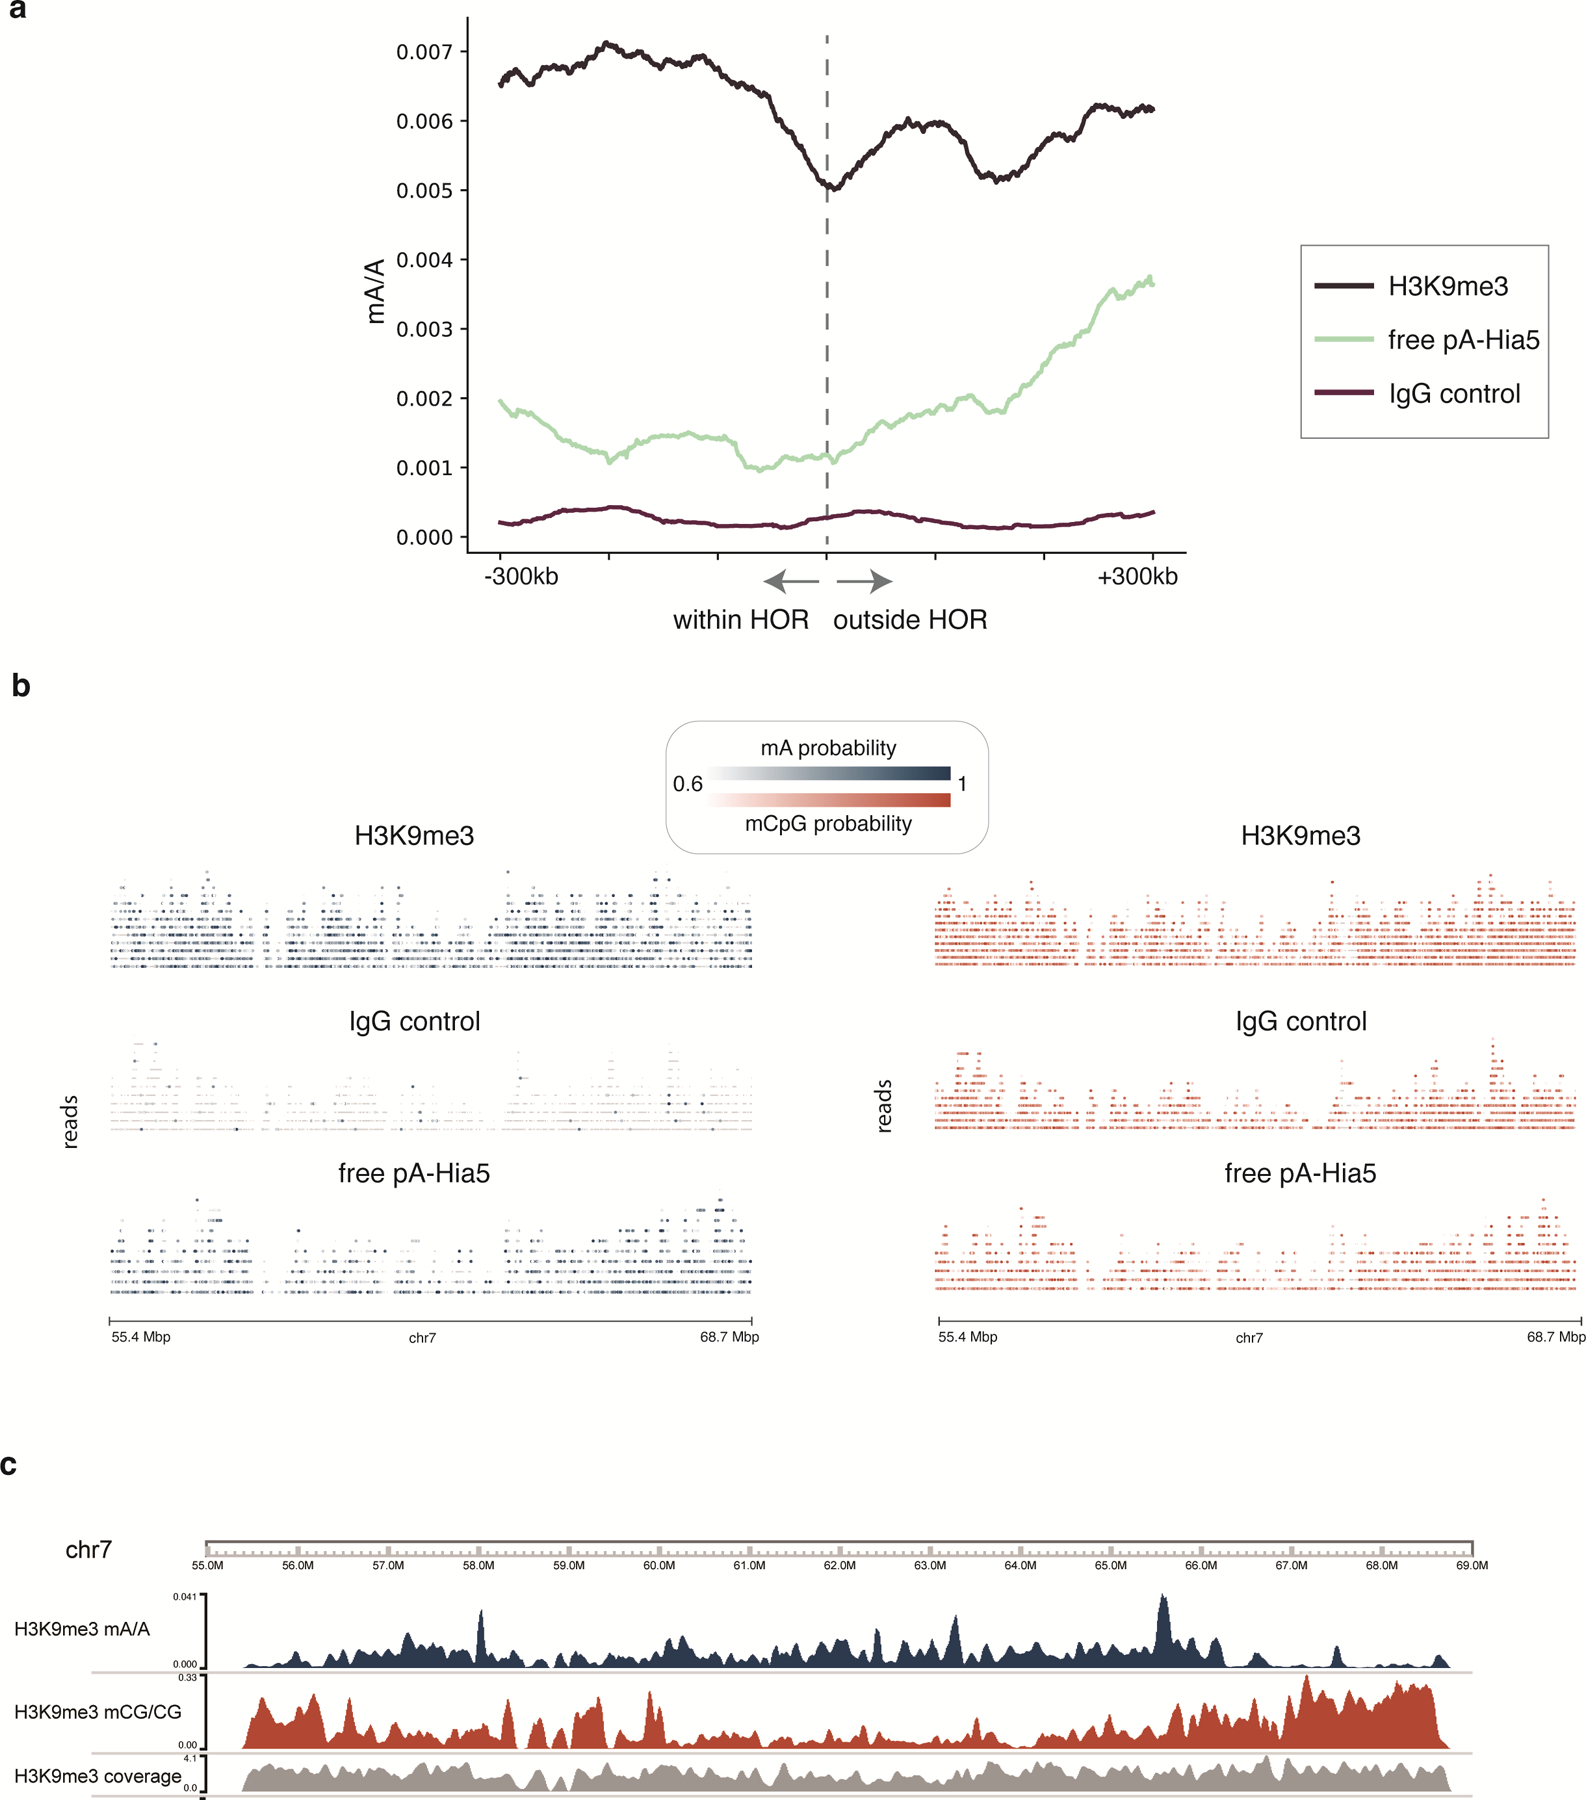
a, Density of methylated adenines for the H3K9me3-targeted sample and IgG and free pA-Hia5 controls in 100 kb sliding window across HOR boundaries 1p, 2pq, 6p, 9p, 13q, 14q, 15q, 16p, 17pq, 18pq, 20p, 21q, 22q. b, Centromere 7 single molecule browser tracks for H3K9me3-targeted sample, IgG control, and free pA-Hia5. The same molecules are shown in both plots, with mA calls indicated in the first, and mCpG calls indicated in the second. c, Coverage tracks in 10-kb bins to accompany mA/A and mCpG/CpG tracks from Figure 5d.
Extended Data Fig. 10. AlphaHOR-RES centromere enrichment and methylation within chromosome X and chromosome 3 HORs.
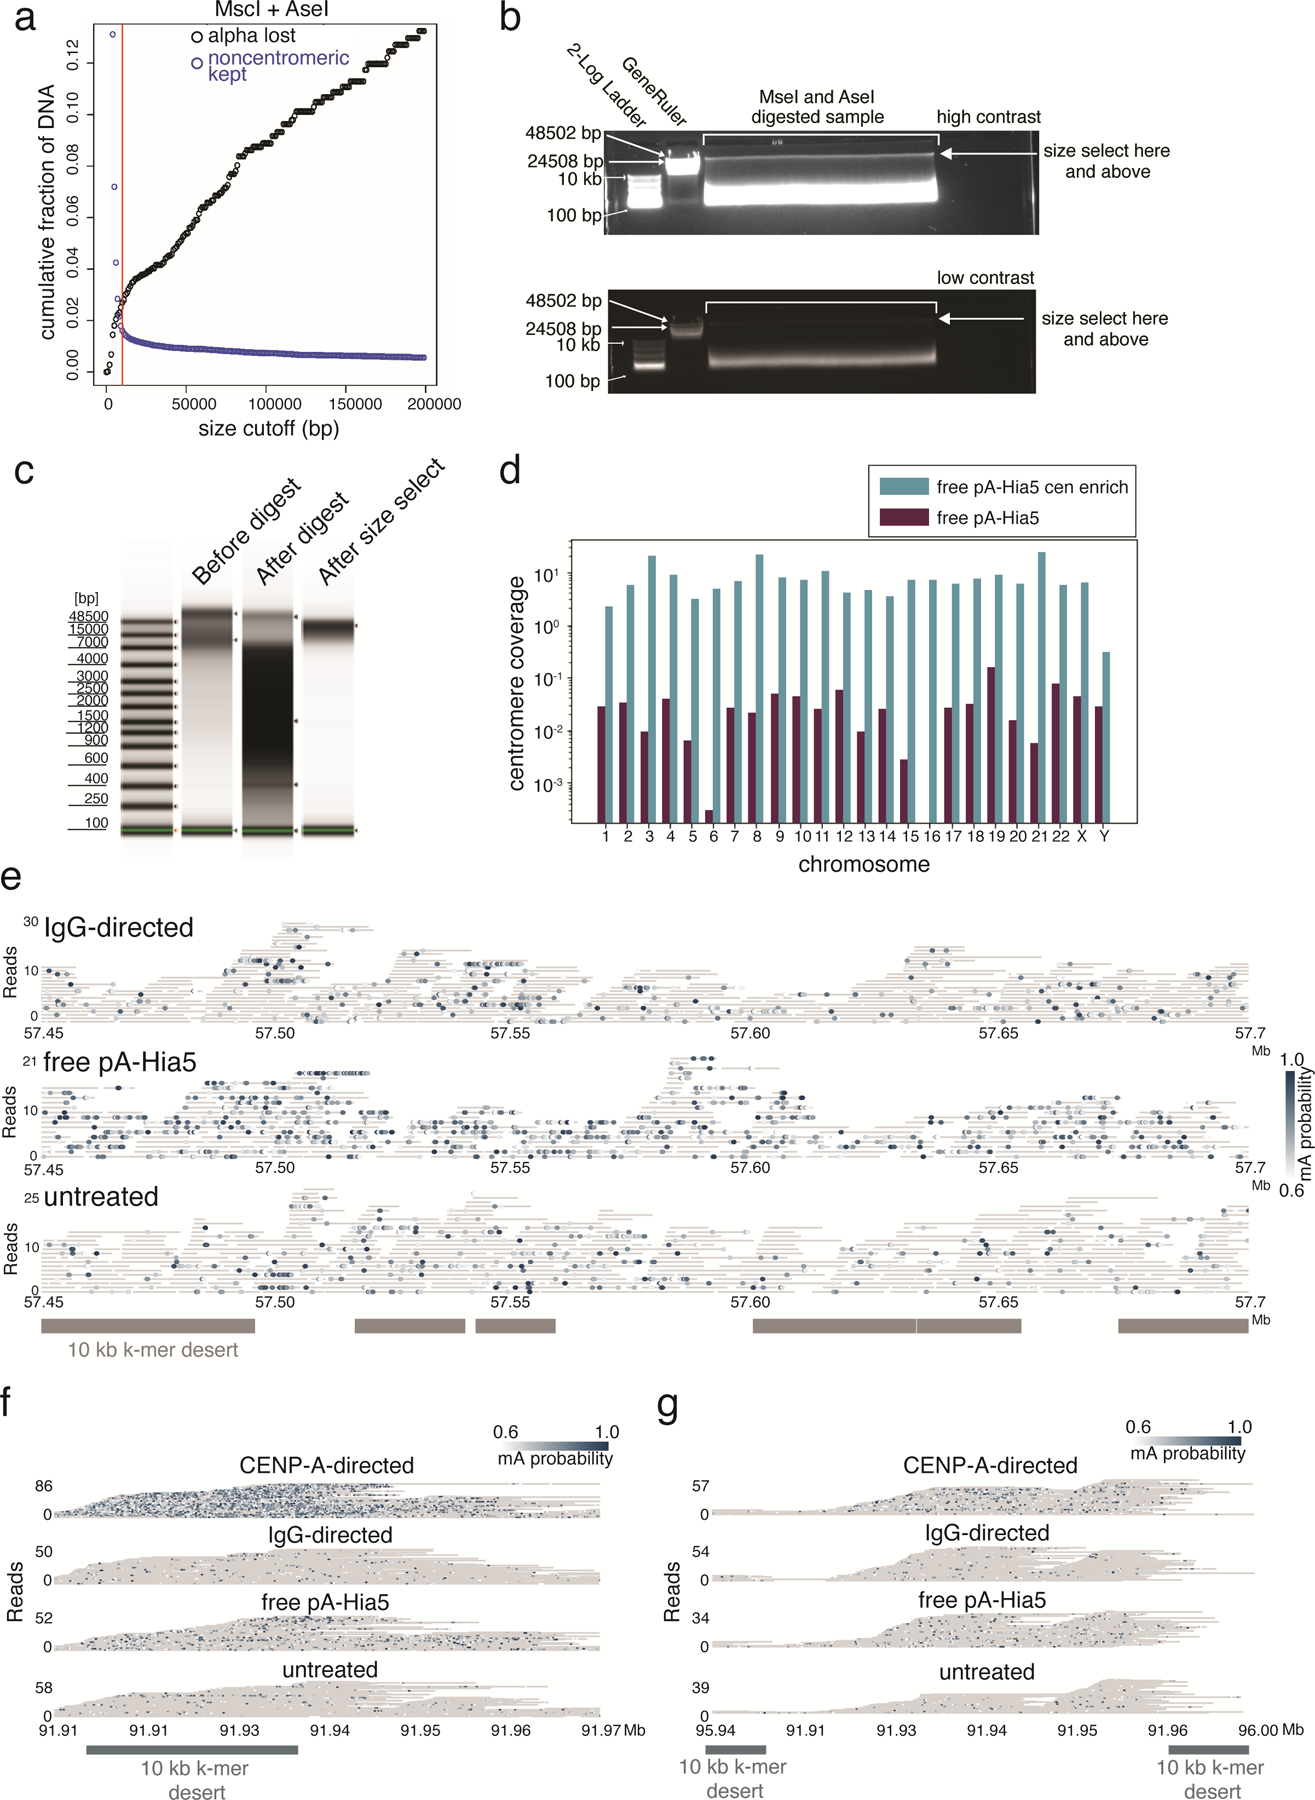
a, Simulated cumulative distribution of the proportion of alpha-satellite DNA lost (black) and non-centromeric DNA kept (blue) after MscI and AseI digestion of the T2T chm13 genome at different size selection cutoffs. b, High (top) and low contrast (bottom) images of agarose gel run on total genomic DNA after Msc1 and Ase1 digestion. Sample recovered from above cut site (arrow). Representative image of at least 4 replicates. c, genomic DNA tapestation gel image of sample before digestion, after digestion, and after size selection. Representative image of at least 3 replicates. d, Coverage of the active HOR on each chromosome from the CHM13+HG002X+hg38Y reference genome from free floating pA-Hia5 DiMeLo-seq libraries with and without AlphaHOR-RES. e-g, Single molecule view with individual reads in gray and mA depicted as dots for the indicated conditions. Scale bar indicates the probability of adenine methylation (from Guppy) between 0.6 and 1. Regions with at least 10 kb without unique 51 bp k-mers shown in grey to illustrate difficult to map locations for short-read sequencing. e. ChrX CDR (57.45 – 57.7 Mb), f. chromosome 3 HOR between 91.91 and 91.97 Mb, g. chromosome 3 HOR between 95.94 and 96.00 Mb.
Supplementary Material
Acknowledgements
We thank Andrew Stergachis for the plasmid encoding Hia5, Gina Caldas for experimental training, and Gary Karpen for helpful discussions. We would like to thank Stanford University and the Stanford Research Computing Center for providing computational resources and support that contributed to these research results. We would like to thank Michelle Tan for her contributions to sequencing. This work was supported by the Chan Zuckerberg Biohub and by the NIGMS of the National Institutes of Health under award number R35GM124916 to AS and R01 GM074728 to AFS. KHM is supported by R21HG010548-01. OKS and RRB are supported by an NIH T32 award, numbers GM113854-02 and GM007279-45 respectively. AM, OKS, and RRB are supported by NSF GRFP awards. NA is an HHMI Hanna H. Gray Fellow. AS is a Chan Zuckerberg Biohub Investigator, and a Pew Scholar in the Biomedical Sciences.
Footnotes
Competing Interests Statement
NA, AM, OKS, KS, AFS, and AS are co-inventors on a patent application related to this work. The remaining authors declare no competing interests.
References
- 1.van Steensel B & Henikoff S Identification of in vivo DNA targets of chromatin proteins using tethered dam methyltransferase. Nat. Biotechnol 18, 424–428 (2000). [DOI] [PubMed] [Google Scholar]
- 2.Mikkelsen TS et al. Genome-wide maps of chromatin state in pluripotent and lineage-committed cells. Nature 448, 553–560 (2007). [DOI] [PMC free article] [PubMed] [Google Scholar]
- 3.Robertson G et al. Genome-wide profiles of STAT1 DNA association using chromatin immunoprecipitation and massively parallel sequencing. Nat. Methods 4, 651–657 (2007). [DOI] [PubMed] [Google Scholar]
- 4.Johnson DS, Mortazavi A, Myers RM & Wold B Genome-wide mapping of in vivo protein-DNA interactions. Science 316, 1497–1502 (2007). [DOI] [PubMed] [Google Scholar]
- 5.Barski A et al. High-resolution profiling of histone methylations in the human genome. Cell 129, 823–837 (2007). [DOI] [PubMed] [Google Scholar]
- 6.Skene PJ & Henikoff S An efficient targeted nuclease strategy for high-resolution mapping of DNA binding sites. Elife 6, (2017). [DOI] [PMC free article] [PubMed] [Google Scholar]
- 7.Rivera CM & Ren B Mapping human epigenomes. Cell 155, 39–55 (2013). [DOI] [PMC free article] [PubMed] [Google Scholar]
- 8.Sönmezer C et al. Molecular Co-occupancy Identifies Transcription Factor Binding Cooperativity In Vivo. Mol. Cell 81, 255–267.e6 (2021). [DOI] [PMC free article] [PubMed] [Google Scholar]
- 9.Nurk S et al. The complete sequence of a human genome. Science 375, (2022). [DOI] [PMC free article] [PubMed] [Google Scholar]
- 10.Abdulhay NJ et al. Massively multiplex single-molecule oligonucleosome footprinting. Elife 9, (2020). [DOI] [PMC free article] [PubMed] [Google Scholar]
- 11.Stergachis AB, Debo BM, Haugen E, Churchman LS & Stamatoyannopoulos JA Single-molecule regulatory architectures captured by chromatin fiber sequencing. Science 368, 1449–1454 (2020). [DOI] [PubMed] [Google Scholar]
- 12.Lee I et al. Simultaneous profiling of chromatin accessibility and methylation on human cell lines with nanopore sequencing. Nat. Methods 17, 1191–1199 (2020). [DOI] [PMC free article] [PubMed] [Google Scholar]
- 13.Shipony Z et al. Long-range single-molecule mapping of chromatin accessibility in eukaryotes. Nat. Methods 17, 319–327 (2020). [DOI] [PMC free article] [PubMed] [Google Scholar]
- 14.Wang Y et al. Single-molecule long-read sequencing reveals the chromatin basis of gene expression. Genome Res 29, 1329–1342 (2019). [DOI] [PMC free article] [PubMed] [Google Scholar]
- 15.Schmid M, Durussel T & Laemmli UK ChIC and ChEC; genomic mapping of chromatin proteins. Mol. Cell 16, 147–157 (2004). [DOI] [PubMed] [Google Scholar]
- 16.van Schaik T, Vos M, Peric-Hupkes D, Hn Celie P & van Steensel B Cell cycle dynamics of lamina-associated DNA. EMBO Rep. 21, e50636 (2020). [DOI] [PMC free article] [PubMed] [Google Scholar]
- 17.O’Brown ZK et al. Sources of artifact in measurements of 6mA and 4mC abundance in eukaryotic genomic DNA. BMC Genomics 20, 445 (2019). [DOI] [PMC free article] [PubMed] [Google Scholar]
- 18.Drozdz M, Piekarowicz A, Bujnicki JM & Radlinska M Novel non-specific DNA adenine methyltransferases. Nucleic Acids Res. 40, 2119–2130 (2012). [DOI] [PMC free article] [PubMed] [Google Scholar]
- 19.Lowary PT & Widom J New DNA sequence rules for high affinity binding to histone octamer and sequence-directed nucleosome positioning. Journal of Molecular Biology vol. 276 19–42 (1998). [DOI] [PubMed] [Google Scholar]
- 20.Guelen L et al. Domain organization of human chromosomes revealed by mapping of nuclear lamina interactions. Nature 453, 948–951 (2008). [DOI] [PubMed] [Google Scholar]
- 21.Meuleman W et al. Constitutive nuclear lamina-genome interactions are highly conserved and associated with A/T-rich sequence. Genome Res. 23, 270–280 (2013). [DOI] [PMC free article] [PubMed] [Google Scholar]
- 22.Altemose N et al. μDamID: A Microfluidic Approach for Joint Imaging and Sequencing of Protein-DNA Interactions in Single Cells. Cell Syst 11, 354–366.e9 (2020). [DOI] [PMC free article] [PubMed] [Google Scholar]
- 23.Sobecki M et al. MadID, a Versatile Approach to Map Protein-DNA Interactions, Highlights Telomere-Nuclear Envelope Contact Sites in Human Cells. Cell Rep. 25, 2891–2903.e5 (2018). [DOI] [PMC free article] [PubMed] [Google Scholar]
- 24.Kind J et al. Genome-wide maps of nuclear lamina interactions in single human cells. Cell 163, 134–147 (2015). [DOI] [PMC free article] [PubMed] [Google Scholar]
- 25.Bell AC & Felsenfeld G Methylation of a CTCF-dependent boundary controls imprinted expression of the Igf2 gene. Nature 405, 482–485 (2000). [DOI] [PubMed] [Google Scholar]
- 26.Song L et al. Open chromatin defined by DNaseI and FAIRE identifies regulatory elements that shape cell-type identity. Genome Res. 21, 1757–1767 (2011). [DOI] [PMC free article] [PubMed] [Google Scholar]
- 27.Boyle AP et al. High-resolution genome-wide in vivo footprinting of diverse transcription factors in human cells. Genome Research vol. 21 456–464 (2011). [DOI] [PMC free article] [PubMed] [Google Scholar]
- 28.Klenova EM et al. CTCF, a conserved nuclear factor required for optimal transcriptional activity of the chicken c-myc gene, is an 11-Zn-finger protein differentially expressed in multiple forms. Molecular and Cellular Biology vol. 13 7612–7624 (1993). [DOI] [PMC free article] [PubMed] [Google Scholar]
- 29.Lobanenkov VV et al. A novel sequence-specific DNA binding protein which interacts with three regularly spaced direct repeats of the CCCTC-motif in the 5’-flanking sequence of the chicken c-myc gene. Oncogene 5, 1743–1753 (1990). [PubMed] [Google Scholar]
- 30.Ohlsson R, Renkawitz R & Lobanenkov V CTCF is a uniquely versatile transcription regulator linked to epigenetics and disease. Trends Genet. 17, 520–527 (2001). [DOI] [PubMed] [Google Scholar]
- 31.Rhee HS & Pugh BF Comprehensive genome-wide protein-DNA interactions detected at single-nucleotide resolution. Cell 147, 1408–1419 (2011). [DOI] [PMC free article] [PubMed] [Google Scholar]
- 32.Boyle AP et al. High-resolution genome-wide in vivo footprinting of diverse transcription factors in human cells. Genome Res. 21, 456–464 (2011). [DOI] [PMC free article] [PubMed] [Google Scholar]
- 33.Kelly TK et al. Genome-wide mapping of nucleosome positioning and DNA methylation within individual DNA molecules. Genome Res. 22, 2497–2506 (2012). [DOI] [PMC free article] [PubMed] [Google Scholar]
- 34.Wenger AM et al. Accurate circular consensus long-read sequencing improves variant detection and assembly of a human genome. Nat. Biotechnol 37, 1155–1162 (2019). [DOI] [PMC free article] [PubMed] [Google Scholar]
- 35.Gershman A et al. Epigenetic Patterns in a Complete Human Genome. Science 375, (2022). [DOI] [PMC free article] [PubMed] [Google Scholar]
- 36.Altemose N et al. Complete genomic and epigenetic maps of human centromeres. Science 375, (2022). [DOI] [PMC free article] [PubMed] [Google Scholar]
- 37.McNulty SM & Sullivan BA Alpha satellite DNA biology: finding function in the recesses of the genome. Chromosome Res. 26, 115–138 (2018). [DOI] [PMC free article] [PubMed] [Google Scholar]
- 38.Rudd MK, Schueler MG & Willard HF Sequence organization and functional annotation of human centromeres. Cold Spring Harb. Symp. Quant. Biol 68, 141–149 (2003). [DOI] [PubMed] [Google Scholar]
- 39.Willard HF & Waye JS Hierarchical order in chromosome-specific human alpha satellite DNA. Trends Genet. 3, 192–198 (1987). [Google Scholar]
- 40.Miga KH et al. Centromere reference models for human chromosomes X and Y satellite arrays. Genome Res. 24, 697–707 (2014). [DOI] [PMC free article] [PubMed] [Google Scholar]
- 41.Hayden KE et al. Sequences associated with centromere competency in the human genome. Mol. Cell. Biol 33, 763–772 (2013). [DOI] [PMC free article] [PubMed] [Google Scholar]
- 42.Logsdon GA et al. The structure, function and evolution of a complete human chromosome 8. Nature 593, 101–107 (2021). [DOI] [PMC free article] [PubMed] [Google Scholar]
- 43.Lica L & Hamkalo B Preparation of centromeric heterochromatin by restriction endonuclease digestion of mouse L929 cells. Chromosoma 88, 42–49 (1983). [DOI] [PubMed] [Google Scholar]
- 44.Smith OK et al. Identification and characterization of centromeric sequences in Xenopus laevis. Genome Res. 31, 958–967 (2021). [DOI] [PMC free article] [PubMed] [Google Scholar]
- 45.Miga KH et al. Telomere-to-telomere assembly of a complete human X chromosome. Nature 585, 79–84 (2020). [DOI] [PMC free article] [PubMed] [Google Scholar]
- 46.Bodor DL et al. The quantitative architecture of centromeric chromatin. Elife 3, e02137 (2014). [DOI] [PMC free article] [PubMed] [Google Scholar]
- 47.Aldrup-MacDonald ME, Kuo ME, Sullivan LL, Chew K & Sullivan BA Genomic variation within alpha satellite DNA influences centromere location on human chromosomes with metastable epialleles. Genome Res. 26, 1301–1311 (2016). [DOI] [PMC free article] [PubMed] [Google Scholar]
- 48.Gilpatrick T et al. Targeted nanopore sequencing with Cas9-guided adapter ligation. Nat. Biotechnol 38, 433–438 (2020). [DOI] [PMC free article] [PubMed] [Google Scholar]
- 49.Kovaka S, Fan Y, Ni B, Timp W & Schatz MC Targeted nanopore sequencing by real-time mapping of raw electrical signal with UNCALLED. Nat. Biotechnol 39, 431–441 (2021). [DOI] [PMC free article] [PubMed] [Google Scholar]
- 50.Gamba R et al. A method to enrich and purify centromeric DNA from human cells. bioRxiv 2021.09.24.461328 (2021) doi: 10.1101/2021.09.24.461328. [DOI] [Google Scholar]
- 51.Meers MP, Bryson TD, Henikoff JG & Henikoff S Improved CUT&RUN chromatin profiling tools. Elife 8, (2019). [DOI] [PMC free article] [PubMed] [Google Scholar]
- 52.Cao S, Zhou K, Zhang Z, Luger K & Straight AF Constitutive centromere-associated network contacts confer differential stability on CENP-A nucleosomes in vitro and in the cell. Mol. Biol. Cell 29, 751–762 (2018). [DOI] [PMC free article] [PubMed] [Google Scholar]
- 53.Zhou K et al. CENP-N promotes the compaction of centromeric chromatin. doi: 10.1101/2021.06.14.448351. [DOI] [PMC free article] [PubMed] [Google Scholar]
- 54.Kim BY et al. Highly contiguous assemblies of 101 drosophilid genomes. bioRxiv 2020.12.14.422775 (2020) doi: 10.1101/2020.12.14.422775. [DOI] [PMC free article] [PubMed] [Google Scholar]
- 55.Hellman A & Chess A Gene body-specific methylation on the active X chromosome. Science 315, 1141–1143 (2007). [DOI] [PubMed] [Google Scholar]
Associated Data
This section collects any data citations, data availability statements, or supplementary materials included in this article.
Supplementary Materials
Data Availability Statement
All raw fast5 sequencing data are available in the SRA with BioProject accession PRJNA752170. These data were used to produce Figures 2–6, Extended Data Figures 1–10, Supplementary Tables 1–3, and Supplementary Figure 2. CTCF ChIP-seq peak bed file for GM12878 is available from ENCODE Project Consortium with accession code ENCFF797SDL. ATAC-seq peak bed file for GM12878 is available from ENCODE Project Consortium with accession code ENCFF748UZH. Bulk and single-cell DamID data were obtained from GEO with accession GSE156150. H3K9me3 CUT&RUN data are from Altemose et al.36 and accessible in the SRA with BioProject accession PRJNA752795. Data for Figure 6c used CHM13 CENP-A ChIP-seq data for CENP-A kmer analyses which are available at Bioproject accession number PRJNA559484 from Logsdon et al.42. Data for the CpG methylation track in Figure 6d were obtained from data available at https://github.com/nanopore-wgs-consortium/CHM13 35.


