Abstract
Background
The global morbidity and mortality of prostate cancer (PCa) increase sharply every year. Early diagnosis is essential; it determines survival and outcome. So, this study extracted the texture features of apparent diffusion coefficient images in multiparametric magnetic resonance imaging (mp-MRI) and built machine learning models based on radiomics texture analysis (TA) to determine its ability to distinguish benign from PCa lesions using the Prostate Imaging Reporting and Data System (PI-RADS) 4/5 score.
Methods
We enrolled 103 patients who underwent mp-MRI examinations and transrectal ultrasound and magnetic resonance fusion imaging (TRUS-MRI) targeted prostate biopsy and obtained pathological confirmation at our hospital from August 2017 to January 2020. We used ImageJ software to obtain texture feature parameters based on apparent diffusion coefficient (ADC) images, then standardized texture feature parameters, and used LASSO regression to reduce multiple feature parameters; 70% of the cases were randomly selected from the PCa group and the benign prostate hyperplasia group as the training set. The remaining 30% was used as the test set. The machine learning classification model for identifying benign and malignant prostate lesions was constructed using the feature parameters after dimensionality reduction. The clinical indicators were statistically analyzed, and we constructed a machine learning classification model based on clinical indicators of benign and malignant prostate lesions. Finally, we compared the model’s performance based on radiomics texture features and clinical indicators to identify benign and malignant prostate lesions in PI-RADS 4/5 score.
Results
The area under the curve (AUC) of the R-logistic model test set was 0.838, higher than the R-SVM and R-AdaBoost classification models. At this time, the corresponding R-logistic classification model formula is as follow: Y_radiomics=9.396-7.464*median ADC-0.584*kurtosis+0.627*skewness+0.576*MRI lesions volume; analysis of clinical indicators shows that the corresponding C-logistic classification model formula is as follows: Y_clinical =-2.608+0.324*PSA-3.045*Fib+4.147*LDL-C, the AUC value of the model training set was 0.860, smaller than the training set R-logistic classification model AUC value of 0.936.
Conclusions
Radiomics combined with the machine learning classifier model has strong classification performance in identifying benign and PCa in PI-RADS 4/5 score. Various treatments and outcomes for PCa patients can be applied clinically.
Keywords: Prostate cancer (PCa), radiomics, texture feature analysis, machine learning, Prostate Imaging Reporting and Data System score (PI-RADS score) score
Introduction
Prostate cancer (PCa) is a common malignancy among adult men in the United States. According to the national malignant tumor survey results, the incidence of PCa is 63.4%, and the fatality rate has reached 26.6% (1). PCa ranks third behind lung cancer and colorectal cancer for causes of death among American men (2,3). Recently, the mortality rate among new cases with PCa in China has increased sharply. The primary pathogenic factors were family member genetics, age, and living habits. Currently, it is the fastest-growing malignancy in men, primarily occurring in middle-aged and older men (4).
The diagnosis methods for PCa include digital rectal examination (DRE), transrectal ultrasound (TRUS), prostate-specific antigen (PSA), magnetic resonance imaging (MRI), and prostate biopsy. TRUS can obtain images from selected biopsy sites but cannot detect all areas affected by PCa. Although the pathologic specificity of PSA screening for PCa is relatively high, factors such as benign prostatic hyperplasia, urinary retention, prostate massage, and frequent sexual activity also increase PSA levels, and patients with relatively high PSA levels still require a prostate biopsy to establish the diagnosis (5). The benign lesions or PCa determines the treatment and outcome; therefore, it is essential to identify simple, effective, accurate, and specific methods.
With the development of medical imaging technology, the role of MRI in clinical practice has extended to various stages, including tumor detection, disease monitoring during active surveillance, and sequential imaging for follow-up. It is one of the essential methods for clinical diagnosis of PCa at present (6,7). The Prostate Imaging Reporting and Data System (PI-RADS V2) is a standardized prostate mp-MRI solution that combines anatomical T2-weighted images (T2WIs) with one or more functional sequences, diffusion-weighted imaging (DWI), and dynamic contrast enhancement sequences.
Radiomics can capture the properties of tissues and lesions, including the shape and heterogeneity of the tumor. Much mining TF data can be extracted from conventional medical examination images with high throughput through a computer-aided diagnosis system. Studies showed that radiomics TF is associated with the heterogeneity index at the cellular level (8). The application of this method in PCa enables the automatic localization of the disease and provides a noninvasive solution to evaluate the biological characteristics of the tumor. Some investigators have used it to predict PCa (9). Merisaari et al. evaluated the characteristic texture parameters of prostate DWI-derived texture features, including Sobel, Kirch, Gradient, the repeatability of Zernike Moments, and other machine learning methods in PCa characterization showed that the surface-volume ratio and angle detector of DWI could classify the unknown data (10).
Machine learning (ML) regressions have been widely used (11-13). Their advantage lies in their ability to analyze large amounts of data (14). ML methods automatically collect selective clinical disease information from large-scale data, and this feature has proven to carry significant value for diagnosis, classification, outcome, and other aspects. The construction of a disease prediction or classification model based on ML regression streamlines auxiliary diagnosis and early risk warning, helps clinicians make efficient diagnoses, reduces time and costs, and reduces the risks associated with a prostate biopsy. Bernatz et al. used a machine-learning algorithm to analyze the performance of texture features and quantitative computational analysis of apparent diffusion coefficient (ADC) images; the authors showed that texture features improved the diagnostic accuracy of clinical assessment categories while identifying combinations of features and models that reduce overall accuracy (15).
Most relevant studies focused on diagnosis and outcome prediction of PCa based on many texture feature parameters derived from the PyRadiomics package and ML (16-20). However, at present, there has been less study of prostate imaging texture analysis (TA), PI-RADS V2 score, and clinical indicators combined with ML regression to build a prediction model for differentiating benign and malignant lesions of PCa.
Therefore, this study was based on the PI-RADS V2 version (21). Patients with PI-RADS V2 score 4/5 were selected, and three ML methods were applied. The models were analyzed on receiver operating characteristic curve (ROC), and the performance of each prediction model was judged by comparing the area under the curve (AUC). We did this to provide a reference model for discriminating benign from malignant prostatic lesions in patients with PI-RADS 4/5 score and to provide a new research approach to reduce overtreatment. We present the following article in accordance with the TRIPOD reporting checklist (available at https://tcr.amegroups.com/article/view/10.21037/tcr-21-2271/rc).
Methods
The study was conducted in accordance with the Declaration of Helsinki (as revised in 2013). The study was approved by the Ethics Committee of the First Affiliated Hospital of Suzhou University (No. 2021162) and informed consent was taken from all the patients.
Selection of clinical cases
The subjects were clinical imaging data of 250 patients who underwent TRUS/MRI-targeted prostate biopsy at our hospital from August 2017 to January 2020. Indicators included body mass index (kg/m2), PSA (ng/mL), free PSA (ng/mL), white blood cells (109/L), fibrinogen (g/L), albumin (g/L), neutrophil-lymphocyte ratio, C-reactive protein (mg/L), platelet count (109/L), low-density lipid protein cholesterol (mg/dL), high-density lipoprotein cholesterol (mg/dL), and triglyceride (mol/L). The three chief physicians of the Department of Radiology in our hospital follow Table 1, 103 case samples were collected, including 20 cases in the benign prostate hyperplasia group and 83 cases in the PCa group, with a median age of 71 years (70.32±8.81 years). We deleted the case data in which the pathological description area did not match the results of MRI images or where the whole tumor boundary could not be accurately delineated.
Table 1. Case selection standards.
| Criteria | Standard |
|---|---|
| Inclusion criteria | The mp-MRI scan was performed before surgery |
| The PI-RADS V2 score was 4/5 | |
| Prostatic biopsy results confirmed prostatic hyperplasia or PCa | |
| Exclusion criteria | Patients with contraindication of MRI examination |
| The quality of MRI images was not good, or the images were incomplete and could not be analyzed | |
| Patients with prostatitis, acute infectious diseases, hematologic diseases, and other diseases that may cause changes in systemic inflammatory indicators |
mp-MRI, multiparametric magnetic resonance imaging; PI-RADS, Prostate Imaging Reporting and Data System; PCa, prostate cancer.
Pathological grouping
All patients underwent TRUS/MRI-targeted biopsy to obtain pathological results. Tissue specimens were fixed with 10% formalin, sections were embedded in paraffin, and routine HE staining was performed. The films were read by senior pathologists and confirmed by the pathological diagnosis as benign prostate hyperplasia (BPH) or PCa. Twenty cases were in the BPH group, and 83 cases were in the PCa group (22).
Acquisition and processing of MRI images
All patients were examined using 3.0T mp-MRI (Siemens Skyra) and 8-channel phased-front abdominal signal reception, including the prostate gland and bilateral seminal vesicles. The parameters are shown in Table 2.
Table 2. The parameters of the mp-MRI scan sequence.
| mp-MRI | Sequence | TR/TE (ms) | Distance factor (ms) | NSA | FOV (mm) | Matrix |
|---|---|---|---|---|---|---|
| T1WI | TSE | 700/13 | 5/0.5 | 1 | 320×250 | 0.5×0.5×3 |
| T2WI | TSE | 4,000/89 | 3/0 | 3 | 640×640 | 0.5×0.5×3 |
| DWI (b =800, 1,000, 2,000) | 2D-EPI | 4000/56 | 3/0 | 8 | 160×296 | 1.3×1.3×3 |
| T1WI-DCE | TWIST | 3.22/1.18 | 3/0 | 1 | 512×512 | 1.4×1.4×3 |
mp-MRI, multiparametric magnetic resonance imaging; TR, repetition time; TE, echo time; NSA, number of signal averaged; FOV, field of view; T1WI, T1-weighted image; T2WI, T2-weighted image; DWI, diffusion-weighted imaging; DCE, Dynamic Enhanced; TSE, urbo spin echo; 2D-EPI, 2D-echo planar imaging; TWIST, Time-resolved Angiography with Stochastic Trajecories.
All MRI images were downloaded from the PACS system in DICOM format from conventional T2WI, DWI, and DCE-MRI for subsequent processing. The results of the PI-RADS v2 score were evaluated by two professionally trained radiologists and were scored strictly according to the PI-RADS v2 score criteria: 1 – very low likelihood of cancer; 2 – low likelihood of cancer; 3 – moderate likelihood of cancer; 4 – high likelihood of cancer; and 5 – very high likelihood of cancer. The scoring criteria of PI-RADS v2 are shown in Tables 3-7. The scoring criteria of PI-RADS v2 are shown in Tables 3-7.
Table 3. PI-RADS v2 T2WI score.
| T2WI | Standards grading |
|---|---|
| Peripheral zone | |
| 1 score | The signal intensity is uniform and high |
| 2 score | Linear, wedge-shaped, or diffuse mild low signal with unclear boundary |
| 3 score | The signal intensity is not uniform, or the boundary is not clear, is round, medium-low signal, including other does not meet 2, 4, or 5 points standard |
| 4 score | Confined to the prostate, well defined, uniformly moderately low, signal lesion or mass, maximum diameter <1.5 cm |
| 5 score | The imaging findings were the same as those of 4 points, but the maximum diameter was more than or equal to 1.5 cm, or there was a straightforward extension or invasion to the prostate |
| Transition zone | |
| 1 score | Uniform medium signal strength (normal) |
| 2 score | Localized hypointense or inhomogeneous enveloped lesions (prostatic hyperplasia) |
| 3 score | Blurred edges, uneven signal strength, including others that do not meet 2, 4, or 5 score criteria |
| 4 score | Lenticular or ill-defined, uniform moderately low signal, maximum diameter <1.5 cm |
| 5 score | Imaging findings were the same as 4 points, but the maximum diameter was ≥1.5 cm, or there was a definite extension or invasion out of the prostate |
PI-RADS, Prostate Imaging Reporting and Data System; T2WI, T2-weighted image.
Table 4. PI-RADS v2 DWI score.
| DWI | Grading standards |
|---|---|
| 1 score | No abnormalities were found on ADC and high B-value images |
| 2 score | ADC diagram fuzzy low signal |
| 3 score | Focal light to moderate low signal intensity on ADC images and equal to mild high signal intensity on high B-value images |
| 4 score | There was a low focal signal on the ADC image and a high signal on the high B-value image. The maximum diameter of the axial plane was <1.5 cm |
| 5 score | Imaging findings were the same as 4 points, but the maximum diameter was ≥1.5 cm, or there was a definite extension or invasion out of the prostate |
PI-RADS, Prostate Imaging Reporting and Data System; DWI, diffusion-weighted imaging; ADC, apparent diffusion coefficient.
Table 5. PI-RADS v2 DCE score.
| DCE | Grading standards |
|---|---|
| DCE negative | (I) No reinforcement in the early stage |
| (II) Enhanced diffusion, with no corresponding focal expression on TWI or DWI | |
| (III) Corresponding lesions on DWI showed features of prostatic hyperplasia with focal enhancement. Negative DCE is defined as having one of the three | |
| DCE positive | Focal, prior to or concurrent with the enhancement of adjacent normal prostate tissue, consistent with the corresponding suspicious lesions of TWI and DWI |
PI-RADS, Prostate Imaging Reporting and Data System; DCE, Dynamic Enhanced; DWI, diffusion-weighted imaging; TWI, T weighted imaging.
Table 6. The PI-RADS V2 score the central zone.
| T2WI | DWI | DCE | Score |
|---|---|---|---|
| 1 | Any | Any | 1 |
| 2 | Any | Any | 2 |
| 3 | ≤4 | Any | 3 |
| 3 | 5 | Any | 4 |
| 4 | Any | Any | 4 |
| 5 | Any | Any | 5 |
PI-RADS, Prostate Imaging Reporting and Data System; DWI, diffusion-weighted imaging; DCE, Dynamic Enhanced.
Table 7. The PI-RADS V2 score of the peripheral zone.
| DWI | T2WI | DCE | Score |
|---|---|---|---|
| 1 | Any | Any | 1 |
| 2 | Any | Any | 2 |
| 3 | Any | (−) | 3 |
| 3 | Any | (+) | 4 |
| 4 | Any | Any | 4 |
| 5 | Any | Any | 5 |
PI-RADS, Prostate Imaging Reporting and Data System; DWI, diffusion-weighted imaging; T2WI, T2-weighted image; DCE, Dynamic Enhanced.
Radiomics image TA
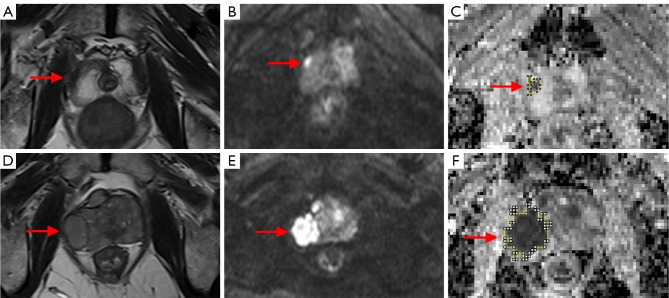
All ADC images were imported into the ONIS 2.5 Free Edition software in DICOM format. The lesion area images were selected, exported, and saved as uncompressed DICOM files. ImageJ software was used to determine each lesion’s full-layer volume and location for eligible patients according to T2WI and DWI sequences. Each lesion was manually delineated based on ADC images, and the characteristic texture parameters of full-layer lesion volume were derived. All standard features were extracted: first-order statistics, shape-based, gray level co-occurrence matrix, gray level run length matrix, gray level size zone matrix, gray level dependence matrix, and neighboring gray tone difference matrix, leading to texture features. As shown in Figure 1.
Figure 1.
MRI images of PCa and BPH. (A-C) MRI images of BPH patients; (D-F) MRI images of PCa patients. (A,D) focal, well-defined, low-signal lesions in the right peripheral area on T2WI (red arrow); (B,E) significant high signal on DWI (red arrow); (C,F) significant low signal on the ADC chart (shown as irregular yellow area). MRI, magnetic resonance imaging; PCa, prostate cancer; BPH, benign prostate hyperplasia; T2WI, T2-weighted image; DWI, diffusion-weighted imaging; ADC, apparent diffusion coefficient.
Selection of TF parameters
Feature selection is an essential part of statistical analysis and inference of data. In the actual modeling process, we need to identify independent variables with the strong explanatory ability to the dependent variables from the data to improve model prediction accuracy; that is, the quality of feature selection results directly affects the accuracy and quality of the model. We also used the LASSO regression to select the TF of mp-MRI in radiomics.
The LASSO regression was used to analyze the characteristic parameters of dimension-reduction. The one thousand one hundred percent cross-validation method was used to select the optimal lambda values and then select the most representative characteristic values, reducing the model complexity using the packages pROC and glmnet. Then, 70% of cases were randomly selected from the PCa and BPH groups as the training set, and the remaining 30% were the testing set. Normality testing, homogeneity testing of variance, and the t-test were performed on the training set. The Mann-Whitney test was performed on those who did not meet the t-test to obtain the latest training set. Finally, logistic regression was used to construct a PI-RADS 4/5 score prediction model based on radiomics TF to identify benign and malignant prostate lesions compared to the SVM and AdaBoost regressions.
Statistical analysis
Differences among variables were tested using the t-test and the Mann-Whitney test. We established a logistic regression machine learning model to distinguish benign disease from PCa. R software (4.0.4) was used for statistical analysis. A two-sided P<0.05 was regarded as statistically significant.
Results
R-logistic classification model based on TF
TF selection
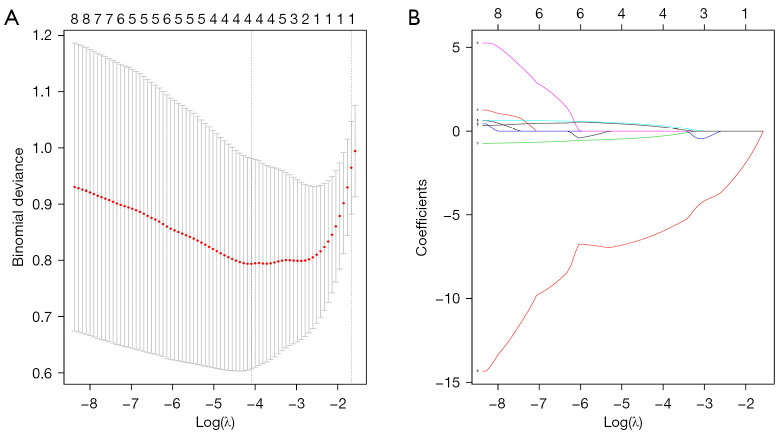
The data were standardized to eliminate errors caused by dimensionality difference, self-variation, or significant numerical differences of each characteristic variable in the regression analysis. Then, the LASSO regression was used to reduce the dimensionality of ten TF parameters, and the minimum standard was used for ten cross-validations to select the optimal parameters of the model. The relationship curve between the minimum variance and log(λ) was made, and a vertical line was drawn at the optimal point (Figure 2). The optimal parameter λ in the LASSO model was set to 4. According to the log(λ) sequence, the coefficient profile was drawn (Figure 2), the LASSO coefficient profile of ten characteristic parameters. In the λ graph, the vertical coordinate of the weight coefficient λ curve was closer to 0, indicating higher feature similarity. Vertical lines were drawn using ten cross-validations of the selected values, where the optimal lambda results in four features with non-zero coefficients. In conclusion, four essential TF parameters can be obtained from mp-MRI-based ADC images: median ADC value, kurtosis, skewness, and MRI lesion volume.
Figure 2.
Texture feature parameter selection using LASSO binary logistic regression model. (A) Binomial deviation curve of radiomics model with parameter λ. The vertical axis represents the binomial deviation. The horizontal axis represents the log(λ) value. The upper number represents the optimal value (the perpendicular dotted line), where the smallest binomial deviation is found for the quantitative model with the selected features. (B) Graph of radiomics characteristic parameters changing with λ. LASSO, least absolute shrinkage and selection operator.
Construction and performance comparison of three ML classification models based on TF
This study’s model building and solving process were all realized in R, version 4.0.4. We used the essential TF after LASSO dimension-reduction to build the model and established an ML model of logistic regression, SVM, and AdaBoost to predict the PI-RADS 4/5 score benign and malignant lesions classifier. The PCa and BPH groups were randomly selected in a 7:3 ratio and divided into training and testing sets. The training set was used to train and construct the ML model, and the testing set was used to verify the model.
The four characteristic values identified above are as follows: median ADC, kurtosis, skewness, and MRI lesions volume were the input variables of the classification model, and whether PCa (0 or 1) was the output variable of the model. Logistic regression, SVM, and AdaBoost regression were used to construct the R-logistic, R-SVM, and R-AdaBoost classification models based on TF. ROC curve analysis was used to compare the model performance of the three ML classification models, and the classification model with the largest area under the ROC curve was selected. The ROC curve analysis of each model was as follows. We selected the appropriate classifier by comparing the model's sensitivity, specificity, accuracy, and AUC values.
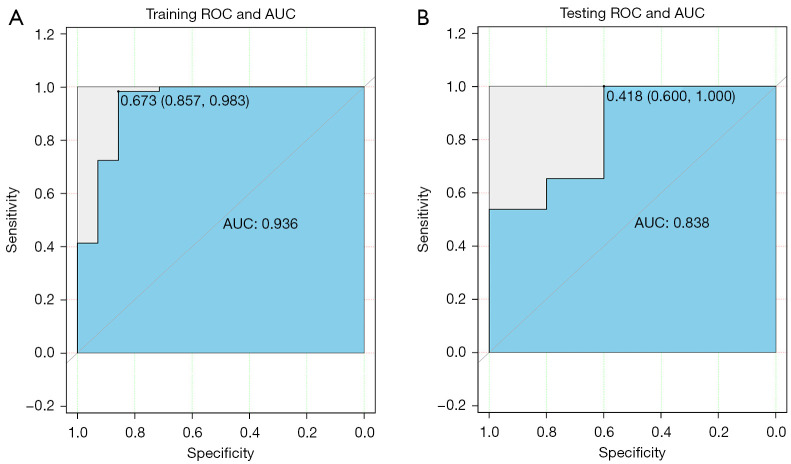
ROC curve analysis of R-logistic classification model; Logistic regression was carried out by combining R software and essential TF parameters based on ADC image feature selection. ROC curve analysis was conducted, as shown in Figure 3. The AUC values of the ROC curve of the training and the testing sets were 0.936 and 0.838. The sensitivity was 0.948 and 0.962. The specificities were 0.571 and 0.600, respectively. The accuracies were 0.875 and 0.903, respectively, suggesting that the model had an excellent classification performance.
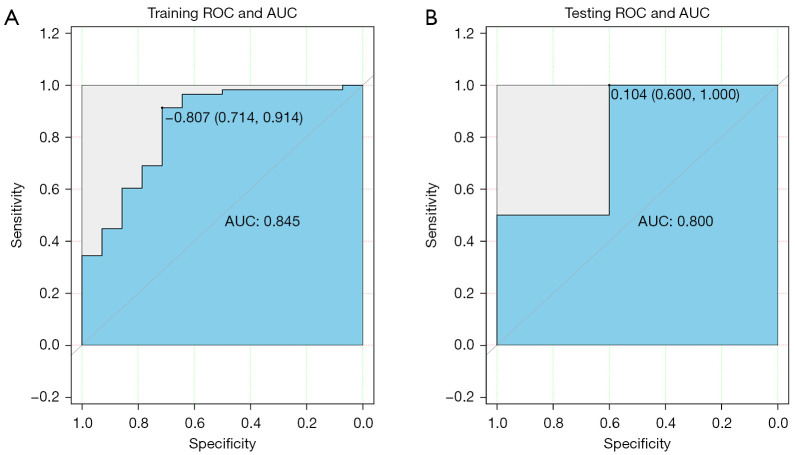
ROC curve analysis of the R-SVM classification model; The SVM model was constructed by combining R software and essential TF parameters based on ADC image feature selection. ROC curve analysis was conducted (Figure 4). The AUC values of the ROC curve of the training and the validation set were 0.845 and 0.800, respectively. The sensitivities were 0.967 and 0.923, the specificities were 0.623 and 0.600, and the accuracies were 0.903 and 0.871, respectively, suggesting that the model had an excellent classification performance.
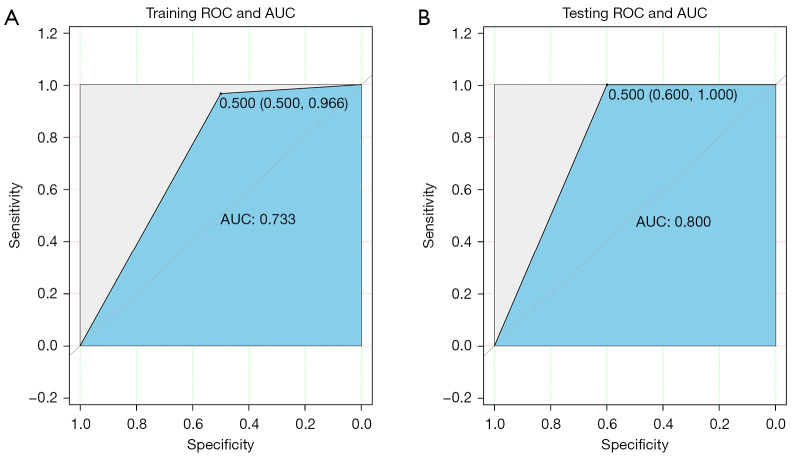
ROC curve analysis of R-AdaBoost classification model; The AdaBoost model was constructed by combining R language software and essential texture parameter features based on ADC image feature selection, and ROC curve analysis was conducted, respectively, as shown in Figure 5. The AUC values of the ROC curve of the training set and the testing set are 0.733 and 0.800, the sensitivity is 0.966 and 0.923, the specificity is 0.500 and 0.600, and the accuracy is 0.875 and 0.871, respectively. The model had an excellent classification performance.
Figure 3.
ROC curve analysis of training set. (A) and verification set (B) in the logistic regression model. ROC, receiver operating characteristic; AUC, area under the curve.
Figure 4.
ROC curve analysis of training set (A) and verification set (B) in the SVM model. ROC, receiver operating characteristic; AUC, area under the curve; SVM, support vector machine.
Figure 5.
ROC curve analysis of training set (A) and verification set (B) in the AdaBoost ML model. ROC, receiver operating characteristic; AUC, area under the curve; ML, machine learning.
The ROC curve analysis of these three classification models showed that the sensitivity, specificity, and accuracy of the testing group of the R-logistic classification model were 0.962, 0.600, and 0.903, respectively. The sensitivity, specificity, and accuracy of the testing groups of the R-SVM classification model and the R-AdaBoost classification model were 0.923 and 0.923, 0.600 and 0.600, and 0.871 and 0.871, respectively (Table 8). The sensitivity and specificity of the training and testing sets of the three ML classification models showed slight differences; therefore, the AUC value was used as the evaluation index to judge the performance of the classification model. The AUC of the training and testing sets of the R-logistic classification model were 0.936 and 0.838, respectively, which were higher than that of R-SVM and R-AdaBoost classification models, suggesting that the R-logistic classification model had better classification performance. Therefore, the R-logistic classification model based on TF was used as the classification model to differentiate benign from malignant prostate lesions in PI-RADS 4/5 score.
Table 8. Performance comparison of three kinds of ML.
| Model | dataset | Sensitivity | Specificity | Accuracy | AUC (95% CI) |
|---|---|---|---|---|---|
| R-logistic | Training set | 0.948 | 0.571 | 0.875 | 0.936 (0.849–1.000) |
| Testing set | 0.962 | 0.600 | 0.903 | 0.838 (0.751–0.981) | |
| R-SVM | Training set | 0.967 | 0.623 | 0.903 | 0.845 (0.762–0.973) |
| Testing set | 0.923 | 0.600 | 0.871 | 0.800 (0.702–1.102) | |
| R-AdaBoost | Training set | 0.966 | 0.500 | 0.875 | 0.733 (0.649–1.100) |
| Testing set | 0.923 | 0.600 | 0.871 | 0.800 (0.703–1.101) |
ML, machine learning; SVM, support vector machine; AUC, area under the curve.
C-logistic classification model based on clinical indicators
Treatment of clinical indicators
The clinical indicators Age, PSA, fPSA, WBC, FIB, ALB, NLR, LDL-C, HDL-C, and TG were divided into PCa and BPH groups according to the pathological classification t-test homogeneity of variance test were performed for the clinical indicators. The Mann-Whitney test was used for data not normally distributed to determine any difference in data between the PCa and the BPH groups.
Difference analysis of clinical indicators
SPSS25.0 software was used to compare the clinical indicators in the PCa and the BPH groups. The statistical significance of each indicator is shown in Table 9. As can be seen from Table 10, the P values of Age, PSA, fPSA, WBC, FIB, ALB, NLR, LDL-C, HDL-C, and TG were all P<0.05, suggesting that the differences in these indicators were statistically significant.
Table 9. Statistical test results of clinical indicators in PCa group and BPH group.
| Index | PCa group | BPH group | t/U-value | P value |
|---|---|---|---|---|
| Sample, n | 83 | 20 | – | – |
| Age, years | 71.39±8.624 | 65.9±9.819 | −2.567 | 0.012 |
| BMI, Kg | 24.405±2.584 | 23.435±3.836 | −0.104 | 0.917 |
| PSA | 25.989±17.740 | 9.325±6.373 | −4.944 | <0.001 |
| fPSA | 7.071±12.817 | 1.182±0.953 | −3.473 | <0.001 |
| Systemic Inflammatory Index | ||||
| WBC | 6.793±1.830 | 5.831±1.041 | −2.189 | 0.029 |
| Fib | 3.133±0.766 | 4.44±1.585 | −3.927 | <0.001 |
| ALB | 38.166±3.554 | 42.125±4.287 | 4.293 | <0.001 |
| NLR | 4.077±2.255 | 2.645±1.249 | −2.526 | 0.012 |
| CPR | 6.755±8.676 | 4.025±4.690 | −0.984 | 0.325 |
| PLT | 184.76±49.599 | 224.95±84.756 | −1.643 | 0.100 |
| Metabolism Index | ||||
| LDL-C | 2.796±0.789 | 2.093±0.545 | −3.770 | <0.001 |
| HDL-C | 1.229±0.356 | 1.003±0.159 | −2.771 | 0.007 |
| TG | 1.441±0.695 | 1.047±0.408 | −2.431 | 0.017 |
PCa, prostate cancer; BPH, benign prostate hyperplasia; BMI, body mass index; PSA, prostate-specific antigen; fPSA, free prostatespecific antigen; WBC, white blood cells; ALB, white blood cells; NLR, neutrophil-lymphocyte ratio; CPR, C-reactive protein; PLT, platelet count; LDL-C, low-density lipoprotein cholesterol; HDL-C, high-density lipoprotein cholesterol; TG, triglyceride.
Table 10. Multivariate logistic regression model for predicting PCa risk.
| Model | Intercept and variable | Prediction model | ||
|---|---|---|---|---|
| β | Odds ratio (95% CI) | P value | ||
| R-logistic | Intercept | 9.396 | 10.212 (9.239–15.238) | <0.001 |
| Median ADC | −7.464 | 1.101 (0.501–2.02) | <0.001 | |
| kurtosis | −0.584 | 0.558 (0.249–1.192) | 0.115 | |
| skewness | 0.627 | 1.872 (0.864–4.961) | 0.151 | |
| MRI lesion volume | 0.576 | 1.780 (0.744–5.131) | 0.229 | |
| C-logistic | Intercept | −2.608 | 0.023 (0.015–0.049) | 0.592 |
| PSA | 0.324 | 1.382 (1.137–1.987) | 0.016 | |
| Fib | −3.045 | 0.048 (0.01–0.413) | 0.051 | |
| LDL-C | 4.147 | 63.268 (4.726–7178.178) | 0.017 | |
β is the regression coefficient. PCa, prostate cancer; PSA, prostate-specific antigen; ADC, apparent diffusion coefficient; CI, confidence interval; LDL-C, low-density lipoprotein cholesterol.
ROC curve analysis of clinical indicators
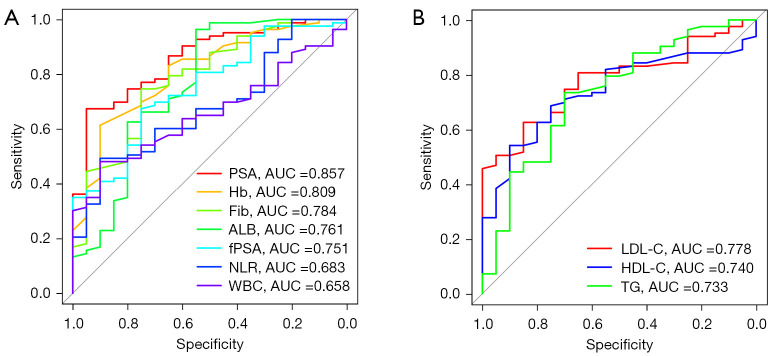
R software was used to analyze the ROC curve of clinical indicators, as shown in Figure 6. As can be seen from the figure, the AUC values of ROC curve of PSA, FIB, ALB, fPSA, NLR, WBC, LDL-C, HDL-C and TG were 0.857, 0.784, 0.761, 0.751, 0.683, 0.658, 0.778, 0.740, and 0.733, respectively. All showed high efficacy in differentiating benign and malignant prostate lesions.
Figure 6.
ROC curve of clinical indicators. (A) ROC curve of PSA and systemic inflammation indicators; (B) ROC curve of metabolic indicators. ROC, receiver operating characteristic; AUC, area under the curve; PSA, prostate-specific antigen.
C-logistic classification model performance based on clinical indicators
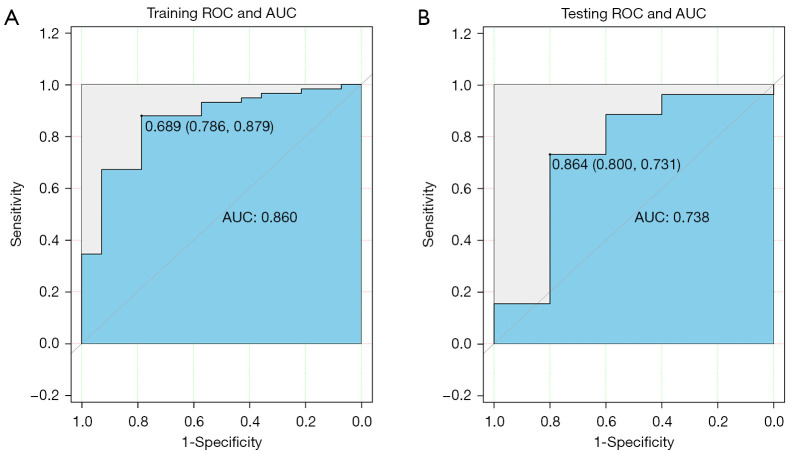
To reduce the complexity of the model, using difference analysis of clinical indicators and ROC curve analysis, the top three clinical indicators with the largest AUC values were selected to construct the C-logistic classification model; 70% of the samples of PCa and BPH groups were selected as the training set, PSA, FIB, and LDL-C were taken as the input variables of the model, and corresponding cancer and benign were taken as the output variables. The logistic classification model was established by combining R language software and clinical indicators, and ROC curve analysis was conducted (Figure 7). The AUC value of the ROC curve of the training set and the testing set were 0.860 and 0.738, respectively. The sensitivities were 0.967 and 0.855, the specificities were 0.857 and 0.800, and the accuracies were 0.944 and 0.871, respectively, suggesting that the model had an excellent classification performance.
Figure 7.
ROC curve analysis of training group (A) and verification group (B) in C-logistic classification model. ROC, receiver operating characteristic; AUC, area under the curve.
Comparative analysis of R-logistic model and C-logistic model
Logistic regression equation of characteristic texture parameters and clinical indicators
Logistic regression was used to construct TF and clinical index data equations based on radiomics. The parameters and their coefficients are shown in Table 10. The R-logistic regression equation based on the TF of radiomics model was Y_radiomics =9.396 – 7.464 * median ADC – 0.584 * kurtosis + 0.627 *skewness + 0.576 * MRI lesion volume. The formula of C-logistic regression equation based on clinical indicators was as follows: Y_clinical = –2.608 + 0.324 * PSA – 3.045 * FIB + 4.147 * LDL-C.
The t-test was carried out according to the logistic regression equation, and the corresponding results are shown in Table 11. The Y_radiomics in the training group PCa with R-logistic regression equation was 2.738±1.538, and the Y_radiomics in the training group BPH was –0.270±2.519. The P value between the two groups was less than 0.001. The training set of the C-logistic regression equation was 4.364±8.403 in the PCa group and –4.265±5.441 in the BPH group. The P value between groups was less than 0.001. In other words, both sets of equations can be used in studies distinguishing benign from malignant lesions of the prostate in PI-RADS 4/5 score.
Table 11. t-test of R-logistic and C-logistic regression equations.
| Model | PCa group | BPH group | t-value | P value |
|---|---|---|---|---|
| Sample (n) | 58 | 14 | – | – |
| R-logistic model | 2.738±1.538 | −0.270±2.519 | −5.733 | <0.001 |
| C-logistic model | 4.364±8.403 | −4.265±5.441 | −3.651 | <0.001 |
PCa, prostate cancer; BPH, benign prostate hyperplasia.
In summary, ROC curve analysis results of the R-logistic classification model based on TF and C-logistic classification model based on clinical indicators are shown in Table 12 and Figure 8. The AUC values of training and testing sets of the R-logistic classification model were 0.936 and 0.838, respectively, which were higher than that of the C-logistic classification model based on clinical indicators. In other words, when differentiating benign and malignant prostate lesions to establish an ML classifier model, mp-MRI radiomics TF were superior to clinical indicators. When the Youden index was at its maximum, the cut-off value for identifying benign and malignant prostate lesions in the PI-RADS 4/5 score was 1.216; that is, when Y_radiomics was greater than 1.216, the model would predict PCa, with sensitivity and specificity of 87.9% and 79.0%, respectively.
Table 12. Performance comparison of R-logistic and C-logistic classification models.
| Model | Sensitivity | Specificity | Accuracy | AUC (95% CI) |
|---|---|---|---|---|
| R-logistic | ||||
| Training set | 0.948 | 0.571 | 0.875 | 0.936 (0.849–1.000) |
| Testing set | 0.962 | 0.600 | 0.903 | 0.838 (0.751–0.981) |
| C-logistic | ||||
| Training set | 0.967 | 0.857 | 0.944 | 0.860 (0.771–1.281) |
| Testing set | 0.855 | 0.800 | 0.871 | 0.738 (0.651–0.989) |
AUC, area under the curve.
Figure 8.
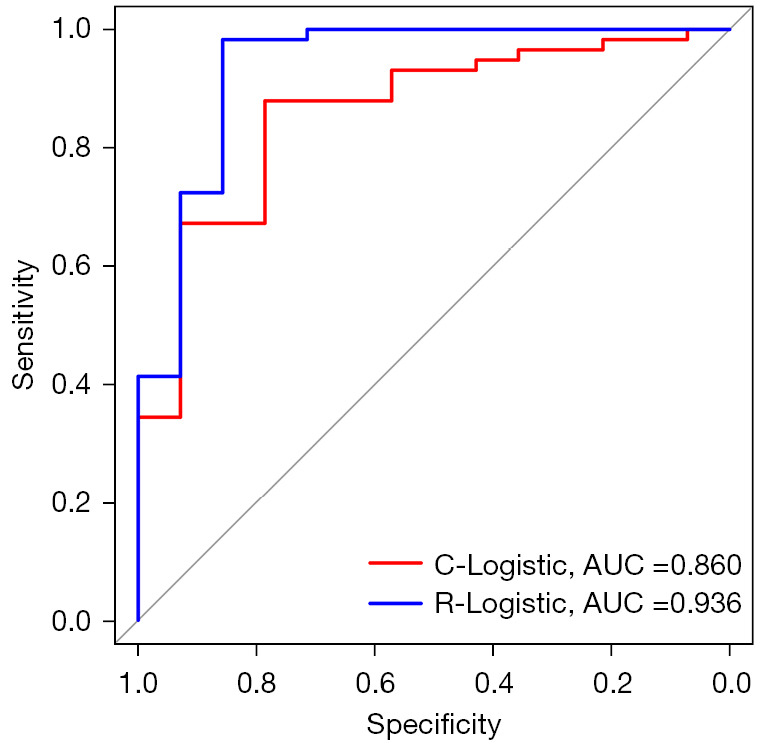
Comparison of ROC curve between R-logistic and C-logistic. ROC, receiver operating characteristic; AUC, area under the curve.
Further analysis of R-logistic classification model
A nomogram for predicting the risk of benign and malignant prostatic lesions was drawn based on Y_radiomics (Figure 9). The nomogram shows a patient's total score of imaging TF for predicting the risk of benign and malignant prostatic lesions. Combined with its calibration curve (Figure 10), the performance demonstrated good predictive ability. The X-axis, Y-axis, oblique dotted line, and solid line in the calibration curve represent the meanings of the predicted risk of benign and malignant prostate lesions, the probability of actual diagnosis, the perfect prediction of the ideal model, and the performance of the nomogram, respectively. According to the calibration curve, the nomogram of Y_radiomics showed a robust predictive performance for benign and malignant prostate lesions. The nomogram chart closer to the diagonal dotted line has a better prediction.
Figure 9.
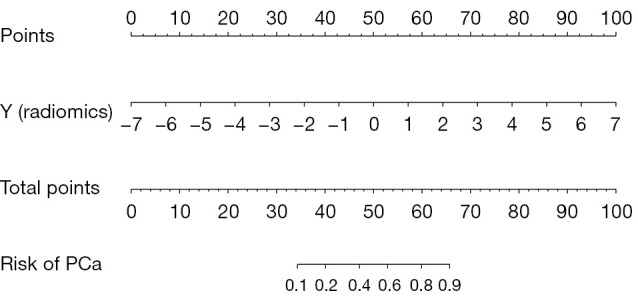
Nomogram of radiomics model. PCa, prostate cancer.
Figure 10.
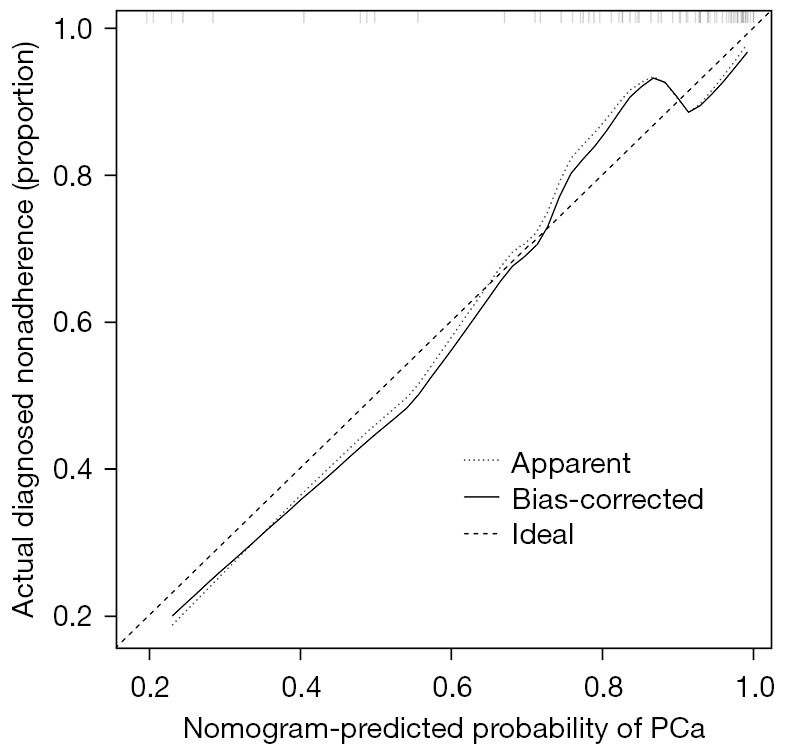
Nomogram calibration curve. PCa, prostate cancer.
Discussion
In recent years, the incidence of PCa in China has shown a significant upward trend because early clinical symptoms of PCa and BPH are very similar; however, the treatment regimens are different. Prostate biopsy is the gold standard for diagnosing and assessing the risk of PCa; however, it can cause complications because it is an invasive test. PSA is of great value in screening PCa; however, it is nonspecific.
Improving the early diagnosis rate of PCa can improve survival. Many studies have tried to improve the diagnostic efficiency of PCa using several clinical experimental indicators and diagnostic models. Li et al. established a logistic regression model to provide the basis for a prostate needle biopsy and found that DRE, TRUS, MRI, PSAD, and f/tPSA affected prostate biopsy (23). According to the logistic regression model of PCa established by regression coefficient, prostate biopsy should be performed when the P value is greater than 0.12.
In the present study, we considered PSA, fPSA, systemic inflammatory indicators, and metabolic indicators of patients. Using the t-test and ROC curve analysis results, we found that the AUC value of PSA was 0.857, which was higher than the systemic inflammatory indicators and metabolic indicators.
We selected the best three indicators to establish a logistic regression model to differentiate benign and malignant prostate lesions and obtained Y_clinical = –2.608 + 0.324 * PSA – 3.045 * FIB + 4.147 * LDL-C. The AUC values of the training and testing sets were 0.860 and 0.738, respectively.
TA in radiomics is a processing process that uses image processing software to extract texture characteristic parameters and obtain quantitative or qualitative descriptions of texture. TA has been applied in medicine. TA of CT, MRI, and PET-CT images can be used to obtain texture parameters related to disease, which is essential for detection and diagnosis of PCa, Gleason score and clinical staging, prediction of recurrence, metastasis, and efficacy evaluation. Xiong et al. explored the potential value of MRI TA combined with prostate-related biomarkers for predicting high-grade PCa (HGPCA). Logistic regression and ROC curve analysis of TA parameters from T2WI and DWI in the HGPCA group and non-high-grade PCa group showed kurtosis, skewness, and entropy obtained from ADC mapping predicted HGPCA (24).
Many studies extracted the textural parameters of the region of interest from a single layer to obtain the TF of the lesion. Imaging studies in other tissues have demonstrated the importance of measuring TF using an approach based on whole lesions volume and providing a complete representation of the entire tumor. This also facilitates the calculation of more advanced metrics to reflect the overall lesions texture and inhomogeneity (25,26). In the present study, TF were determined from all ADC images that included lesions covering the entire PI-RADS v2 4/5 score. This analytical approach may better reveal intra-tumor heterogeneity and improve clinical evaluation.
Based on R software, we performed classification, regression, clustering, dimension-reduction, model selection, statistical analysis, and data preprocessing, which can quickly complete the entire process of ML (27). In the present study, we considered patients whose mp-MRI examination indicated PI-RADS v2 4/5 score and used ImageJ and other software to extract the TF of all lesions. R software was used to conduct data normalization for these TF parameters, and the LASSO regression was performed to reduce the dimensions of the parameters. The four most essential feature parameters were obtained: median ADC, kurtosis, skewness, and MRI lesion volume. These texture parameters were combined using SVM, logistic regression, and an AdaBoost ML model to establish a classifier model for PCa. We found that the AUC value of the ROC curve of the logistic regression testing set was 0.838, which was higher than the prediction model of benign and malignant prostate lesions established by SVM and AdaBoost, and similar to the results of other researchers, suggesting the essential clinical value of logistic regression in the differentiation of benign from malignant prostate lesions.
MRI examination of the prostate can save patients from the trauma and potential complications caused by prostate biopsy; however, MRI detection of clinically significant PCa has limitations, especially since the accuracy of diagnosis varies significantly between individual radiologists (28). Radiomics TA uses advanced image processing technology to extract many feature parameters from images and its potential to improve diagnostic accuracy (29). In the present study, logistic regression was applied to construct a classification model for PCa based on the TF of radiomics. In this case, the corresponding R-logistic classification model was Y_radiomics = 9.396 – 7.464 * median ADC – 0.584 * kurtosis + 0.627 * skewness + 0.576 * MRI lesions volume. The AUC value of the ROC curve of the R-logistic training set was 0.936, which was better than that of the C-logistic classification model. When the Youden index was at its maximum, the cut-off point value for differentiating benign from malignant prostatic lesions was 1.216, and its sensitivity and specificity were 87.9% and 79.0%, respectively. Because these four variables in the PI-RADS 4/5 score medium prostate lesions can be easily obtained clinically, we believe that this equation can predict PCa in daily clinical practice. Nomograms are widely used in oncology to predict outcomes. Nomograms rely on the advantages of a friendly digital interface and higher accuracy to help better clinical decision-making (30). Our nomogram was based on Y (radiomics) to differentiate benign from malignant prostate lesions, and its calibration curve showed good predictive power.
In summary, based on patients with a 4/5 PI-RADS v2 score, we extracted TF in mp-MRI combined with the ML models R-SVM, R-logistic regression, and an R-AdaBoost classifier to establish a prediction model discriminating between benign and malignant prostate lesions. The AUC of the R-logistic regression classifier was the highest and better than that of C-logistic regression established by clinical indicators, suggesting that the application value of PI-RADS v2 4/5 score in predicting benign and malignant prostate lesions was strong.
There are some limitations to this study. First, the sample size was relatively small, and all studies were retrospective; therefore, a large sample size expansion is needed to conduct prospective studies in the future. Second, the samples in this study were from a single center, and there is a lack of independent verification data set. In the future, a multi-center study will be used to validate the present study results. Third, this study manually delineated the ROI, which is inefficient and subjective to some extent and is not conducive to big data processing. It may be possible to use computer-aided systems to identify and segment lesions in the future automatically.
Conclusions
The ML classifier models are established based on the TF of radiomics. It has a strong classification performance in identifying benign and malignant prostate lesions in PI-RADS 4/5 score. Various treatments and outcomes for PCa patients can be applied clinically.
Acknowledgments
Funding: None.
Ethical Statement: The authors are accountable for all aspects of the work in ensuring that questions related to the accuracy or integrity of any part of the work are appropriately investigated and resolved. The study was conducted in accordance with the Declaration of Helsinki (as revised in 2013). The study was approved by the Ethics Committee of the First Affiliated Hospital of Suzhou University (No. 2021162) and informed consent was taken from all the patients.
Footnotes
Reporting Checklist: The authors have completed the TRIPOD reporting checklist. Available at https://tcr.amegroups.com/article/view/10.21037/tcr-21-2271/rc
Data Sharing Statement: Available at https://tcr.amegroups.com/article/view/10.21037/tcr-21-2271/dss
Conflicts of Interest: All authors have completed the ICMJE uniform disclosure form (available at https://tcr.amegroups.com/article/view/10.21037/tcr-21-2271/coif). The authors have no conflicts of interest to declare.
References
- 1.Culp MB, Soerjomataram I, Efstathiou JA, et al. Recent Global Patterns in Prostate Cancer Incidence and Mortality Rates. Eur Urol 2020;77:38-52. 10.1016/j.eururo.2019.08.005 [DOI] [PubMed] [Google Scholar]
- 2.Schatten H. Brief Overview of Prostate Cancer Statistics, Grading, Diagnosis and Treatment Strategies. Adv Exp Med Biol 2018;1095:1-14. 10.1007/978-3-319-95693-0_1 [DOI] [PubMed] [Google Scholar]
- 3.Siegel RL, Miller KD, Jemal A. Cancer statistics, 2018. CA Cancer J Clin 2018;68:7-30. 10.3322/caac.21442 [DOI] [PubMed] [Google Scholar]
- 4.Chen W, Zheng R, Baade PD, et al. Cancer statistics in China, 2015. CA Cancer J Clin 2016;66:115-32. 10.3322/caac.21338 [DOI] [PubMed] [Google Scholar]
- 5.George AK, Turkbey B, Valayil SG, et al. A urologist's perspective on prostate cancer imaging: past, present, and future. Abdom Radiol (NY) 2016;41:805-16. 10.1007/s00261-016-0751-6 [DOI] [PMC free article] [PubMed] [Google Scholar]
- 6.Sun Y, Reynolds HM, Parameswaran B, et al. Multiparametric MRI and radiomics in prostate cancer: a review. Australas Phys Eng Sci Med 2019;42:3-25. 10.1007/s13246-019-00730-z [DOI] [PubMed] [Google Scholar]
- 7.Manfredi M, Mele F, Garrou D, et al. Multiparametric prostate MRI: technical conduct, standardized report and clinical use. Minerva Urol Nefrol 2018;70:9-21. [DOI] [PubMed] [Google Scholar]
- 8.Choi ER, Lee HY, Jeong JY, et al. Quantitative image variables reflect the intratumoral pathologic heterogeneity of lung adenocarcinoma. Oncotarget 2016;7:67302-13. 10.18632/oncotarget.11693 [DOI] [PMC free article] [PubMed] [Google Scholar]
- 9.Li M, Chen T, Zhao W, et al. Radiomics prediction model for the improved diagnosis of clinically significant prostate cancer on biparametric MRI. Quant Imaging Med Surg 2020;10:368-79. 10.21037/qims.2019.12.06 [DOI] [PMC free article] [PubMed] [Google Scholar]
- 10.Merisaari H, Taimen P, Shiradkar R, et al. Repeatability of radiomics and machine learning for DWI: Short-term repeatability study of 112 patients with prostate cancer. Magn Reson Med 2020;83:2293-309. 10.1002/mrm.28058 [DOI] [PMC free article] [PubMed] [Google Scholar]
- 11.Hamm CA, Beetz NL, Savic LJ, et al. Artificial intelligence and radiomics in MRI-based prostate diagnostics. Radiologe 2020;60:48-55. 10.1007/s00117-019-00613-0 [DOI] [PubMed] [Google Scholar]
- 12.Harmon SA, Tuncer S, Sanford T, et al. Artificial intelligence at the intersection of pathology and radiology in prostate cancer. Diagn Interv Radiol 2019;25:183-8. 10.5152/dir.2019.19125 [DOI] [PMC free article] [PubMed] [Google Scholar]
- 13.Pantanowitz L, Quiroga-Garza GM, Bien L, et al. An artificial intelligence algorithm for prostate cancer diagnosis in whole slide images of core needle biopsies: a blinded clinical validation and deployment study. Lancet Digit Health 2020;2:e407-16. 10.1016/S2589-7500(20)30159-X [DOI] [PubMed] [Google Scholar]
- 14.Stark GF, Hart GR, Nartowt BJ, et al. Predicting breast cancer risk using personal health data and machine learning models. PLoS One 2019;14:e0226765. 10.1371/journal.pone.0226765 [DOI] [PMC free article] [PubMed] [Google Scholar]
- 15.Bernatz S, Ackermann J, Mandel P, et al. Comparison of machine learning algorithms to predict clinically significant prostate cancer of the peripheral zone with multiparametric MRI using clinical assessment categories and radiomic features. Eur Radiol 2020;30:6757-69. 10.1007/s00330-020-07064-5 [DOI] [PMC free article] [PubMed] [Google Scholar]
- 16.Trebeschi S, Drago SG, Birkbak NJ, et al. Predicting response to cancer immunotherapy using noninvasive radiomic biomarkers. Ann Oncol 2019;30:998-1004. 10.1093/annonc/mdz108 [DOI] [PMC free article] [PubMed] [Google Scholar]
- 17.Horvat N, Bates DDB, Petkovska I. Novel imaging techniques of rectal cancer: what do radiomics and radiogenomics have to offer? A literature review. Abdom Radiol (NY) 2019;44:3764-74. 10.1007/s00261-019-02042-y [DOI] [PMC free article] [PubMed] [Google Scholar]
- 18.Nakamoto T, Haga A, Takahashi W. An Introduction to Radiomics: Toward a New Era of Precision Medicine. Igaku Butsuri 2018;38:129-34. [DOI] [PubMed] [Google Scholar]
- 19.Morin A, Fritsch L, Mathieu JR, et al. Identification of CAD as an androgen receptor interactant and an early marker of prostate tumor recurrence. FASEB J 2012;26:460-7. 10.1096/fj.11-191296 [DOI] [PubMed] [Google Scholar]
- 20.Schmuecking M, Boltze C, Geyer H, et al. Dynamic MRI and CAD vs. choline MRS: where is the detection level for a lesion characterisation in prostate cancer? Int J Radiat Biol 2009;85:814-24. 10.1080/09553000903090027 [DOI] [PubMed] [Google Scholar]
- 21.Weinreb JC, Barentsz JO, Choyke PL, et al. PI-RADS Prostate Imaging - Reporting and Data System: 2015, Version 2. Eur Urol 2016;69:16-40. 10.1016/j.eururo.2015.08.052 [DOI] [PMC free article] [PubMed] [Google Scholar]
- 22.Wang JC, Huan SK, Kuo JR, et al. A multivariable logistic regression equation to evaluate prostate cancer. J Formos Med Assoc 2011;110:695-700. 10.1016/j.jfma.2011.09.005 [DOI] [PubMed] [Google Scholar]
- 23.Li Y, Tang Z, Qi L, et al. Analysis of influential factors for prostate biopsy and establishment of logistic regression model for prostate cancer. Zhong Nan Da Xue Xue Bao Yi Xue Ban 2015;40:651-6. [DOI] [PubMed] [Google Scholar]
- 24.Xiong H, He X, Guo D. Value of MRI texture analysis for predicting high-grade prostate cancer. Clin Imaging 2021;72:168-74. 10.1016/j.clinimag.2020.10.028 [DOI] [PubMed] [Google Scholar]
- 25.Yip SSF, Liu Y, Parmar C, et al. Associations between radiologist-defined semantic and automatically computed radiomic features in non-small cell lung cancer. Sci Rep 2017;7:3519. 10.1038/s41598-017-02425-5 [DOI] [PMC free article] [PubMed] [Google Scholar]
- 26.Kierans AS, Bennett GL, Mussi TC, et al. Characterization of malignancy of adnexal lesions using ADC entropy: comparison with mean ADC and qualitative DWI assessment. J Magn Reson Imaging 2013;37:164-71. 10.1002/jmri.23794 [DOI] [PubMed] [Google Scholar]
- 27.Chen XW, Gao JX. Big Data Bioinformatics. Methods 2016;111:1-2. 10.1016/j.ymeth.2016.11.017 [DOI] [PMC free article] [PubMed] [Google Scholar]
- 28.Rosenkrantz AB, Ayoola A, Hoffman D, et al. The Learning Curve in Prostate MRI Interpretation: Self-Directed Learning Versus Continual Reader Feedback. AJR Am J Roentgenol 2017;208:W92-W100. 10.2214/AJR.16.16876 [DOI] [PubMed] [Google Scholar]
- 29.Borofsky S, George AK, Gaur S, et al. What Are We Missing? False-Negative Cancers at Multiparametric MR Imaging of the Prostate. Radiology 2018;286:186-95. 10.1148/radiol.2017152877 [DOI] [PMC free article] [PubMed] [Google Scholar]
- 30.Wei L, Champman S, Li X, et al. Beliefs about medicines and non-adherence in patients with stroke, diabetes mellitus and rheumatoid arthritis: a cross-sectional study in China. BMJ Open 2017;7:e017293. 10.1136/bmjopen-2017-017293 [DOI] [PMC free article] [PubMed] [Google Scholar]


