Abstract
Although the mean corpuscular volume (MCV) has been associated with various diseases, these associations in relation to the age‐related trends in MCV remain unclear. Therefore, we used a dataset with over one million values to identify the relationship between ageing and MCV changes. All laboratory data obtained between November 1998 and November 2019 at Chungbuk National University Hospital were retrospectively collected. After excluding cases with missing values for individual complete blood count parameters, outlier MCV values, and ages less than 1 year and more than 88 years, 977,335 MCV values were obtained from 309,393 patients. Principal component analysis of blood components with ages and analysis of the median value changes for each blood component across decade‐wise age groups were conducted to identify relationships between ageing and changes in blood components. The median values of MCV showed gradual increments with age. The linear relationship for patients aged 1–25 years had a larger slope than that for patients aged 26–88 years. For MCV, the equation for patients aged 1–25 years was 0.40*(age) + 81.24 in females and 0.45*(age) + 79.58 in males. The equation for patients aged 26–90 years was 0.04*(age) + 88.97 in females and 0.06*age + 88.30 in males. Among patients aged >40 years, the MCV value was higher in men than in women. Analysis of a large dataset showed that the MCV gradually increased with age and the linear relationship differed between patients aged 1–25 and 26–88 years.
Keywords: age, complete blood count, mean corpuscular volume
1. INTRODUCTION
Complete blood count (CBC) tests, which are commonly used during health assessments, can provide information regarding anaemia, infection or impaired haemostasis. 1 CBCs usually include measurements of the white blood cell (WBC) count, WBC differential count, red blood cell (RBC) count, haematocrit (Ht; the volume of percentage of RBCs), haemoglobin (Hb) levels, mean corpuscular volume (MCV), mean corpuscular haemoglobin level, mean corpuscular haemoglobin concentration, red cell distribution width (RDW) and platelet count. 2
A diagnosis of anaemia is based on haemoglobin levels less than 13 g/dl in males and 12 g/dl in females, 3 and the MCV value can be used to classify anaemia as either microcytic, normocytic or macrocytic. 4 , 5 However, MCV measurements are inevitably less useful in patients without anaemia. One study evaluating the clinical importance of an elevated MCV value irrespective of the haemoglobin value revealed that such elevated values were commonly associated with alcoholism and hepatic disease, malignant disease, and the effects of chemotherapy. 6 More recently, MCV has been suggested to be a prognostic factor for colorectal or oesophageal cancer, 7 , 8 chronic kidney disease, 9 and ischaemic stroke or coronary interventions. 10 , 11 However, these studies did not attempt to evaluate their findings in the context of the age‐related trends in MCV that have been described in several reports. 12 , 13 , 14 Moreover, these studies had a relatively small sample size and did not include regression analyses.
In a pilot study using health‐check data from May 2001 to November 2019 for patients aged 11–95 years and including 66,911 values each of MCV, Hb, haematocrit (Hct) and RBC, 15 the MCV showed the most distinct age‐related trends. Therefore, we conducted this study using the CBC data obtained over a 21‐year period at our hospital to determine a regression model for ageing and MCV changes.
2. MATERIALS AND METHODS
2.1. Study population and design
All laboratory data obtained between November 1998 and November 2019 from health checks as well as inpatients, outpatients, and emergency room patients aged 1–99 years at our hospital were collected for this study. The data were anonymized and handled confidentially. The total laboratory data of 502,978 patients were collected, and 328,752 patients without anaemia were enrolled. The diagnosis of anaemia in males and females is based on threshold haemoglobin levels of 13 and 12 g/dl, respectively. Data for CBC parameters such as RBC count, Hct values, Hb levels, and MCV and RDW values were collected, yielding 1,036,616 values for individual CBC parameters. We excluded 3506 missing values for individual CBC parameters, 38,431 outlier MCV, RDW values and 17,344 values obtained from patients aged less than 1 year and more than 88 years because of less than 1000 observations in each age group. Outliers were defined as values over or under the 3/4 quantile + (1.51* inter‐quantile range) and 1/4 quantile–(1.51*inter‐quantile range). Finally, 977,335 values for individual CBC parameters from 309,393 patients aged 1–88 years were included. This study was approved by the Institutional Review Board of Chungbuk University Hospital (2021–10‐023). The review board waived the requirement for informed consent due to the retrospective nature of the study.
2.2. Data collection sequence
All patients who visited the hospital were recorded in the master table, and all hospital data were obtained from this master table. The laboratory table, which included information regarding age, sex, order‐date, laboratory (lab) test date, laboratory values and laboratory test names, was obtained by querying the client and server system. Queries were made for text files, which were transformed using MySQL Workbench software version 8.0 database (Oracle Corporation).
The number of patients who visited the hospital and received a doctors' order was 811,050, and 502,978 patients underwent laboratory tests. Data for CBC parameters, such as RBC count, Hct values, Hb levels, and MCV and RDW values, were collected. We included WBC, WBC count, PLT and PLT count in these searches, but did not include the corresponding data in this study.
2.3. Statistical analysis
Statistical analyses were performed using R software version 4.1.0 (The R Foundation). The normality of the data was checked using the Anderson–Darling test. Principal component analysis (PCA) was used to evaluate bivariate cross‐correlations among CBC parameters and age. The Kruskal–Wallis test and post hoc evaluations by the Tukey method were performed to identify the statistical differences in CBC parameters in decade‐wise age groups. Comparisons between sexes were performed using the Mann–Whitney U‐test. Results were considered to be statistically significant when the p‐value was less than 0.05. A linear regression analysis using the least‐squares method was performed to evaluate the changes in median MCV value in every 1 year.
2.4. Definitions of CBC parameters and anaemia
Hb level is the concentration of haemoglobin in whole blood, in grams/decilitre (g/dl).
RBC count is the number of RBCs per microliter of blood (or number of RBCs * 106/μl).
Hct is the percentage of blood that is represented by the red blood cells.
MCV is the average size and volume of red blood cells. It can be calculated by multiplying the per cent haematocrit by 10 divided by the erythrocyte count.
The RDW is calculated using the formula RDW = (standard deviation of MCV MCV) × 100 16 .
Anaemia was defined by a haemoglobin level less than 13 g/dl in males and 12 g/dl in females. 3
3. RESULTS
3.1. Characteristics of the MCV data
A boxplot and density plot were generated to inspect the entire MCV data after outlier removal. The median MCV value was 91.2 fl, and the lower quartile (Q1) and upper quartile (Q3) values were 88.1 and 94.3 fl, respectively (Figure 1A). The distribution of MCV values was similar for male and female patients (Figure 1B). However, the data did not pass the normality test for statistical analyses using the quantile–quantile (Q‐Q) plot, which showed a bimodal distribution, and the Anderson–Darling normality test (p < 0.05).
FIGURE 1.
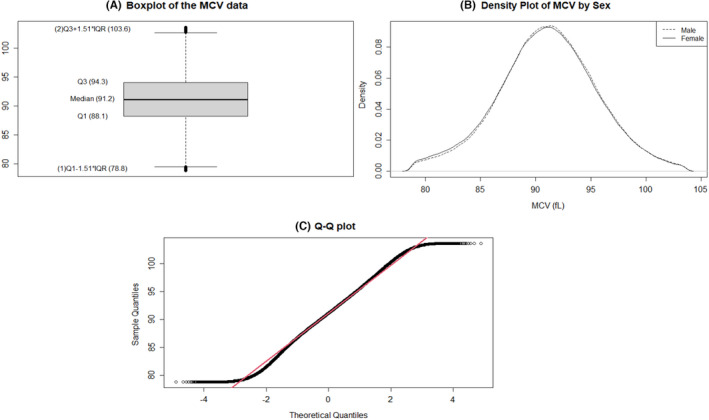
Characteristics of MCV data. (A) Boxplot of the MCV data after outlier removal. (B) Density plot of MCV data. (C) Q‐Q plot of MCV data
3.2. Principal component analysis of all ages in the entire data
Principal component analysis (PCA) was performed to strengthen the hypothesis of a correlation between MCV and ageing compared with other CBC parameters. The cumulative proportion of principal component 2 was 61.25% (Table S1). The biplot of PCA showed that the correlation between age and the MCV followed the same direction as that for the other parameters (Figure 2).
FIGURE 2.
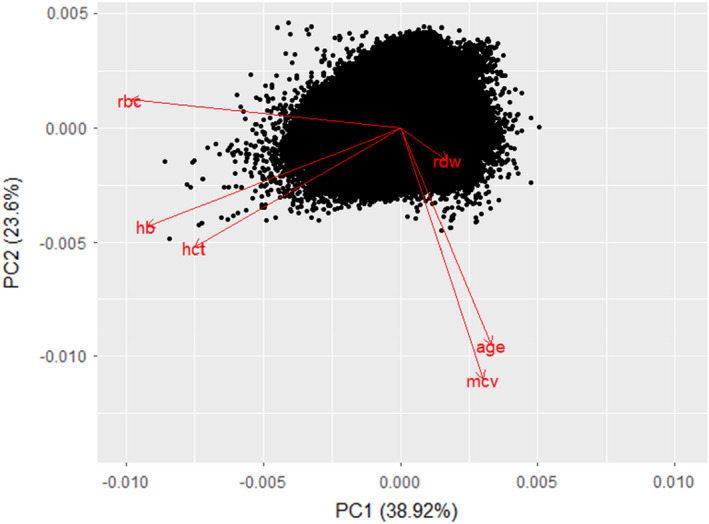
Biplot of principal component analysis of blood components with ages
3.3. Changes in MCV and other CBC components in decade‐wise age groups
We divided the patients into nine decade‐wise age groups. The median MCV values gradually increased in the age groups. The Kruskal–Wallis test was conducted to identify statistical differences in age groups. All CBC parameters showed significant differences according to the age groups; however, the median values of Hb, Hct, RBC and RDW showed no changes up to the first decimal place (Table 1). The post hoc test with the Tukey method showed all age groups were significant differences in MCV. Finally, the MCV median values gradually increased with age, with significant differences among age groups.
TABLE 1.
The changes in MCV and other CBC components in decade‐wise age groups
| Age group (years) | 1–9 | 10–19 | 20–29 | 30–39 | 40–49 | 50–59 | 60–69 | 87–79 | 80–88 | p‐value a |
|---|---|---|---|---|---|---|---|---|---|---|
| Count, n | 27,793 | 48,305 | 94,281 | 111,288 | 156,606 | 207,670 | 176,107 | 122,709 | 32,576 | |
| MCV, fl (median, IQR) | 82.2 (80.5–84.3) | 87.4 (84.7–90.1) | 89.9 (87.4–92.5) | 90.4 (87.7–93.1) | 91.2 (88.5–93.9) | 91.5 (88.9–94.3) | 92.1 (89.4–94.9) | 92.6 (89.8–95.4) | 93.0 (90.2–95.9) | <0.001 b |
| Hb, g/dl (median, IQR) | 13.2 (12.7–13.6) | 14.0 (13.2–15.0) | 14.0 (13.2–15.0) | 14.0 (13.2–15.0) | 14.0 (13.2–15.0) | 14.0 (13.2–15.0) | 14.0 (13.2–15.0) | 14.0 (13.2–15.0) | 14.0 (13.2–15.0) | <0.001 |
| Hct, % (median, IQR) | 38.0 (35.8–39.7) | 38.0 (35.8–39.7) | 38.0 (35.8–39.7) | 38.0 (35.8–39.7) | 38.0 (35.8–39.7) | 38.0 (35.8–39.7) | 38.0 (35.8–39.7) | 38.0 (35.8–39.7) | 38.0 (35.8–39.7) | <0.001 |
| RBC, g/dl (median, IQR) | 4.7 (4.5–4.9) | 4.7 (4.5–4.9) | 4.7 (4.5–4.9) | 4.7 (4.5–4.9) | 4.7 (4.5–4.9) | 4.7 (4.5–4.9) | 4.7 (4.5–4.9) | 4.7 (4.5–4.9) | 4.7 (4.5–4.9) | <0.001 |
| RDW, % (median, IQR) | 12.0 (12.0–13.0) | 12.0 (12.0–13.0) | 12.0 (12.0–13.0) | 12.0 (12.0–13.0) | 12.0 (12.0–13.0) | 12.0 (12.0–13.0) | 12.0 (12.0–13.0) | 12.0 (12.0–13.0) | 12.0 (12.0–13.0) | <0.001 |
Abbreviations: CBC, Complete blood count; Hb, haemoglobin; Hct, haematocrit; IQR, interquartile range; MCV, mean corpuscular volume; RBC, red blood cell; RDW, red cell distribution width.
p‐value from the Kruskal–Wallis test.
All age groups showed significant differences in post hoc tests with the Tukey method.
The MCV among females was significantly higher until the third decade than among males. However, after the fourth decade, the MCV of males was significantly higher than that of females (Table 2). Figure 3 illustrates the decade‐wise age‐dependent increase in the MCV in both sexes.
TABLE 2.
The changes in MCV values in both sexes categorized according to decade‐wise age groups
| Age group (years) | Count (n) | MCV value, fl (median, IQR) | p‐value | ||
|---|---|---|---|---|---|
| Total | Female | Male | |||
| 1–9 | 27,793 | 82.2 (80.5–84.3) | 82.4 (80.7–84.5) | 81.9 (80.3–83.9) | <0.001 |
| 10–19 | 48,305 | 87.4 (84.7–90.1) | 87.6 (84.9–90.3) | 87.3 (84.6–90.0) | <0.001 |
| 20–29 | 94,281 | 89.9 (87.4–92.5) | 90.0 (87.5–92.6) | 89.8 (87.4–92.3) | <0.001 |
| 30–39 | 111,288 | 90.4 (87.7–93.1) | 90.4 (87.6–93.2) | 90.4 (87.9–93.1) | <0.001 |
| 40–49 | 156,606 | 91.2 (88.5–93.9) | 91.0 (88.2–93.7) | 91.3 (88.7–94.1) | <0.001 |
| 50–59 | 207,670 | 91.5 (88.9–94.3) | 91.1 (88.5–93.7) | 92 (89.3–94.8) | <0.001 |
| 60–69 | 176,107 | 92.1 (89.4–94.9) | 91.6 (89.0–94.3) | 92.5 (89.8)–95.3) | <0.001 |
| 70–79 | 122,709 | 92.6 (89.8–95.4) | 92.1 (89.4–94.9) | 93 (90.2–95.9) | <0.001 |
| 80–88 | 32,576 | 93.0 (90.2–95.9) | 92.5 (89.7–95.4) | 93.6 (90.8–96.5) | <0.001 |
Note: p‐value from Mann–Whitney U‐test.
Abbreviations: IQR, Interquartile range; MCV, mean corpuscular volume.
FIGURE 3.
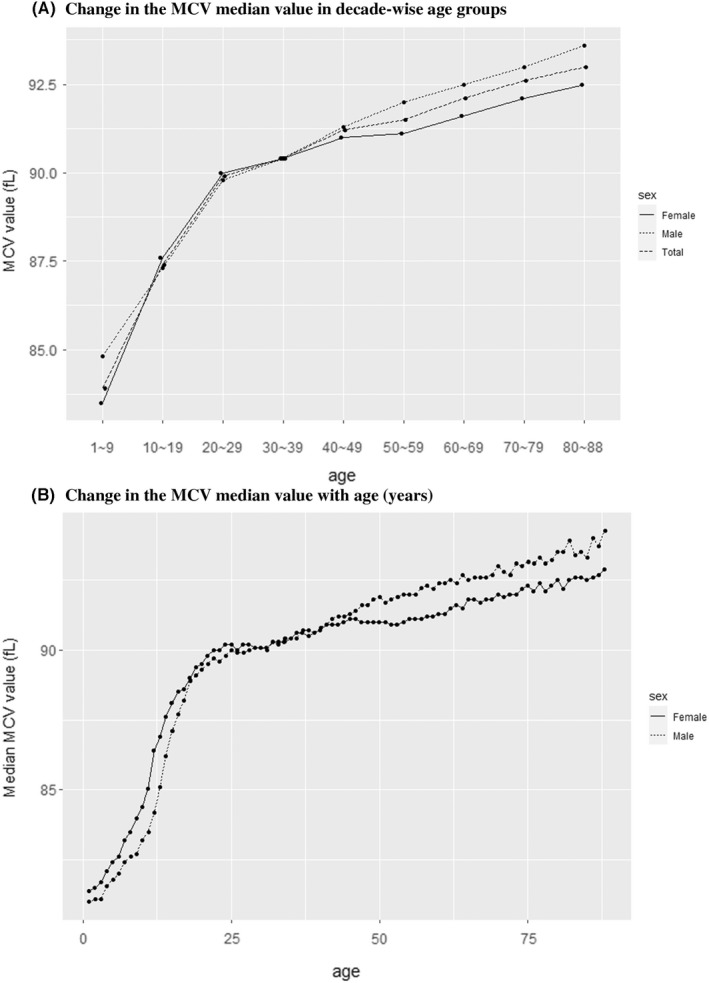
(A) Changes in the MCV median value in decade‐wise age groups. (B) Changes in the MCV median value with age (years)
3.4. Linear regression analysis of MCV and age
The age‐wise changes in the median MCV value are shown in Figure 3B and the Table S2. We obtained two linear regression equations for the relationship of MCV with age. The linear relationship for patients aged 1–25 years had a larger slope than that for patients aged 26–88 years. The equation for patients aged 1–25 years was MCV = 0.40*(age) + 81.24 (R 2 = 0.97) in females and 0.45*(age) + 79.58 (R 2 = 0.98) in males. Among patients aged 26–90 years, the equation was MCV = 0.04*(age) + 88.97 (R 2 = 0.96) in females and 0.06*age + 88.30 (R 2 = 0.98) in males (Figures 4 and 5).
FIGURE 4.
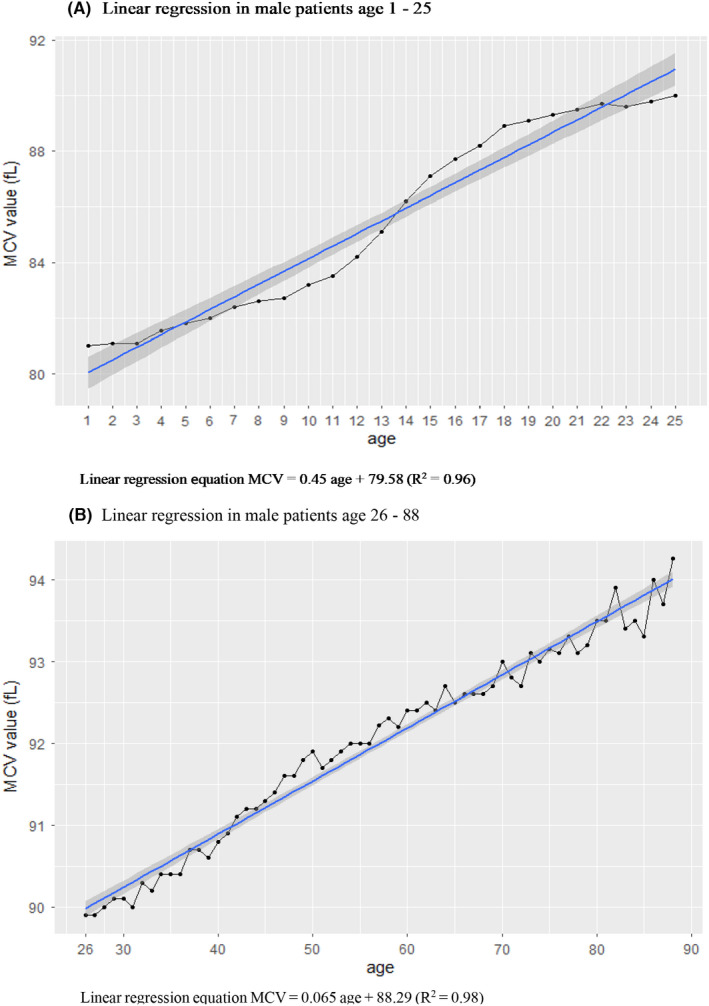
(A) Linear regression in male patients aged 1–25 years. (B) Linear regression in male patients aged 26–88 years
FIGURE 5.
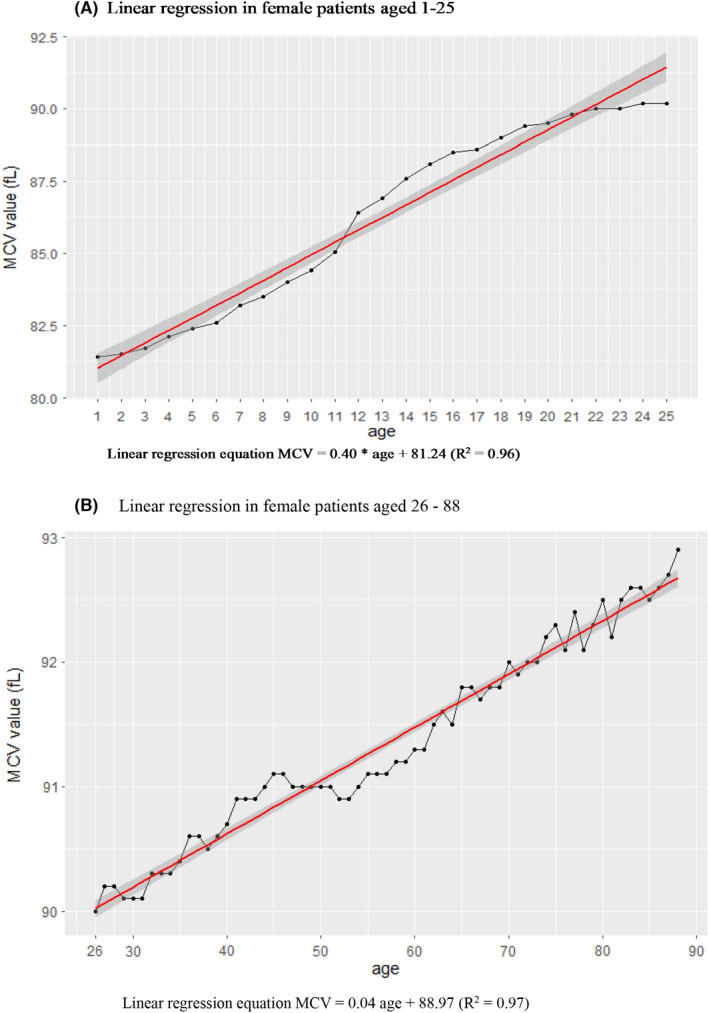
(A) Linear regression in female patients aged 1–25 years. (B) Linear regression in female patients aged 26–88 years
4. DISCUSSION
This study included more patient data than any of the previous studies, 12 , 13 , 14 , 17 , 18 and the findings revealed a distinct age‐related increase in MCV compared with other CBC parameters. The MCV increased gradually from 1 to 88 years of age, and the increase could be represented by two different sets of linear regression Equations.
MCV is used to classify anaemia as either microcytic, normocytic or macrocytic. 5 In microcytic anaemia, the average erythrocyte volume is smaller than normal, generally under 80 fl, and this finding is commonly observed in cases of chronic iron‐deficient anaemia, anaemia of chronic disease and thalassemias. Macrocytic anaemia is characterized by elevated MCV (generally over 100 fl) and is subcategorized as megaloblastic or non‐megaloblastic. Megaloblastic anaemia is caused by impaired DNA synthesis and commonly occurs in folate deficiency and vitamin B12 deficiency, while non‐megaloblastic anaemia occurs due to hepatic insufficiency, chronic alcoholism and rare congenital diseases. 5
The MCV has also been recently reported to be a risk factor for mortality and morbidity in some clinical settings. Borderline high MCV (MCV > 95 fl) was independently associated with arterial stiffness measured by brachial‐ankle pulse wave velocity in apparently healthy individuals. 19 In patients with stage 3–5 chronic kidney disease (CKD), MCV was associated with all‐cause mortality, cardiovascular mortality and infection‐associated mortality. 9 Other studies with CKD patients showed that an increase in MCV was independently associated with more impaired endothelial function and insulin resistance and showed higher cardiovascular event and mortality rates. 20 In older patients, high MCV levels were also significantly associated with high rates of decline on tasks of global mental status, long‐delay memory and attention, even after adjusting for potential confounders. 21
Age‐related changes in MCV may be a part of the normal ageing process. Young RBCs are released into circulation as reticulocytes from the bone marrow, and old RBCs will be removed from circulation within a few hours or days. 22 The lifespan of RBCs in older individuals is shorter than that in young adults, and the RBC production increases to compensate for the shorter lifespan. 14 , 23 These younger RBCs tend to have larger volumes, as measured by MCV. 14 Various cytokines and growth factors are involved in the formation of RBCs, including erythropoietin, which is essential for the survival and differentiation of erythropoietic progenitors. 24 , 25 Other growth factors and cytokines, such as insulin, insulin‐like growth factors (IGFs), hepatocyte growth factors and interleukins (IL‐3, IL‐4, IL‐6, IL‐9 and IL‐11), have also been known to co‐stimulate of growth of the RBCs. 24 , 26 The relationship between biological changes and ageing is not fully understood. One recent study revealed that prolonged growth hormone, insulin and IGF nutrient response signalling pathways were silent killers of stem cells and one the factors responsible for ageing. 27 Ageing accelerates after reproductive age, and several mechanisms are known to accelerate this process. 28 The age‐related changes in MCV showed two linear trends with different slopes, with the distinction appearing from 25 years of age. This result may provide evidence for accelerated ageing after reproductive age, but more biological studies are needed to validate this assumption. Moreover, additional research is required to explain the link among IGF and MCV.
Our study had several limitations. First, the retrospectively obtained patient cohort included inpatients, outpatients and emergency room patients in addition to those who had undergone medical check‐ups. Therefore, these patients were more likely to have disease and may not represent the general population. Second, we could not control the influence of factors other than anaemia, including underlying diseases such as chronic hepatitis, chronic renal disease or malignancy disease, on MCV changes, and the influence of these factors should be verified in future studies. Third, we did not include most important clinical outcome, that is mortality. Further studies are needed to identify the relation between an increase in MCV with ageing and mortality.
5. CONCLUSIONS
Cleaning of medical data involves substantial data loss. Our analysis of a large data sample from Chungbuk National University Hospital showed that the MCV gradually increased with age. The MCV values showed two distinct linear relationships in patients aged 1–25 and 26–88 years. Female patients aged 40–80 years showed lower MCV values than males patients of the same age group.
AUTHOR CONTRIBUTIONS
Jin Young Lee: Conceptualization (equal); data curation (equal); formal analysis (equal); writing – original draft (equal); writing – review and editing (equal). Hanlim Choi: Data curation (equal); validation (equal); writing – original draft (supporting); writing – review and editing (equal). Jin Woo Park: Conceptualization (equal); formal analysis (equal); supervision (equal); validation (equal); writing – review and editing (equal). Bo Ra Son: Supervision (equal); validation (equal); writing – review and editing (equal). Jong Hyock Park: Supervision (equal); validation (equal); writing – review and editing (equal). Lee Chan Jang: Conceptualization (lead); data curation (lead); formal analysis (lead); methodology (lead); project administration (lead); supervision (lead); validation (lead); writing – original draft (equal); writing – review and editing (equal). Jae Gil Lee: Supervision (equal); writing – review and editing (equal).
CONFLICT OF INTEREST
The authors declare no competing financial interests.
Supporting information
Table S1
Table S2
ACKNOWLEDGEMENTS
We would like to thank Editage (www.editage.co.kr) for English language editing.
Lee JY, Choi H, Park JW, et al. Age‐related changes in mean corpuscular volumes in patients without anaemia: An analysis of large‐volume data from a single institute. J Cell Mol Med. 2022;26:3548‐3556. doi: 10.1111/jcmm.17397
DATA AVAILABILITY STATEMENT
The datasets generated during and/or analysed during the current study are not publicly available due to our institutional policy.
REFERENCES
- 1. Leach M. Interpretation of the full blood count in systemic disease – a guide for the physician. J R Coll Physicians Edinb. 2014;44:36‐41. [DOI] [PubMed] [Google Scholar]
- 2. Park SK. An interpretation on abnormal finding of CBC. Korean J Med. 2010;78:531‐539. [Google Scholar]
- 3. McLean E, Cogswell M, Egli I, Wojdyla D, de Benoist B. Worldwide prevalence of anaemia, WHO vitamin and mineral nutrition information system, 1993‐2005. Public Health Nutr. 2009;12:444‐454. [DOI] [PubMed] [Google Scholar]
- 4. White CT, Barrett BJ, Madore F, et al. Clinical practice guidelines for evaluation of anemia. Kidney Int Suppl. 2008;74:S4‐S6. [DOI] [PubMed] [Google Scholar]
- 5. Maner BS, Moosavi L. Mean corpuscular volume (MCV). In: StatPearls [Internet]. StatPearls Publishing; 2021. [PubMed] [Google Scholar]
- 6. Thong KL, Hanley SA, McBride JA. Clinical significance of a high mean corpuscular volume in nonanemic patients. Can Med Assoc J. 1977;117:908‐910. [PMC free article] [PubMed] [Google Scholar]
- 7. Nagai H, Yuasa N, Takeuchi E, Miyake H, Yoshioka Y, Miyata K. The mean corpuscular volume as a prognostic factor for colorectal cancer. Surg Today. 2018;48:186‐194. [DOI] [PubMed] [Google Scholar]
- 8. Zheng YZ, Dai SQ, Li W, et al. Prognostic value of preoperative mean corpuscular volume in esophageal squamous cell carcinoma. World J Gastroenterol. 2013;19:2811‐2817. [DOI] [PMC free article] [PubMed] [Google Scholar]
- 9. Hsieh YP, Chang CC, Kor CT, Yang Y, Wen YK, Chiu PF. Mean corpuscular volume and mortality in patients with CKD. Clin J Am Soc Nephrol. 2017;12:237‐244. [DOI] [PMC free article] [PubMed] [Google Scholar]
- 10. Myojo M, Iwata H, Kohro T, et al. Prognostic implication of macrocytosis on adverse outcomes after coronary intervention. Atherosclerosis. 2012;221:148‐153. [DOI] [PubMed] [Google Scholar]
- 11. Wu TH, Fann JC, Chen SL, et al. Gradient relationship between increased mean corpuscular volume and mortality associated with cerebral ischemic stroke and ischemic heart disease: a longitudinal study on 66,294 Taiwanese. Sci Rep. 2018;8:16517. [DOI] [PMC free article] [PubMed] [Google Scholar]
- 12. Cheng CK, Chan J, Cembrowski GS, van Assendelft OW. Complete blood count reference interval diagrams derived from NHANES III: stratification by age, sex, and race. Lab Hematol. 2004;10:42‐53. [DOI] [PubMed] [Google Scholar]
- 13. Mahlknecht U, Kaiser S. Age‐related changes in peripheral blood counts in humans. Exp Ther Med. 2010;1:1019‐1025. [DOI] [PMC free article] [PubMed] [Google Scholar]
- 14. Gamaldo AA, Ferrucci L, Rifkind JM, Zonderman AB. Age‐related changes in mean corpuscular volume in adult whites and African Americans. J Am Geriatr Soc. 2011;59:1763‐1764. [DOI] [PMC free article] [PubMed] [Google Scholar]
- 15. Jang LC. The relation between mean corpuscular volume and age. Chungbuk J. 2020;30:9‐14. [Google Scholar]
- 16. Pluncevic Gligoroska J, Gontarev S, Dejanova B, Todorovska L, Shukova Stojmanova D, Manchevska S. Red blood cell variables in children and adolescents regarding the age and sex. Iran J Public Health. 2019;48:704‐712. [PMC free article] [PubMed] [Google Scholar]
- 17. Hamid JS, Atenafu EG, Borkhoff CM, et al. Reference intervals for hemoglobin and mean corpuscular volume in an ethnically diverse community sample of Canadian children 2 to 36 months. BMC Pediatr. 2021;21:241. [DOI] [PMC free article] [PubMed] [Google Scholar]
- 18. Nah EH, Kim S, Cho S, Cho HI. Complete blood count reference intervals and patterns of changes across pediatric, adult, and geriatric ages in Korea. Ann Lab Med. 2018;38:503‐511. [DOI] [PMC free article] [PubMed] [Google Scholar]
- 19. Kwon H, Park B. Borderline‐high mean corpuscular volume levels are associated with arterial stiffness among the apparently healthy Korean individuals. Korean J Fam Med. 2020;41:387‐391. [DOI] [PMC free article] [PubMed] [Google Scholar]
- 20. Solak Y, Yilmaz MI, Saglam M, et al. Mean corpuscular volume is associated with endothelial dysfunction and predicts composite cardiovascular events in patients with chronic kidney disease. Nephrology (Carlton). 2013;18:728‐735. [DOI] [PubMed] [Google Scholar]
- 21. Gamaldo AA, Ferrucci L, Rifkind J, Longo DL, Zonderman AB. Relationship between mean corpuscular volume and cognitive performance in older adults. J Am Geriatr Soc. 2013;61:84‐89. [DOI] [PMC free article] [PubMed] [Google Scholar]
- 22. Lurie S, Gidron Y, Piper I, et al. Memory performance in late pregnancy and erythrocyte indices. J Soc Gynecol Investig. 2005;12:293‐296. [DOI] [PubMed] [Google Scholar]
- 23. Shperling T, Danon D. Age population distribution of erythrocytes in young and old healthy donors. Exp Gerontol. 1990;25:413‐422. [DOI] [PubMed] [Google Scholar]
- 24. Ratajczak J, Zhang Q, Pertusini E, Wojczyk BS, Wasik MA, Ratajczak MZ. The role of insulin (INS) and insulin‐like growth factor‐I (IGF‐I) in regulating human erythropoiesis. Studies in vitro under serum‐free conditions‐‐comparison to other cytokines and growth factors. Leukemia. 1998;12:371‐381. [DOI] [PubMed] [Google Scholar]
- 25. Wu H, Klingmüller U, Besmer P, Lodish HF. Interaction of the erythropoietin and stem‐cell‐factor receptors. Nature. 1995;377:242‐246. [DOI] [PubMed] [Google Scholar]
- 26. Correa PN, Axelrad AA. Production of erythropoietic bursts by progenitor cells from adult human peripheral blood in an improved serum‐free medium: role of insulinlike growth factor 1. Blood. 1991;78:2823‐2833. [PubMed] [Google Scholar]
- 27. Ratajczak MZ, Bartke A, Darzynkiewicz Z. Prolonged growth hormone/insulin/insulin‐like growth factor nutrient response signaling pathway as a silent killer of stem cells and a culprit in aging. Stem Cell Rev Rep. 2017;13:443‐453. [DOI] [PMC free article] [PubMed] [Google Scholar]
- 28. Brzeźniakiewicz‐Janus K, Rupa‐Matysek J, Tukiendorf A, et al. Red blood cells mean corpuscular volume (MCV) and red blood distribution width (RDW) parameters as potential indicators of regenerative potential in older patients and predictors of acute mortality ‐ preliminary report. Stem Cell Rev Rep. 2020;16:711‐717. [DOI] [PMC free article] [PubMed] [Google Scholar]
Associated Data
This section collects any data citations, data availability statements, or supplementary materials included in this article.
Supplementary Materials
Table S1
Table S2
Data Availability Statement
The datasets generated during and/or analysed during the current study are not publicly available due to our institutional policy.


