Abstract
Objective
The Grades of Recommendations, Assessment, Development and Evaluation working group recently developed an innovative approach to interpreting results from network meta-analyses (NMA) through minimally and partially contextualised methods; however, the optimal method for presenting results for multiple outcomes using this approach remains uncertain. We; therefore, developed and iteratively modified a presentation method that effectively summarises NMA results of multiple outcomes for clinicians using this new interpretation approach.
Design
Qualitative descriptive study.
Setting
A steering group of seven individuals with experience in NMA and design validation studies developed two colour-coded presentation formats for evaluation. Through an iterative process, we assessed the validity of both formats to maximise their clarity and ease of interpretation.
Participants
26 participants including 20 clinicians who routinely provide patient care, 3 research staff/research methodologists and 3 residents.
Main outcome measures
Two team members used qualitative content analysis to independently analyse transcripts of all interviews. The steering group reviewed the analyses and responded with serial modifications of the presentation format.
Results
To ensure that readers could easily discern the benefits and safety of each included treatment across all assessed outcomes, participants primarily focused on simple information presentations, with intuitive organisational decisions and colour coding. Feedback ultimately resulted in two presentation versions, each preferred by a substantial group of participants, and development of a legend to facilitate interpretation.
Conclusion
Iterative design validation facilitated the development of two novel formats for presenting minimally or partially contextualised NMA results for multiple outcomes. These presentation approaches appeal to audiences that include clinicians with limited familiarity with NMAs.
Keywords: QUALITATIVE RESEARCH, STATISTICS & RESEARCH METHODS, EDUCATION & TRAINING (see Medical Education & Training)
Strengths and limitations of this study.
Extensive design validation in a targeted audience has validated the network meta-analyses (NMA) presentation approaches within this study; something that has not been done for other presentation formats.
Structured qualitative research methodology has ensured accurate use of user feedback to develop and refine the NMA presentation formats.
Limited by the omission of some information within the presentation formats in order to achieve simplicity and interpretability, such as greater detail for individual outcomes, absolute effects or specifics about the certainty of evidence assessments.
The aforementioned information should still be included in NMA manuscripts, but cannot be feasibly fit within the presentation formats.
Introduction
Network meta-analysis (NMA) provides an increasingly popular approach to evidence synthesis that allows comparison between multiple competing treatment options within a single analysis.1 2 Although NMA is an important tool for clinicians, patients and other stakeholders, results involve multiple treatments and outcomes, and as a result are complex and difficult to interpret.3
Common methods for presenting NMA results include the use of forest plots, league tables and surface under the cumulative ranking curve.1 4 The key limitation with these options is that they can only provide results of a single outcome.5 NMAs often compare multiple benefit and harm outcomes, resulting in challenges for NMA authors seeking to avoid presentation methods that are onerous for clinicians to review and challenging for them to understand.6
There are a number of novel approaches that have been suggested for presenting NMA results for multiple outcomes7 8; however, these approaches lack key information, present challenges to interpretation and have not undergone design validation with their target audiences. While some previously suggested approaches have merit for a limited number of outcomes,4 6 9–12 although not all taking certainty of evidence into account, they have serious limitations for simultaneous presentation of multiple outcomes.
Recently, the Grading of Recommendations, Assessment, Development and Evaluation (GRADE) working group has suggested two variations on a new methodology that places interventions in categories from best to worst considering the estimates of effect and certainty of the evidence for each comparison.13 14 We; therefore, developed interpretable presentation approaches for NMAs with multiple outcomes that builds on GRADE guidance and effectively summarises results for clinicians and other relevant audiences.
Methods
Study design
A seven-member steering committee (MRP, BS, JWB, RB-P, CAC-G, FKN and GG) oversaw study design and implementation. The committee generated two initial presentation formats and chose a combination of large group sessions and individual design validation interviews to inform iterative modifications of the two initial formats. The presentation format consisted of treatment options in rows and outcomes in columns, with colour-coded shading of cells to identify the magnitude and certainty of the treatment effect in relation to the reference treatment. The steering committee developed the initial versions through a series of internal group discussions, which involved: determining the pertinent information for the presentation format to contain, options for how that information could be shown within a single presentation format, and draft presentation formats that may present this pertinent information. The group believed that the format should provide both relative treatment effects, as well as the certainty in those estimates for all outcomes, within a single presentation tool.
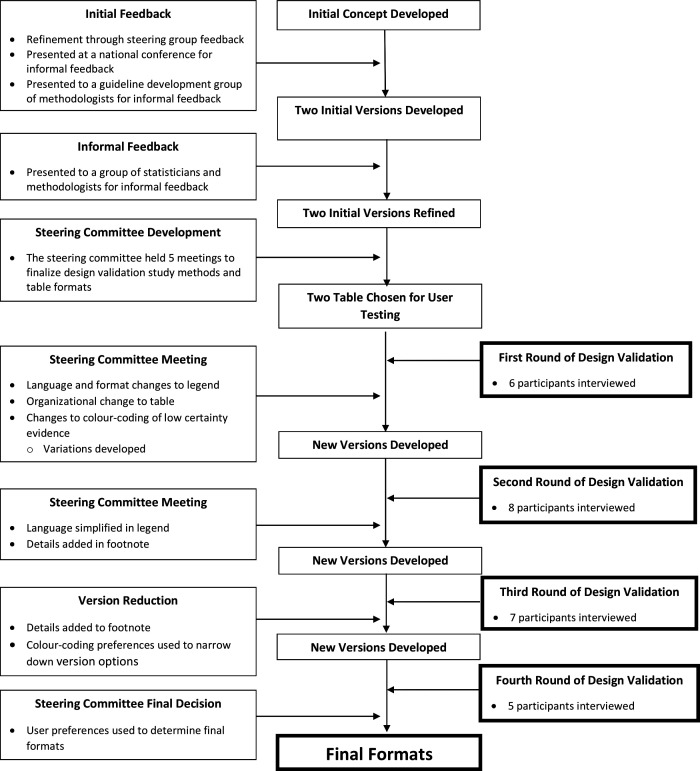
The steering committee developed initial versions of the presentation tool, which they then presented in separate large-group settings to gain outside insight. Initial large group testing with two groups of methodologists, graduate students in health research-focussed programmes and statisticians, as well as presentation at a national conference (2019 Canadian Pain Society annual scientific meeting), provided the foundational feedback for modifications of the initial presentation versions. After making iterative improvements from the group presentation feedback, the steering committee began one-on-one interviews with clinicians to gain further insights for improvement. The steering committee reviewed input from four rounds of design validation individual interviews, iteratively modifying the formats after each round and presenting updated options of the presentation versions to subsequent participants.
For the user interviews, the committee chose a qualitative descriptive study approach that focuses on creating a close description of the information that participants provide.15 This is ideal for design validation that, without interpretive direction, aims to optimise the understandability of a tool within the target population. Participants provided informed consent at the beginning of their interview. We followed, when applicable, the consolidated criteria for reporting qualitative research checklist in reporting our findings.16
Sampling and recruitment
This study used purposeful sampling to identify participants who could provide information-rich interviews to inform the design validation process.15 17 Target users for this study included academic and non-academic clinicians, research staff/research methodologists and residents. The steering committee, through their professional contacts, provided a pool of initial possible participants that the principal investigator supplemented using snowball sampling technique.18 Specifically, we asked individuals who agreed to participate for contact information of any colleagues whom we could approach to interview. Prior to their interviews, each participant received information outlining the purpose of the study. Study recruitment ceased when data collection reached redundancy—the point at which there were no further refinements requested to improve the interpretability of the presentation formats.18
Data collection
The principal investigator (MRP) conducted all design validation interviews either in-person or through video teleconferencing. Interviews followed a flexible interview guide (online supplemental appendix A) to leave the conversation open for participants to explore any topics they felt were relevant and important.15 Throughout the study, the principal investigator iteratively updated the interview guide to explore areas of importance that emerged. Interviews began with a brief introduction to NMA methods, followed by questions regarding the participant’s familiarity and experience with NMA. Participants then viewed the current versions of the NMA presentation formats and provided feedback. YJG or MRP transcribed all interviews verbatim. Transcripts were not returned to participants and interviewers did not conduct follow-up interviews. The steering committee incorporated all feedback to arrive at two final presentation versions.
bmjopen-2021-056400supp001.pdf (75.1KB, pdf)
Patient and public involvement
This study did not include patient or public involvement.
NMA for design validation
The steering committee developed five core criteria to which the example NMA must adhere: (1) variability in quality of evidence (2) variability in magnitudes of effect; (3) assessment of both benefits and harms; (4) inclusion of both continuous and binary outcomes; and (5) including at least five outcomes and five interventions. Based on these criteria the steering committee chose, for design validation, a recent NMA that used a minimally contextualised approach to address acute pain management in patients experiencing non-low back acute musculoskeletal injuries.19
Based on the GRADE approach,13 this NMA categorised, for each benefit outcome, interventions as among those with the largest benefit, those with intermediate benefit, and those with the least benefit. For each harm outcome, they categorised interventions as among the least harmful, intermediate harm and the most harmful. They then categorised interventions as those for which there was high or moderate certainty evidence, and those for which there was low or very low-quality evidence.19 These results provided the example for design validation.
Data analysis
Two reviewers (MRP and SB) independently conducted data analysis, in duplicate, using a qualitative content analysis approach.17 The study team recruited participants, collected data and conducted data analysis in parallel. As new data became available, the reviewers coded and grouped similar phrases, patterns and themes.17 When discrepancies in feedback were identified, these would be noted and further elaborated on within future interviews. The feedback for this discrepancy would then be shared with the steering committee to review and identify if sufficient data had been captured to adequately determine a resolution for the discrepancy through consensus.17 Data triangulation was used through multiple forms of data collection, as both large group and individual interview sessions were used. Additionally, data triangulation was provided through two forms of data analysis: independent qualitative content analysis, and group deliberation through steering committee meetings.17 20 The steering committee met four times over a period of 14 months to review the collected data and made iterative changes to the presentation formats as dictated by feedback, initially from large group presentations and subsequently from design validation. When analysis of the data provided actionable feedback, the reviewers presented their findings to the steering committee who ranked feedback as a ‘large change required’, ‘moderate change required’ or ‘minor change required’ and then revised the presentation format(s) accordingly.
Subsequent participants provided input on the modified versions of the NMA results presentations. Participants commented regarding their interpretation of the data within the presentation format; the team considered study objectives met once participants consistently reported a clear interpretation of the results with no or minimal suggested modifications. Reviewers documented all changes to the presentation format in a study audit trail.15 20 Reviewers conducted all qualitative analysis using RQDA software (R V.3.5.0).
Results
Study sample
Two focus groups, both of which included methodologists, graduate students and statisticians, participated in the initial large group testing: the first, a critical care guideline development group (GUIDE: https://guidecanada.org/) many of whose members have NMA expertise (65 attendees); the second, a research group (CLARITY: http://www.clarityresearch.ca/) who meet regularly at McMaster University to discuss current methodological and statistical topics (20 attendees).
The design validation portion of this study included 26 participants of mean (SD) age of 47.6 (13.9) years, 20 of whom were clinicians whose primary activity involved direct patient care (77%); 3 research staff/research methodologists (12%) and 3 residents (12%). Typical participants were male (73%) physicians in clinical practice for almost two decades (mean (SD): 19.5 (14.3) years) with no prior involvement with conducting an NMA (58%) (table 1).
Table 1.
Participant demographics: n=26
| Demographic | Value |
| Age (mean, SD) years | 47.6 (13.9) |
| Gender (count, %) | |
| Male | 19 (73.1) |
| Female | 7 (26.9) |
| Primary occupation (count, %) | |
| Clinician | 20 (76.9) |
| Research staff/methodologist | 3 (11.5) |
| Resident | 3 (11.5) |
| Highest degrees held (count, %) | |
| MD | 12 (46.2) |
| MD, MSc/MPH | 8 (30.8) |
| PhD | 3 (11.5) |
| MD, PhD | 2 (7.7) |
| BSc | 1 (3.9) |
| Years in practice (mean, SD) | 19.5 (14.3) |
| Previous involvement in an NMA? (count, %) | |
| Yes | 11 (42.3) |
| No | 15 (57.7) |
| Used an NMA to inform practice? (count, %) | |
| Yes | 17 (65.4) |
| No | 9 (34.6) |
MPH, masters of public health; NMA, network meta-analysis.
Content analysis themes
Main themes that arose from the content analysis conducted on interview transcripts of participant interviews included ‘organisational’, ‘language/terminology’, ‘included information’ and ‘colour options’. Respondents also provided feedback regarding necessary details to include in the presentations’ footnote. The following sections provide details regarding the most important feedback and how this feedback informed choices regarding presentation format. The fourth round of design validation resulted in minimal new information, resulting in two presentation versions that participants deemed satisfactory.
Final presentation versions
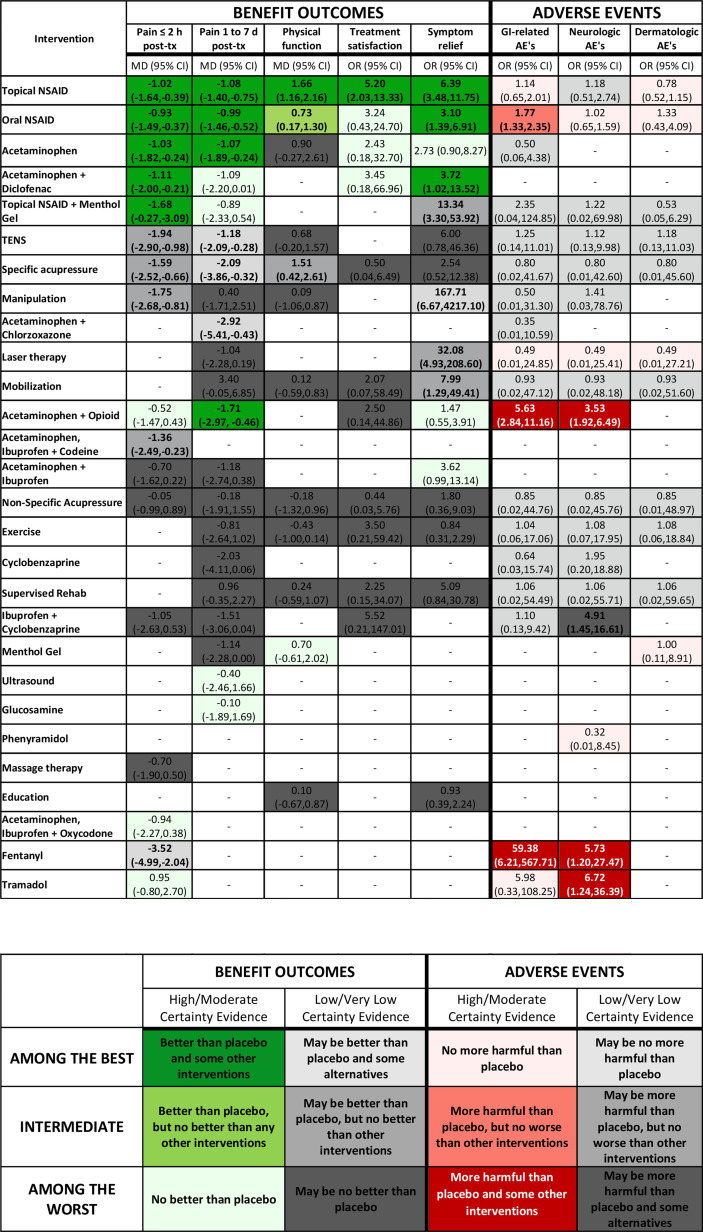
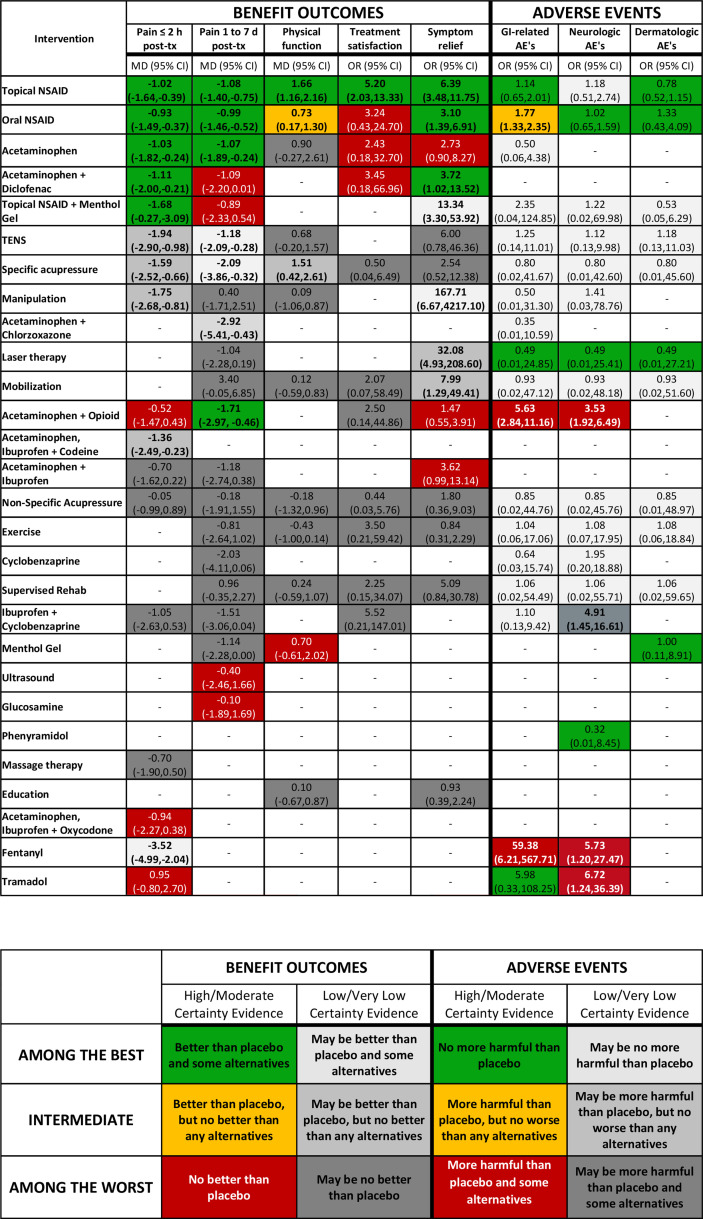
Ultimately, respondents proved equally enthusiastic about two options; the steering group, therefore, chose to offer both as alternative presentations. Figure 1 summarises the development process from conceptualisation to the final presentation versions. We will refer to the presentation in figure 2 as the ‘colour gradient’ version and the presentation in figure 3 as the ‘stoplight’ version. Each presentation has a legend and footnote with pertinent information that the design validation process demonstrated necessary to include.
Figure 1.
Study overview.
Figure 2.
Gradient colour variation: no evidence; Reference group=placebo; bold=statistically significant (p<0.05). TENS: transcutaneous electrical nerve stimulation. AE, adverse event; MD, mean difference; NSAID, non-steroidal anti-inflammatory drug; TX, treatment.
Figure 3.
Stoplight colour version: no evidence; Reference group=placebo; bold=statistically significant, p<0.05. AE, adverse event; MD, mean difference; NSAID, non-steroidal anti-inflammatory drug; TX, treatment.
Figure organisation
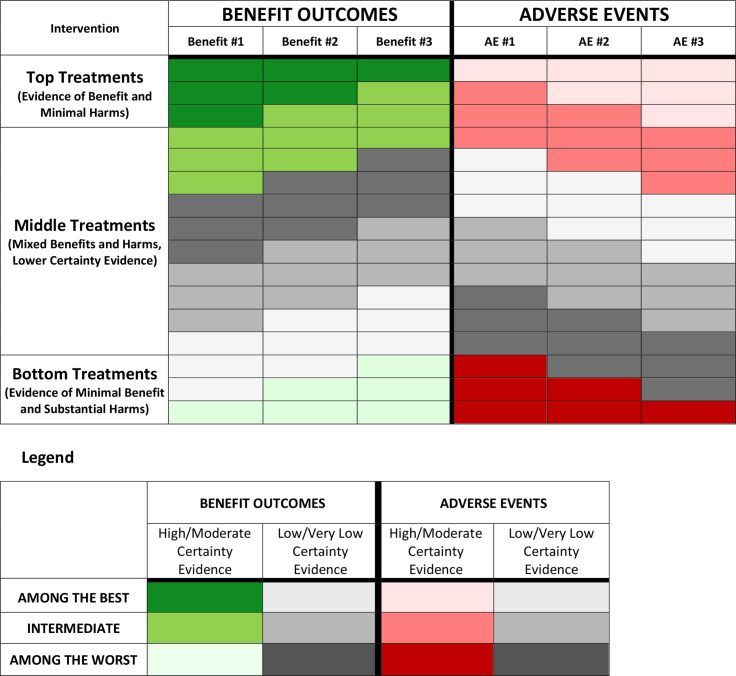
Design validation identified a number of key components shouthat aid in interpreting presentation formats. Within the organisational theme, the use of a bolded vertical line to separate benefit and adverse event outcomes, as well as the header and results data (horizontal), proved desirable. Regarding the ordering of interventions from top to bottom in the rows, participants preferred ordering treatment options at the top with high/moderate certainty evidence of maximal benefit and minimal harm to those with high/moderate certainty evidence of minimal or no benefits and significant harms placed in the bottom rows. Respondents provided mixed feedback regarding the organisation of the presentation within the middle section, with no consistent guidance that could be applied across all NMAs. This leaves the optimal ordering within the middle rows that include treatments that have low/very low certainty evidence, treatments with high/moderate certainty evidence of intermediate effects and treatments with trade-offs between both large benefits and large harms, uncertain (or perhaps there is no single optimal ordering). Figure 4 provides an overview of guidance regarding intervention order within the rows.
Figure 4.
Intervention organisational guide.
Presentation terminology
Respondents indicated that the presentation should clearly and succinctly label outcomes with specification of the measure of treatment effect (eg, ORs mean differences) and that the header of each column should include these labels. Participants had no strong preference regarding the terminology of ‘benefit’ and ‘adverse events’ outcome categories; options discussed included ‘effectiveness/efficacy outcomes’ and ‘harms outcomes’. Whatever option investigators choose, the terminology should remain consistent across the presentation, legend and manuscript text.
Presentation included information
Participants considered the magnitude of treatment effect, CIs/credible intervals, certainty of evidence and statistical significance to be the four important elements that should be included in each comparison cell. Possibilities explicitly discussed but rejected included sample size, patient characteristics and heterogeneity/incoherence estimates. Respondents considered these items as important elements of the NMA, but felt they would be better suited within another section of the manuscript rather than within this summary presentation.
Footnote included information
Participants felt that footnotes should include: an indication of a dash representing no available evidence (-: no evidence); designation of the reference group (eg, reference group: placebo); and labelling of how statistical significance within the presentation is identified (ie, Bold=statistically significant, p<0.05); as well as all abbreviations used within the presentation.
Legend organisation
Participants felt that benefit outcomes should be located in the left columns, with a bold vertical line separating the benefit and adverse event outcomes within the legend—similar to the structure of the main presentation. They also suggested a bold horizontal line separating the header from the legend in a similar format as within the main presentation. Within the benefit and adverse event sections, respondents preferred that high/moderate certainty evidence categories should be presented in the left column, and low/very low certainty in the right column. High and moderate certainty evidence, as well as low and very low certainty evidence were grouped together to simplify the presentation format into two groups (high/moderate and low/very low), as participants perceived these groupings to hold similar weight in clinical decision making.
Legend terminology
Participants encouraged the use of simple language within the legend. Participants preferred legend rows organised from ‘among the best’ to ‘among the worst’ vertically down the first column of the legend, with the middle category labelled as ‘intermediate’. Terms such as ‘better’ and ‘worse’ were clearer to participants than terminology such as ‘statistically significant’; specifically, respondents favoured ‘better than placebo’ over ‘statistically significant over placebo’.
The language used for our NMA example, in accordance with the minimally contextualised approach, contained treatments that were ‘better than placebo and some other interventions’, ‘better than placebo, but no better than any other interventions’, and ‘no better than placebo’ for high/moderate certainty evidence of benefit outcomes. For high/moderate certainty evidence of harm outcomes, the corresponding language was ‘no more harmful than placebo’, ‘more harmful than placebo, but no worse than other interventions’, and ‘more harmful than placebo and some other interventions’. Participants felt that, with respect to category of magnitude of effect low/very low certainty evidence descriptions should be the same as those of the high/moderate certainty evidence categories, with the included qualifier of ‘may be’ at the beginning of the description of low to very low certainty evidence.
Gradient colour coding
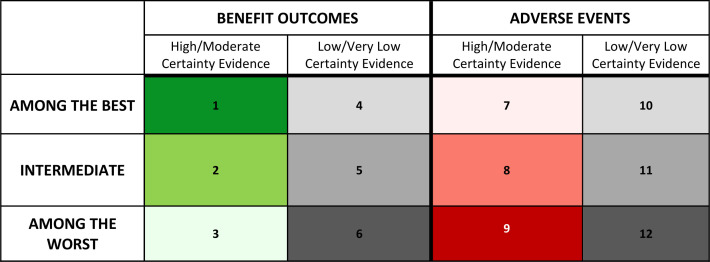
The gradient colour-coding scheme uses three shades of green for the high/moderate certainty benefit outcomes (figure 5: cells 1–3), and three shades of red for the high/moderate certainty adverse events (figure 5: cells 7–9). The use of three-shade grey gradient for low/very low certainty evidence is consistent for both beneficial outcomes and adverse events (figure 5: cells 4–6, 10–12). Participants preferred dark grey be used for the ‘among the worst’ category (least beneficial or most harmful) and light grey be used for the ‘among the best’ category (most beneficial or least harmful), when presenting low/very low certainty of evidence results.
Figure 5.
Gradient colour coding.
Participants had clear views regarding the colour shades used in figure 5: cell 3 (among the least beneficial; high/moderate certainty), and figure 5: cell 7 (among the least harmful; high/moderate certainty): because green is intuitively associated with positive results, they suggested caution regarding the use of a green shade for treatments categorised as ‘among the worst’ in benefit outcomes supported by high/moderate certainty evidence (figure 5: cell 3). Participants strongly suggested that the shade of green used in this cell should, as a result, be a pale and faint green. Similarly, figure 5: cell 7 uses a shade of red, despite being within the ‘among the best’ category in adverse events supported by high/moderate certainty evidence. Intuitively, participants noted that red is associated with poorer results. In order to avoid this inappropriate association, they suggested figure 5: cell 7 should use a pale and faint shade of red. Other options tested used white for figure 5: cell 3, and figure 5: cell 7; however, participants ultimately believed that faint colouring within the respective colour gradients was most appropriate and did not hinder interpretation.
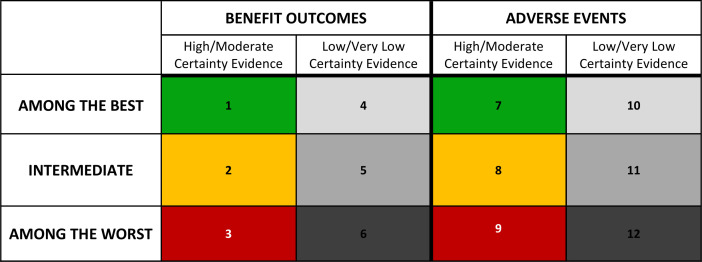
Stoplight colour coding
Because it dealt with the aforementioned concerns of the gradient colour-coding, participants also expressed enthusiasm for the stoplight colour coding. The use of the same colour scheme across figure 6: cells 1–3 and figure 6: cells 7–9 simplifies the interpretation based on colour. Although the stoplight colour-coding addressed concerns with the gradient option, some participants preferred the gradient colour coding due to the clear distinction between benefit and harms outcomes. Others also felt that the stoplight colour coding looked distracting due to the inclusion of three bold colours, while the gradient colour coding reserves bold colours that ‘stand out’ for the comparisons with large benefits or large harms.
Figure 6.
Stoplight colour coding.
Discussion
The GRADE working group has developed methodologically coherent and innovative approaches to rating treatments within NMAs, including both benefits and harms, as ‘among the best’, ‘intermediate’ and ‘among the worst’.13 14 This may represent an important advance in the interpretation of the results of NMAs for clinicians using findings to guide clinical care. Clinicians, however, need to apply this rating for all outcomes of importance to patients. Rigorously developed, user-friendly, intuitive and tested approaches to simultaneous presentation of rated treatments across multiple outcomes has thus far been unavailable for either the new GRADE rating approach or prior approaches to enhance interpretability.4–6 9 12
This study has addressed existing limitations by developing presentation methods that summarise NMA results for multiple outcomes in clear and interpretable formats. Although previous methods may still be useful in presenting the results of individual outcomes in greater detail with certainty of evidence incorporated,4–6 9 the current presentation method allows for a clear and succinct summary of all outcomes considered within an NMA in a single presentation that our design validation has found both appealing and understandable to clinicians, many with limited prior exposure to NMAs.6
Strengths and limitations
Extensive design validation in a targeted audience has validated our NMA presentation approaches, allowing future NMA’s to enhance the ease with which clinicians can interpret their results. Additional strengths of this study include consultation with individuals involved in the process of developing and disseminating systematic reviews and clinical practice guidelines, and extensive design validation that included the careful selection of a study population that reflects the broader clinical audience who will be making use of NMA results. The use of structured qualitative research methods including duplicate data analysis allowed the accurate and appropriate incorporation of user feedback to be incorporated into iterative presentation development.
Our study does have limitations. First, although the simplicity of the developed presentations represents a strength, achieving that simplicity required the omission of data that some audiences may consider important.6 For instance, the previous development of an NMA summary of findings table for individual outcomes provides greater detail for each treatment comparison that cannot feasibly fit within a multiple outcome presentation.6 A particularly important omission may be the absolute effects of interventions that sometimes become crucial in trading off benefits and harms.8 For this reason, authors may find it most appropriate to include both the multiple outcome presentation from this investigation, as well as additional outcome summaries suggested by other investigators.4 6–11 This usability of this presentation tool was assessed specifically within the example NMA for pain management, which does not provide insights into the potential differences in usability for different future NMAs. Finally, we did not implement member checking. We did, however, employ data source triangulation to ensure that the findings of our study were robust.
Relation to prior work
Recent publications have addressed the issue of presenting NMA results for multiple outcomes, but have limitations that our proposal has addressed.7 8 First, and crucially important, other options do not address the certainty of the evidence.7 8 The Kilim plot provides a measure of the ‘strength of statistical evidence’, which equates to the magnitude of the p value.8 Considerations of risk of bias, inconsistency, indirectness, publication bias, intransitivity and incoherence may, however, reduce certainty in treatment effects with low p values (which may or may not represent large effects). Additionally, the lack of design validation precludes confidence in how target users will understand these formats. For these reasons, the presentation versions proposed in the current study represent important improvements on previous tools for reporting NMA results for multiple outcomes.
Choosing a presentation variation
Authors can, based on the appropriateness of the colour-coding and the corresponding categorisation, choose between the two presentation versions in this manuscript. For example, the stoplight colour-coding variation may be most suitable when some treatments are better than the reference for some outcomes, while other treatments are worse for some outcomes. The three categories and explanations for benefit outcomes would then be ‘among the best—better than reference (colour: green)’, ‘intermediate—same as reference (colour: yellow)’, ‘among the worst—worse than reference (colour: red)’. Intuitively, these descriptions and colours align. Online supplemental appendix B provides an example of this scenario, with suggested details on the appropriate language to use within the legend.
The colour-gradient variation of the presentation may be most appropriate when the reference treatment is the worst (or best) treatment option across all outcomes. This would typically occur when placebo is the reference treatment, as placebo would likely be the worst treatment for benefit outcomes and the best treatment option for adverse event outcomes. The acute pain NMA used for our presentation formats fits this scenario. Although typically occurring with a placebo reference treatment, there may also be NMAs with other reference treatments that would intuitively follow this gradient colour coding. Online supplemental appendix C provides an example with suggested details on the appropriate language to use within the legend.
Additional considerations
There is no single set of legend terminologies that universally apply to all NMAs, so authors must use their discretion to determine the most applicable and intuitive terminology. Authors may use the general guidance provided in this study in conjunction with categorisation recommendations of the minimally or partially contextualised approach.13 14 The minimally and partially contextualised approaches to NMA treatment categorisation have the potential for more than three categories, which would require an adaptation to the colour schemes we identified. The appropriate title for this presentation format represents another consideration that this study did not test. We would encourage authors to be explicit in defining the patient population assessed within the presentation.
Methodologists and statisticians have long bemoaned an excessive focus on statistical significance, in particular through the use of p values.21–24 Notwithstanding, our participants felt it was important to highlight results indicating statistical significance, and our view is that there is considerable merit in the suggestion. Bolding or italics would be two possible ways of such highlighting, and the choice may depend on a journal’s particular font suggestions.
A final consideration is the use of colours in the presentation methods. Participants believed that green, yellow, and red were the most intuitive colours for the table colour coding; however, these colours may be problematic for colour-blind individuals. Authors who want to ensure colour-blind accessibility may consider using blue instead of green, and orange instead of red; although this was not specifically tested within this investigation.
Conclusion
This study used end-user design validation to develop easily interpretable presentation formats for reporting NMA results with multiple outcomes, with a focus both on relative magnitude of effects and certainty of evidence. If further empirical study verifies our finding that clinicians, and potentially patients—who are increasingly involved in clinical shared-decision making—who are naïve to NMAs find the presentation understandable and appealing, its wide implementation may enhance the impact and usefulness of NMAs.
Supplementary Material
Footnotes
Twitter: @JasonWBusse
Contributors: MRP, BS, JWB, RB-P, CAC-G, FKN, RRB, LT, MB and GG conceptualised the study. MRP, BS, JWB and GG recruited participants for the study. MRP, YJG and SB collected and analysed data. MRP, BS, JWB, RB-P, CAC-G, FKN and GG acted as the steering committee to interpret and implement data from participants. MRP and GG developed a first draft of the manuscript. All authors reviewed, edited and approved the manuscript. MRP is the guarantor.
Funding: The authors have not declared a specific grant for this research from any funding agency in the public, commercial or not-for-profit sectors.
Competing interests: MB research grants from Pendopharm, Bioventus, and Acumed. All other authors have no conflicts of interest to disclose.
Patient and public involvement: Patients and/or the public were not involved in the design, or conduct, or reporting, or dissemination plans of this research.
Provenance and peer review: Not commissioned; externally peer reviewed.
Supplemental material: This content has been supplied by the author(s). It has not been vetted by BMJ Publishing Group Limited (BMJ) and may not have been peer-reviewed. Any opinions or recommendations discussed are solely those of the author(s) and are not endorsed by BMJ. BMJ disclaims all liability and responsibility arising from any reliance placed on the content. Where the content includes any translated material, BMJ does not warrant the accuracy and reliability of the translations (including but not limited to local regulations, clinical guidelines, terminology, drug names and drug dosages), and is not responsible for any error and/or omissions arising from translation and adaptation or otherwise.
Data availability statement
Data sharing not applicable as no datasets generated and/or analysed for this study. No data are available.
Ethics statements
Patient consent for publication
Not applicable.
Ethics approval
This study involves human participants but an Ethics Committee exempted this study. After reviewing the protocol, the Hamilton Integrated Research Ethics Board (HiREB) committee and chair, judging the study to be a quality improvement investigation within the methodology and knowledge translation field, provided an exemption from formal ethics approval.
References
- 1.Rouse B, Chaimani A, Li T. Network meta-analysis: an introduction for clinicians. Intern Emerg Med 2017;12:103–11. 10.1007/s11739-016-1583-7 [DOI] [PMC free article] [PubMed] [Google Scholar]
- 2.Mills EJ, Thorlund K, Ioannidis JPA. Demystifying trial networks and network meta-analysis. BMJ 2013;346:f2914. 10.1136/bmj.f2914 [DOI] [PubMed] [Google Scholar]
- 3.Ellis SG. Do we know the best treatment for in-stent restenosis via network meta-analysis (NMA)?: simple methods any interventionalist can use to assess NMA quality and a call for better NMa presentation. JACC Cardiovasc Interv 2015;8:395–7. 10.1016/j.jcin.2014.11.012 [DOI] [PubMed] [Google Scholar]
- 4.Salanti G, Ades AE, Ioannidis JPA. Graphical methods and numerical summaries for presenting results from multiple-treatment meta-analysis: an overview and tutorial. J Clin Epidemiol 2011;64:163–71. 10.1016/j.jclinepi.2010.03.016 [DOI] [PubMed] [Google Scholar]
- 5.Law M, Alam N, Veroniki AA, et al. Two new approaches for the visualisation of models for network meta-analysis. BMC Med Res Methodol 2019;19:61. 10.1186/s12874-019-0689-9 [DOI] [PMC free article] [PubMed] [Google Scholar]
- 6.Yepes-Nuñez JJ, Li S-A, Guyatt G, et al. Development of the summary of findings table for network meta-analysis. J Clin Epidemiol 2019;115:1–13. 10.1016/j.jclinepi.2019.04.018 [DOI] [PubMed] [Google Scholar]
- 7.Daly CH, Mbuagbaw L, Thabane L, et al. Spie charts for quantifying treatment effectiveness and safety in multiple outcome network meta-analysis: a proof-of-concept study. BMC Med Res Methodol 2020;20:266. 10.1186/s12874-020-01128-2 [DOI] [PMC free article] [PubMed] [Google Scholar]
- 8.Seo M, Furukawa TA, Veroniki AA, et al. The Kilim plot: a tool for visualizing network meta-analysis results for multiple outcomes. Res Synth Methods 2021;12:86-95. 10.1002/jrsm.1428 [DOI] [PMC free article] [PubMed] [Google Scholar]
- 9.Chaimani A, Higgins JPT, Mavridis D, et al. Graphical tools for network meta-analysis in STATA. PLoS One 2013;8:e76654. 10.1371/journal.pone.0076654 [DOI] [PMC free article] [PubMed] [Google Scholar]
- 10.Krahn U, Binder H, König J. A graphical tool for locating inconsistency in network meta-analyses. BMC Med Res Methodol 2013;13:35. 10.1186/1471-2288-13-35 [DOI] [PMC free article] [PubMed] [Google Scholar]
- 11.Tan SH, Cooper NJ, Bujkiewicz S, et al. Novel presentational approaches were developed for reporting network meta-analysis. J Clin Epidemiol 2014;67:672–80. 10.1016/j.jclinepi.2013.11.006 [DOI] [PubMed] [Google Scholar]
- 12.Mbuagbaw L, Rochwerg B, Jaeschke R, et al. Approaches to interpreting and choosing the best treatments in network meta-analyses. Syst Rev 2017;6:79. 10.1186/s13643-017-0473-z [DOI] [PMC free article] [PubMed] [Google Scholar]
- 13.Brignardello-Petersen R, Florez ID, Izcovich A, et al. GRADE approach to drawing conclusions from a network meta-analysis using a minimally contextualised framework. BMJ 2020;371:m3900. 10.1136/bmj.m3900 [DOI] [PubMed] [Google Scholar]
- 14.Brignardello-Petersen R, Izcovich A, Rochwerg B, et al. GRADE approach to drawing conclusions from a network meta-analysis using a partially contextualised framework. BMJ 2020;371:m3907. 10.1136/bmj.m3907 [DOI] [PubMed] [Google Scholar]
- 15.Morse JM. Critical analysis of strategies for determining rigor in qualitative inquiry. Qual Health Res 2015;25:1212–22. 10.1177/1049732315588501 [DOI] [PubMed] [Google Scholar]
- 16.Tong A, Sainsbury P, Craig J. Consolidated criteria for reporting qualitative research (COREQ): a 32-item checklist for interviews and focus groups. Int J Qual Health Care 2007;19:349–57. 10.1093/intqhc/mzm042 [DOI] [PubMed] [Google Scholar]
- 17.Neergaard MA, Olesen F, Andersen RS, et al. Qualitative description - the poor cousin of health research? BMC Med Res Methodol 2009;9:52. 10.1186/1471-2288-9-52 [DOI] [PMC free article] [PubMed] [Google Scholar]
- 18.Saunders B, Sim J, Kingstone T, et al. Saturation in qualitative research: exploring its conceptualization and operationalization. Qual Quant 2018;52:1893–907. 10.1007/s11135-017-0574-8 [DOI] [PMC free article] [PubMed] [Google Scholar]
- 19.Busse JW, Sadeghirad B, Oparin Y, et al. Management of Acute Pain From Non-Low Back, Musculoskeletal Injuries : A Systematic Review and Network Meta-analysis of Randomized Trials. Ann Intern Med 2020;173:730–8. 10.7326/M19-3601 [DOI] [PubMed] [Google Scholar]
- 20.Maher C, Hadfield M, Hutchings M. Ensuring rigor in qualitative data analysis: a design research approach to coding combining NVivo with traditional material methods. Int J Qual Methods 2018. [Google Scholar]
- 21.Greenland S, Senn SJ, Rothman KJ, et al. Statistical tests, P values, confidence intervals, and power: a guide to misinterpretations. Eur J Epidemiol 2016;31:337–50. 10.1007/s10654-016-0149-3 [DOI] [PMC free article] [PubMed] [Google Scholar]
- 22.Gagnier JJ, Morgenstern H, Misconceptions MH. Misconceptions, misuses, and misinterpretations of P values and significance testing. J Bone Joint Surg Am 2017;99:1598–603. 10.2106/JBJS.16.01314 [DOI] [PubMed] [Google Scholar]
- 23.Goodman SN. Toward evidence-based medical statistics. 1: the P value fallacy. Ann Intern Med 1999;130:995–1004. 10.7326/0003-4819-130-12-199906150-00008 [DOI] [PubMed] [Google Scholar]
- 24.Phillips M. Letter to the editor: editorial: threshold P values in orthopaedic Research-We know the problem. What is the solution? Clin Orthop Relat Res 2019;477:1756–8. 10.1097/CORR.0000000000000827 [DOI] [PMC free article] [PubMed] [Google Scholar]
Associated Data
This section collects any data citations, data availability statements, or supplementary materials included in this article.
Supplementary Materials
bmjopen-2021-056400supp001.pdf (75.1KB, pdf)
Data Availability Statement
Data sharing not applicable as no datasets generated and/or analysed for this study. No data are available.


