Understanding the predictive and prognostic effects of molecular aberrations in tumors has dramatically changed drug development and the practice of cancer medicine. Broader availability of tumor genomic data linked to treatment exposures and survival outcomes will propel further advances in precision oncology and translational research. However, rigorous analytic methods must be applied to ensure that inferences from observational data are valid. A key challenge that threatens the validity of interpretation of clinico-genomic data is the time lapse between molecular testing and diagnosis.
An underlying assumption of survival analysis is that study entry and time of origin are aligned. In clinico-genomic cohorts, the specific sampling is molecular tumor profiling and the origin time is often diagnosis or treatment initiation. Ideally, study samples (genomic profiling) would be obtained at the time origin of interest, but in clinical practice this is often not the case. Genomic sequencing is frequently performed months or even years following diagnosis. This delayed entry leads to left truncation, since all patients who had an event or were lost to follow-up prior to sequencing are not captured in the analysis. As a result, the data will be subject to length bias in a naïve analysis and will affect the validity of time-to-event analyses and accuracy of survival estimates.1–4 To provide interpretable and reproducible analyses, it is imperative to apply appropriate statistical methods to these complex data.2,5 Here we illustrate the consequences of ignoring left truncation and describe an approach to correct for length bias, in patients with stage IV colorectal cancer (CRC) and non-small cell lung cancer (NSCLC) sourced from a large clinico-genomic database.
The American Association for Cancer Research (AACR) Project Genomics Evidence Neoplasia Information Exchange Biopharma Collaborative (GENIE BPC) is an effort to supplement genomic profiles with comprehensive clinical (“phenomic”) data from 50,000 patients.6 Clinical data are obtained from structured fields in electronic health records and tumor registries that contain information such as diagnosis and staging variables, cancer drug treatment start and stop dates and the laboratory values for tumor markers. Critical outcomes in oncology are typically not structured in electronic health records and are therefore ascertained by manual curation using a standardized framework. Using the PRISSMM phenomic data model, curators abstract unstructured text, including notes from the pathologist, radiologist and medical oncologist.7 The resulting structured data will be publicly available to address diverse research questions and for analyses that include discovery, prediction of clinical phenotypes, and risk stratification.
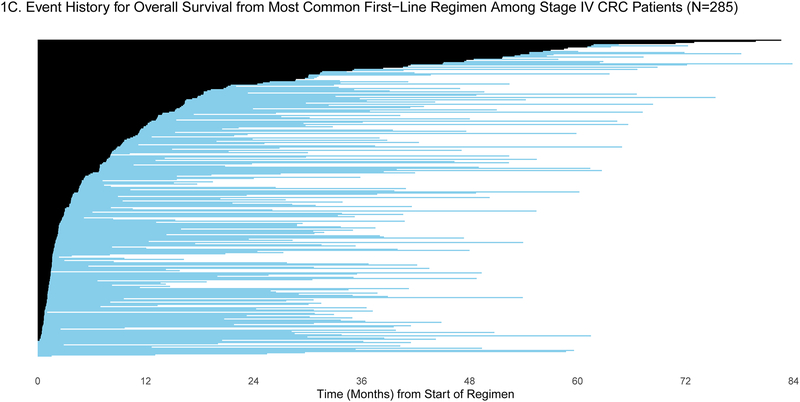
Patients were selected for entry into the GENIE BPC study if they had genomic profiling performed within the years 2015–2017. For some patients, genomic profiling was performed shortly after diagnosis, but for others, genomic profiling was performed much later: the median time between diagnosis and genomic profiling was 6.25 months (IQR: 2.43, 19.33) and 2.34 months (IQR: 1.38, 7.83) for patients diagnosed with stage IV CRC (N=659) and stage IV NSCLC (N=727), respectively. To demonstrate the varying degrees of delayed entry, survival outcomes are estimated from two origin times, diagnosis and start of the most common first-line therapy. The most common first-line regimen was FOLFOX for stage IV CRC (N=285) and carboplatin/pemetrexed for stage IV NSCLC (N=137). In Figures 1a/c and 2a/c, each patient’s survival time is indicated by a blue line with a black line overlaid to illustrate duration of delayed study entry. When the time of origin is cancer diagnosis, all patients in both cohorts were subject to left truncation, as their genomic sequencing occurred after their diagnosis date. For survival from the start of regimen, 95% of stage IV CRC patients who received FOLFOX and 76% of stage IV NSCLC patients on first-line carboplatin/pemetrexed as first-line therapy had sequencing performed after the start of regimen.
Figure 1:
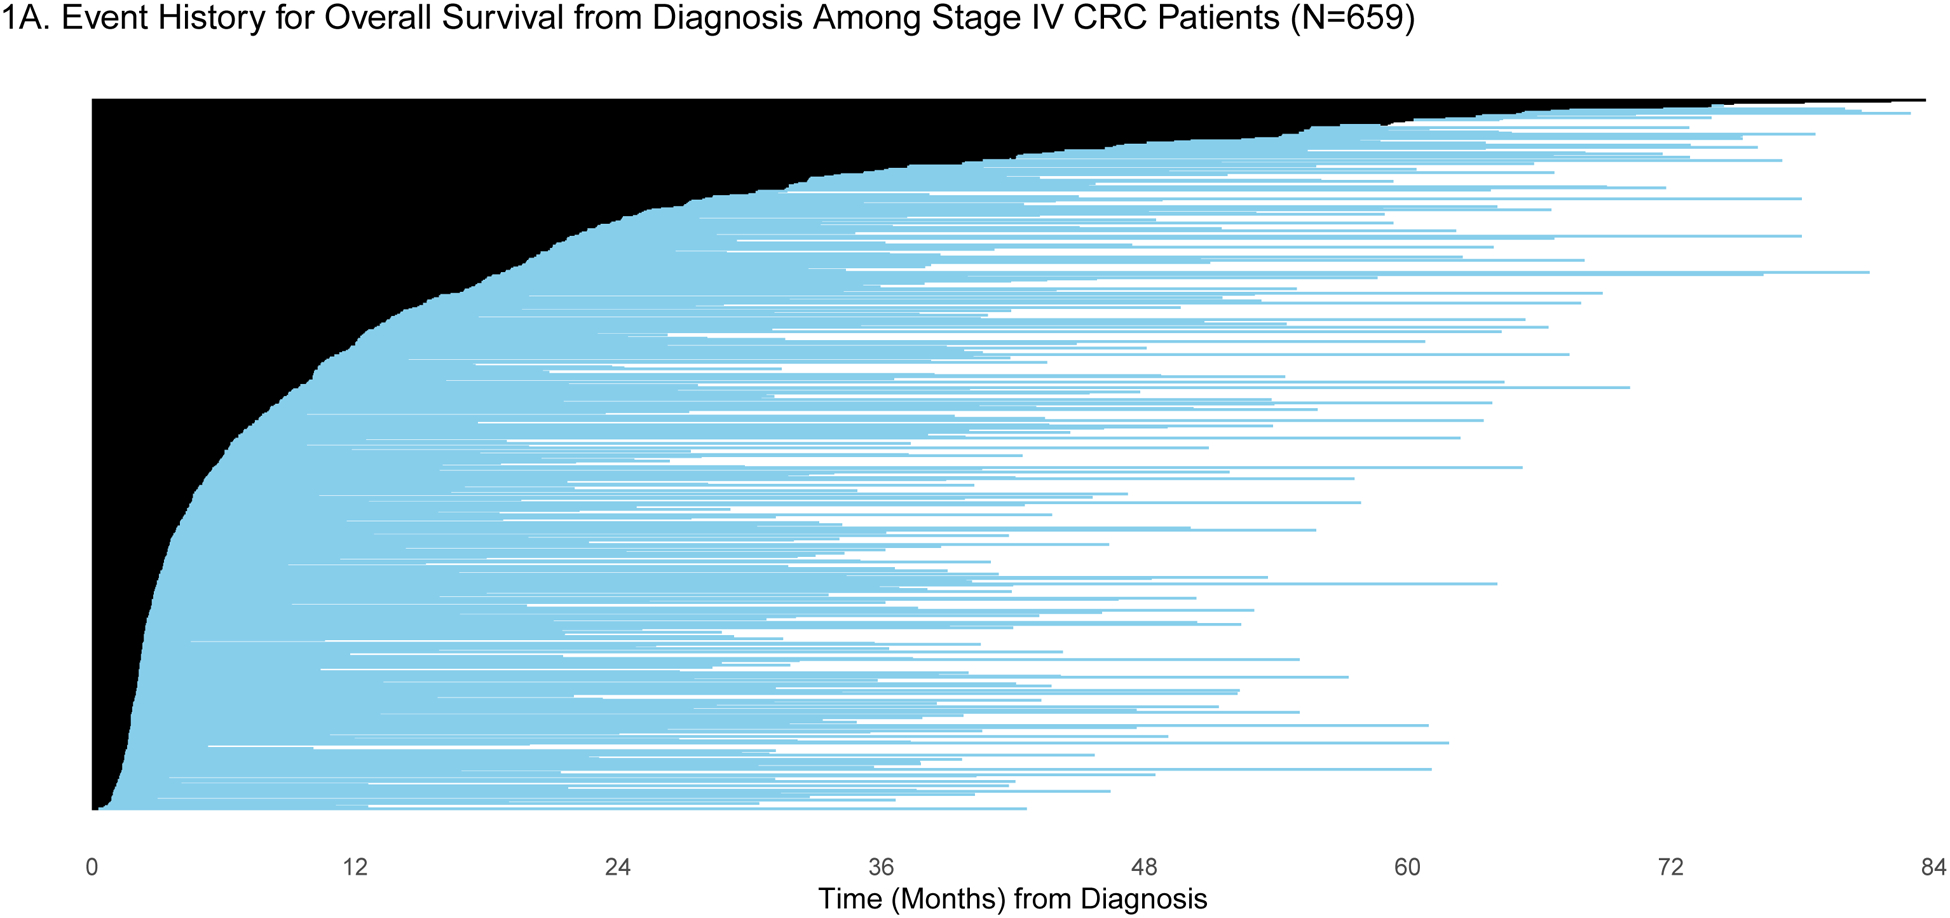
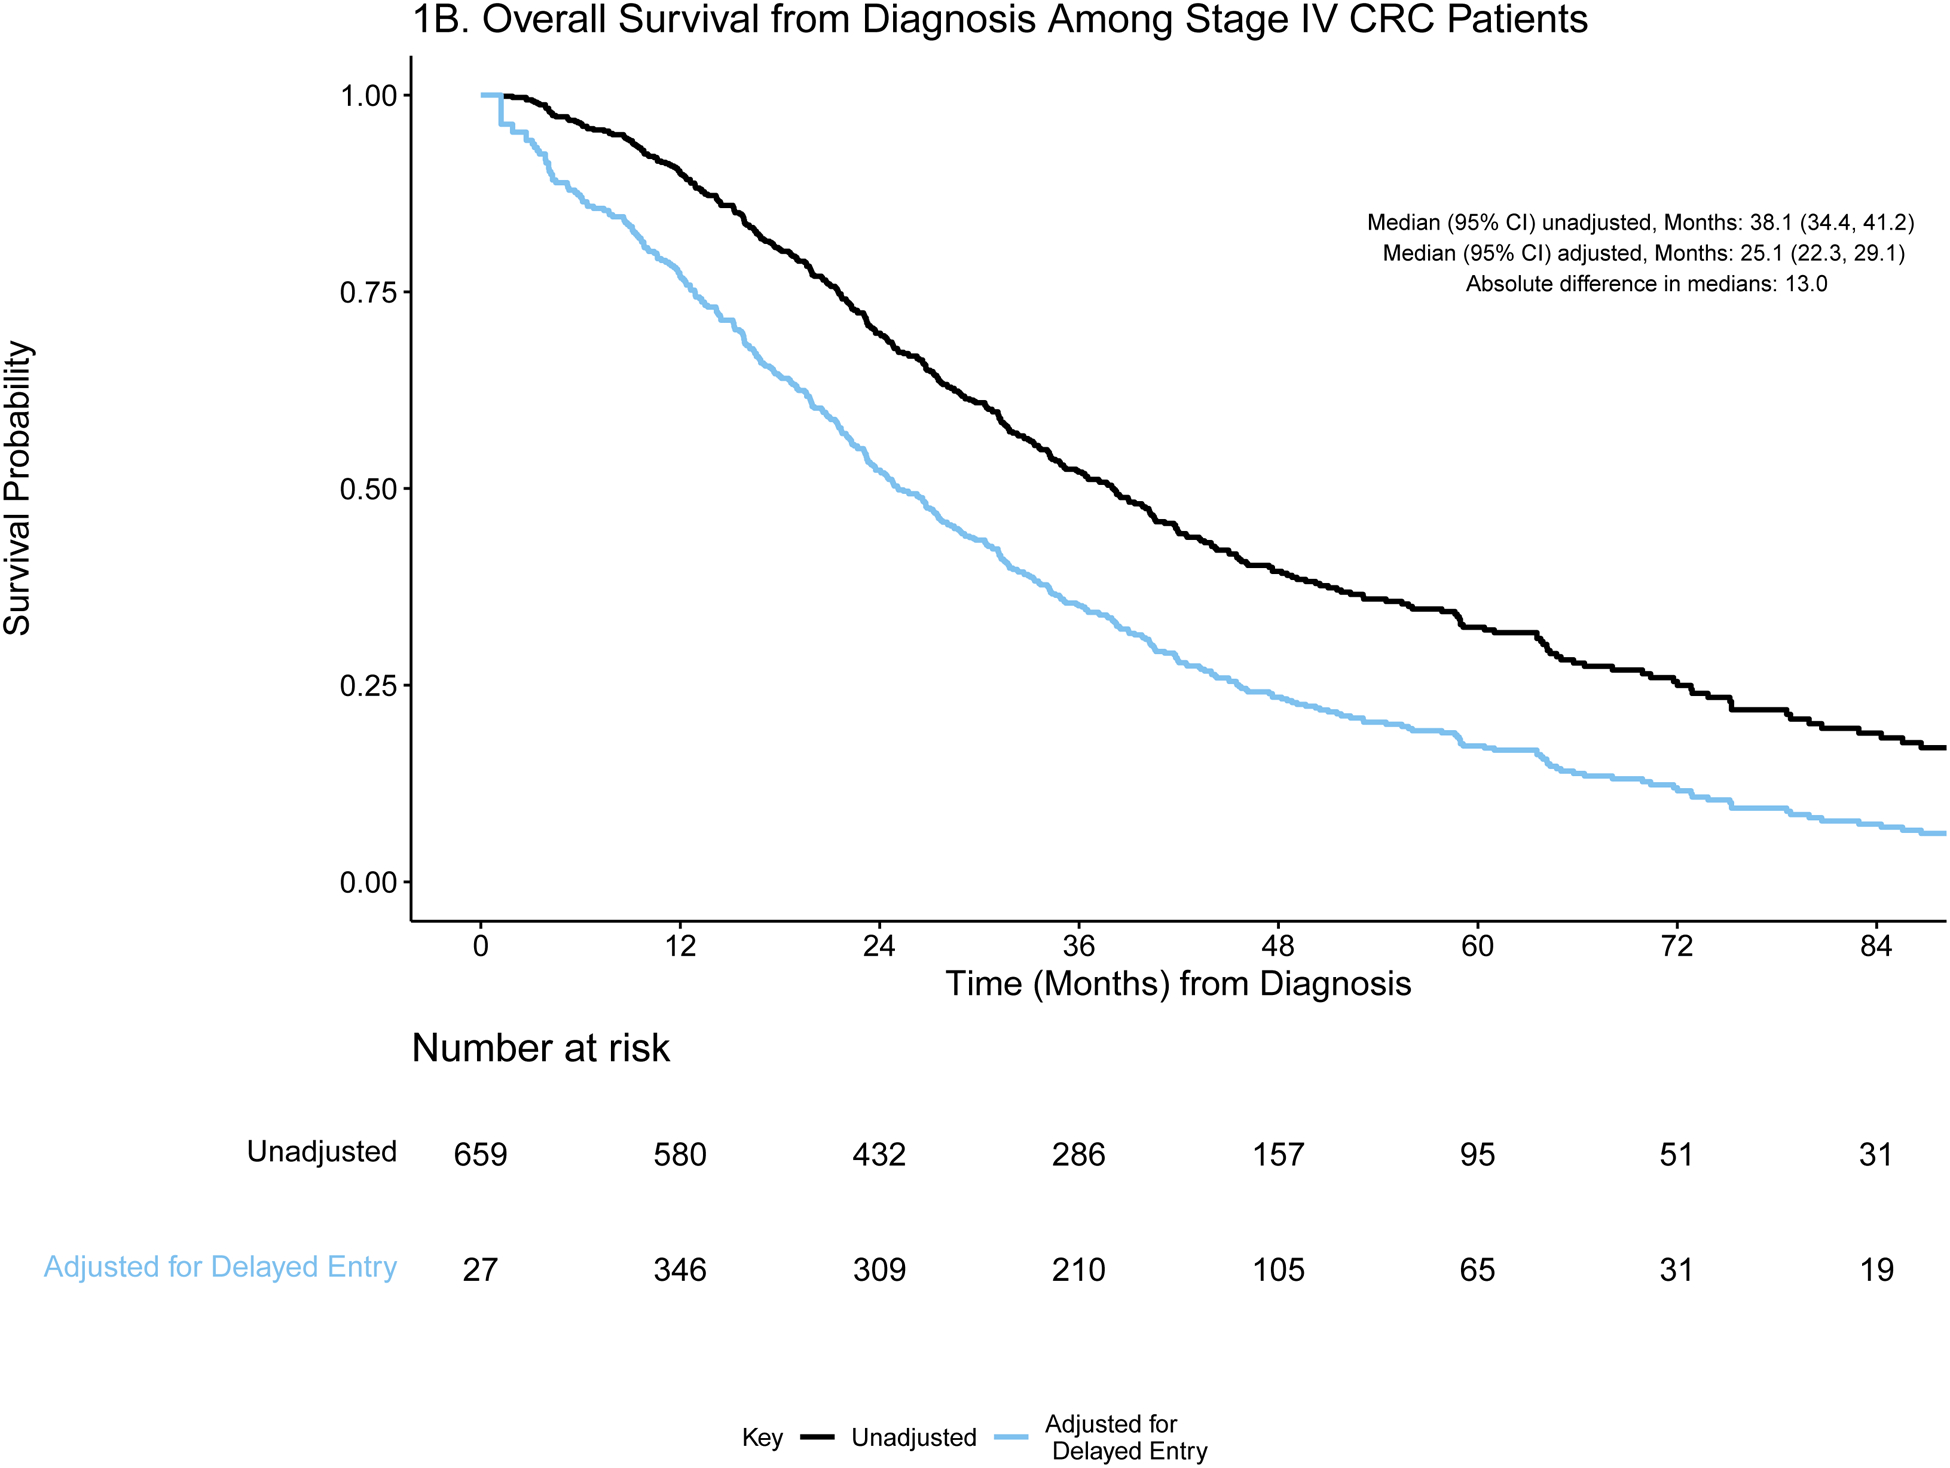
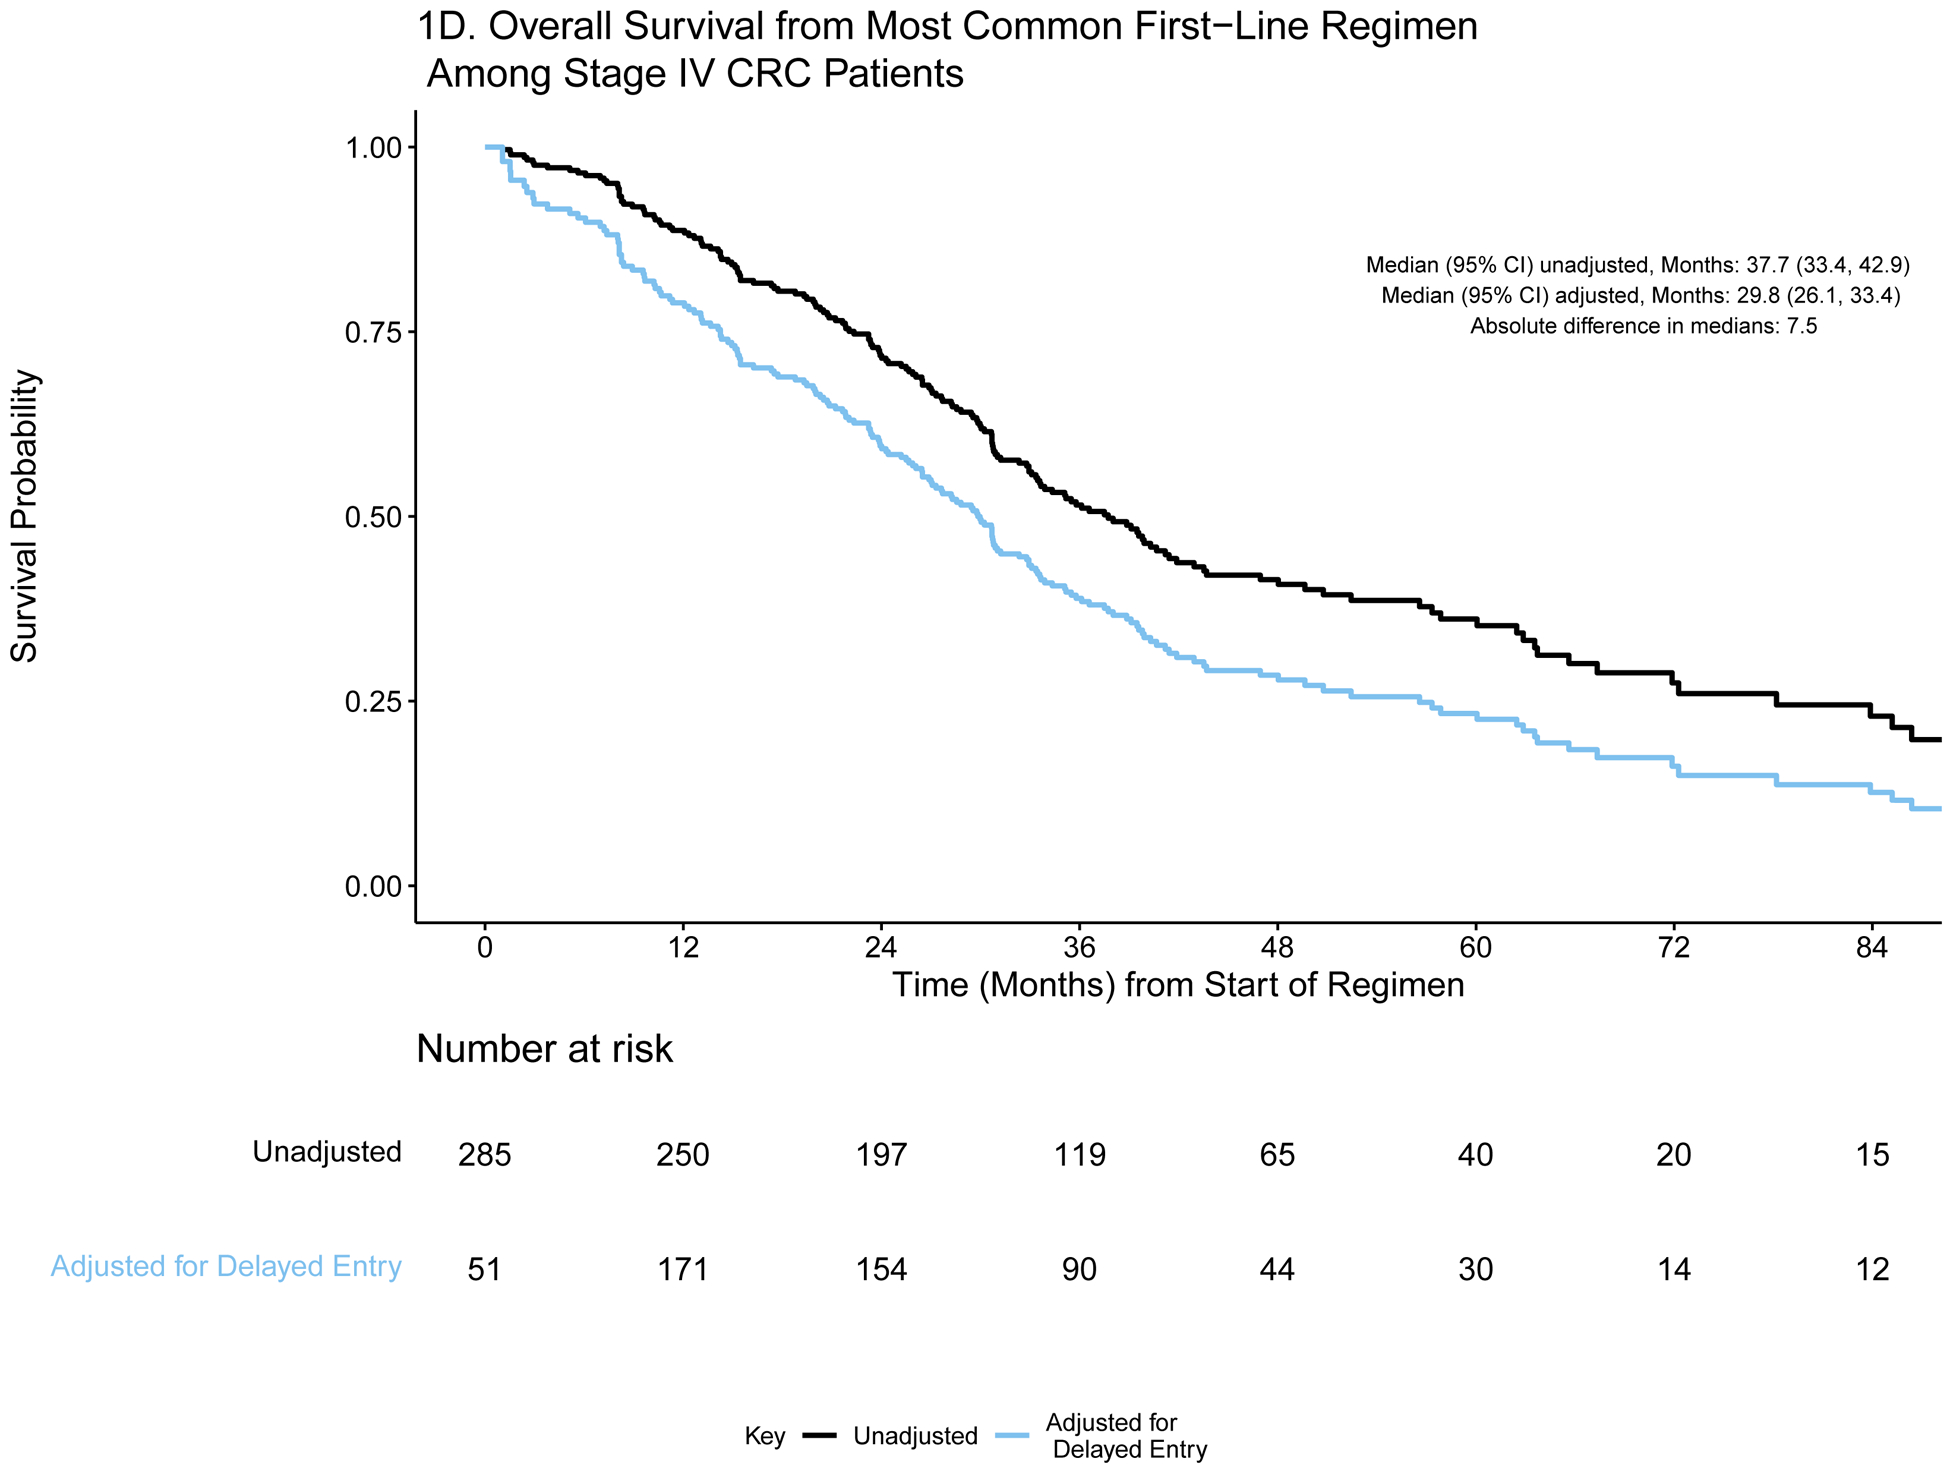
A) Event history for overall survival from diagnosis among stage IV CRC patients (N=659). Each patient’s survival time from diagnosis is indicated by a blue line with a black line overlaid to illustrate duration of delayed study entry. B) Kaplan-Meier curves illustrating overall survival from diagnosis among stage IV CRC patients with and without adjustment for delayed study entry. C) Event history for overall survival from most common first-line regimen among stage IV CRC patients (N=285). Each patient’s survival time from start of regimen is indicated by a blue line with a black line overlaid to illustrate duration of delayed study entry. D) Kaplan-Meier curves illustrating overall survival from start of most common first-line regimen among stage IV CRC patients with and without adjustment for delayed study entry.
Figure 2:
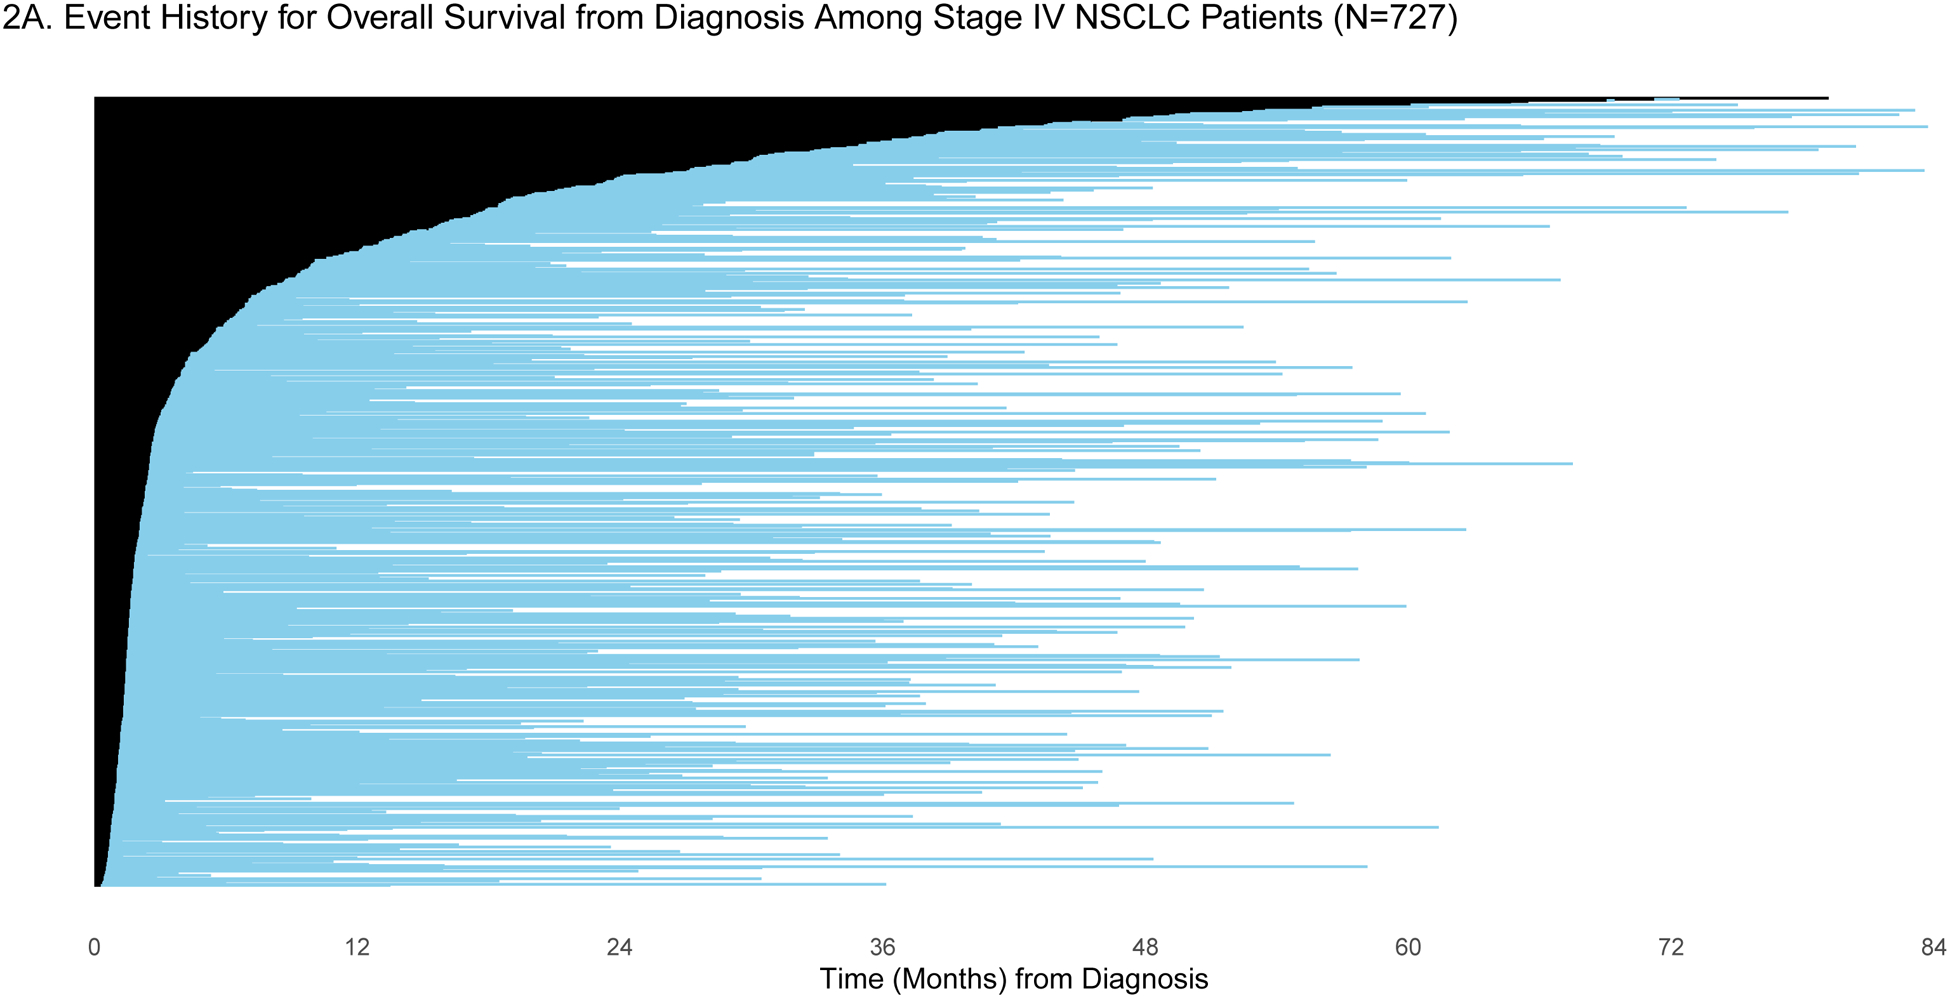
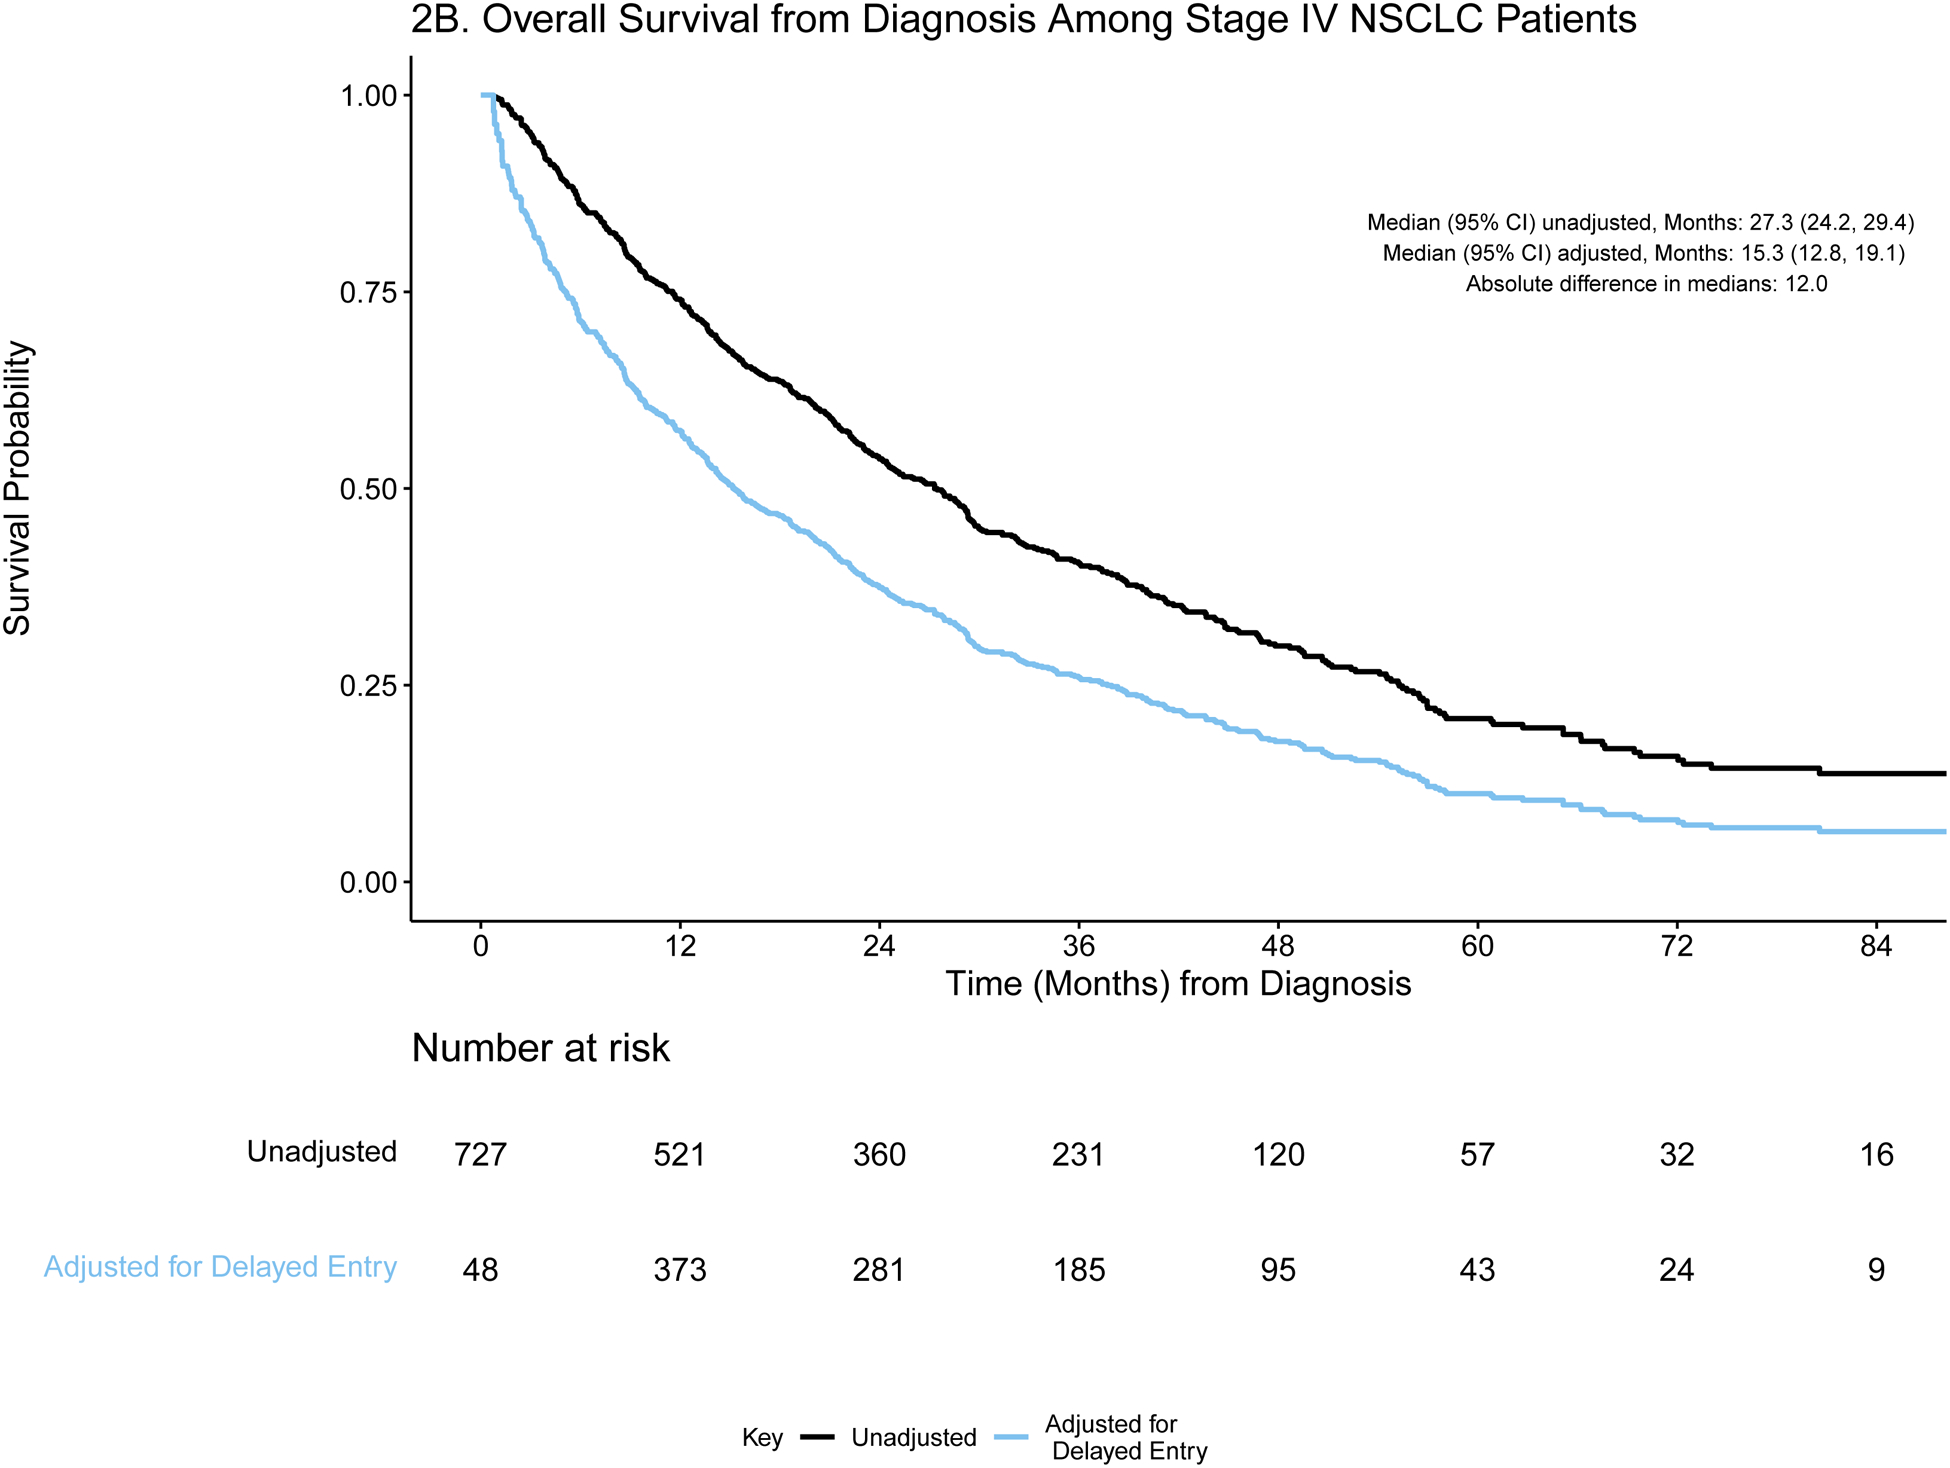
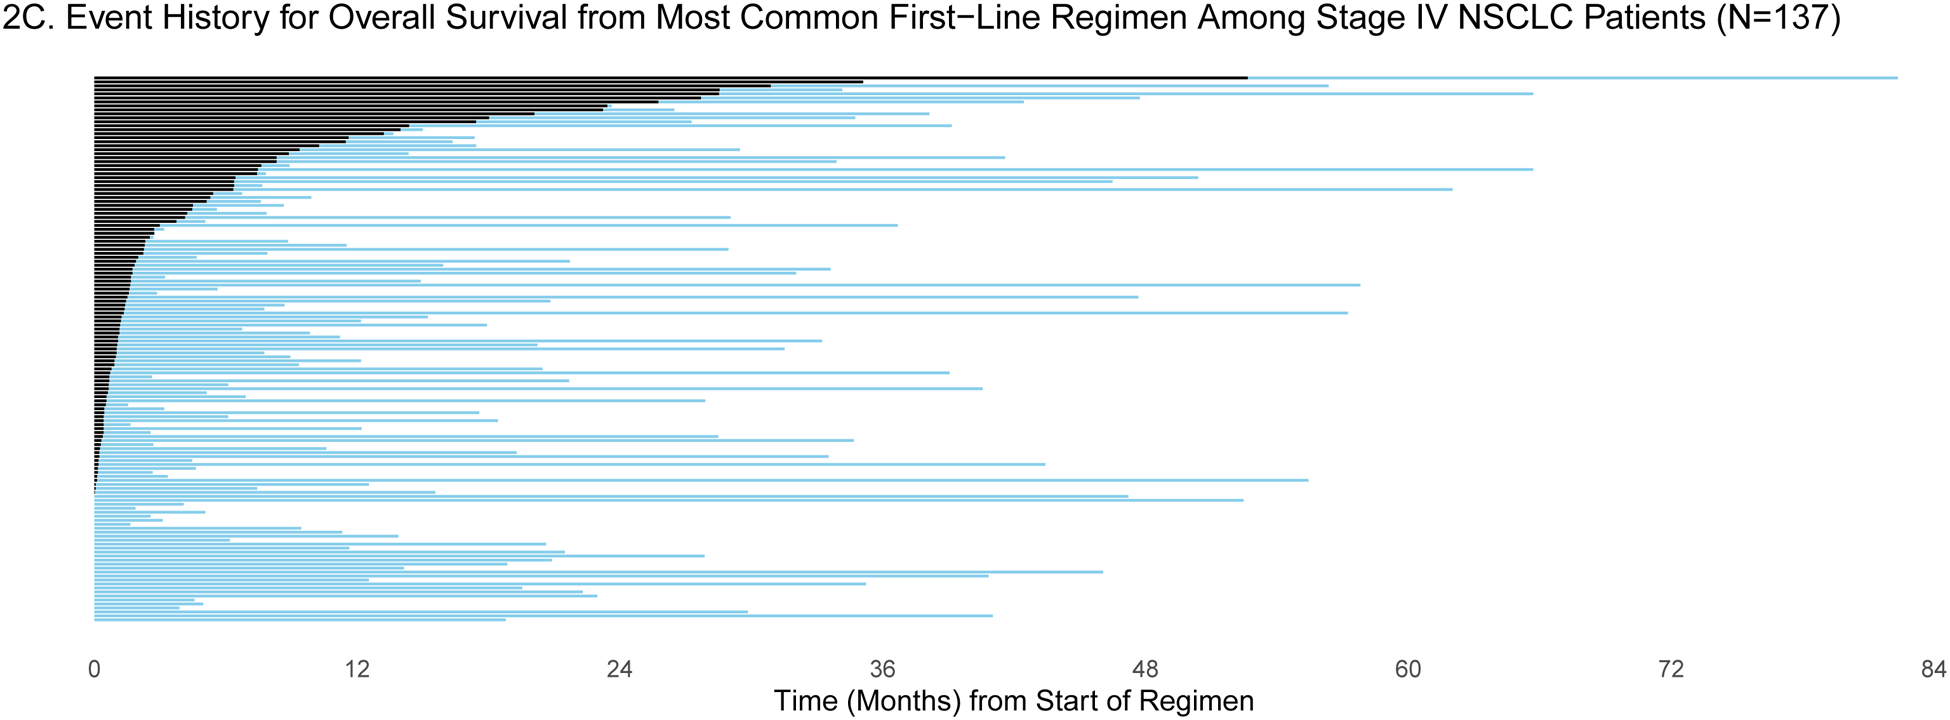
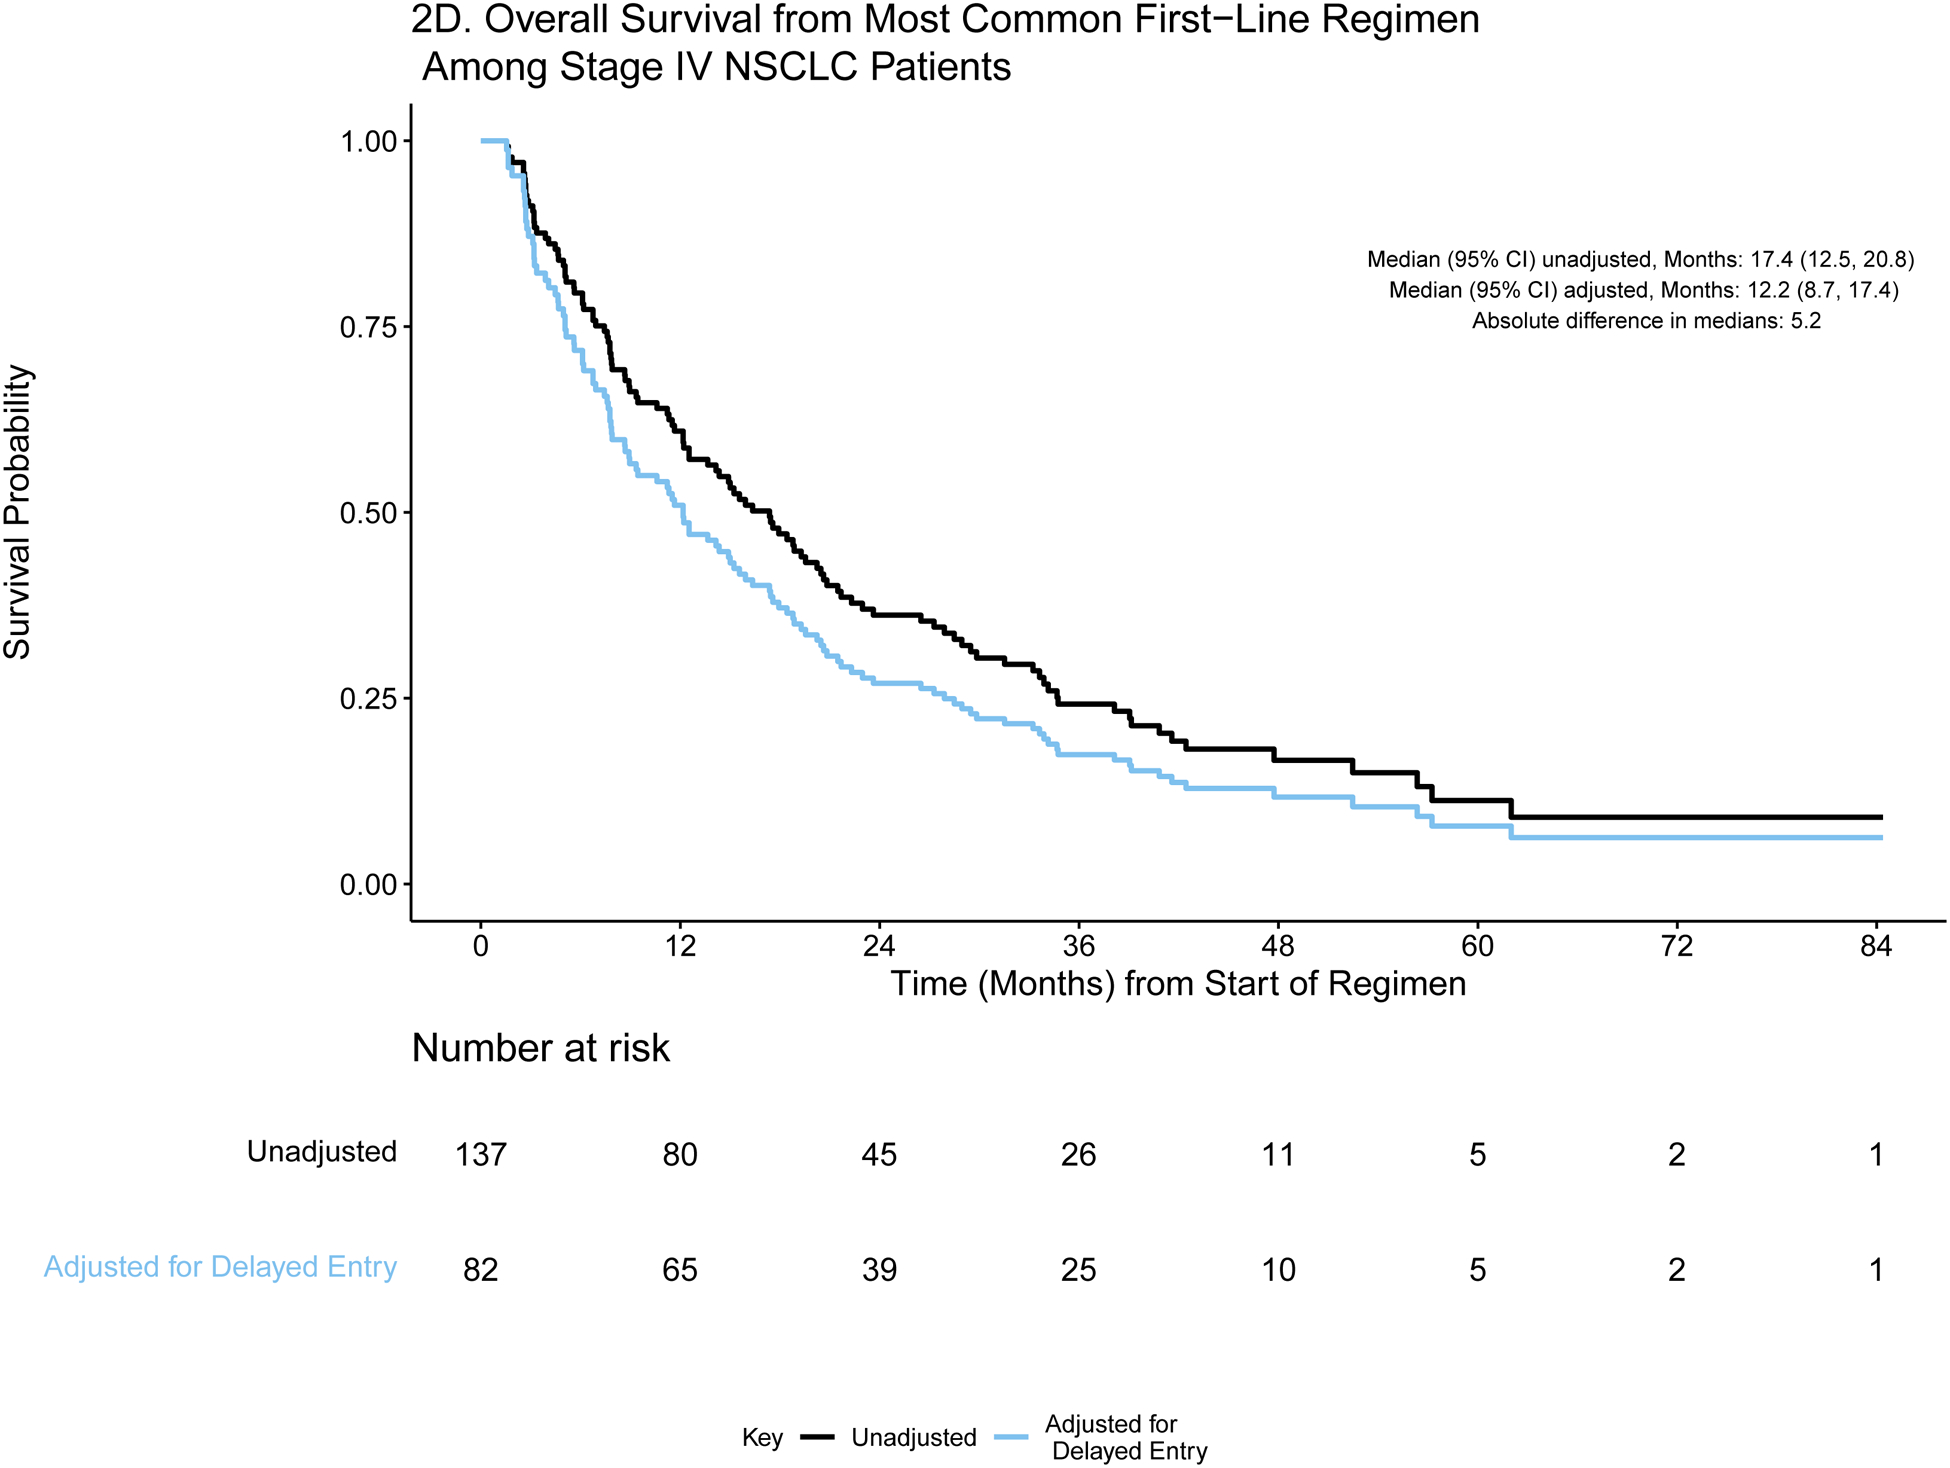
A) Event history for overall survival from diagnosis among stage IV NSCLC patients (N=727). Each patient’s survival time from diagnosis is indicated by a blue line with a black line overlaid to illustrate duration of delayed study entry. B) Kaplan-Meier curves illustrating overall survival from diagnosis among stage IV NSCLC patients with and without adjustment for delayed study entry. C) Event history for overall survival from most common first-line regimen among stage IV NSCLC patients (N=137). Each patient’s survival time from start of regimen is indicated by a blue line with a black line overlaid to illustrate duration of delayed study entry. D) Kaplan-Meier curves illustrating overall survival from start of most common first-line regimen among stage IV NSCLC patients with and without adjustment for delayed study entry.
In the absence of left truncation, patients enter the risk set at the time of diagnosis (or start of regimen) and are followed until they experience an event or are censored; this results in a decreasing number of patients at risk over time. However, when data are left truncated, analyses must reflect that patients enter the risk set and begin being followed only at the time of genomic sequencing; otherwise, the presence of delayed study entry results in overestimation of the survival distributions.8 Due to this staggered entry, the number of patients at risk does not consistently decrease over time, as illustrated in the risk tables (Figures 1b/d and 2b/d). The extent of bias is illustrated in the unadjusted and adjusted Kaplan Meier overall survival curves (Figures 1b/d and 2b/d). Accounting for delayed entry can be implemented in standard statistical software, such as using the survfit function in the R package survival or PROC PHREG in SAS software.9–11 SAS and R code along with the corresponding de-identified stage IV CRC GENIE BPC data are provided in a supplemental GitHub repository (https://github.com/slb2240/delayed_entry_clin_genom_studies).
For each time origin of interest, we calculate the absolute difference in median OS from estimates that are adjusted and unadjusted for delayed entry. The extent of such differences is influenced by the delayed entry distribution and survival times. For both cohorts, the absolute differences in median OS from diagnosis after adjustment for left truncation were greater than one year in both cohorts (13.0 and 12.0 months in stage IV CRC and NSCLC, respectively), highlighting the extent to which interpretation of the data could be distorted. Similarly, the survival curves are shifted when evaluating OS from start of regimen, though the effect is attenuated.
Importantly, the survival estimates obtained after adjustment for delayed entry are consistent with established estimates from recent randomized clinical trials. Venook reported the results of a multi-center randomized trial of first line therapy with FOLFOX or FOLFIRI combined with either bevacizumab (N = 559) or cetuximab (N = 578) among patients with KRAS wild-type metastatic CRC.12 Among patients who received chemotherapy with bevacizumab, median overall survival was 29.0 months with bevacizumab and 30.0 months with cetuximab. In GENIE BPC, 132 KRAS wild-type stage IV CRC patients received first-line FOLFOX/FOLFIRI with bevacizumab. For this group, who had similar sociodemographic and clinical characteristics as the trial participants, median OS was 25.8 months (95% CI: 20.8, 34.2) after adjustment for left truncation and 40.9 months (95% CI: 33.9, 49.2) without adjusting for delayed entry.
For lung cancer, survival outcomes were compared to those obtained from a randomized clinical trial recently reported by Ramalignam et al.13 They compared first-line osimertinib (N = 279) or erlotinib/gefitinib (N = 277) among patients with EGFR-mutant advanced NSCLC, reporting median OS estimates of 38.6 months (95% CI: 34.5, 41.8) and 31.8 months (95% CI: 26.6, 36.0) among patients who received osimertinib and erlotinib/gefitinib, respectively. In the analogous cohort of EGFR-mutant stage IV NSCLC patients from GENIE BPC (N = 76), the median overall survival from first-line erlotinib/gefitinib when adjusted for left truncation was 31.2 months (95% CI: 25.0, 44.7) as opposed to 42.7 months (95% CI: 32.3, 50.3) when delayed entry was not accounted for. Although these informal group comparisons do not adjust for differences in the clinical and sociodemographic attributes of patients, these examples illustrate that the median survival estimates obtained without adjusting for delayed entry greatly exceed clinical trial-derived estimates and therefore strain credulity. Estimates obtained after adjustment for delayed entry more closely resemble the clinical trial derived estimates.
As genomic sequencing at diagnosis is not standard across institutions, delayed study entry is expected to persist and is an issue that researchers must attend to in evaluating clinico-genomic analyses. Some have taken the approach of restricting analyses to patients who are not left truncated, but this greatly reduces available sample size and introduces other selection biases. For example, while Medicare now covers broad genomic testing for all stage IV solid tumor patients, uninsured or underinsured patients may not have similar access and would not be expected to have genomic testing concurrent with diagnosis. Instead, including all patients with genomic sequencing and making adjustment for left truncation standard practice for survival analyses in studies with delayed entry is the preferred approach, just as accounting for right censoring is standard in time to event analyses.8 When estimating hazard ratios from a Cox proportional hazards model, we must also adjust for left truncation to obtain consistent regression coefficient estimators and to account for possible differential left truncation across levels of covariates. Regression techniques exist under left truncation and length-biased data.8,14,15
It is important to note that adjusting for left truncation is not a panacea. The approach described here relies on the assumption that the survival and truncation times are independent. Dependent left truncation occurs when clinical worsening prompts genomic sequencing and thus cohort entry is correlated with prognosis.16 Kendall’s tau statistic or regression methods may be applied to assess whether there is dependent left truncation.17–20 If there is evidence of dependency, then an alternative statistical method may be necessary.21,22
Building large-scale clinico-genomic datasets requires standardized implementation across many institutions. Specifying inclusion criteria based on genomic sequencing at the design or data collection stage is a streamlined approach that can be operationalized uniformly. These data are a valuable resource for evaluation of real-world cancer outcomes and should be analyzed using appropriate methods to maximize their potential. Analysts must become adept at application of appropriate statistical methods to ensure valid, meaningful, and generalizable research findings.
Supplementary Material
Acknowledgements:
The authors would like to acknowledge the American Association for Cancer Research and its financial and material support in the development of the AACR Project GENIE registry as well as members of the AACR Project GENIE consortium for their commitment to data sharing. Interpretations are the responsibility of study authors.
Funding:
American Association of Cancer Research (all authors); Cancer Center Support Grant (P30 CA08748), National Cancer Institute (SB, JAL, RS, ASM, HR, CGM, NS, GJR, KSP)
Disclosures:
Dr. Kehl reports receiving consulting fees from Aetion and IBM, and speaking fees from Roche. Dr. Warner reports receiving consulting fees from Westat and IBM and has equity in HemOnc.org LLC. Dr. Bedard reports receiving consulting fees from Seattle Genetics; Eli-Lilly and Company; Amgen, Inc.; Merck Sharp & Dohme Corp; Bristol-Myers Squibb; Sanofi; and Pizer. Dr. Bedard also reports receiving research funding directed to his institution from Bristol-Myers Squibb, Sanofi, AstraZeneca, Genentech, Servier, GlaxoSmithKline, Novartis, SignalChem, PTC Therapeutics, Nektar, Merck Sharp & Dohme Corp., Seattle Genetics, Mersana, Immunomedics, and Eli-Lilly. Dr. Schrag reports receiving fees from JAMA for editorial services and speaking fees from Pfizer. AACR Project GENIE receives funding from Amgen, Inc.; Bristol-Myers Squibb Company; Merck Sharp & Dohme Corp.; AstraZeneca UK Limited; Genentech; Novartis; Pfizer, Inc.; Bayer Healthcare Pharmaceuticals, Inc.; Boehringer Ingelheim; and Janssen Pharmaceuticals, Inc.
References
- 1).Chubak J, Boudreau DM, Wirtz HS, et al. Threats to validity of nonrandomized studies of postdiagnosis exposures on cancer recurrence and survival. J Natl Cancer Inst. 2013;105(19):1456–62. doi: 10.1093/jnci/djt211. Epub 2013 Aug 12. [DOI] [PMC free article] [PubMed] [Google Scholar]
- 2).Betensky RA, Mandel M. Recognizing the problem of delayed entry in time-to-event studies: Better late than never for clinical neuroscientists. Ann Neurol. 2015;78(6):839–44. doi: 10.1002/ana.24538. Epub 2015 Nov 13. [DOI] [PMC free article] [PubMed] [Google Scholar]
- 3).Schisterman EF, Cole SR, Ye A, et al. Accuracy loss due to selection bias in cohort studies with left truncation. Paediatr Perinat Epidemiol. 2013;27(5):491–502. doi: 10.1111/ppe.12073. [DOI] [PMC free article] [PubMed] [Google Scholar]
- 4).Cain KC, Harlow SD, Little RJ, et al. Bias due to left truncation and left censoring in longitudinal studies of developmental and disease processes. Am J Epidemiol. 2011;173(9):1078–84. doi: 10.1093/aje/kwq481. Epub 2011 Mar 21. [DOI] [PMC free article] [PubMed] [Google Scholar]
- 5).Haneuse S, Daniels M. A General Framework for Considering Selection Bias in EHR-Based Studies: What Data Are Observed and Why? EGEMS (Wash DC). 2016. Aug 31;4(1):1203. doi: 10.13063/2327-9214.1203. [DOI] [PMC free article] [PubMed] [Google Scholar]
- 6).AACR Project GENIE Consortium. AACR Project GENIE: Powering Precision Medicine through an International Consortium. Cancer Discov. 2017;7(8):818–831. doi: 10.1158/2159-8290.CD-17-0151. [DOI] [PMC free article] [PubMed] [Google Scholar]
- 7).Schrag D GENIE: Real-world application. In: ASCO Annual Meeting; 2018. [Google Scholar]
- 8).Klein JP, Moeschberger ML. Survival analysis: techniques for censored and truncated data. 2nd ed. New York: Springer; 2003. [Google Scholar]
- 9).Rosenberg NE, Sirkus L. Survival Analysis Using SAS: A Practical Guide. Second Edition By Paul D. Allison, American Journal of Epidemiology, Volume 174, Issue 4, 15 August 2011, Pages 503–504. 10.1093/aje/kwr202 [DOI] [Google Scholar]
- 10).Therneau T (2021). A Package for Survival Analysis in R. R package version 3.2–10, https://CRAN.R-project.org/package=survival.
- 11).Therneau TM, Grambsch PM. (2000). Modeling Survival Data: Extending the Cox Model. Springer, New York. [Google Scholar]
- 12).Venook AP, Niedzwiecki D, Lenz H, et al. Effect of First-Line Chemotherapy Combined With Cetuximab or Bevacizumab on Overall Survival in Patients With KRAS Wild-Type Advanced or Metastatic Colorectal Cancer: A Randomized Clinical Trial. JAMA. 2017;317(23):2392–2401. doi: 10.1001/jama.2017.7105 [DOI] [PMC free article] [PubMed] [Google Scholar]
- 13).Ramalingam SS, Vansteenkiste J, Planchard D, et al. Overall Survival with Osimertinib in Untreated, EGFR-Mutated Advanced NSCLC. N Engl J Med. 2020;382(1):41–50. doi: 10.1056/NEJMoa1913662 [DOI] [PubMed] [Google Scholar]
- 14).Lai TL, Ying Z. Rank Regression Methods for Left-Truncated and Right Censored Data. Ann Statist. 1991; 19(2)531–556. 10.1214/aos/1176348110 [DOI] [Google Scholar]
- 15).Wang MC. Hazards regression analysis for length-biased data, Biometrika, 1996;83(2) 343–354. 10.1093/biomet/83.2.343 [DOI] [Google Scholar]
- 16).Kehl KL, Schrag D, Hassett MJ, et al. Assessment of Temporal Selection Bias in Genomic Testing in a Cohort of Patients with Cancer. JAMA Netw Open. 2020;3(6):e206976. doi: 10.1001/jamanetworkopen.2020.6976 [DOI] [PMC free article] [PubMed] [Google Scholar]
- 17).Tsai W Testing the Assumption of Independence of Truncation Time and Failure Time. Biometrika, 1990; 77(1), 169–177. doi: 10.2307/2336059 [DOI] [Google Scholar]
- 18).Martin EC, Betensky RA. Testing Quasi-Independence of Failure and Truncation Times via Conditional Kendall’s Tau, Journal of the American Statistical Association. 2005;100(470)484–492, DOI: 10.1198/016214504000001538 [DOI] [Google Scholar]
- 19).Efron B, Petrosian V. A simple test of independence for truncated data with applications to redshift surveys. Astrophysical Journal. 1992;399. 10.1086/171931. [DOI] [Google Scholar]
- 20).Jones M, Crowley J. Nonparametric Tests of the Markov Model for Survival Data. Biometrika, 1992;79(3), 513–522. doi: 10.2307/2336782. Epub 2019 Nov 21. [DOI] [Google Scholar]
- 21).Austin MD, Betensky RA (2014). Eliminating bias due to censoring in Kendall’s tau estimators for quasi-independence of truncation and failure. Computational statistics & data analysis, 73, 16–26. 10.1016/j.csda.2013.11.018 [DOI] [PMC free article] [PubMed] [Google Scholar]
- 22).Chiou S (2016). tranSurv: Transformation Model Based Estimation of Survival and Regression Under Dependent Truncation and Independent Censoring. R package version 1.2.2 https://CRAN.R-project.org/package=tranSurv [DOI] [PMC free article] [PubMed]
Associated Data
This section collects any data citations, data availability statements, or supplementary materials included in this article.


