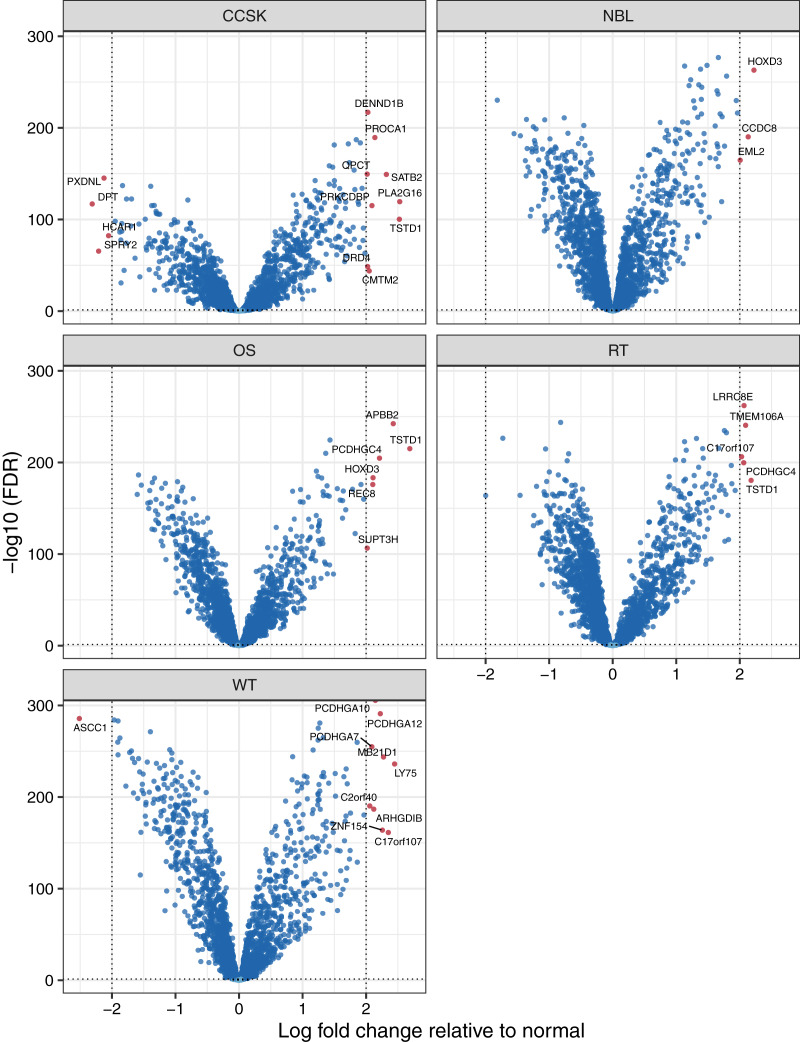
Figure 3. Volcano plots showing differentially methylated genes for each tumor type.
For each tumor type, we compared methylation levels at the gene level between tumors and the normal samples. Genes showing significantly different methylation levels between tumor and normal conditions are highlighted.

