

Abstract
The effect of temperature change on leaf physiology has been extensively studied in temperate trees and to some extent in boreal and tropical tree species. While increased temperature typically stimulates leaf CO2 assimilation and tree growth in high-altitude ecosystems, tropical species are often negatively affected. These trees may operate close to their temperature optima and have a limited thermal acclimation capacity due to low seasonal and historical variation in temperature. To test this hypothesis, we studied the extent to which the temperature sensitivities of leaf photosynthesis and respiration acclimate to growth temperature in four common African tropical tree species. Tree seedlings native to different altitudes and therefore adapted to different growth temperatures were cultivated at three different temperatures in climate-controlled chambers. We estimated the acclimation capacity of the temperature sensitivities of light-saturated net photosynthesis, the maximum rates of Rubisco carboxylation (Vcmax) and thylakoid electron transport (J), and dark respiration. Leaf thylakoid membrane lipid composition, nitrogen content and leaf mass per area were also analyzed. Our results showed that photosynthesis in tropical tree species acclimated to higher growth temperatures, but that this was weakest in the species originating from the coolest climate. The temperature optimum of J acclimated significantly in three species and variation in J was linked to changes in the thylakoid membrane lipid composition. For Vcmax, there was only evidence of significant acclimation of optimal temperature in the lowest elevation species. Respiration acclimated to maintain homeostasis at growth temperature in all four species. Our results suggest that the lowest elevation species is better physiologically adapted to acclimate to high growth temperatures than the highest elevation species, indicating a potential shift in competitive balance and tree community composition to the disadvantage of montane tree species in a warmer world.
Keywords: climate change, Jmax, Vcmax, warming
Introduction
Increasing temperatures experienced by plants in a time of rapid climate change may have severe impacts on tropical ecosystems. Plant species in the humid tropical zone are generally expected to have a low ability to acclimate to changes in temperature since they do not experience seasonality in the same way as temperate and boreal species do (Janzen 1967, Way and Oren 2010, Feeley et al. 2012). In climates with pronounced seasons, plants have to be able to change their physiology and biochemistry over the course of a few weeks or months, and to later change back again. The physiological acclimation capacity of trees has mostly been studied in temperate, and to a certain extent also in boreal, regions (e.g., Tjoelker et al. 1999, Gunderson et al. 2000, Campbell et al. 2007, Kattge and Knorr 2007, Way and Sage 2008, Dillaway and Kruger 2010, Benomar et al. 2019). However, data on tropical trees are scarce (Dusenge and Way 2017) despite tropical forests containing half of the carbon in the biomass on land (Saugier et al. 2001) and more than three-quarters of all terrestrial species (Barlow et al. 2018). Negative effects of warming on tropical forests could have large consequences for tree community composition and biodiversity (Feeley et al. 2011, Esquivel-Muelbert et al. 2019, Feeley et al. 2020), as well as forest capacity to store carbon and thereby mitigate ongoing climate change (Clark 2004, Lewis et al. 2004, Hubau et al. 2020).
Increasing temperatures have a range of implications for plant functioning, productivity and survival. Physiologically, higher temperatures alter the reaction rates of both photosynthesis and respiration, e.g., by changing the fluidity of membranes (Los and Murata 2004) and the activity and stability of enzymes like Rubisco and Rubisco activase (Sage and Kubien 2007, Yamori et al. 2014). Studies on photosynthetic acclimation in tropical trees conducted this far have mostly been based on measured responses of net photosynthesis (An), with contrasting results. In an in situ study, An decreased in high-temperature grown plants (Doughty 2011). Studies using potted plants showed both decreased (Cheesman and Winter 2013b) and increased An (Li et al. 2020a) in response to elevated growth temperature. Some studies showed a lack of acclimation capacity of the optimum temperature (Topt) of An (Ferrar et al. 1989, Sheu and Lin 1999, Smith and Dukes 2017, Crous et al. 2018) while other studies showed significant acclimation (Read 1990, Kositsup et al. 2009, Slot and Winter 2017b), ranging from slight upward shifts in Topt to complete acclimation. These shifts in Topt could be accompanied by an increase (Kositsup et al. 2009) or by a decrease (Slot and Winter 2017b) in absolute values of An at Topt. In two tropical forests in Panama, as well as in a common garden in Rwanda, community average Topt was remarkably similar across species and almost identical to mean maximum daytime air temperature (Vårhammar et al. 2015, Slot and Winter 2017a). The shape of the temperature response curve in tropical tree species has been shown to exhibit a sharper peak shape than for temperate species, meaning that high An is maintained over a narrower temperature span (Cunningham and Read 2002).
The differences among these observations may be due to several processes contributing to the realized An temperature responses. Both of the two major rate-limiting steps in photosynthesis—the maximum velocities of CO2 fixation by Rubisco (Vcmax) and electron transport capacity by the thylakoid electron transport chain (Jmax)—are temperature dependent. Moreover, values of An are also affected by leaf respiration (R) and stomatal conductance (gs). Measuring An alone does not separate between these different processes and how, or if, they acclimate. For better mechanistic understanding of photosynthetic thermal acclimation, it is therefore advisable to study the different processes that together determine An, i.e., Vcmax, Jmax, R and gs (Lin et al. 2012, Dusenge and Way 2017).
So far, only three studies have explicitly reported instantaneous temperature responses of Vcmax and Jmax for tropical trees. Vårhammar et al. (2015) compared the temperature responses of species with different climatic backgrounds. However, acclimation could not be assessed as the study was conducted in a common garden with the same environmental conditions. A second study (Crous et al. 2018) investigated the temperature responses of Vcmax and Jmax in two Eucalyptus species acclimated to different temperatures in a glasshouse experiment. The measured range for the individuals of tropical provenances however did not cover Topt. A third study (Dusenge et al. 2021) showed a slight, but nonsignificant shift in Topt of Vcmax and Jmax of two Rwandan tropical tree species in response to increased growth temperature.
Leaf dark respiration (Rdark) in tropical trees has been shown to be a highly adjustable trait. Rates at a reference temperature are lower in warm-grown compared with cool-grown trees (Cheesman and Winter, 2013a, 2013b, Slot et al. 2014, Drake et al. 2015, Slot and Winter 2018, Mujawamariya et al. 2020). Across biomes, there is usually a partial acclimation (Atkin et al. 2015, Slot and Kitajima 2015, Smith and Dukes 2017), with decreased Rdark at a common temperature, but increased Rdark at Tgrowth with warming. This has also been reported for tropical tree species (Slot et al. 2014). More often, though, it has been found that Rdark is equal at all Tgrowth—so-called homeostasis (Slot and Winter 2018, Mujawamariya et al. 2020)—or that even more extreme reductions in Rdark with warming lead to a decrease in Rdark with Tgrowth (Cheesman and Winter 2013a, Mujawamariya et al. 2020).
We herein report results from an experiment on whether and how much tropical trees acclimate An and its underlying processes (Vcmax, J, R and gs) to an increase in growth temperature in four native Rwandan tree species selected to cover a range of climatic origins. We hypothesized that (i) both An and photosynthetic capacity (Vcmax and J) exhibit thermal acclimation to warming, but it is partial and weaker than observed for temperate and boreal species; (ii) Rdark downregulates in plants grown at high temperature, such that rates at prevailing growth temperature do not significantly differ among treatments; and (iii) the species originating from the warmest climate show a larger heat acclimation capacity of photosynthesis than the species from the coolest climate.
Materials and methods
Plant material
We selected four widely distributed African tropical tree species: Maesa lanceolata, Forssk. (Mla), Ficus thonningii, Blume (Fth), Croton megalocarpus, Hutch. (Cme) and Markhamia lutea, (Benth.) K. Schum. (former M. platycalx, Mlu). They differ in climatic origin and, to some extent, successional strategy (Table 1). The altitudinal distribution of the species was retrieved from Fischer and Killmann (2008) and Bloesch et al. (2009). For each species, we report the extreme low and the extreme high elevation value stated. We also report the annual mean air temperatures at these elevations (Table 1), extrapolated from climate (Fick and Hijmans 2017) and remote sensing databases (US Geological Survey 2021).
Table 1.
Species taxonomy, native elevation and temperature range and successional strategy. Species are ordered according to the lowest altitude at which they are reported in Rwanda.
| Species | Short | Family | Altitudinal range (m)1 | Mean air T (°C)2 | Successional strategy |
|---|---|---|---|---|---|
| Maesa lanceolata | Mla | Primulaceae | 1350–3000 | 12–21 | Early |
| Ficus thonningii | Fth | Moraceae | 1000–2300 | 16–22 | Early and late3 |
| Croton megalocarpus | Cme | Euphorbiaceae | 950–2400 | 15–23 | Early |
| Markhamia lutea | Mlu | Bignoniaceae | 950–1800 | 18–23 | Early and late3 |
1From two Rwandan floras; 950 m is the lowest elevation in Rwanda and given if no minimum elevation is provided. Species occur outside Rwanda, but African tropical floras have been excluded since latitudes may be much higher.
2Ranges correspond to the altitudinal range, data from the years 1970–2000.
3Species occurs in both early and late-successional stands.
Mla is a montane species, which typically occurs in stands at the early successional stage. It produces seeds that are eaten and dispersed by a variety of bird and monkey species (Graham et al. 1995). Fth is a mid- to high-altitude species that can occur in both early- and late-successional stands. Its leaves and twigs are a food source for many different mammal species (World Agroforestry Centre 2021a), and its fruits are also eaten by a range of bird species (Kirika et al. 2008). Cme is a mid-altitude species, but can also occur in montane forests up to 2400 m. It is an early successional species. Its seeds are used as poultry feed due to their high content of protein and leaves are used as mulch in agriculture because of their high levels of nitrogen and phosphorus content (World Agroforestry Centre 2021b). Mlu has the lowest altitudinal range in this study, though very close to Cme. It occurs in both early- and late-successional stands and has been shown to be an important food source for black-and-white colobus, Colobus guereza (Onderdonk and Chapman 2000). All four species are used in traditional medicine and in forestry for their timber (Sindambiwe et al. 1996, Lacroix et al. 2009, Aliyu et al. 2010, Dangarembizi et al. 2013).
Plant cultivation and treatments
The seeds for this experiment were collected in research plantations at Rubona research station, Huye district, Rwanda (-2∘28'54.9'' S, 29∘46'00.1'' E, Cme and Mlu) and in the nearby Ruhande Arboretum (-2∘36'49.9'' S, 29∘45'24.7'' E, Mla). Fth plants were grown from cuttings of six different trees in Rubona. The genetic origin of the mother plants may though be different. We grew seedlings in planting soil (peat with perlite) in 0.2-l pots at a common temperature in growing rooms in Gothenburg, Sweden. Depending on the rate of growth, they were transplanted to 1-l pots (all four species) and later to 2-l pots (Fth and Mlu). At harvest, plant dry mass was 2–40 g only (Figure S1 available as Supplementary data at Tree Physiology Online), so pot size should not have been limiting plant growth much. They were well-watered (thrice a week) and fertilized (once a week) with nitrogen, phosphorus, potassium (NPK ratio 5:1:4) and the most essential minerals (B, Cu, Fe, Mn, Mo, Zn and Mg) throughout the experiment. When at least four leaves were fully developed (~3–4 months after germination or plantation of cuttings), six individuals of each species were randomly assigned to each of three treatments: 20, 25 and 30 °C growth temperature during daytime, with 5 °C lower nighttime temperatures in climate-controlled chambers (Percival Scientific, Perry, IA, USA). In the following, Tgrowth values refer to daytime temperatures in all text and figures except in the context of dark respiration where nighttime temperatures are more relevant. Photosynthetic photon flux density (PPFD) was 400 μmol m−2 s−1 from 6:00 to 18:00 h and light was otherwise off. This radiation level is lower than the 600–800 μmol m−2 s−1 daytime PPFD found in the origin forests of these species (Dusenge et al. 2021), but not unrealistically low since values of 400 μmol m−2 s−1 are common under cloudy conditions or at lower sun angles. Ventilation was installed to the climate-controlled chambers to ensure stable ambient CO2 concentrations. Temperature and relative air humidity in the chambers was measured every 30 min. Vapor pressure deficit was calculated to be on average 0.76, 1.53 and 1.34 kPa at the three different growth temperatures (20, 25 and 30 °C, respectively). The reason for rather similar vapor pressure deficits in the 25 and 30 °C treatments was the richer irrigation in 30 °C chambers, with a water mirror covering the trays onto which pots were placed for longer time after each irrigation. The 20 and 25 °C treatments cover the range of mean annual day temperatures at the lowest altitude at which the four species are reported in Rwanda (21–23 °C; Table 1) while the 25 and 30 °C treatments are equivalent to future climate change scenarios. A 5 °C difference between day and night temperatures was chosen since the diurnal variation in temperature is 4–5 °C in the origin forests in Rwanda (Mujawamariya et al. 2020). The difference between the coolest and warmest months in the origin forests is only 2 °C (Dusenge et al. 2021), and this seasonal variation is not represented in this experiment.
Gas exchange measurements
When all 18 trees of one species had developed new leaves under chamber treatment conditions, leaf gas exchange was measured on one attached leaf per plant using two LI6400 instruments equipped with the 6-cm2 standard leaf chamber and the red-blue light source (LI-COR, Lincoln, NE, USA). The PPFD was set to 400 μmol m−2 s−1, which equaled the daytime PPFD inside the growth chambers and was near light saturation according to light response measurements made for each species. We measured photosynthetic responses to leaf intercellular CO2 concentration (Ci) (so-called A–-Ci curves) at leaf temperatures in 5 °C intervals from 15 to 40 °C, starting at the lowest temperature. Measurements were taken at 12 concentrations of CO2 of the air entering the leaf chamber: 415, 60, 120, 200, 300, 415, 700, 1000, 1350, 1700, 2000 and again 415 μmol mol−1. At high temperatures, air humidity was increased by connecting an LI610 dew point generator (LI-COR) to the LI6400. The air temperature of the room where measurements were made was increased alongside leaf temperature up to ~35 °C and the LI610 was set at a temperature a few degrees below room temperature to avoid condensation. Nevertheless, stomatal closure responses were unavoidable and in some leaves, A–Ci curves could not be reliably used for Vcmax and J determination at the highest temperatures due to low gs (≤0.02 mol m−2 s−1). In the figures relating to photosynthesis, we only show data with n > 2, apart from Cme and Mla at Tgrowth 20 °C and Tleaf 40 °C, where n = 2.
In addition to A–Ci curves, we also measured steady-state gs and Rdark. Acclimated gs was recorded after waiting 30 min at 25 °C and at respective growth temperature (if different) for each plant. VPD during the gs measurements increased across species from 1.0 at 20 °C and 1.5 at 25 °C to 2.0 at 30 °C. Leaf Rdark measurements were conducted on neighboring leaves after 30 min dark acclimation at a CO2 concentration (Ca) of 415 μmol mol−1. It was measured in 5 °C steps between 15 and 30 °C.
Photosynthesis
The parameters Vcmax and J were estimated from the A–Ci curves using the Farquhar et al. (1980) biochemical model of C3 photosynthesis with updated temperature response parameters for Rubisco kinetics (Bernacchi et al. 2001). The model, which assumes that photosynthesis is limited by either Vcmax or J, was fitted to data using the least squares method. Apparent values of Vcmax and J, parameterized based on Ci, are reported. The equation for carboxylation-limited photosynthesis (Ac; rate limiting at low Ci) is:
 |
(1) |
where  is the CO2 concentration at which the carboxylation reaction of Rubisco equals the oxygenation reaction, Kc and Ko are the Michaelis–Menten constants of Rubisco for carboxylation and oxygenation, respectively, O is the partial pressure of oxygen inside the leaf and Rd is respiration in light.
At high Ci, photosynthesis is limited by J (Aj; J produces energy to regenerate RuBP, ribulose1, 5-bisphosphate, in the Calvin cycle) and is calculated as:
 |
(2) |
We determined J instead of Jmax since measurements were made at PPFD of 400 μmol mol−1. Rd in Eqs. (1) and (2) was allowed to vary along with Vcmax or J in the fitting. All determined values of Vcmax and J (from all six trees per species and treatment) were used to fit a peaked Arrhenius function (Medlyn et al. 2002):
 |
(3) |
where kopt is the value of J or Vcmax at Topt, Hd is the deactivation energy determining the rate of decrease of the function above the optimum, and Ha is the activation energy determining the rate of initial exponential increase of the function below the optimum. Values of Topt, kopt and Ha were fitted while Hd was assumed constant at 200 kJ mol−1 to avoid over-parameterization (Medlyn et al. 2002).
Photosynthesis at a common Ci of 290 μmol mol−1 (i.e., 70% of ambient air CO2) was estimated from the fitted A–Ci curves to isolate biochemical influences on photosynthesis from stomatal limitations. Temperature response functions of An at a Ca of 415 μmol mol−1 (the first measurement of each A–Ci curve) and at a constant Ci of 290 μmol mol−1 were fitted to a second-order equation (Säll and Pettersson 1994, Gunderson et al. 2000):
 |
(4) |
where An(T) is An at a given air temperature (T), Aopt is An at Topt and b is a constant that determines the width of the peak of the curve.
As an indicator for water-use efficiency, we calculated g1 (inversely related to intrinsic water-use efficiency) from the model for optimal stomatal conductance by Medlyn et al. (2011):
 |
(5) |
where g0 is the gs (for water vapor) at zero An, 1.6 is the ratio of the diffusivities of water vapor and CO2, and D is the leaf-to-air water vapor pressure deficit. The g0 was assumed to be zero since values are often small (Medlyn et al. 2011).
Respiration
The temperature response function of R was fitted for each leaf by determining the Rdark value at the lowest measured temperature, 15 °C (R15), and the Q10 value (the proportional change in respiration per 10 °C change in Tleaf; Tjoelker et al. 1999):
 |
(6) |
where Rdark(T) is respiration in the dark at a certain measurement temperature in the range 15–30 °C (T).
Leaf traits, thylakoid membrane lipids and nitrogen content
After gas exchange measurements, the leaves were sampled for the determination of leaf mass per area (LMA) and nitrogen content. For this, 6–8 20 mm diameter leaf discs from the central part of both sides of the leaf (avoiding the mid-vein) were taken, when possible. For small leaves (Fth), an 8-mm diameter puncher was used instead. Half of the leaf discs were dried and weighed to determine LMA. The bulk leaf material (except the midvein) was dried and ground in a ball mill. Thereafter, nitrogen content was measured by dry combustion using an element analyzer (EA 1108; Fison Instruments, Rodano, Italy).
The remaining half of the discs were immediately frozen in liquid nitrogen and transferred to a −80 °C freezer. Thylakoid lipids were extracted from these samples using a modified Bligh and Dyer lipid extraction protocol (Kourtchenko et al. 2007). The thylakoid lipid composition was determined using liquid chromatography coupled to tandem mass spectrometry using an Agilent 1200 LC system coupled to either an Agilent 6470 Triple Quadrupole mass spectrometer or/and Agilent 6410 triple quadrupole mass spectrometer. The lipids were separated using a C30 column and a solvent gradient as previously described (Nilsson et al. 2019). The thylakoid lipid species were monitored using the transitions and settings previously described (Nilsson et al. 2014). The total amount of monogalactosyldiacylglycerol (MGDG), digalactosyldiacylglycerol (DGDG), phosphatidylglycerol (PG), sulfoquinovosyldiacylglycerol (SQDG) was quantified as a sum of the species for each lipid class.
The tree seedlings were harvested after the measurements and dry mass of stems, leaves and roots were determined. For Fth, only new plant parts were included in the biomass determination, not the cuttings.
Statistics
We tested assumptions for two-way ANOVAs on gas exchange variables, biomass and lipid content of the thylakoid membrane. Since most variables had heterogeneous variances, we subsequently conducted species-specific one-way ANOVAs for all parameters but respiration, which fulfilled assumptions (two-way ANOVA, followed by Tukey). If variances before one-way ANOVA were still heterogeneous (i.e., between treatments), or residuals were non-normally distributed, we conducted non-parametric Kruskal–Wallis tests (see footnotes in Table 2 and Table S1 available as Supplementary data at Tree Physiology Online).
Table 2.
P- and F-values of one-way ANOVA (and P- and χ2-values in case of non-parametric Kruskal–Wallis tests for data with non-normal distribution or heterogeneous variances) for the effect of growth temperature on parameters derived from gas exchange measurements1 and on relative amount of thylakoid lipid classes and average amount of double bonds in the lipid classes in the four different species (short names explained in Table 1). Significant (P < 0.05) and near-significant (0.05 < P ≤ 0.10) values are in bold and regular font style, respectively. ns, not significant.
| Variables | Mla | Fth | Cme | Mlu | ||||
|---|---|---|---|---|---|---|---|---|
| F/χ2 | P | F/χ2 | P | F/ χ2 | P | F/χ2 | P | |
| A Ca415 at Tgrowth | 7.52 2 | 0.023 2 | ns | ns | 3.89 | 0.043 | ||
| A Ci290 at Tgrowth | ns2 | ns | ns | 5.02 | 0.021 | |||
| g S at Tgrowth | 61.94 | <0.001 | ns | 3.58 | 0.054 | 5.30 | 0.018 | |
| g S at T25 | ns | ns | ns | 17.76 | <0.001 | |||
| g 1 at Tgrowth | 38.30 | <0.001 | ns | ns | 8.28 | 0.004 | ||
| g 1 at T25 | ns | ns | ns | 19.83 | <0.001 | |||
| C i/Ca at Tgrowth | 62.94 | <0.001 | ns | 5.70 | 0.014 | 2.87 | 0.088 | |
| C i/Ca at T25 | ns | 3.29 | 0.067 | ns | 26.91 | <0.001 | ||
| V cmax25 | ns2 | ns | ns | 10.93 | 0.001 | |||
| J 25 | ns2 | 2.85 | 0.089 | 6.44 | 0.010 | 20.55 | <0.001 | |
| J 25/Vcmax25 | 14.48 | <0.001 | ns | ns | ns | |||
| Biomass | 4.75 | 0.025 | 6.19 | 0.024 | 10.98 | 0.001 | 8.18 | 0.004 |
| Root/shoot | ns | ns | ns | 3.28 | 0.068 | |||
| LMA | ns2 | ns | ns | ns | ||||
| Nitrogen per area | ns | ns | 10.65 | 0.001 | ns | |||
| %MGDG | 12.28 2 | 0.002 2 | ns | ns | 4.72 | 0.034 | ||
| %DGDG | 11.49 | 0.001 | ns | ns | 11.14 | 0.001 | ||
| %PG | 7.10 | 0.008 | ns | ns | 9.58 | 0.002 | ||
| %SQDG | ns | ns | ns | ns2 | ||||
| ADB MGDG | 10.34 2 | 0.006 2 | ns | 3.75 | 0.052 | 25.84 | <0.001 | |
| ADB DGDG | 16.59 | <0.001 | ns | 8.80 2 | 0.012 2 | 12.32 2 | 0.002 2 | |
| ADB PG | 97.53 | <0.001 | ns | 18.02 | <0.001 | 11.09 | 0.001 | |
| ADB SQDG | 16.99 | <0.001 | 16.22 | <0.001 | 11.20 | 0.001 | 6.53 | 0.009 |
1The parameters are: net photosynthesis at ambient CO2 and at growth temperature (ACa415 at Tgrowth) and at a CO2 concentration of 290 μmol mol−1 (ACi290 at Tgrowth), stomatal conductance at growth temperature (gs at Tgrowth) and at 25 °C (gs at T25), the g1 parameter (see Eq. (5)) at growth temperature (g1 at Tgrowth), and at 25 °C (g1 at T25), the ratio of internal leaf CO2 to ambient air CO2 at growth temperature (Ci/Ca at Tgrowth), and at 25 °C (Ci/Ca at T25), Vcmax, J and dark respiration at 25 °C (Vcmax25, J25 and R25), the change in respiration per 10 °C change in measurement temperature (Q10), total dry biomass (Biomass), the ratio of root dry biomass to shoot dry biomass (Root/shoot) and leaf mass per unit area (LMA).
2Results (χ2 and P-values) for non-parametric Kruskal–Wallis tests.
Significant differences between optimum temperatures were determined as follows: since Eqs (3) and (4) were fitted to data pooled for each growth temperature and species, we conducted three pairwise treatment comparisons and accounted for multiple comparisons by choosing a P limit of 0.017 to determine significance. This means that the probability of obtaining at least one significant difference by pure chance will be 5% (1 − (1 − 0.017)3). Species means were therefore regarded significantly different if the following relationship between mean (x) and standard error of the mean (SE) values was true:
 |
(7) |
A–Ci curves were fit in Microsoft Excel, all other analyses were performed in R 4.0.0 (R Core Team 2020).
Results
Net photosynthesis and underlying component processes
All four species showed some flexibility in An and/or its underlying processes under varying growth temperatures. The photosynthetic performance at high growth temperature markedly improved with the species origin temperature, being best for the lowest elevation species and worst for the highest elevation species. In the figures, species are therefore ordered according to decreasing lowest elevation of their native central African distribution: Mla, Fth, Cme and Mlu.
All species had a higher Topt of An at ambient CO2 concentration (ACa415) in the warmer treatments, but it was only statistically significant in the highest elevation species, Mla, and the lowest elevation species, Mlu (Figure 1). Averaged across all species, Topt acclimated to 0.41 °C per 1 °C warming (Figure 2). The performance advantage of cool-grown plants at low Tleaf was particularly pronounced in the highest elevation species, Mla, which exhibited increased ACa415 at low Tleaf in the 20 °C treatment (Figure 1a). The lowest elevation species, Mlu, had significant treatment (Tgrowth) differences in ACa415 at both low and high Tleaf. This was the species that benefitted most from higher growth temperature, with 30 °C-grown Mlu plants exhibiting strong stimulation of ACa415 at high Tleaf compared with plants grown at 20 and 25 °C (Figure 1d). The two intermediate-elevation species were also intermediate in their responses to warming. The warming response of ACa415 measured at respective Tgrowth differed between species. There was a significant decrease in ACa415 at Tgrowth with warming in the highest elevation species Mla, no significant change in Cme and Fth, and an increase in the lowest elevation species Mlu (Table 2).
Figure 1.

Temperature dependence of net photosynthesis at light saturation and ambient CO2 in the tree species Maesa lanceolata (a), Ficus thonningii (b), Croton megalocarpus (c) and Markhamia lutea (d) grown at daytime temperatures of 20, 25 or 30 °C. Data points are means ± SE. Large points indicate the values at the growth temperature of each treatment. The top part of each panel shows the estimated optimum temperatures. Asterisks denote significant differences among growth temperatures tested at each leaf temperature (P ≤ 0.05) and between optimal temperatures (P ≤ 0.017). Statistical results are provided in Table 2 and Table S2 (available as Supplementary data at Tree Physiology Online).
Figure 2.

Acclimation capacity of Topt in Vcmax (average slope across species 0.24), J (0.33), ACi290 (0.50), ACa415 (0.41) to variation in daytime growth temperature (Tgrowth). The black line denotes equality of Topt and Tgrowth. Data are only included if Topt was within the measured temperature range.
Photosynthesis at the ambient CO2 concentration in the air is determined by the photosynthetic performance itself, but also gs. The specific importance of An can better be seen using a common CO2 concentration of 290 μmol mol−1 (70% of CO2 concentration in the air) in the leaf intercellular spaces (ACi290). Topt of ACi290 was also higher in the warmer treatments (Figure 2), but this was only significant in the high-elevation species Mla. Across all species, the change in Topt was on average 0.50 °C per 1 °C increase in Tgrowth (Figure 3). The ACi290 results of the two intermediate species did not differ a lot from those on ACa415. The lowest elevation species Mlu showed a higher magnitude of ACi290 across all Tleaf in cold-grown compared with warm-grown plants. For ACi290 at Tgrowth, the three higher altitude species showed no significant change with warming, while it decreased with warming in Mlu. The large shift in Topt in the latter species was nonsignificant due to a high variation and uncertainty for plants grown at a daytime temperature of 30 °C.
Figure 3.

Temperature dependence of net photosynthesis at light saturation and a common leaf intercellular CO2 concentration (Ci) of 290 p.p.m. in the tree species Maesa lanceolata (a), Ficus thonningii (b), Croton megalocarpus (c) and Markhamia lutea (d). Asterisks denote significant differences among growth temperatures tested at each leaf temperature (P ≤ 0.05) and between optimal temperatures (P ≤ 0.017).
Stomatal conductance at Tgrowth significantly decreased in Mla and increased in Mlu by more than 50% with warming (Figure 4a). The change in ACa415 at Tgrowth in Mla (decrease) and Mlu (increase, Figure 1a and d) was thus not caused by acclimation of photosynthetic capacity (ACi290, Figure 3) but rather by acclimation of gs to growth under high temperatures. Similar patterns were seen for g1 at Tgrowth (Figure 4c), the parameter of the combined stomatal conductance photosynthesis model that is inversely related to intrinsic water-use efficiency and the Ci/Ca ratio (though not significant in Mlu, Figure 4e). Response patterns at a measurement temperature of 25 °C were similar to those daytime at Tgrowth, except that Mla did not show any difference among temperature treatments (Figure 4b, d and f).
Figure 4.

Stomatal conductance (gs; a, b), the slope parameter of the stomatal-photosynthesis model (g1, see Eq. (5); c, d) and the ratio of leaf intercellular to ambient air CO2 concentration (Ci/Ca; e, f) at growth temperature (left-hand panels) and 25 °C (right-hand panels) in the tree species Maesa lanceolata (Mla), Ficus thonningii (Fth), Croton megalocarpus (Cme) and Markhamia lutea (Mlu) grown at daytime temperatures of 20, 25 or 30 °C. Data points are means ± SE and asterisks denote significant differences (P ≤ 0.05) among treatments.
The Topt of photosynthetic carboxylation (Vcmax) was in general above 35 °C, with the exception of 20 °C-grown Mlu plants (Figure 5). For some species and treatments (Cme at 25 °C; Cme, Fth and Mlu at 30 °C), Topt was estimated above the measured Tleaf range. The shift in Topt across all four species, and excluding estimates above the measurement range, was on average 0.24 °C per 1 °C increase in Tgrowth (Figure 2). The capacity for carboxylation at 25 °C (Vcmax25) remained unchanged with warming in three species and decreased only in Mlu (Table 2, Figure S2 available as Supplementary data at Tree Physiology Online).
Figure 5.

Temperature dependence of the maximum rate of Rubisco carboxylation (Vcmax) at light saturation is expressed relative to the value at 25 °C in the tree species Maesa lanceolata (a), Ficus thonningii (b), Croton megalocarpus (c) and Markhamia lutea (d). Figure explanations as for Figure 1, but without testing for differences in magnitude of the dependent variable. The Topt for Croton megalocarpus and Markhamia lutea (not visible in figure) were estimated at 45.3 and 44.1 °C, respectively, with an SE of 5.5 and 2.0. Asterisks denote significant differences among growth temperatures tested at each leaf temperature (P ≤ 0.05) and between optimal temperatures (P ≤ 0.017).
The Topt of photosynthetic electron transport (J) increased significantly under higher Tgrowth in all species except Mlu (again due to a high variation in the 30 °C treatment, Figure 6, P = 0.033). The shift in Topt was on average 0.33 °C per 1 °C increase in Tgrowth (Figure 2). Absolute values of J at 25 °C (J25) showed that Cme and Mlu significantly reduced J at 25 °C with Tgrowth (Table 2, Figure S2 available as Supplementary data at Tree Physiology Online).
Figure 6.
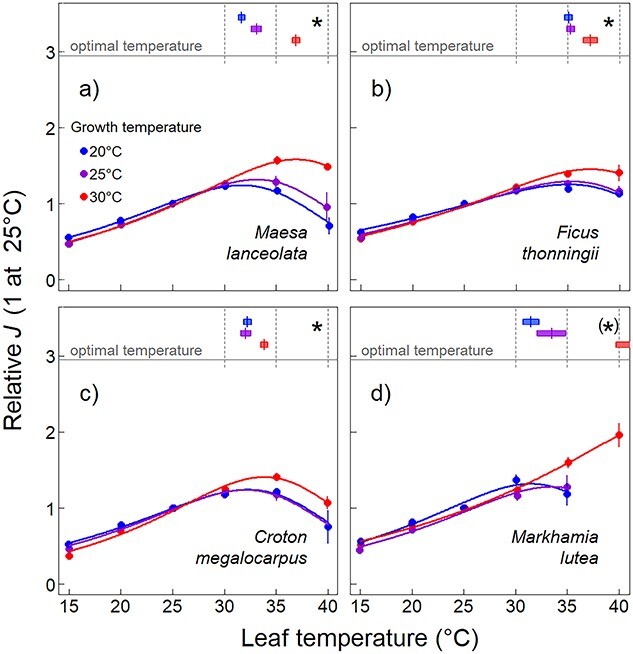
Temperature dependence of photosynthetic electron transport (J) at light saturation expressed relative to the value at 25 °C in the tree species Maesa lanceolata (a), Ficus thonningii (b), Croton megalocarpus (c) and Markhamia lutea (d) grown at daytime temperatures of 20, 25 or 30 °C. Figure explanations as for Figure 1, but without testing for differences in the magnitude of the dependent variable. Asterisks denote P ≤ 0.1. The Topt for Markhamia lutea (not visible in figure) was estimated at 46.9 °C. Asterisks denote significant differences among growth temperatures tested at each leaf temperature (P ≤ 0.05) and between optimal temperatures (P ≤ 0.017).
We determined whether Vcmax or J was limiting ACa415 for all A–Ci curves using Eqs (1) and (2). The species Mla and Cme were most often limited by Vcmax at the lowest Tgrowth and got more often limited by J at higher Tgrowth. The species Fth was at nearly all Tgrowth and Tleaf limited by Vcmax. The species Mlu, on the other hand, was most often limited by J at all Tgrowth, but especially in 30 °C-grown plants.
Thylakoid membrane lipid compositions
Analysis of the thylakoid lipids revealed that both the lipid class composition, as well as the average amount of double bonds in each class, was affected by growth temperature. The degree of lipid unsaturation decreased with increasing Tgrowth in almost all species and lipid classes (Figure 7, Table 2). Mla and Mlu downregulated the amount of double bonds (ADB) in all four thylakoid lipid classes. Cme also downregulated ADB of DGDG, PG and SQDG. The species Fth, on the other hand, decreased ADB in only SQDG (Figure 7h). Linear regression showed that the average ADB of all lipid classes correlated with Topt of J (P < 0.05, data not shown). The amount of MGDG in relation to other thylakoid lipids increased with warming in Mla and Mlu while the proportion of DGDG and PG decreased. The effect was particularly strong in Mla. Linear regression showed that J25 significantly increased with an increased ratio of MGDG/DGDG across all species (P = 0.033).
Figure 7.

Relative amounts of monogalactosyldiacylglycerol (MGDG; a), digalactosyldiacylglycerol (DGDG; c), phosphatidylglycerol (PG; e) and sulfoquinovosyldiacylglycerol (SQDG; g) in the thylakoid membrane and their average amounts of double bonds (ADB) in the right-hand panels (b, d, f, h) in the four tree species. Figure explanations as for Figure 4.
Leaf respiration
Dark respiration at a leaf temperature of 25 °C (R25) differed significantly between species (P < 0.001) and Tgrowth. (P < 0.001). It was higher in Fth than in all other species and decreased from nighttime Tgrowth of 15–25 °C as well as from 20 to 25 °C significantly across species (Figure 8). On average, R25 decreased by 35–56% with a 10 °C increase in Tgrowth. The decrease of R25 did not significantly differ between species. Dark respiration at nighttime Tgrowth was constant across treatments, indicating full acclimation, or homeostasis, of leaf Rdark (striped bars in Figure 8). While Rdark at a given Tleaf decreased with increasing Tgrowth, the shape of the temperature response curves stayed the same. This is shown by the Q10 values (the proportional change in respiration per 10 °C change in Tleaf), which did not significantly differ between treatments or species. Across all treatments and species, Q10 averaged 2.3 with an SE of 0.2.
Figure 8.
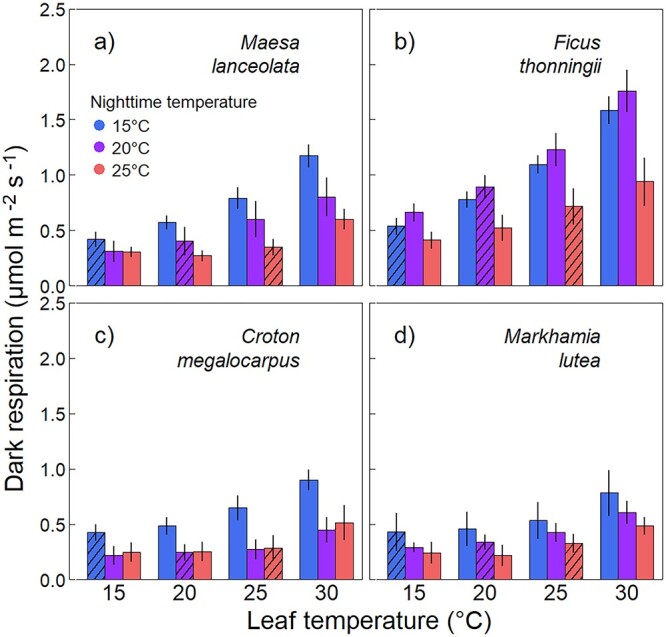
Dark respiration (Rdark) measured at 15, 20, 25 and 30 °C in the tree species Maesa lanceolata (a), Ficus thonningii (b), Croton megalocarpus (c) and Markhamia lutea (d) grown at 15, 20 or 25 °C (nighttime temperatures, 5 °C lower than daytime temperatures). Dark respiration at 25 °C differed significantly between temperature treatment as well as between species (P < 0.001), with no significant interaction between these factors. Dark respiration at growth temperature did not significantly differ between temperature treatments. Bars are means ± SE (n = 6). Striped bars represent measurements at nighttime growth temperature in each treatment.
Plant biomass and leaf traits
The total biomass of all species was affected by Tgrowth (Table 2). Mla acquired less biomass in the warmest Tgrowth than at colder temperatures, while the other three species acquired more biomass in warmer temperatures (Figure S1 available as Supplementary data at Tree Physiology Online). In Cme and Mlu, there was a reduction between 25 and 30 °C treatments. This is in accordance with gas exchange data, showing that An at Tgrowth decreased in Mla only (Figure 1). The ratio of root dry biomass to leaf and shoot dry biomass (Root/shoot) as well as LMA did not change with Tgrowth in any species. Leaf nitrogen on an area basis decreased significantly with high Tgrowth in Cme, but did not change in the other species (Figure S1 available as Supplementary data at Tree Physiology Online).
Discussion
Our results highlight how differently tropical tree species respond to altered growth temperature. The montane species Mla showed decreased performance at high temperatures due to a decrease in gs, while the lowest elevation species Mlu showed improved performance reflected in An and biomass increase (Table 3). The intermediate-elevation species were also intermediate in their responses to warming. Moreover, the contributions to the overall responses by acclimation of different component processes (Vcmax, J, gs and Rdark) were highly species-specific. One of the most important outcomes of this study is therefore that photosynthetic acclimation cannot be thoroughly understood (or predicted) by looking at An responses only. In the following, we will discuss the different component processes of photosynthesis in the four species.
Table 3.
Results overview: arrows represent upward or downward acclimation of the respective process with Tgrowth. Colors represent positive (blue) and negative (red) effects of high Tgrowth on plant performance. The thick and narrow arrows represents a significant (<0.05) or near-significant (0.05 < P ≤ 0.10) shift (in Topt, significant values have P < 0.017 due to multiple comparisons).
| Mla | Fth | Cme | Mlu | |
|---|---|---|---|---|
| T opt of Vcmax |

|
|||
| T opt of J |

|

|

|

|
| g s at Tgrowth |

|

|
||
| R 25 |

|

|

|

|
| ADB |

|

|

|
|
| A 415 at Tgrowth |

|

|
||
| Total biomass |

|

|

|
This is, to the best of our knowledge, the second study to explicitly estimate the long-term acclimation capacity of Topt for both Vcmax and J in tropical tree species. A previous study on Rwandan tropical trees grown in the field reported that shifts in Topt of Vcmax and Jmax in response to increased growth temperature were too low to be significant (Dusenge et al. 2021). Another study explored short-term temperature responses of Vcmax and Jmax in plants acclimated to different temperature treatments for 1 week and found significant Topt shifts in Vcmax and Jmax (Smith and Dukes 2017). Tropical species showed a shift in Topt of Jmax of 0.12 °C per 1 °C change in Tgrowth, but the value for Vcmax was not reported. Otherwise, previous studies have determined Topt acclimation for An only. A global meta-analysis with mostly data for temperate species found that thermal acclimation of An reaches usually ~0.5 °C per 1 °C change in Tgrowth in C3 species (Yamori et al. 2014). Our results suggest that changes in Topt of An in tropical tree species may be in the same range (0.41 °C across species in this study) but that there is high variability between species. Changes in Topt of Vcmax and J were overall a bit lower (0.24 and 0.33 °C, respectively) than for An. The observed shift in Topt of Vcmax is similar to previous results on tropical trees, but the shift in Topt of J is stronger in our study (Smith and Dukes 2017, Dusenge et al. 2021) These shifts also showed high variability across species, roughly aligning with, but not fully explaining the Topt shifts in An, which were also influenced by responses of gs. Other types of physiological responses that were not analyzed in this study, like, for example, mesophyll conductance, may also have the shift in Topt (Warren 2007, Li et al. 2020b).
Light-saturated photosynthesis is usually limited by Vcmax in trees (De Kauwe et al. 2015), including tropical species (Vårhammar et al. 2015). Our study is in agreement with this, except for Mlu, which was mostly limited by J. Under field conditions with varying radiation, photosynthesis will constantly change between Vcmax and J limitation, with leaves allocating resources between the two processes to optimize overall carbon assimilation (Niinemets et al. 2004, Quebbeman and Ramirez 2016). It is therefore important to understand thermal acclimation of Rubisco carboxylation as well as the mechanisms underlying shifts in the electron transport capacity of thylakoid membranes to assess how warming affects An.
The degree of flexibility in Topt of J can be explained by changes in the unsaturation of the thylakoid membranes. Increased saturation keeps the membranes stable at higher temperatures and allows for a change in Topt of J (electron transport) across these membranes. Thylakoid membrane lipid unsaturation was in general lower in the 30 °C treatment than in the 20 °C treatment, with few exceptions (Figure 7). The decrease in unsaturation was mainly due to a decrease in the most highly unsaturated species of the galactolipids (i.e., MGDG and DGDG), thus likely reflecting a repression of chloroplast localized n-3 desaturase activity. This decrease in saturation is in line with previous results: in both oleander (Nerium oleander) and wheat (Triticum aestivum), the amount of the trienoic (containing three double bonds) fatty acid linoleic acid decreased, while lipids with fewer double bonds increased in response to increased growth temperature (Raison et al. 1982, Narayanan et al. 2015). In Arabidopsis thaliana, a mutant lacking trienoic acid was shown to be more thermotolerant, but long-term growth and survival were reduced (Routaboul et al. 2011). In beans (Phaseolus vulgaris), water stress-induced resistance to high temperature was connected to a decrease in the number of double bonds in the thylakoid fatty acids (González-Cruz and Pastenes 2012).
In addition to the decrease in unsaturation of the thylakoid membrane lipids, we also observed an increase in the relative amount of MGDG in Mla and Mlu in response to higher growth temperature. These are also the two species that exhibit the largest positive shifts in Topt of J with warming (Figure 6). There are several reasons why an increase in MGDG with warming may be beneficial. It has been shown that small heat shock proteins prefer to bind to the non-bilayer forming lipids, such as MGDG, rather than for instance, PG and DGDG (Balogi et al. 2005). Another possibility is that the change in MGDG/DGDG shows, rather than a change in membrane composition, a change in the ratio of grana to stroma thylakoids. Grana thylakoids are higher in MGDG than stroma thylakoids (Gounaris et al. 1983) and they are richer in photosystem II (PSII), which is the more heat-labile of the two photosystems (Routaboul et al. 2011). It may therefore be beneficial for plants to increase the amount of grana thylakoids (and thus MGDG) with warming.
Temperature-induced changes in the MGDG/DGDG ratio (both increase and decrease) have been recorded before, but it is commonly a decrease in the ratio that is associated with thermotolerance, not an increase (Chen et al. 2006, Wang and Lin 2006, Su et al. 2009, González-Cruz and Pastenes 2012, Zhang et al. 2018). Increasing thermotolerance with the amount of DGDG has been suggested to be related to this lipid class’ role in stabilizing extrinsic proteins in the oxygen-evolving complex (González-Cruz and Pastenes 2012). In our study, the highest elevation species instead significantly decreased in DGDG (Mla) with Tgrowth and it is noteworthy that this is the species that showed a decrease in photosynthesis and biomass with temperature (Figure 1a, Figure S2a available as Supplementary data at Tree Physiology Online). However, the decrease in photosynthesis was not due to reduced photosynthetic capacity, but decreased gs (Figure 4a), so an influence of DGDG is unlikely. The exact link between decreased unsaturation, increased MGDG content and the acclimation of the electron transport chain to higher growth temperature remains to be understood. Nevertheless, both phenomena were well linked to a higher ability of temperature acclimation of photosynthetic electron transport.
The decrease in An at high Tgrowth in the high-altitude species Mla was caused by decreased gs with warming (Figure 4a and b), rather than by decreased photosynthetic capacity, as shown by ACi290 (Figure 3a). This confirms the importance of considering stomatal responses when interpreting An responses. However, few studies have investigated the response of gs to warming in tropical species, as well as in other biomes (Locke et al. 2013, Way and Yamori 2014). A study on tropical tree seedlings showed that gs at growth temperature decreased with warming, but did not differ at a common temperature (Slot and Winter 2017b). This is generally similar to the temperature response observed here in Mla, Fth and Cme (Figure 4). Mlu, however, increased gs measured at Tgrowth as well as at 25 °C. Water was not a limiting factor in the current study, but since water availability will most likely decrease under future warming, the Mlu response to increase gs at higher Tgrowth may turn out not to be as good a strategy as it was in this experiment.
A global meta-analysis including five tropical studies suggested that Rdark at varying Tgrowth commonly acclimates in tropical tree and liana species, but only partially (Slot and Kitajima 2015). On the contrary, a recent field study showed complete or even over-compensatory acclimation in 16 African tropical tree species (Mujawamariya et al. 2020). That study included the four species described here and found homeostasis in Mlu and Cme across all sites and over-compensation in Mla and Fth at the warmest site. In our study, Rdark at respective Tgrowth did not change with warming in any species (Figure 8). A possible reason for larger down-regulation in Rdark in Mla and Fth in the field study compared with this well-watered climate chamber study is that heat-induced reductions in photosynthesis may be larger under field conditions. Acclimation in Rdark has been shown to be dependent on An, such that Rdark acclimation depends on substrate availability and, thus, changes in An (Dusenge et al. 2019).
Conclusions
We investigated temperature acclimation of photosynthesis and its underlying processes in four Rwandan tree species. The growth temperatures in this experiment represent natural conditions in Rwandan forests—including Nyungwe national park, the largest remaining montane tropical forest in Africa—as well as conditions that may be expected with climate change in this region in the next century. We found that the Topt of An and its underlying processes is able to acclimate, but acclimation was only partial. Dark respiration was found to acclimate strongly and reach homeostasis, as has been found for tropical species before. We also show that gs is key to realize potential photosynthesis. In our experiment, the montane species Mla showed a decrease in gs in response to warming alone which is, likely to be aggravated in a climate that is also drier. On the contrary, the lowest elevation species Mlu increased gs at higher growth temperature. This increased the performance of Mlu in the warm treatments, but may not be a viable strategy in a climate that is also drier.
Our results support what has been found in South American tropical forests along elevation gradients: that warming can give a competitive advantage to low-elevation warm-adapted species and lead to thermophilization of tree communities (Duque et al. 2015, Fadrique et al. 2018). Poor physiological acclimation of native high-elevation species may contribute to this trend and put them at risk in future tropical climates. Research on these species is therefore a matter of urgency in order to gain more knowledge about highland ecosystems in the tropics, with all their valuable functions.
Supplementary Material
Acknowledgments
We are grateful to the Rwanda Agriculture and Animal Resources Development Board (RAB) for the supply of germplasm. We would also like to thank Louise C. Andresen for constructive comments on the manuscript and Mirindi E. Dusenge for helpful discussions about data analysis and interpretation.
Contributor Information
Maria Wittemann, Department of Biological and Environmental Sciences, University of Gothenburg, PO Box 461, Gothenburg SE-405 30, Sweden; Gothenburg Global Biodiversity Centre (GGBC), University of Gothenburg, PO Box 461, Gothenburg SE-405 30, Sweden; Department of Biology, College of Science and Technology, University of Rwanda, University Avenue, PO Box 117, Huye, Rwanda.
Mats X Andersson, Department of Biological and Environmental Sciences, University of Gothenburg, PO Box 461, Gothenburg SE-405 30, Sweden.
Bonaventure Ntirugulirwa, Department of Biological and Environmental Sciences, University of Gothenburg, PO Box 461, Gothenburg SE-405 30, Sweden; Department of Biology, College of Science and Technology, University of Rwanda, University Avenue, PO Box 117, Huye, Rwanda; Rwanda Agriculture and Resources Development Board (RAB), PO Box 5016, Kigali, Rwanda.
Lasse Tarvainen, Department of Biological and Environmental Sciences, University of Gothenburg, PO Box 461, Gothenburg SE-405 30, Sweden.
Göran Wallin, Department of Biological and Environmental Sciences, University of Gothenburg, PO Box 461, Gothenburg SE-405 30, Sweden.
Johan Uddling, Department of Biological and Environmental Sciences, University of Gothenburg, PO Box 461, Gothenburg SE-405 30, Sweden; Gothenburg Global Biodiversity Centre (GGBC), University of Gothenburg, PO Box 461, Gothenburg SE-405 30, Sweden.
Conflict of interest
None declared.
Funding
This work was funded by the Swedish Research Council for Environment, Agricultural Sciences and Spatial Planning (Formas; 2015-1458) and the Swedish Research Council (VR; 2015-03338).
Authors’ contributions
M.W., J.U. and G.W. planned and designed the study, B.N. assisted as expert on tree traits and choice, M.W., L.T., G.W. and M.X.A. performed the experiments, M.W., J.U., M.X.A., L.T. and G.W. analyzed and interpreted the data, M.W. and J.U. wrote the manuscript and M.W., J.U., M.X.A., L.T., B.N. and G.W. revised the manuscript.
References
- Aliyu B, Agnew B, Douglas S (2010) Croton megalocarpus (Musine) seeds as a potential source of bio-diesel. Biomass Bioenergy 34:1495–1499. [Google Scholar]
- Atkin OK, Bloomfield KJ, Reich PB et al. (2015) Global variability in leaf respiration in relation to climate, plant functional types and leaf traits. New Phytol 206:614–636. [DOI] [PubMed] [Google Scholar]
- Balogi Z, Török Z, Balogh G, Jósvay K, Shigapova N, Vierling E, Vígh L, Horváth I (2005) “Heat shock lipid” in cyanobacteria during heat/light-acclimation. Arch Biochem Biophys 436:346–354. [DOI] [PubMed] [Google Scholar]
- Barlow J, França F, Gardner TA et al. (2018) The future of hyperdiverse tropical ecosystems. Nature 559:517–526. [DOI] [PubMed] [Google Scholar]
- Benomar L, Moutaoufik MT, Elferjani R, Isabel N, DesRochers A, el Guellab A, Khlifa R, Idrissi Hassania LA (2019) Thermal acclimation of photosynthetic activity and RuBisCO content in two hybrid poplar clones. PLoS One 14:1–19. [DOI] [PMC free article] [PubMed] [Google Scholar]
- Bernacchi CJ, Singsaas EL, Pimentel C, Portis AR, Long SP (2001) Improved temperature response functions for models of Rubisco-limited photosynthesis. Plant Cell Environ 24:253–259. [Google Scholar]
- Bloesch U, Troupin G, Derungs N (2009) Les plantes ligneuses du Rwanda-Flore, ecologie et usages. Shaker Verlag, Aachen, Germany. [Google Scholar]
- Campbell C, Atkinson L, Zaragoza-Castells J, Lundmark M, Atkin O, Hurry V (2007) Acclimation of photosynthesis and respiration is asynchronous in response to changes in temperature regardless of plant functional group. New Phytol 176:375–389. [DOI] [PubMed] [Google Scholar]
- Cheesman AW, Winter K (2013a) Elevated night-time temperatures increase growth in seedlings of two tropical pioneer tree species. New Phytol 197:1185–1192. [DOI] [PubMed] [Google Scholar]
- Cheesman AW, Winter K (2013b) Growth response and acclimation of CO2 exchange characteristics to elevated temperatures in tropical tree seedlings. J Exp Bot 64:3817–3828. [DOI] [PMC free article] [PubMed] [Google Scholar]
- Chen J, Burke JJ, Xin Z, Xu C, Velten J (2006) Characterization of the Arabidopsis thermosensitive mutant atts02 reveals an important role for galactolipids in thermotolerance. Plant Cell Environ 29:1437–1448. [DOI] [PubMed] [Google Scholar]
- Clark DA (2004) Sources or sinks? The responses of tropical forests to current and future climate and atmospheric composition. Philos Trans R Soc Lond B Biol Sci 359:477–491. [DOI] [PMC free article] [PubMed] [Google Scholar]
- Crous KY, Drake JE, Aspinwall MJ, Sharwood RE, Tjoelker MG, Ghannoum O (2018) Photosynthetic capacity and leaf nitrogen decline along a controlled climate gradient in provenances of two widely distributed Eucalyptus species. Glob Chang Biol 24:4626–4644. [DOI] [PubMed] [Google Scholar]
- Cunningham SC, Read J (2002) Comparison of temperate and tropical rainforest tree species: photosynthetic responses to growth temperature. Oecologia 133:112–119. [DOI] [PubMed] [Google Scholar]
- Dangarembizi R, Erlwanger KH, Moyo D, Chivandi E (2013) Phytochemistry, pharmacology and ethnomedicinal uses of Ficus thonningii (Blume Moraceae): a review. AJTCAM/Afr Netw Ethnomed 10:203–212. [DOI] [PMC free article] [PubMed] [Google Scholar]
- Dillaway DN, Kruger EL (2010) Thermal acclimation of photosynthesis: a comparison of boreal and temperate tree species along a latitudinal transect. Plant Cell Environ 33:888–899. [DOI] [PubMed] [Google Scholar]
- de Kauwe MG, Lin YS, Wright IJ et al. (2015) A test of the ‘one-point method’ for estimating maximum carboxylation capacity from field-measured, light-saturated photosynthesis. New Phytol 210:1130–1144. [DOI] [PubMed] [Google Scholar]
- Doughty CE (2011) An in situ leaf and branch warming experiment in the Amazon. Biotropica 43:658–665. [Google Scholar]
- Drake JE, Aspinwall MJ, Pfautsch S et al. (2015) The capacity to cope with climate warming declines from temperate to tropical latitudes in two widely distributed Eucalyptus species. Glob Chang Biol 21:459–472. [DOI] [PubMed] [Google Scholar]
- Duque A, Stevenson PR, Feeley KJ (2015) Thermophilization of adult and juvenile tree communities in the northern tropical Andes. Proc Natl Acad Sci USA 112:10744–10749. [DOI] [PMC free article] [PubMed] [Google Scholar]
- Dusenge ME, Way DA (2017) Warming puts the squeeze on photosynthesis - lessons from tropical trees. J Exp Bot 68:2073–2077. [Google Scholar]
- Dusenge ME, Duarte AG, Way DA (2019) Plant carbon metabolism and climate change: elevated CO2 and temperature impacts on photosynthesis, photorespiration and respiration. New Phytol 221:32–49. [DOI] [PubMed] [Google Scholar]
- Dusenge ME, Wittemann M, Mujawamariya M et al. (2021) Limited thermal acclimation of photosynthesis in tropical montane tree species. Glob Chang Biol 27:4860–4878. [DOI] [PubMed] [Google Scholar]
- Esquivel-Muelbert A, Baker TR, Dexter KG et al. (2019) Compositional response of Amazon forests to climate change. Glob Chang Biol 25:39–56. [DOI] [PMC free article] [PubMed] [Google Scholar]
- Fadrique B, Báez S, Duque Á et al. (2018) Widespread but heterogeneous responses of Andean forests to climate change. Nature 564:207–212. [DOI] [PubMed] [Google Scholar]
- Farquhar GD, von Caemmerer S, Berry JA (1980) A biochemical model of photosynthetic CO2 assimilation in leaves of C3 species. Planta 149:78–90. [DOI] [PubMed] [Google Scholar]
- Feeley KJ, Kenneth J, Davies SJ, Perez R, Hubbell SP, Foster RB (2011) Directional changes in the species composition of a tropical forest. Ecology 92:871–882. [DOI] [PubMed] [Google Scholar]
- Feeley KJ, Rehm EM, Machovina B (2012) The responses of tropical forest species to global climate change: Acclimate, adapt, migrate, or go extinct? Front Biogeogr 4:69–84. [Google Scholar]
- Feeley KJ, Bravo-Avila C, Fadrique B, Perez TM, Zuleta D (2020) Climate-driven changes in the composition of New World plant communities. Nat Clim Chang 10:965–970. [Google Scholar]
- Ferrar PJ, Slatyer RO, Vranjic JA (1989) Photosynthetic temperature acclimation in Eucalyptus species from diverse habitats, and a comparison with Nerium oleander. Aust J Plant Physiol 16:199–217. [Google Scholar]
- Fick SE, Hijmans RJ (2017) WorldClim 2: new 1‐km spatial resolution climate surfaces for global land areas. Int J Climatol 37:4302–4315. [Google Scholar]
- Fischer E, Killmann D (2008) Illustrated field guide to the plants of Nyungwe national park. Koblenz Geographical Colloquia, Koblenz. [Google Scholar]
- González-Cruz J, Pastenes C (2012) Water-stress-induced thermotolerance of photosynthesis in bean (Phaseolus vulgaris L.) plants: the possible involvement of lipid composition and xanthophyll cycle pigments. Environ Exp Bot 77:127–140. [Google Scholar]
- Gounaris K, Sundby C, Andersson B, Barber J (1983) Lateral heterogeneity of polar lipids in the thylakoid membranes of spinach chloroplasts. FEBS Lett 156:170–174. [Google Scholar]
- Graham CH, Moermond TC, Kristensen KA, Mvukiyumwami J (1995) Seed Dispersal Effectiveness by Two Bulbuls on Maesa lanceolata, an African Montane Forest Tree. Biotropica 27:479–486. [Google Scholar]
- Gunderson CA, Norby RJ, Wullschleger SD (2000) Acclimation of photosynthesis and respiration to simulated climatic warming in northern and southern populations of Acer saccharum: laboratory and field evidence. Tree Physiol 20:87–96. [DOI] [PubMed] [Google Scholar]
- Hubau W, Lewis SL, Phillips OL et al. (2020) Asynchronous carbon sink saturation in African and Amazonian tropical forests. Nature 579:80–87. [DOI] [PMC free article] [PubMed] [Google Scholar]
- Janzen DH (1967) Why mountain passes are higher in the tropics. Am Nat 101:233–249. [Google Scholar]
- Kattge J, Knorr W (2007) Temperature acclimation in a biochemical model of photosynthesis: a reanalysis of data from 36 species. Plant Cell Environ 30:1176–1190. [DOI] [PubMed] [Google Scholar]
- Kirika JM, Bleher B, Böhning-Gaese K, Chira R, Farwig N (2008) Fragmentation and local disturbance of forests reduce frugivore diversity and fruit removal in Ficus thonningii trees. Basic Appl Ecol 9:663–672. [Google Scholar]
- Kositsup B, Montpied P, Kasemsap P, Thaler P, Améglio T, Dreyer E (2009) Photosynthetic capacity and temperature responses of photosynthesis of rubber trees (Hevea brasiliensis Müll. Arg.) acclimate to changes in ambient temperatures. Trees 23:357–365. [Google Scholar]
- Kourtchenko O, Andersson MX, Hamberg M, Brunnström Å, Göbel C, McPhail KL, Gerwick WH, Feussner I, Ellerström M (2007) Oxo-phytodienoic acid-containing galactolipids in Arabidopsis: jasmonate signaling dependence. Plant Physiol 145:1658–1669. [DOI] [PMC free article] [PubMed] [Google Scholar]
- Lacroix D, Prado S, Deville A, Krief S, Dumontet V, Kasenene J, Mouray E, Bories C, Bodo B (2009) Hydroperoxy-cycloartane triterpenoids from the leaves of Markhamia lutea, a plant ingested by wild chimpanzees. Phytochemistry 70:1239–1245. [DOI] [PubMed] [Google Scholar]
- Lewis SL, Malhi Y, Phillips OL (2004) Fingerprinting the impacts of global change on tropical forests. Philos Trans R Soc Lond B Biol Sci 359:437–462. [DOI] [PMC free article] [PubMed] [Google Scholar]
- Li Y, Xu Y, Li Y et al. (2020a) Warming effects on morphological and physiological performances of four subtropical montane tree species. Ann For Sci 77:2. [Google Scholar]
- Li Y, Song X, Li S, Salter WT, Barbour MM, Kasenene J (2020b) The role of leaf water potential in the temperature response of mesophyll conductance. New Phytol 225:1193–1205. [DOI] [PubMed] [Google Scholar]
- Lin YS, Medlyn BE, Ellsworth DS (2012) Temperature responses of leaf net photosynthesis: the role of component processes. Tree Physiol 32:219–231. [DOI] [PubMed] [Google Scholar]
- Locke AM, Sack L, Bernacchi CJ, Ort DR (2013) Soybean leaf hydraulic conductance does not acclimate to growth at elevated [CO2] or temperature in growth chambers or in the field. Ann Bot 112:911–918. [DOI] [PMC free article] [PubMed] [Google Scholar]
- Los DA, Murata N (2004) Membrane fluidity and its roles in the perception of environmental signals. Biochim Biophys Acta Biomembr 1666:142–157. [DOI] [PubMed] [Google Scholar]
- Medlyn BE, Dreyer E, Ellsworth D et al. (2002) Temperature response of parameters of a biochemically based model of photosynthesis. II. A review of experimental data. Plant Cell Environ 25:1167–1179. [Google Scholar]
- Medlyn BE, Duursma RA, Eamus D et al. (2011) Reconciling the optimal and empirical approaches to modelling stomatal conductance. Glob Chang Biol 17:2134–2144. [Google Scholar]
- Mujawamariya M, Wittemann M, Manishimwe A et al. (2020) Complete or overcompensatory thermal acclimation of leaf dark respiration in African tropical trees. New Phytol 229:2548–2561. [DOI] [PMC free article] [PubMed] [Google Scholar]
- Narayanan S, Tamura PJ, Roth MR, Prasad PVV, Welti R (2015) Wheat leaf lipids during heat stress: I. High day and night temperatures result in major lipid alterations. Plant Cell Environ 39:787–803. [DOI] [PMC free article] [PubMed] [Google Scholar]
- Niinemets Ü, Kull O, Tenhunen JD (2004) Within-canopy variation in the rate of development of photosynthetic capacity is proportional to integrated quantum flux density in temperate deciduous trees. Plant Cell Environ 27:293–313. [Google Scholar]
- Nilsson AK, Johansson ON, Fahlberg P, Steinhart F, Gustavsson MB, Ellerström M, Andersson MX (2014) Formation of oxidized phosphatidylinositol and 12-oxo-phytodienoic acid containing acylated phosphatidylglycerol during the hypersensitive response in Arabidopsis. Phytochemistry 101:65–75. [DOI] [PubMed] [Google Scholar]
- Nilsson AK, Sjöbom U, Christenson K, Hellström A (2019) Lipid profiling of suction blister fluid: comparison of lipids in interstitial fluid and plasma. Lipids Health Dis 18:1–11. [DOI] [PMC free article] [PubMed] [Google Scholar]
- Onderdonk DA, Chapman CA (2000) Coping with forest fragmentation: the primates of Kibale National Park, Uganda. Int J Primatol 21:587–611. [Google Scholar]
- Quebbeman JA, Ramirez JA (2016) Optimal allocation of leaf-level nitrogen: implications for covariation of Vcmax and Jmax and photosynthetic downregulation. Eur J Vasc Endovasc Surg 121:2464–2475. [Google Scholar]
- Raison JK, Roberts JKM, Berry JA (1982) Correlations between the thermal stability of chloroplast (thylakoid) membranes and the composition and fluidity of their polar lipids upon acclimation of the higher plant, Nerium oleander, to growth temperature. Biochim Biophys Acta 688:218–228. [Google Scholar]
- R Core Team (2021) R: A language and environment for statistical computing. R Foundation for Statistical Computing, Vienna, Austria. https://www.R-project.org/. [Google Scholar]
- Read J (1990) Some effects of acclimation temperature on net photosynthesis in some tropical and extra-tropical Australasian Nothofagus species. J Ecol 78:100–112. [Google Scholar]
- Routaboul JM, Skidmore C, Wallis JG, Browse J (2011) Arabidopsis mutants reveal that short- and long-term thermotolerance have different requirements for trienoic fatty acids. J Exp Bot 63:1435–1443. [DOI] [PMC free article] [PubMed] [Google Scholar]
- Sage RF, Kubien DS (2007) The temperature response of C3 and C4 photosynthesis. Plant Cell Environ 30:1086–1106. [DOI] [PubMed] [Google Scholar]
- Säll T, Pettersson P (1994) A model of photosynthetic acclimation as a special case of reaction norms. J Theor Biol 166:1–8. [Google Scholar]
- Saugier B, Roy J, Mooney HA (2001) Estimations of Global Terrestrial Productivity: Converging toward a Single Number? In: Roy J, Saugier B, Mooney HA (eds) Terrestrial Global Productivity. Academic Press, pp 543–557. [Google Scholar]
- Sheu BH, Lin CK (1999) Photosynthetic response of seedlings of the sub-tropical tree Schima superba with exposure to elevated carbon dioxide and temperature. Environ Exp Bot 41:57–65. [Google Scholar]
- Sindambiwe JB, Baldé AM, de Bruyne T, Pieters L, van den Heuvel H, Claeys M, van den Berghe DA, Vlietinck AJ (1996) Triterpenoid saponins from Maesa lanceolate. Phytochemistry 41:269–277. [DOI] [PubMed] [Google Scholar]
- Slot M, Kitajima K (2015) General patterns of acclimation of leaf respiration to elevated temperatures across biomes and plant types. Oecologia 177:885–900. [DOI] [PubMed] [Google Scholar]
- Slot M, Rey-Sánchez C, Gerber S, Lichstein JW, Winter K, Kitajima K (2014) Thermal acclimation of leaf respiration of tropical trees and lianas: response to experimental canopy warming, and consequences for tropical forest carbon balance. Glob Chang Biol 20:2915–2926. [DOI] [PubMed] [Google Scholar]
- Slot M, Winter K (2017a) In situ temperature response of photosynthesis of 42 tree and liana species in the canopy of two Panamanian lowland tropical forests with contrasting rainfall regimes. New Phytol 214:1103–1117. [DOI] [PubMed] [Google Scholar]
- Slot M, Winter K (2017b) Photosynthetic acclimation to warming in tropical forest tree seedlings. J Exp Bot 68:2275–2284. [DOI] [PMC free article] [PubMed] [Google Scholar]
- Slot M, Winter K (2018) High tolerance of tropical sapling growth and gas exchange to moderate warming. Funct Ecol 32:599–611. [Google Scholar]
- Smith NG, Dukes JS (2017) Short-term acclimation to warmer temperatures accelerates leaf carbon exchange processes across plant types. Glob Chang Biol 23:4840–4853. [DOI] [PubMed] [Google Scholar]
- Su K, Bremer DJ, Jeannotte R, Welti R, Yang C (2009) Membrane lipid composition and heat tolerance in cool-season turfgrasses, including a hybrid bluegrass. J Am Soc Hort Sci 134:511–520. [Google Scholar]
- Tjoelker MG, Oleksyn J, Reich PB (1999) Acclimation of respiration to temperature and CO2 in seedlings of boreal tree species in relation to plant size and relative growth rate. Glob Chang Biol 5:679–691. [Google Scholar]
- US Geological Survey . Earth explorer. https://earthexplorer.usgs.gov/ (16 February 2021, date last accessed).
- Vårhammar A, Wallin G, McLean CM, Dusenge ME, Medlyn BE, Hasper TB, Nsabimana D, Uddling J (2015) Photosynthetic temperature responses of tree species in Rwanda: evidence of pronounced negative effects of high temperature in montane rainforest climax species. New Phytol 206:1000–1012. [DOI] [PubMed] [Google Scholar]
- Wang SY, Lin HS (2006) Effect of plant growth temperature on membrane lipids in strawberry (Fragaria × ananassa Duch.). Sci Hortic 108:35–42. [Google Scholar]
- Warren CR (2007) Does growth temperature affect the temperature responses of photosynthesis and internal conductance to CO2? A test with Eucalyptus regnans. Tree Physiol 28:11–19. [DOI] [PubMed] [Google Scholar]
- Way DA, Oren R (2010) Differential responses to changes in growth temperature between trees from different functional groups and biomes: a review and synthesis of data. Tree Physiol 30:669–688. [DOI] [PubMed] [Google Scholar]
- Way DA, Sage RF (2008) Thermal acclimation of photosynthesis in black spruce [Picea mariana (Mill.) B.S.P.]. Plant Cell Environ 31:1250–1262. [DOI] [PubMed] [Google Scholar]
- Way DA, Yamori W (2014) Thermal acclimation of photosynthesis: on the importance of adjusting our definitions and accounting for thermal acclimation of respiration. Photosynth Res 119:89–100. [DOI] [PubMed] [Google Scholar]
- World Agroforestry Centre . Ficus thonningii. worldagroforestry.org/treedb2/AFTPDFS/Ficus_thonningii.PDF (16 February 2021a, date last accessed).
- World Agroforestry Centre . Croton megalocarpus. worldagroforestry.org/treedb2/AFTPDFS/Croton_megalocarpus.PDF (16 February 2021b, date last accessed).
- Yamori W, Hikosaka K, Way DA (2014) Temperature response of photosynthesis in C3, C4, and CAM plants: temperature acclimation and temperature adaptation. Photosynth Res 119:101–117. [DOI] [PubMed] [Google Scholar]
- Zhang X, Xu Y, Huang B (2018) Lipidomic reprogramming associated with drought stress priming-enhanced heat tolerance in tall fescue (Festuca arundinacea). Plant Cell Environ 42:947–958. [DOI] [PubMed] [Google Scholar]
Associated Data
This section collects any data citations, data availability statements, or supplementary materials included in this article.