Abstract
SARS-CoV-2 has caused over 100,000,000 cases and almost 2,500,000 deaths globally. Comprehensive assessment of the multifaceted antiviral Ab response is critical for diagnosis, differentiation of severity, and characterization of long-term immunity, especially as COVID-19 vaccines become available. Severe disease is associated with early, massive plasmablast responses. We developed a multiplex immunoassay from serum/plasma of acutely infected and convalescent COVID-19 patients and prepandemic and postpandemic healthy adults. We measured IgA, IgG, and/or IgM against SARS-CoV-2 nucleocapsid (N), spike domain 1 (S1), S1–receptor binding domain (RBD) and S1–N-terminal domain. For diagnosis, the combined [IgA + IgG + IgM] or IgG levels measured for N, S1, and S1-RBD yielded area under the curve values ≥0.90. Virus-specific Ig levels were higher in patients with severe/critical compared with mild/moderate infections. A strong prozone effect was observed in sera from severe/critical patients—a possible source of underestimated Ab concentrations in previous studies. Mild/moderate patients displayed a slower rise and lower peak in anti-N and anti-S1 IgG levels compared with severe/critical patients, but anti-RBD IgG and neutralization responses reached similar levels at 2–4 mo after symptom onset. Measurement of the Ab responses in sera from 18 COVID-19–vaccinated patients revealed specific responses for the S1-RBD Ag and none against the N protein. This highly sensitive, SARS-CoV-2–specific, multiplex immunoassay measures the magnitude, complexity, and kinetics of the Ab response and can distinguish serum Ab responses from natural SARS-CoV-2 infections (mild or severe) and mRNA COVID-19 vaccines.
INTRODUCTION
Since SARS-CoV-2 was identified in Wuhan, China, in December 2019, the outbreak has evolved into a global pandemic with over 100,000,000 cases and almost 2,500,000 fatalities as of February 2021. Nasopharyngeal RT-PCR is the diagnostic gold standard but varies widely (1, 2) because of timing and quality of sample acquisition. Serologic assays can fill gaps, especially for asymptomatic infections and for diagnosis later in disease course, even when RNA is undetectable (3). Although most patients experience a flu-like illness, a subset suffers severe, life-threatening disease. Antiviral and immunomodulatory therapies can decrease disease duration and improve mortality (4, 5). Bio-markers to identify at-risk patients may provide opportunities to intervene earlier and improve clinical outcomes.
SARS-CoV-2 serology
Characterization of anti–SARS-CoV-2 Ab production is essential for identifying COVID-19 immunity (6–9). However, the dynamics of the Ab response and its dependence on clinical severity are additional considerations for interpreting serological results. For example, the evolution of B cell responses to SARS-CoV-2 does not always follow the model of IgM preceding IgG. Instead, many SARS-CoV-2–infected patients demonstrated a simultaneous rise in IgM and class-switched IgG (10–12). Abs to SARS-CoV-2 spike 1 receptor binding domain (S1-RBD) showed correlation with viral neutralization (13), but other immunogenic viral proteins include S1 and S2 subunits of the spike protein, the spike 1 N-terminal domain (S1-NTD), and the nucleocapsid (N) protein (14). The spike protein mediates viral entry into the host cell through the S1 subunit, which binds ACE2 receptors on host cells, and S2, which is involved in fusion. Monoclonal neutralizing Abs have been generated against the S trimer, receptor binding domain (RBD), and N-terminal domain (15–18). However, Ab-based diagnostic assays can use Ags with neutralizing and nonneutralizing epitopes; thus, we examined anti-S1, anti–S1-RBD, anti–S1-NTD, and anti-N Abs.
Higher Ab levels in severe/critical disease
The host response to SARS-CoV-2 varies dramatically among individuals. Anti–SARS-CoV-2 Abs are detectable in patients who have recovered from infection; the magnitude and kinetics of serological responses correlate with clinical severity (3, 19–23). Reports on SARS-CoV-1 infections showed a paradoxical rise of neutralizing Abs in critically ill patients (24). Similarly, in SARS-CoV-2, the induction of virus-specific Ab responses in severe disease trend higher than in nonsevere patients 8–20 d post–symptom onset (DPSO) (10, 22). However, there was significant overlap of Ab levels between the two groups such that it could not distinguish mild from severe illness. Other studies corroborated these findings with binding and neutralizing Abs, but the numbers were small, and timing of sample collection was late in disease course (25, 26; A. S. Iyer, F. K. Jones, A. No-doushani, M. Kelly, M. Becker, D. Slater, R. Mills, E. Teng, M. Kamruzzaman, W. F. Garcia-Beltran, et al., manuscript posted on medRxiv, DOI: 10.1101/2020.07.18.20155374). In addition, previous studies may have underestimated the magnitude of Ab response in severe patients because of a well-established, yet often overlooked, phenomenon known as the prozone effect. This occurs when an excessive amount of Ab in solution inhibits the formation of cross-linked Ag–Ab complexes, creating the misleading appearance of a much lower response (27–29). This could be a source of underestimates of the differences in serum responses between severe and mild patients in previous reports (10).
In this study, we developed a sensitive anti–SARS-CoV-2 immunoassay using prepandemic controls and RT-PCR–confirmed, SARS-CoV-2–infected patients, optimized with regard to the prozone effect in severe disease. We observed higher Ab levels earlier in patients with severe/critical infections compared with those with mild/moderate disease. This unexpected difference in the speed and magnitude of humoral responses may reflect important differences in the immune response and provide early signs for patients who might benefit from targeted immunomodulatory interventions. Finally, with the Emergency Use Authorization and wide distribution of new mRNA vaccines, reliance on single Ag assays to spike or RBD will not resolve exposures to infection from vaccination; thus, a multiplex, SARS-CoV-2–specific immunoassay that contains viral proteins not present in the vaccine (such as N) will be essential. Distinguishing the serologic responses to COVID-19 vaccines from actual infections will have critical implications for diagnosis of disease in contrast to vaccine longevity.
MATERIALS AND METHODS
Patient sample collection
All blood and tissue samples were collected under the Emory University Institutional Review Board–approved protocols. Prepandemic samples were collected from healthy adults prior to the pandemic between July 2016 and February 2019. After the start of the pandemic, samples were collected from March to June 2020 from healthy adults with no known exposure to SARS-CoV-2 (Table I). Patients with RT-PCR–confirmed SARS-CoV-2 infections were enrolled from Emory University hospitals and outpatient facilities. Severity of SARS-CoV-2–infected patients was determined according to National Institutes of Health (NIH) guidelines (30) (Table I). Patients were categorized based on their overall disease course as mild/moderate or severe/critical. Samples collected in the first 30 DPSO were considered acute, and those collected after 30 DPSO were designated convalescent. All samples were processed within 4–12 h of collection and stored at −80°C for subsequent analysis. Blood samples were also collected from 18 subjects who had recently received their first or second immunizations with either the Pfizer (n = 16) (31) or Moderna (n = 2) (32) SARS-CoV-2 mRNA vaccines (Table I). Thirteen samples were obtained at days 13–28 following the primary vaccination (eleven Pfizer; two Moderna), and seven were collected days 4–8 following the second vaccination (seven Pfizer; zero Moderna).
TABLE I.
Demographics of COVID-19 patients, vaccine subjects, and controls
| Subjects | Convalescent COVID-19+ (n = 69) | Acute COVID-19+ (n = 52) | Vaccine Subjects (n = 18) | Prepandemic Healthy Adults (n = 106) | Postpandemic Healthy Adults (n = 137) |
|---|---|---|---|---|---|
| Age, y (mean ± SD) | 43 ± 15 | 52 ± 16 | 38 ± 11 | 35 ± 12 | 33 ± 12 |
| Sex, n (%) | |||||
| Males | 23 (36) | 31 (60) | 6 (33) | 28 (26) | 63 (46) |
| Females | 44 (64) | 21 (40) | 12 (67) | 78 (74) | 74 (54) |
| Race, n (%) | |||||
| White | 35 (51) | 22 (42) | 8 (44) | 35 (33) | 97 (71) |
| African American | 31 (45) | 26 (50) | 1 (6) | 52 (49) | 9 (7) |
| Asian | 2 (3) | 4 (8) | 8 (44) | 14 (13) | 20 (14) |
| DPSO, range, d (mean ± SD) | 67 ± 20 | 13 ± 6 | N/A | N/A | N/A |
| COVID-19 severity score (30), n (%) | |||||
| Mild illness | 34 (4) | 13 (25) | |||
| Moderate illness | 16 (23) | 0 (0) | N/A | N/A | N/A |
| Severe illness | 10 (15) | 3 (6) | |||
| Critical illness | 9 (13) | 36 (69) |
NIH management guidelines were updated June 22, 2020. Asymptomatic or presymptomatic infection consists of individuals who test positive for SAR-CoV-2 by viral PCR testing but have no symptoms. Mild illness consists of individuals with any of the various signs and symptoms of COVID-19 (i.e., fever, cough, sore throat, malaise, headache, and muscle pain) without shortness of breath, dyspnea, or abnormal chest imaging. Moderate illness consists of individuals who have evidence of lower respiratory disease by clinical assessment of imaging and a saturation of oxygen (SpO2) ≥94% on room air at sea level. Severe illness consists of individuals who have respiratory frequency >30 breaths/min (SpO2), <94% on room air at sea level, ratio of arterial partial pressure of oxygen to fraction of inspired oxygen (PaO2/FiO2) <300 mmHg, or lung infiltrates >50%. Critical illness consists of individuals who have respiratory failure, septic shock, and/or multiple organ dysfunction.
N/A, not applicable.
Selection of Ags
Four recombinant SARS-CoV-2 Ags were used in this study. The N protein (catalog no. Z03480; expressed in Escherichia coli), the S1 domain (aa 16–685; catalog no. Z03485; expressed in HEK293 cells) of the spike protein, and the S1-RBD (catalog no. Z03483; expressed in HEK293 cells) were purchased from GenScript. The S1-NTD (aa 16–318) was custom synthesized by GenScript. Each protein was expressed with an N-terminal His6-tag to facilitate purification, >85% pure and appeared as a predominant single band on SDS-PAGE analysis.
Carbodiimide coupling of microspheres to SARS-CoV-2 Ags.
SARS-CoV-2 proteins were coupled to MagPlex Microspheres of spectrally distinct regions (Luminex; Austin, TX). Coupling was carried out at room temperature following standard carbodiimide coupling procedures. Microspheres were washed once with deionized water and incubated for 20 min in the dark in an end-over-end rotator suspension of 0.1 M NaH2PO4 (VWR International; Radnor, PA), 5 mg/ml 1-ethyl-3-(3-dimethylaminopropyl) carbodiimide (Thermo Fisher Scientific; Waltham, MA), and 5 mg/ml N-hydroxysulfosuccinimide; Thermo Fisher Scientific). Activated microspheres were washed twice in 0.05 M MES (Boston Bioproducts, Ashland, MA) and incubated for 2 h in the dark in an end-over-end rotator, 500-μl suspension of 0.05 M MES containing 300 nmol/l Ag and 1 × 10⁶ microspheres (0.15 nmol Ag/106 microspheres). Coupled microspheres were washed four times in a blocking buffer consisting of 1% BSA (Boston Bioproducts), 1× PBS (VWR International), 0.05% sodium azide (VWR International), and 0.02% Tween 20 (VWR International). Coupled microspheres were then stored at a concentration of 106 spheres/ml at 4°C in the same blocking buffer. Concentrations of spheres were confirmed by counting on a Bio-Rad T20 Cell Counter.
Luminex immunoassays for measurement of anti–SARS-CoV-2 Abs.
Fifty microliters of coupled microsphere mix was added to each well of clear-bottom, 96-well, black polysty-rene microplates (Greiner Bio-One North America, Monroe, NC) at a concentration of 1000 microspheres per region per well. All wash steps and dilutions were accomplished using 1% BSA and 1× PBS assay buffer. Except when assay parameters were under development (Figs. 1–3), serum was assayed at 1:500 dilution and surveyed for Abs specific for the four-candidate Ags. After a 1-h incubation in the dark, on a plate shaker at 800 rpm, wells were washed five times in 100 μl of assay buffer using a BioTek 405 TS plate washer. Then, the secondary reagent, PE-conjugated Goat Anti-Human IgA, IgG, and/or IgM (SouthernBiotech; Birmingham, AL), was added at 3 μg/ml. After 30 min of incubation at 800 rpm in the dark, wells were washed three times in 100 μl of assay buffer, resuspended in 100 μl of assay buffer, and analyzed using a Luminex FLEXMAP 3D instrument (Luminex) running xPonent 4.3 software. Median fluorescent intensity (MFI) using combined or individual detection Abs (anti-IgA/anti-IgG/anti-IgM) was measured using the Luminex xPONENT software. The background value of assay buffer was subtracted from each serum sample result to obtain MFI minus background (net MFI).
FIGURE 1. Serum Ab responses distinguish convalescent, RT-PCR–confirmed, SARS-CoV-2–infected patients from controls.
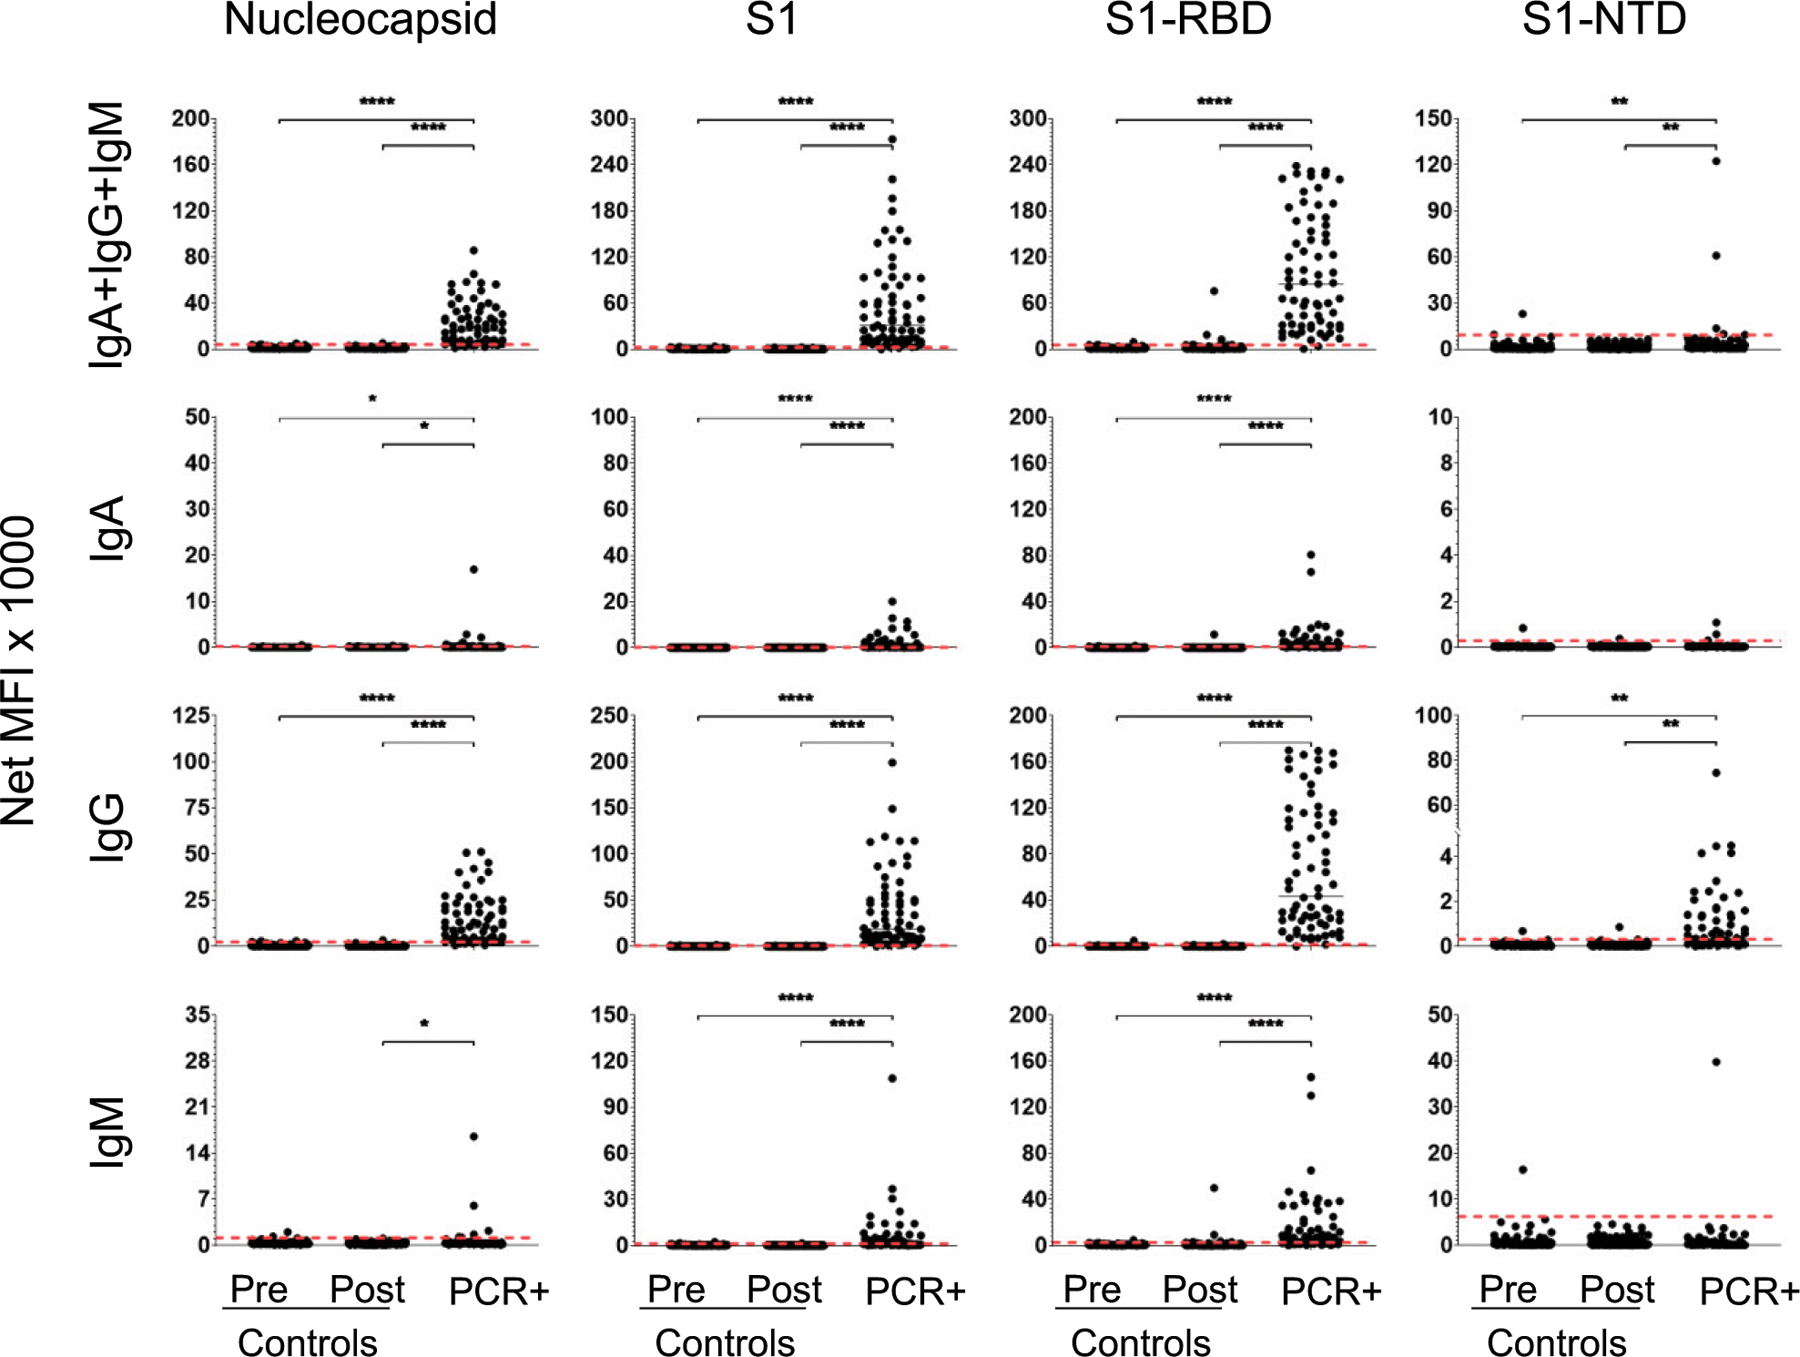
Sera were collected from 1) 106 healthy subjects prior to March 2019 (prepandemic controls); 2) 137 healthy subjects between March and June 2020 (postpandemic controls); and 3) 69 RT-PCR–confirmed convalescent patients (PCR+) at least 31 DPSO. Each serum sample was diluted 1:500 and then measured for the presence of anti–SARS-CoV-2 Abs specific for N, S1, S1-RBD, and S1-NTD. Secondary Abs were either a combination of PE-conjugated anti-IgA, anti-IgG, and anti-IgM (top row) or each individually (rows 2–4, respectively). Net MFI is the MFI with background subtracted. Dashed lines indicate the C0 determined as the mean of the prepandemic population net MFI + 3 SDs. Significant differences between populations were determined by one-way ANOVA and Tukey tests. *p < 0.05, **p < 0.01, ****p < 0.0001, p > 0.05 not shown.
FIGURE 3. Prozone effect and Ab concentrations in COVID-19 patient sera and comparison of the assay using serum and plasma.
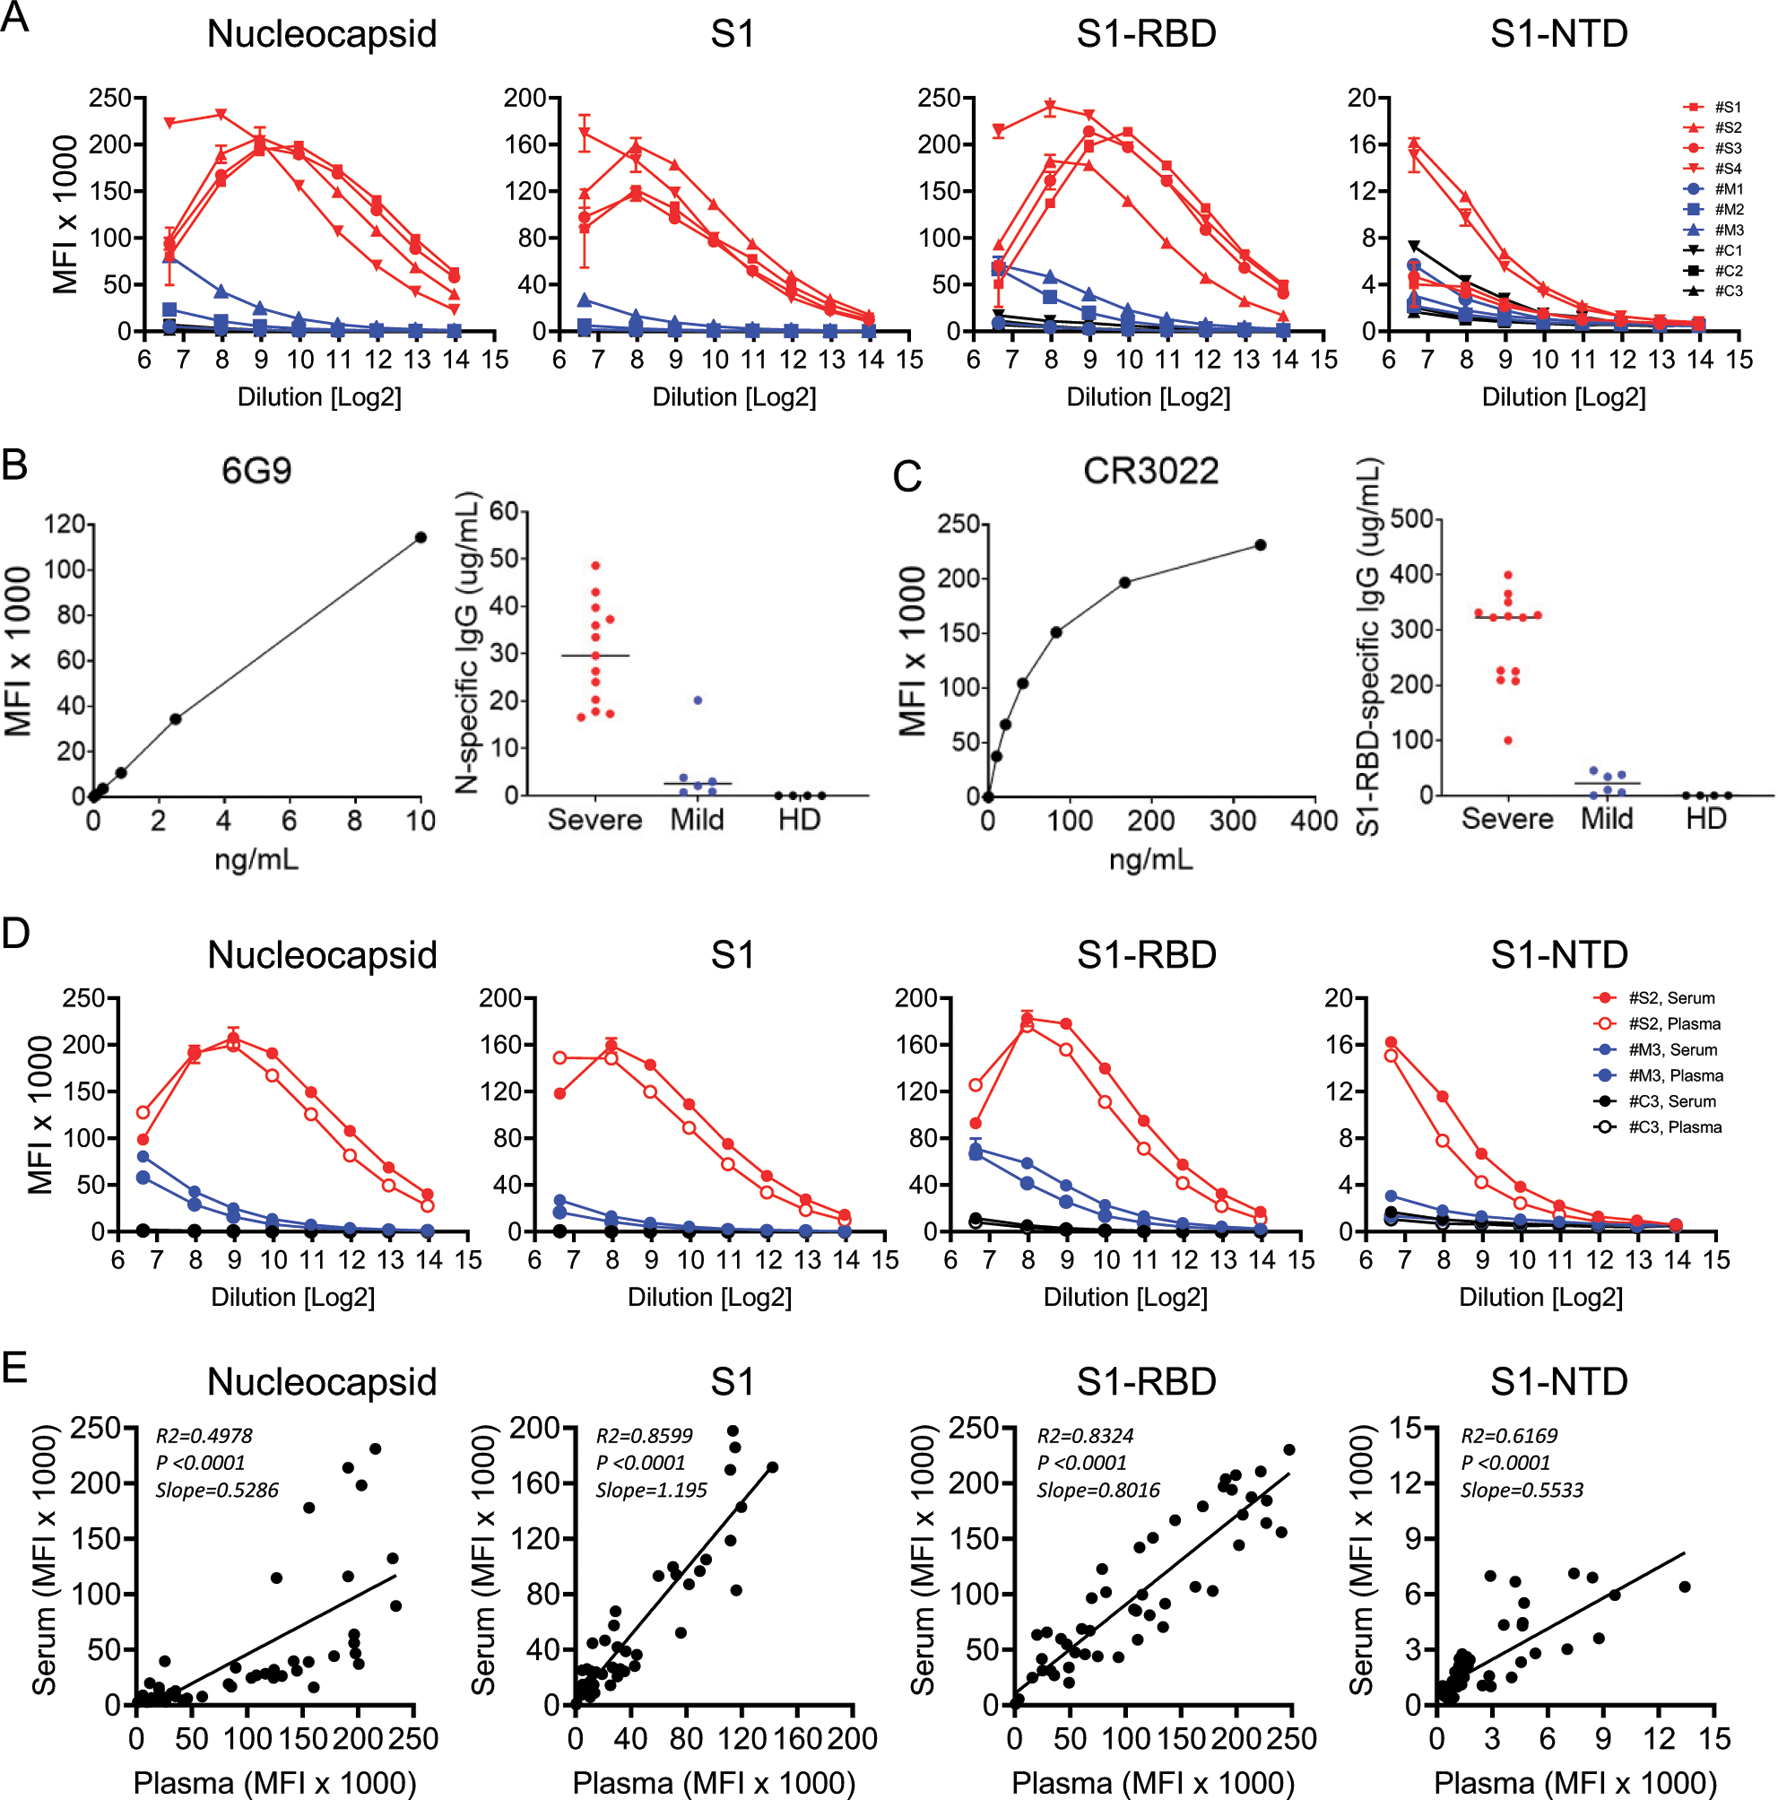
(A) Titration of the assay using sera from four severe (red), three mild (blue), and three healthy prepandemic controls (black) for [anti-IgG + anti-IgA + anti-IgM] specific for the N, S1, S1-RBD, and S1-NTD Ags. Sample dilutions range from 1:100 (26.64) to 1:16,384 (214). (B) Dose–response curve for commercial monoclonal Ab 6G9 human/mouse chimeric IgG calibrator and resulting Ab concentrations against SARS-CoV-2 N protein in sera from severe and mild COVID-19 patients and healthy donors. (C) Dose–response curve for commercial monoclonal Ab CR3022 human IgG1 calibrator and resulting Ab concentrations against SARS-CoV-2 S1-RBD in sera from severe and mild COVID-19 patients and healthy donors. (D) Comparison of plasma (open circles) and serum (filled circles) in the multiplex assay for N, S1, S1-RBD, and S1-NTD in one representative severe, mild, and healthy control. (E) Correlation of Ab titers in 50 matched serum and plasma samples measured at a 1:500 dilution.
Determination of diagnostic cutoff values
Determination of diagnostic cutoff values (C0) was based on quantitative evaluation of the prepandemic healthy controls. The C0 for each Ag/secondary combination was defined as the mean plus 3 SDs of the 106 prepandemic samples.
Surrogate virus neutralization test and Ab concentrations
Circulating Abs that block the interaction between ACE2 receptor and SARS-CoV-2 S1-RBD were measured using a recently described surrogate virus neutralization test (sVNT) (33), following manufacturer’s recommendations. Briefly, plasma or serum samples were diluted with sample dilution buffer, followed by incubation with HRP-conjugated S1-RBD; the mixtures were then transferred to 96-well plates coated with immobilized, recombinant ACE2 receptor. Following washing and tetramethylbenzidine development, the OD values at 450 nm were measured. The level of inhibition (i.e., the reduction of binding of HRP-conjugated S1-RBD to the immobilized ACE2 receptor) was calculated as follows: % inhibition = [1 − (OD sample/OD negative controls)] × 100. Surrogate IC50 (sIC50) values are the dilutions of sample that yielded 50% reductions in the sVNT assay. Monoclonal Abs CR3022 [human IgG1 anti–S1-RBD (34); InvivoGen] and 6G9 (human/mouse chimeric IgG anti-N; Amsbio) were used as calibrators for SARS-CoV-2 Ab concentrations.
Data analysis
ANOVA receiver-operating characteristic (ROC) curves were generated; area under the curve (AUC) values were calculated. Comparisons among and between groups were made using one-sided ANOVA or two-sided t tests using GraphPad Prism.
RESULTS
Acute and convalescent SARS-CoV-2–infected patients
A total of 366 adults were enrolled for this study: 110 RT-PCR–confirmed patients, SARS-CoV-2–infected patients, 238 healthy adult controls, and 18 vaccinated adults (Table I). The prepandemic control group consisted of 106 adults whose samples were collected between July 2016 and February 2019. The postpandemic control group, who had no known exposure to SARS-CoV-2, consisted of 137 adults whose blood samples were collected between March and June 2020. Five subjects were in both the pre- and postpandemic control groups.
We enrolled 69 SARS-CoV-2–infected patients after recovery from illness and at least 31 DPSO. This convalescent population provided serum samples used for development and validation of the immunoassay (Figs. 1, 2). A total of 20 patients had severe/critical disease (11 severe and 9 critical), and 49 suffered mild/moderate infections (35 mild and 14 moderate), as defined by the NIH criteria (30).
FIGURE 2. ROC curves compare diagnostic potential of each SARS-CoV-2 Ag and isotype combination.
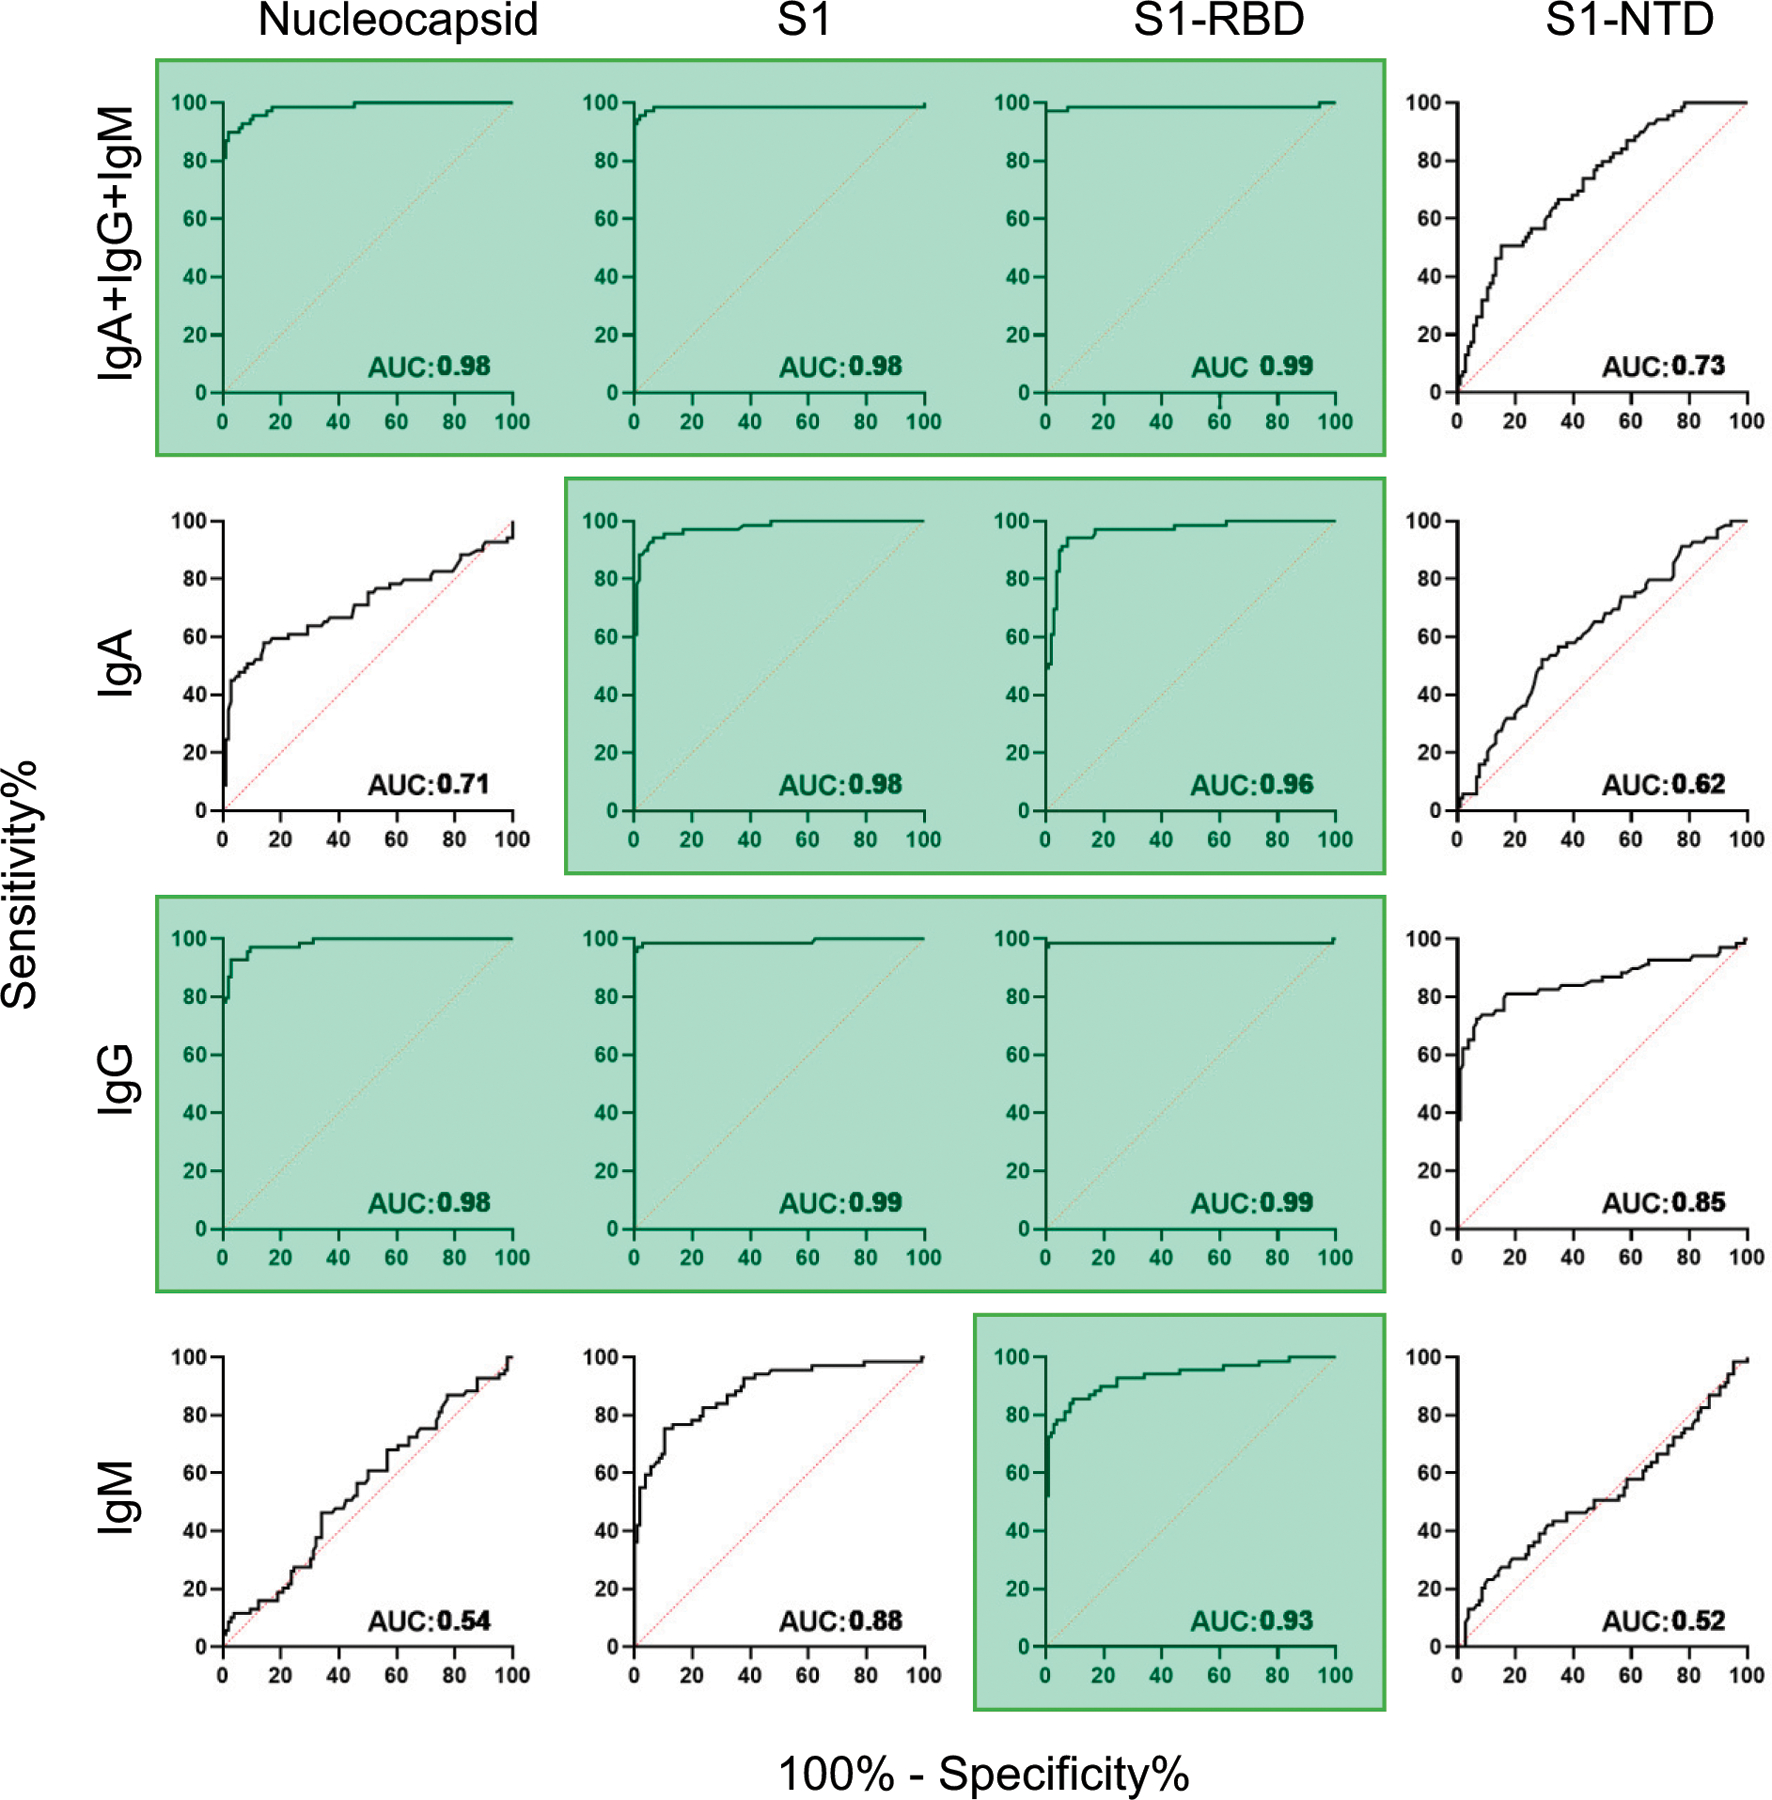
The 69 RT-PCR–confirmed convalescent patients were compared against the 106 prepandemic healthy control subjects (from Fig. 1). Diagonal dashed red lines represent the predicted behavior when the test has no diagnostic value. The AUC measurement provides an index of diagnostic potential. AUC near 0.5 suggest no diagnostic value, and AUC near 1.0 indicate strong diagnostic potential. Ag/isotype combinations that yielded AUC values >0.90 are highlighted in green.
We enrolled 52 SARS-CoV-2–infected patients during their acute infections (<31 DPSO). Eleven patients were in both the acute and convalescent populations. There were 40 patients classified as severe/critical (4 severe and 36 critical) and 12 as mild/moderate (12 mild and 0 moderate).
SARS-CoV-2 multiplex immunoassay
Using sera from 69 convalescent patients, we developed a SARS-CoV-2 multiplex immunoassay to detect the combined [IgA + IgG + IgM] or individual IgA, IgG, or IgM responses specific for four viral Ags N, S1, S1-RBD, and S1-NTD (Fig. 1). C0 were set at the mean plus 3 SDs for each Ag/secondary Ab combination using the prepandemic control population (n = 106; Fig. 1). ROC curves, for which the AUC provides an estimate of diagnostic potential, are presented in Fig. 2.
For the combined-isotype [IgA + IgG + IgM] detection, responses to three of the candidate Ags, N, S1, and S1-RBD had significant diagnostic potential (AUC ≥ 0.98); the response to S1-NTD was relatively poor (AUC = 0.73) (Fig. 2). Overall, SARS-CoV-2–specific IgM Abs were poor measures during convalescent infection; AUC values were low for IgM S1-NTD (AUC = 0.52) and N (AUC = 0.54), although IgM levels for S1 (AUC = 0.88) and S1-RBD (AUC = 0.93) were potentially useful. IgA Abs were fairly strong predictors of convalescent infection, with AUC values >0.95 for S1 and S1-RBD. However, IgG responses were most reflective of prior infection for each of the three Ags N, S1, and S1-RBD (AUC ≥ 0.98); anti–S1-NTD IgG was lower (AUC = 0.85). In the convalescent population, IgG responses against the N, S1 or the S1-RBD Ags were specific and sensitive for identifying patients who had experienced SARS-CoV-2 infections.
Prozone effect in patients with severe disease
To assess sample limitations in the assay, we titrated ten serum samples: four from patients with severe/critical disease, three from patients with mild/moderate disease, and three from prepandemic controls. We observed the expected log-linear dose–response curves in the mild/moderate samples, but we detected bell-shaped binding curves in the severe/critical groups, indicative of the prozone effect in the Ag/Ab interactions for N, S1, and S1-RBD (Fig. 3A). Subsequent analyses were performed with samples diluted 1:500 to maximize the measurement of low-responding mild/moderate patients while minimizing the potential impact of the prozone effect in severe/critical patients.
Ab concentrations in plasma of SARS-CoV-2–infected patients
We used our multiantigen assay to assess the relative ranges of plasma N and S1-RBD binding quantities (or binding activities) in terms of equivalence to the concentration of control monoclonal IgGs using monoclonal Abs specific for N (6G9; Amsbio) and S1 (CR3022; InvivoGen), respectively. In our four-Ag assay, we saw that both 6G9 and CR3022 exhibited specificity and sensitivity for N and S1-RBD, respectively (i.e., sensitivity in the range of nanograms per milliliter) (Fig. 3B, 3C). For N-specific binding in early mild and severe plasmas, we measured concentrations ranging from 0.7 to 20 and 17 to 49 μg/ml, respectively; healthy control (background) samples all had no detectable anti-N IgG (Fig. 3B). Concentrations of S1-RBD–specific Abs ranged between 0 and 45 and 100 and 399 μg/ml in mild and severe plasmas, respectively, among the early samples (i.e., within 30 DPSO); the values in healthy control samples were all undetectable (Fig. 3C).
Serum and plasma samples yield similar results
Nearly identical binding curves from a small set of paired serum and plasma samples were observed, including the prozone effect (Fig. 3D). Paired serum and plasma samples from 50 subjects yielded similar MFI values with particularly high correlations (R2 > 0.83) for S1 and S1-RBD Ags (Fig. 3E). Measurement of Ab levels at a 1:500 dilution resulted in comparable values for serum and plasma samples from severe/critical and mild/moderate patients.
Elevated levels of anti–SARS-CoV-2 Abs in sera from convalescent patients with severe/critical infections compared with those with mild/moderate disease
We observed a correlation between disease severity and the magnitude of the Ab response when the convalescent COVID-19 patients were divided into mild/moderate (n = 49) and severe/critical (n = 20) cohorts (Fig. 4). The combined-isotype response and IgG alone against S1 and S1-RBD resolved the two populations significantly (AUC ≥ 0.89; Supplemental Fig. 1). The IgA and IgM responses to the viral Ags were less discriminating of the two groups (AUC ≤ 0.81). N and S1-NTD were not useful Ags for separating the severe/critical from the mild/moderate groups (AUC ≤ 0.85), except for S1-NTD IgG (AUC = 0.93). Elevated Ab levels in convalescent severe/critical patients suggested that this striking difference may be evident earlier during infection.
FIGURE 4. Convalescent patients who had suffered severe/critical infections have higher anti–SARS-CoV-2 Ab levels than patients who had suffered mild/moderate infections.
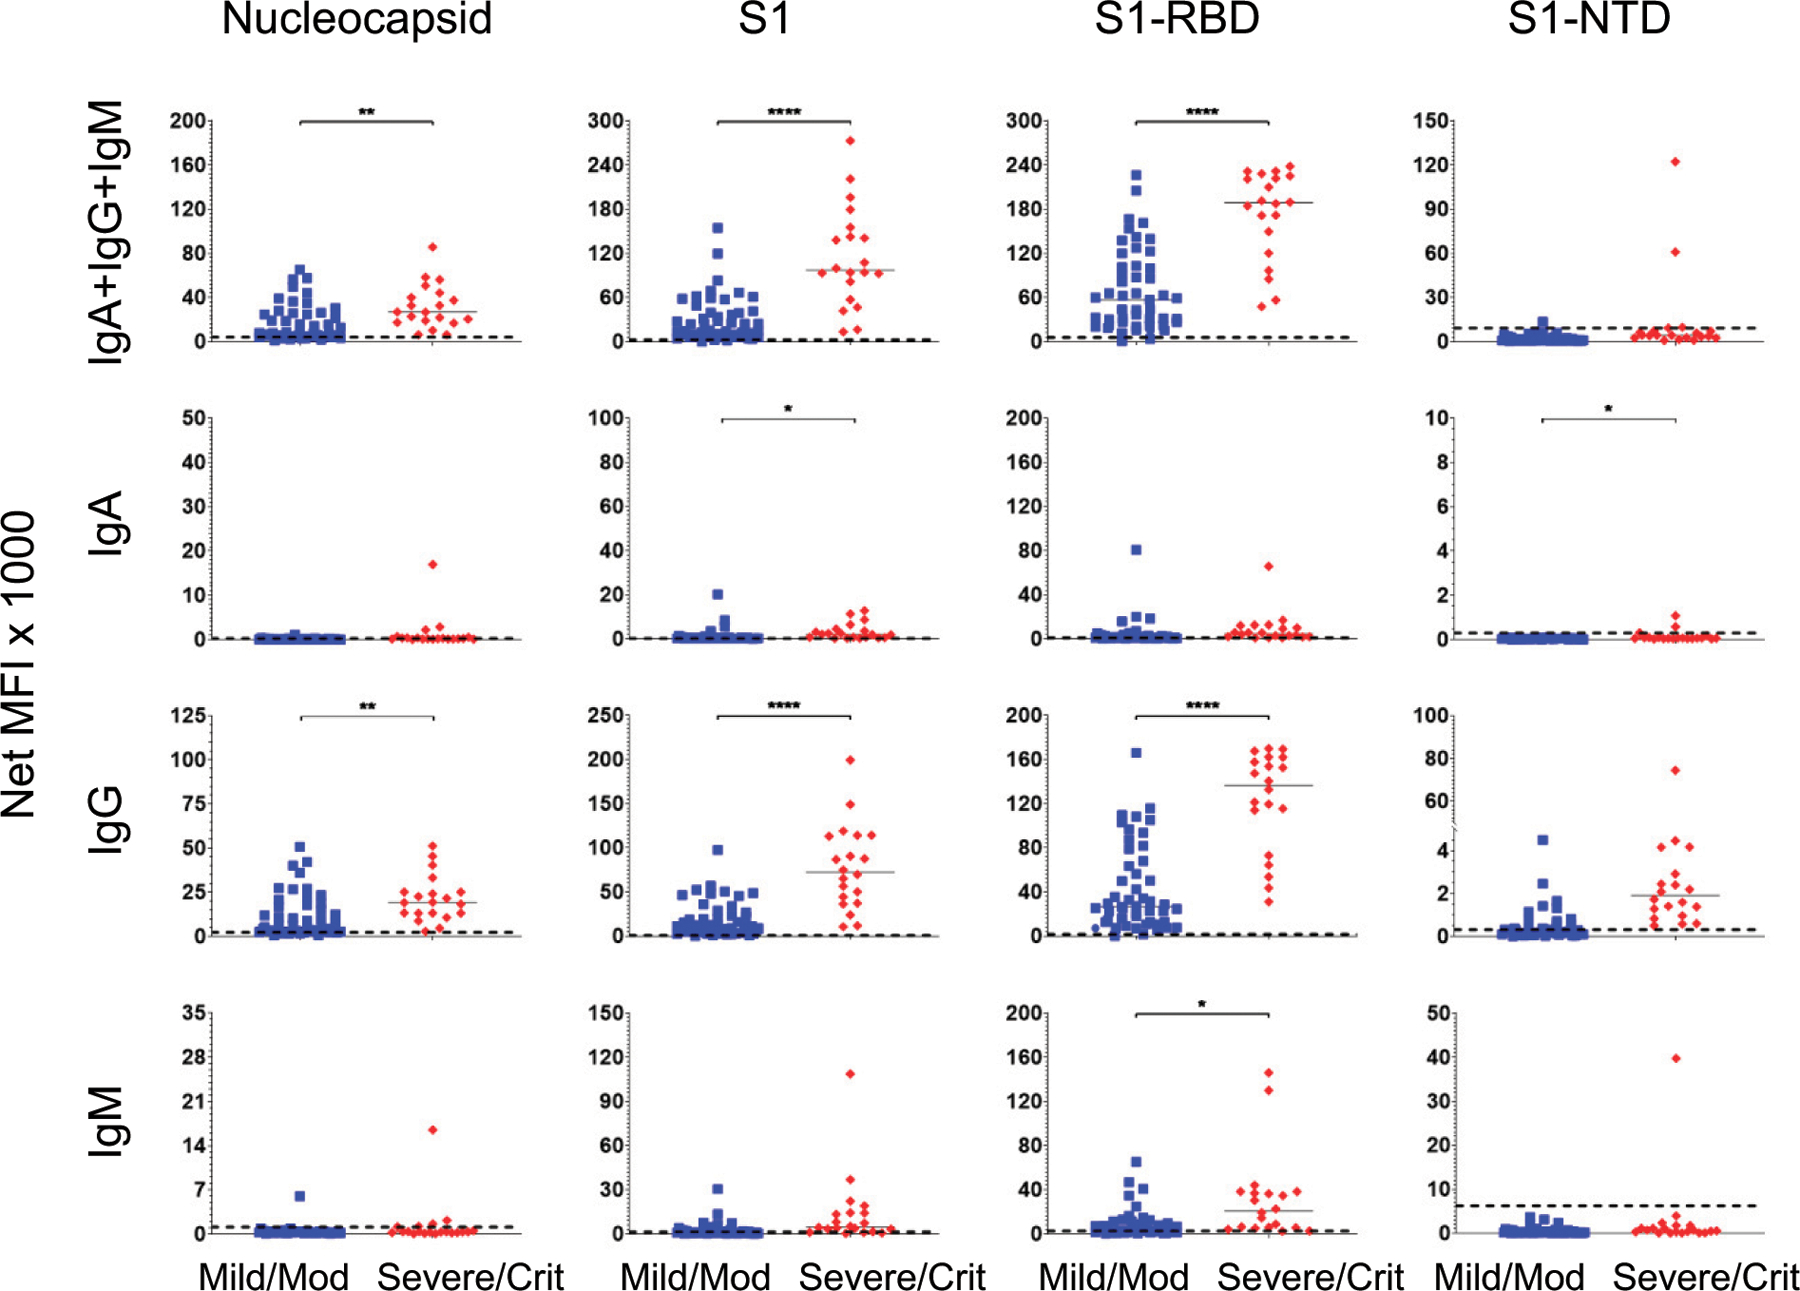
The serum responses of the 69 convalescent SARS-CoV-2–infected patients in Fig. 1 were assorted according to the severity of their infections: mild/moderate (n = 49; blue squares) and severe/critical (n = 20; red diamonds). Median values for each group are presented as horizonal bars. Dashed lines indicate the C0 determined by the prepandemic control population (from Fig. 1). Significance was determined by a two-tailed t test. *p < 0.05, **p < 0.01, ****p < 0.0001, p > 0.05 not shown.
Elevated serum Ab levels early in infection of severe/critical patients
Among the 110 infected patients, sera were collected from 50 patients within 6–30 DPSO (40 severe/critical and 10 mild/moderate infections; median draw: 12 DPSO). As in the convalescent population, S1 and S1-RBD Ags yielded the greatest diagnostic potential (AUC ≥ 0.94) in combined or individual isotypes (Supplemental Fig. 2). In contrast to the convalescent serum samples, measurement of IgA, IgG, or the combined isotypes against N exhibited potential utility (AUC ≥ 0.90). Furthermore, in acute illness, IgA specific to N, S1, and S1-RBD as well as IgM to S1 and S1-RBD yielded significantly better AUC values than they did in the convalescent patient population (Fig. 2). Thus, IgA, IgM, or IgG could potentially be used for detection of early infection.
Separating the SARS-CoV-2–infected patients by disease severity within the first 30 DPSO reveals striking differences between the mild/moderate and severe/critical populations (Fig. 5). As in the convalescent population, the strongest predictors of severe/critical infections were the combined isotypes and IgG responses to the S1 and S1-RBD (AUC = 0.96; Supplemental Fig. 3). However, in the interval 6–30 DPSO, anti-S1, anti–S1-RBD, and anti-N IgG or the combined isotypes showed comparably high AUC values, as did anti–S1-NTD IgG (Fig. 5; Supplemental Fig. 3). IgG and IgA, but not IgM, predominated in the patients with early severe/critical disease, suggesting that early class-switched responses are evident in severe/critical infections.
FIGURE 5. Higher SARS-CoV-2 Ab levels in severe/critical compared with mild/moderate infections during acute illness (≤30 DPSO).
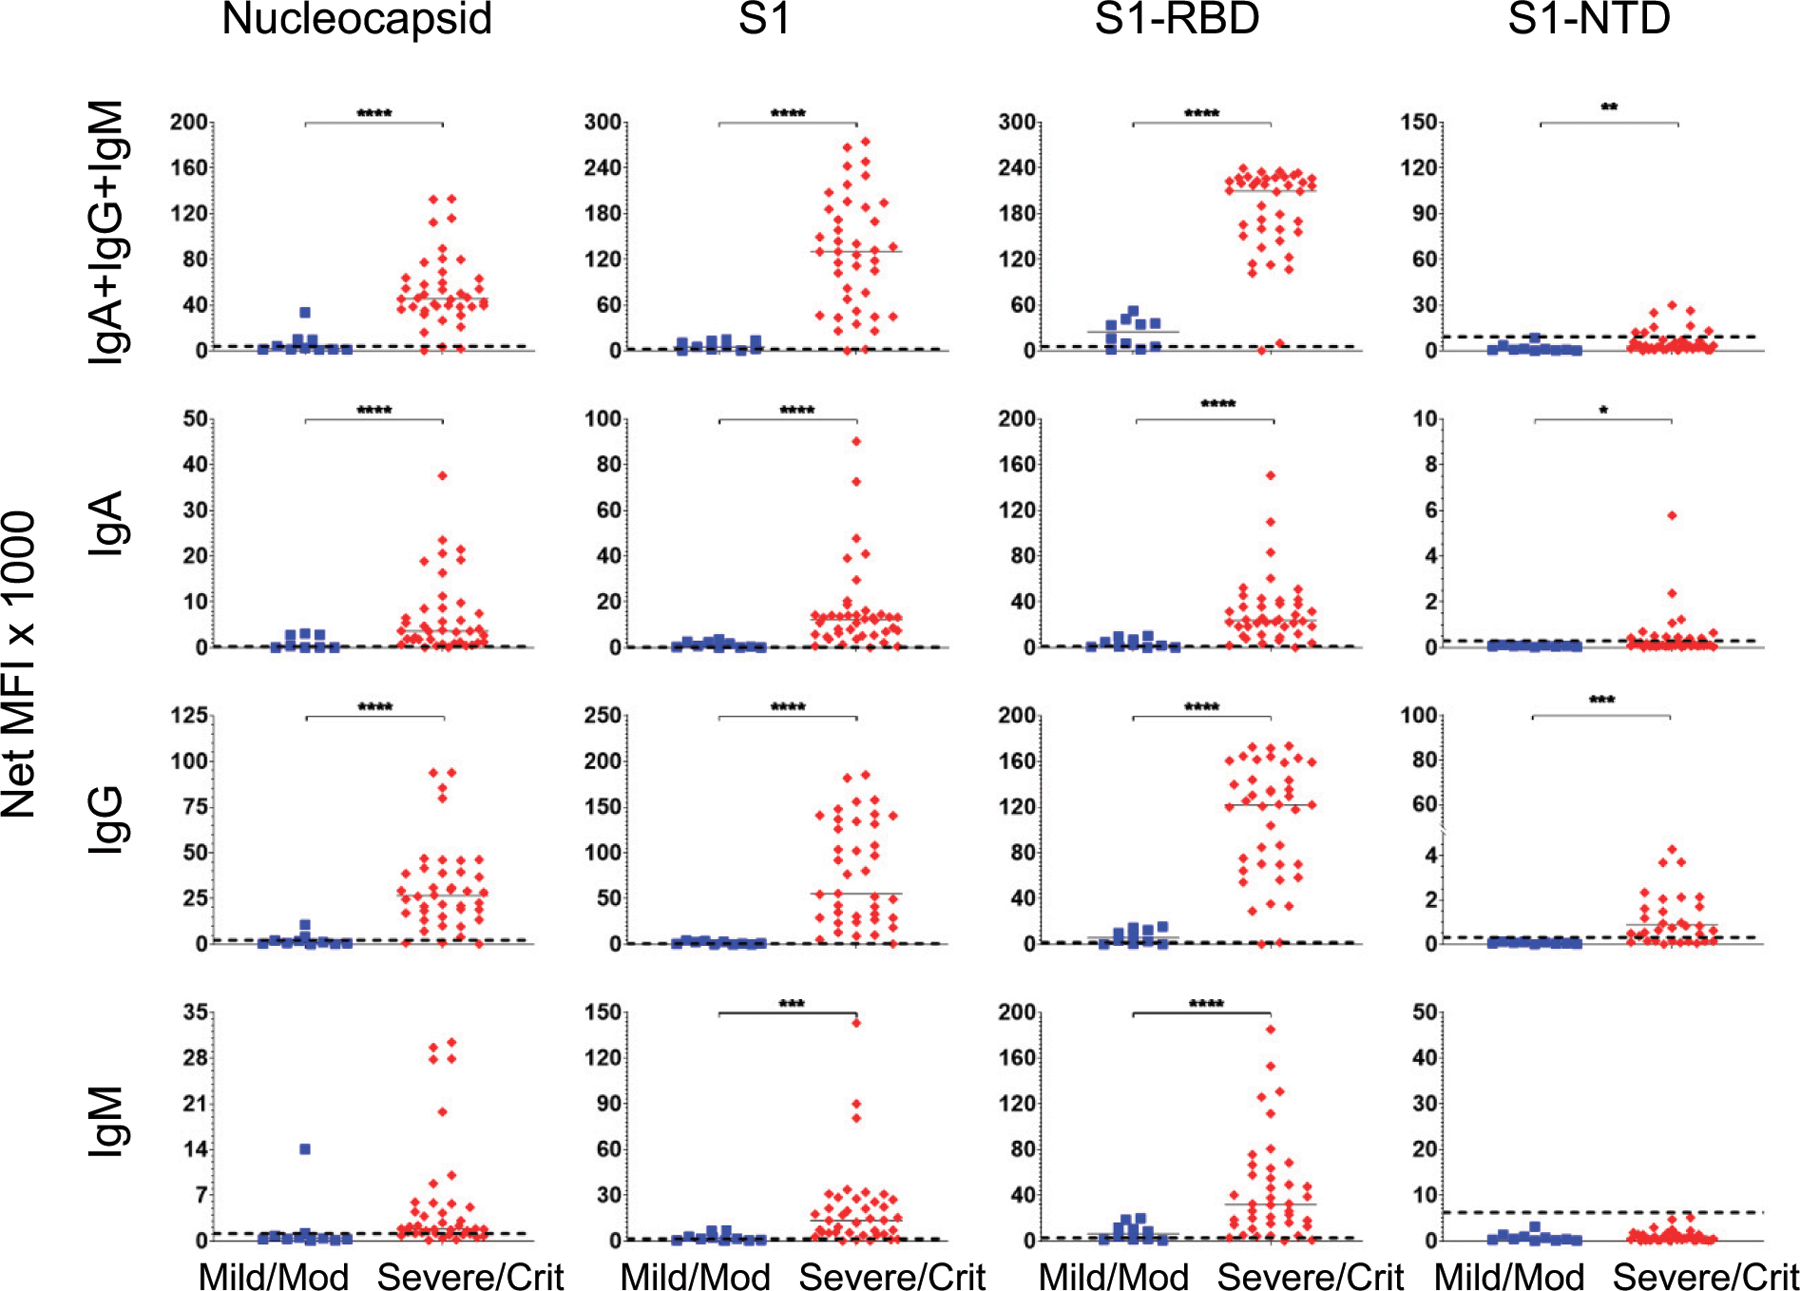
Serum Ab levels were compared in 40 severe/critical patients (red diamonds) and 10 mild/moderate patients (blue squares) using samples drawn 6–30 DPSO. Median values for each group are presented as horizonal bars. Dashed lines indicate the C0 determined by the prepandemic control population (from Fig. 1). Significance was determined by a two-tailed t test. *p < 0.05, **p < 0.01, ***p < 0.001, ****p < 0.0001, p > 0.05 not shown.
Kinetics of anti–SARS-CoV-2 Abs in severe/critical and mild/moderate groups
To determine the kinetics, magnitude, and durability of serum Ab responses, we analyzed sera from 165 samples that included 55 severe/critical and 55 mild/moderate patients ranging from 2 to 150 DPSO (Fig. 6). There was an early significant increase in Ab responses in the severe/critical groups for nearly all isotypes specific for N, S1, S1-RBD, and S1-NTD. The only exceptions were combined isotype and IgM for S1-NTD (Supplemental Table I). At later time points >90 d, the Ab responses were similar between the two groups; none were significantly different except for S1-NTD–combined isotype and IgG. These results suggest that for the severe/critical cohort, anti–SARS-CoV-2 Abs rise rapidly, whereas in the mild/moderate group, Abs rises slower. In summary, disease severity can affect magnitude, isotype, specificity, and, potentially, durability of Ab responses.
FIGURE 6. Comparison of longitudinal Ab responses in severe/critical and mild/moderate SARS-CoV-2 patients over 150 d.
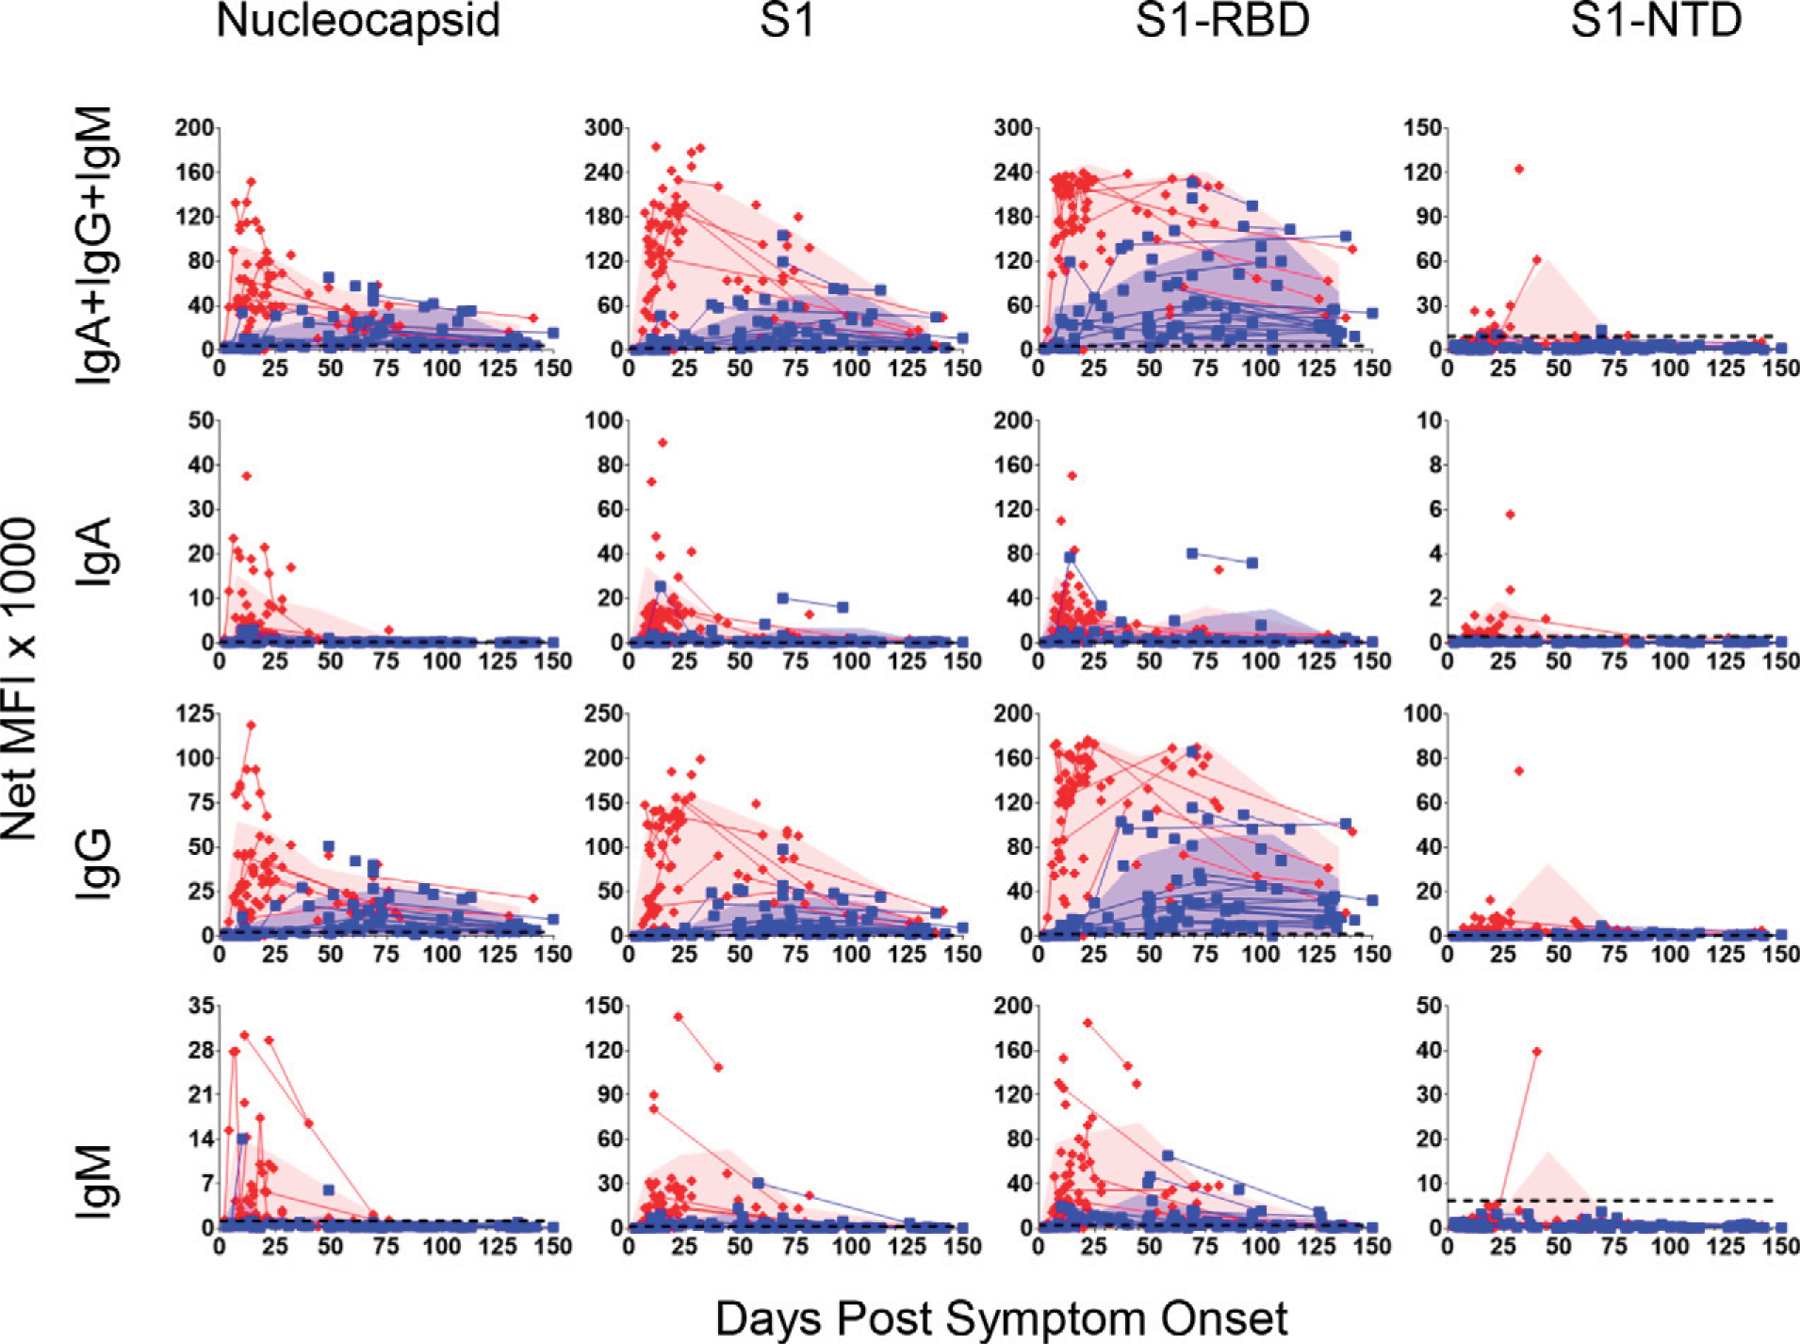
Serum samples were collected from patients with mild/moderate (83 samples from 55 patients; blue squares) or severe/critical (82 samples from 55 patients; red diamonds) SARS-CoV-2 infections from 2–150 DPSO. Lines connect multiple samples drawn from the same patient. Shaded blue and red areas represent the mean plus SDs of mild/moderate or severe/critical patient groups, respectively, during 0–15, 16–30, 31–60, 61–90, 91–120, and 121–150 DPSO and plotted at the midpoint of each time interval. Number of samples used at each time interval: mild/moderate, n = 12, 6, 20, 21, 11, and 13; and severe/critical, n = 34, 23, 10, 9, 0, and 5. Data point was skipped for the severe/critical group at the 91–120 DPSO interval because only one sample was drawn during that timeframe. Dashed lines indicate the C0 (from Fig. 1).
Surrogate viral neutralization levels measured in plasma samples with high SARS-CoV-2 Ab levels
Neutralizing Abs are capable of blocking the interaction between the SARS-CoV-2 RBD, and the ACE2 receptor on the surface of target cells. To determine whether plasma from infected patients had SARS-CoV-2–neutralizing activity, we tested a representative subset of 19 plasma samples drawn within 30 DPSO from 12 severe/critical patients, 4 mild/moderate patients, and 3 healthy prepandemic subjects using a surrogate viral neutralization test (sVNT) (33). Plasma from patients in the severe/critical group demonstrated inhibition of ACE2 receptor binding activity by HRP-conjugated S1-RBD, achieving 50% reductions at several hundred-fold dilutions (log10 sIC50 median = 2.48), compared with little or no measurable activity (log10 sIC50 < 0.5) in the mild/moderate and healthy control groups (Fig. 7A). In a second population of severe/critical (n = 15) and mild/moderate (n = 10) patients in Fig. 7B (p < 0.0001), we validated assessed neutralization using the sVNT. In plasma/serum samples collected in the convalescent stage of the infection (days 37 to 140), the neutralizing titers in severe/critical patients (n = 8) decline slightly, whereas those measured in the mild/moderate patients (n = 23) rise substantially to near equivalence with the severe/critical population.
FIGURE 7. Quality of SARS-CoV-2 Abs in severe/critical and mild/moderate during acute infection and convalescence.
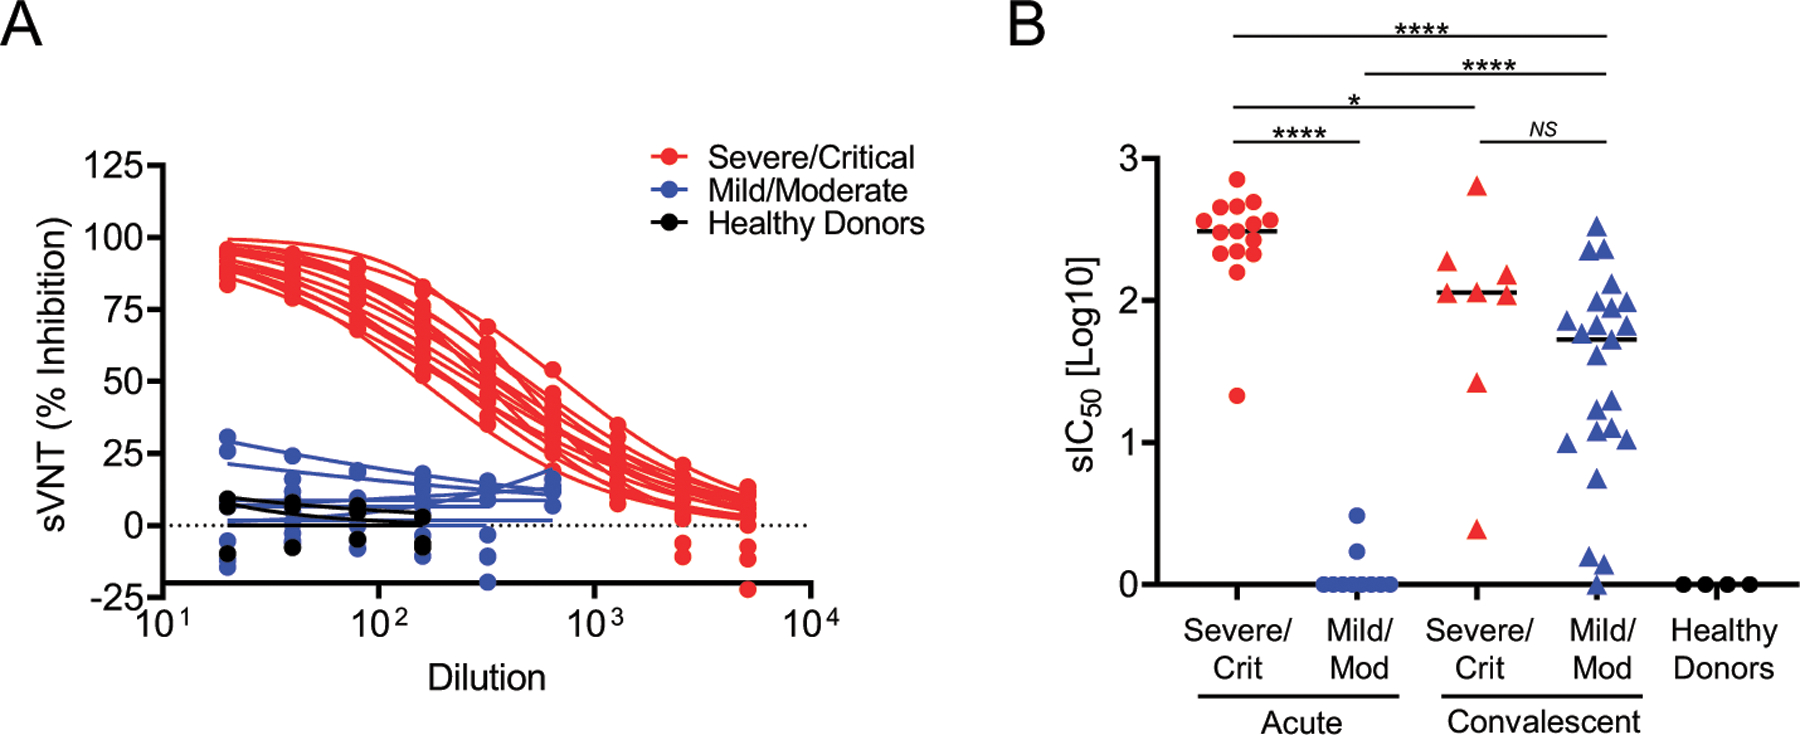
(A) Dose–response curves of plasma from patients with severe/critical (red lines) or mild/moderate (blue lines) SARS-CoV-2 infections and healthy controls (black lines) using the GenScript sVNT that measures blockade of the interaction between the immobilized ACE2 receptor and soluble HRP-conjugated S1-RBD by sample-borne Abs. sVNT (% inhibition) is the percentage reduction of the ACE2 receptor/HRP-conjugated S1-RBD interaction in the absence of an inhibitor. (B) Plasma dilution yielding 50% reduction of the uninhibited response in the sVNT sIC50[log10] observed in severe patients (red dots, triangles), mild patients (blue dots, triangles), and healthy controls (black dots) during acute illness and convalescence. The significance was determined by a two-sided t test. NS, p > 0.05, *p < 0.05, ****p < 0.0001.
Vaccinated subjects develop strong anti–S1-RBD Ab responses
Another essential indication for the One-Stop immunoassay is to assess vaccine responses. Eighteen subjects were recruited who received the Pfizer or Moderna mRNA-based SARS-CoV-2 vaccines that incorporate only the S protein. The measurement of Abs specific for the N protein and S1-RBD 2–4 wk after the primary immunization or 4–8 d following the second immunization revealed an abundance of primarily IgG anti–S1-RBD Abs (Fig. 8). The Ab levels further increased upon the secondary immunization to levels near or equal to those observed in the most responsive severe/critical patients. Anti–S1-RBD IgM and IgA were also elicited, but their serum levels were substantially lower than those of IgG. No vaccine-induced response to N was observed in contrast to natural SARS-CoV-2 infections, in which N-specific titers were easily detected. In summary, this assay can also distinguish Ab responses resulting from vaccination or natural infections.
FIGURE 8. Comparison of anti-N and anti–S1-RBD Ab responses in natural infections versus vaccination.
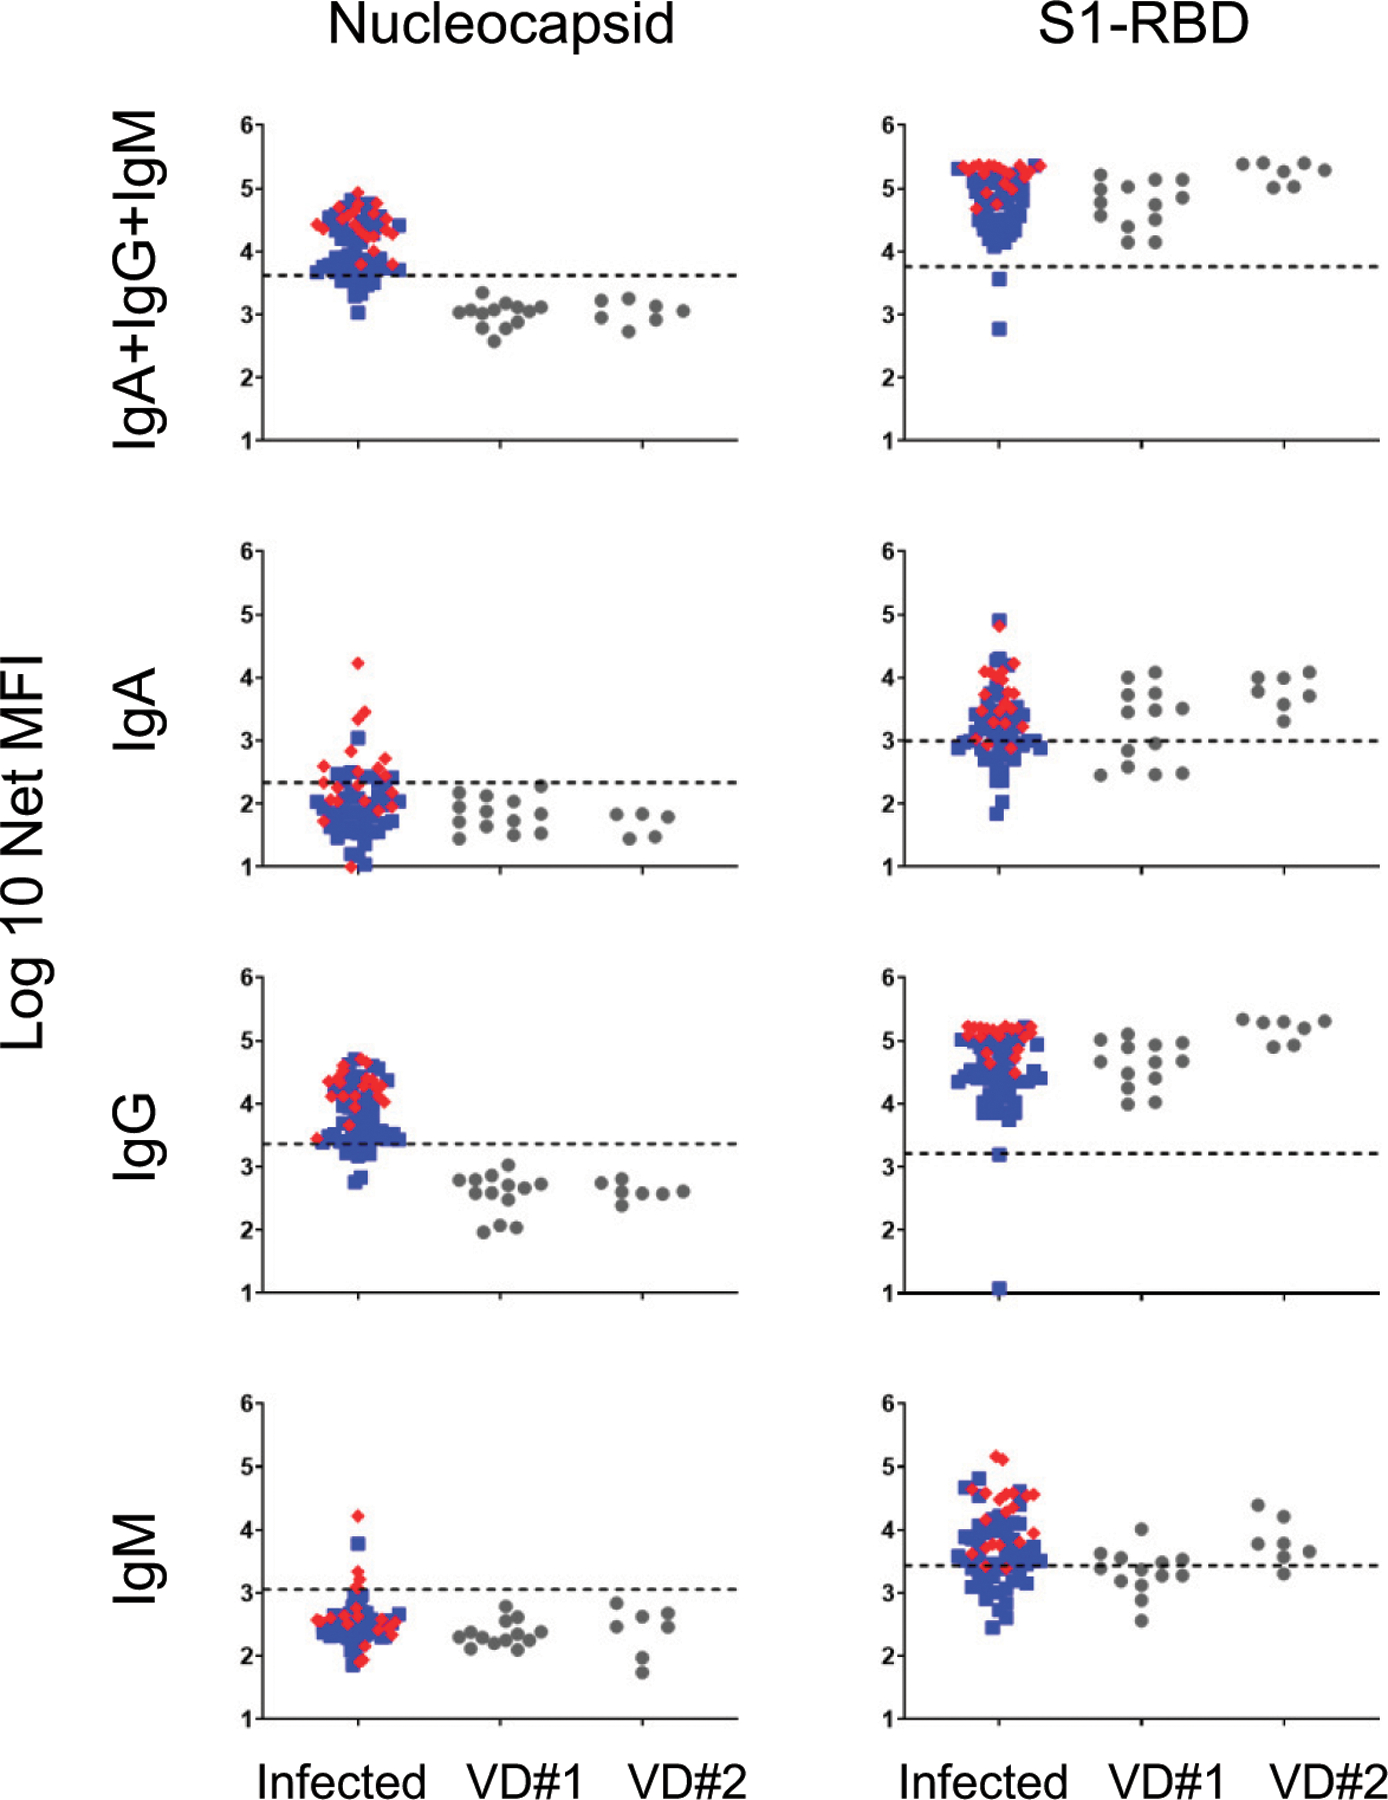
Serum anti-N and anti–S1-RBD Ab responses were measured in 18 subjects 13–28 d after the first dose (n = 13) and 4–8 d after the second dose (n = 7) of COVID-19 vaccination and compared against responses in the 69 naturally infected COVID-19 convalescent patients from Fig. 4 (mild/moderate patients represented as blue squares; severe/critical patients represented as red diamonds). Two of the eighteen vaccinated subjects had both a dose 1 and dose 2 sample. Two of the thirteen vaccine dose 1 (VD#1) subjects received the Moderna vaccine; the remaining 11 subjects received the Pfizer vaccine. All seven of the vaccine dose 2 (VD#2) subjects received the Pfizer vaccine. Dashed lines indicate the C0 (from Fig. 1).
DISCUSSION
To visualize the comprehensive landscape of SARS-CoV-2 humoral immunity, we developed a sensitive, multiplex immunoassay for detection of acute infection and previous viral exposure. This immunoassay detects individual or combined IgA, IgG, and IgM Abs against viral Ags N, S1, S1-RBD, and S1-NTD. Because of its wide dynamic range, the assay can also distinguish severe/critical from mild/moderate infections and potentially prognosticate severity early in infection. However, we observed in severe/critical sera an unexpected prozone effect that may have been underappreciated in prior studies. Additionally, neutralizing Abs correlated with viral-specific Ab titers, particularly in severe/critical patients early in disease and rose in mild/moderate patients only after recovery. For diagnosis of acute and convalescent infections, the combined isotype or the One-Stop IgG immunoassays for anti–S1-RBD performed best, although anti-N and anti-S1 provided confirmation and anti-N may be useful for distinguishing positive Ab responses from vaccinations compared with those from previous infections. To distinguish mild/moderate from severe/critical infections, measurement of combined isotypes or IgG specific for S1-RBD, S1, or N had high predictive values (AUC ≥ 0.90). In particular, anti–S1-RBD was excellent for both diagnosis and prognosis of severity, although anti-N and anti-S1 were also effective.
Differences in longitudinal Ab responses and disease severity
Magnitude and kinetics of SARS-CoV-2 Ab responses differed with disease severity. Severe/critical patients (nine of whom died) reached very high titers against N, S1, and S1-RBD at 6–20 DPSO. These early responses consisted of not only IgM but primarily of class-switched IgG and IgA Abs.
The decline in Ab levels occurred at different rates for several Ag/isotype combinations. The levels of IgG, IgA, and IgM against N and S1 decline rapidly after recovery in the severe/critical group; thus, they would not be useful for convalescent diagnosis. In contrast, the mild/moderate patients had slower rises of Ab titers, mostly 30 DPSO, and slower declines evident only after 3–4 mo. Patients with severe/critical disease have increased circulating Ab-secreting cells early in infection (12, 35, 36) associated with higher Ab levels compared with those observed in mild/moderate patients. Together, these results suggest different sources of B cells and ASC in the severe/critical and mild/moderate infection groups.
Prozone effect and previous underestimation of SARS-CoV-2 Abs
We could discriminate serum titers between severe/critical and mild/moderate patients early in illness because of the sensitivity of this platform. It is well known that the prozone (or hook) effect occurs when an excess of Ag or Ab inhibits the formation of cross-linked Ag–Ab complexes (25, 27–29, 37). In our assay, this effect was observed at higher serum concentrations, demonstrating abundant Ab levels in severe/critical patients. Concentrations of anti–S1-RBD IgG rose to 100–400 μg/ml in severe/critical patients by 10 DPSO and approached similar levels in mild/moderates 30 DPSO. Our results suggest that previous studies may have underestimated titers in patients with severe disease because of the prozone effect. Thus, the need for optimizing performance characteristics for these assays will be essential as we standardize serologic testing.
Severe/critical and mild/moderate patients display striking differences in their humoral immune responses: clinical significance and immunological basis
Severe/critical patients produce a vigorous early Ab response to SARS-CoV-2 comprised primarily of IgG and IgA and little IgM. In contrast, mild/moderate patients develop a conventional immune response that develops over 4–6 wk. The striking early response produced by severe/critical patients may enable early detection of the patients most likely to experience poor outcomes.
Conventional models of B cell responses to primary infections include an early extrafollicular response that provides a short-lived IgM wave of Abs with very low mutation load and Ag affinity. This extrafollicular phase precedes subsequent germinal center reactions that generate memory B cells and plasma cells that secrete higher-affinity, isotype-switched Abs (38). It is now evident, however, that extrafollicular responses also generate isotype-switched Ab responses (39) and that this process may indeed be prominent in SARS-CoV-2 infections, as recently demonstrated by our groups and others (12, 40). Moreover, our work showed that severe infection is strongly associated with intense extrafollicular B cell responses, producing IgG and IgA Abs with very low levels of somatic hypermutation despite the presence of high neutralizing Ab titers (12). In keeping with our results, severe COVID-19 infections create profound disruption of germinal center structures (40). Combined, the available evidence strongly suggests that early responses to SARS-CoV-2 may be comprised of simultaneous early generation of IgM, IgG, and IgA responses with low mutation rates through intense extrafollicular responses and defective germinal center reaction. This profile would be exaggerated in severe cases. Late and postinfection responses would depend on the degree of initial disruption and/or subsequent restoration of proper germinal center responses.
Discerning serum responses elicited by vaccination from those caused by infection using the One-Stop SARS-CoV-2 multiplex serum assay
With the recent Food and Drug Administration authorization of the COVID-19 vaccines based on the SARS-CoV-2 spike glycoprotein Ags, serology based only on the S, S1, S2, or the RBD proteins will be difficult to interpret. The vaccine responses will confound any natural reactions to the spike protein or subunits. However, Ab responses to all SARS-CoV-2 proteins, including the N protein, will be able to distinguish previous infection from vaccine responses. Indeed, this is precisely what we observed in our initial survey of the early response among 18 vaccinees. Therefore, our One-Stop multiplex approach will be useful for distinguishing serum responses from vaccinees and those who have had natural infections.
Limitations
Serial follow-ups of patient samples were often a limitation of this study. At the start of the pandemic, it was difficult to obtain infected samples from mild outpatients because of the emphasis on quarantining. Moreover, because Emory hospitals serve a large geographic region, follow-ups on severe patients after hospitalization were difficult. Nonetheless, we were particularly surprised by the high viral-specific Ab levels that emerged early in severe patients. In contrast, the mild patients did not have increased Ab levels early in illness. Because of the limited numbers early (in the first week of illness), we did not have enough patients who eventually developed severe disease. Thus, our data may not have independently proven prognostic ability for hospitalization, but the study is highly suggestive of this predictive capability.
In all, our sensitive, multiplex immunoassay is ideal for diagnosis of acute and convalescent infections and potentially for predicting severity early in the disease course as well as identifying vaccination responses. We conclude that the virus-specific Ab kinetics vary depending on disease severity, and we speculate that specific viral Ags will have implications for long-term humoral protection to SARS-CoV-2 reinfection.
Supplementary Material
Acknowledgments
This work was supported by National Institute of Allergy and Infectious Diseases, National Institutes of Health 3P01AI125180-05S1, 1R01AI121252, P01A1078907, U01AI045969, U19AI109962, U54CA260563, T32-HL116271-07, and NIGMS 2T32GM095442, The Marcus Foundation, and Centers for Disease Control and Prevention Contract 200-215-88233.
F.E.-H.L., J.L.D., and I.S. designed and supervised the study. F.E.-H.L., J.L.D., N.S.H., D.C.N., and M.E.K. wrote the manuscript with support/input/feedback from all authors. N.S.H., J.L.D., and F.E.-H.L. developed the One-Stop multiplex immunoassay. N.S.H., D.C.N., A.M.-P., and F.A. carried out the experiments. N.S.H. and D.C.N. analyzed the data. A.M.-P., F.A., K.S.C., S.K., D.C.N., A.S.S., M.C.-M., and A.D. processed, organized, and cataloged samples. R.P.R. and M.E.K. classified patient severity. S. Lee, M. Hernandez, V.E., J.V., R.P., A.J., and S. Le managed patient enrollment and data collection. A.N.L. and H.W. provided statistical guidance. D.A., J.D.R., M. Horwath, J.B.O., H.M.W., H.Y.C., V.F., I.G., C.E.L., T.M., K.E.N., and O.M. provided samples. A.-K.I.W. facilitated in-patient recruitment. A.W.D. and R.G. facilitated intensive care unit patient recruitment. All authors contributed to the manuscript revision and read and approved the submitted version.
Abbreviations used in this article:
- AUC
area under the curve
- C0
diagnostic cutoff value
- DPSO
day post–symptom onset
- MFI
median fluorescent intensity
- N
nucleocapsid
- NIH
National Institutes of Health
- RBD
receptor binding domain
- ROC
receiver-operating characteristic
- sIC50
surrogate IC50
- S1-NTD
spike 1 N-terminal domain
- S1-RBD
spike 1 receptor binding domain
- sVNT
surrogate virus neutralization test
Footnotes
The online version of this article contains supplemental material.
DISCLOSURES
F.E.-H.L. is the founder of Micro-B-plex, Inc. N.S.H., A.M.-P., and J.L.D. are also scientists at MicroB-plex, Inc., Atlanta, GA. A.-K.I.W. holds equity and management roles in Ataia Medical. The other authors have no financial conflicts of interest.
REFERENCES
- 1.Chan JF-W, Yip CC-Y, To KK-W, Tang TH-C, Wong SC-Y, Leung K-H, Fung AY-F, Ng AC-K, Zou Z, Tsoi H-W, et al. 2020. Improved molecular diagnosis of COVID-19 by the novel, highly sensitive and specific COVID-19-RdRp/Hel real-time reverse transcription-PCR assay validated in vitro and with clinical specimens. J. Clin. Microbiol 58: e00310–20. [DOI] [PMC free article] [PubMed] [Google Scholar]
- 2.Wu H-S, Chiu S-C, Tseng T-C, Lin S-F, Lin J-H, Hsu Y-H, Wang M-C, Lin T-L, Yang W-Z, Ferng T-L, et al. 2004. Serologic and molecular biologic methods for SARS-associated coronavirus infection, Taiwan. Emerg. Infect. Dis 10: 304–310. [DOI] [PMC free article] [PubMed] [Google Scholar]
- 3.Zhao J, Yuan Q, Wang H, Liu W, Liao X, Su Y, Wang X, Yuan J, Li T, Li J, et al. 2020. Antibody responses to SARS-CoV-2 in patients with novel coronavirus disease 2019. Clin. Infect. Dis 71: 2027–2034. [DOI] [PMC free article] [PubMed] [Google Scholar]
- 4.Horby P, Lim WS, Emberson JR, Mafham M, Bell JL, Lin-sell L, Staplin N, Brightling C, Ustianowski A, Elmahi E, et al. ; RECOVERY Collaborative Group. 2020. Dexamethasone in hospitalized patients with Covid-19. N. Engl. J. Med 384: 693–704. [DOI] [PMC free article] [PubMed] [Google Scholar]
- 5.Grein J, Ohmagari N, Shin D, Diaz G, Asperges E, Castagna A, Feldt T, Green G, Green ML, Lescure FX, et al. 2020. Compassionate use of remdesivir for patients with severe Covid-19. N. Engl. J. Med 382: 2327–2336. [DOI] [PMC free article] [PubMed] [Google Scholar]
- 6.den Hartog G, Schepp RM, Kuijer M, GeurtsvanKessel C, van Beek J, Rots N, Koopmans MPG, van der Klis FRM, and van Binnendijk RS. 2020. SARS-CoV-2-specific antibody detection for seroepidemiology: a multiplex analysis approach accounting for accurate seroprevalence. J. Infect. Dis 222: 1452–1461. [DOI] [PMC free article] [PubMed] [Google Scholar]
- 7.Gudbjartsson DF, Norddahl GL, Melsted P, Gunnarsdottir K, Holm H, Eythorsson E, Arnthorsson AO, Helgason D, Bjarnadottir K, Ingvarsson RF, et al. 2020. Humoral immune response to SARS-CoV-2 in Iceland. N. Engl. J. Med 383: 1724–1734. [DOI] [PMC free article] [PubMed] [Google Scholar]
- 8.Isho B, Abe KT, Zuo M, Jamal AJ, Rathod B, Wang JH, Li Z, Chao G, Rojas OL, Bang YM, et al. 2020. Persistence of serum and saliva antibody responses to SARS-CoV-2 spike antigens in COVID-19 patients. Sci. Immunol 5: eabe5511 10.1126/sciimmunol.abe5511. [DOI] [PMC free article] [PubMed] [Google Scholar]
- 9.Pisanic N, Randad PR, Kruczynski K, Manabe YC, Thomas DL, Pekosz A, Klein SL, Betenbaugh MJ, Clarke WA, Laeyendecker O, et al. 2020. COVID-19 serology at population scale: SARS-CoV-2-specific antibody responses in saliva. J. Clin. Microbiol 59: e02204–20. [DOI] [PMC free article] [PubMed] [Google Scholar]
- 10.Long Q-X, Liu B-Z, Deng H-J, Wu G-C, Deng K, Chen Y-K, Liao P, Qiu J-F, Lin Y, Cai X-F, et al. 2020. Antibody responses to SARS-CoV-2 in patients with COVID-19. Nat. Med 26: 845–848. [DOI] [PubMed] [Google Scholar]
- 11.Lynch KL, Whitman JD, Lacanienta NP, Beckerdite EW, Kastner SA, Shy BR, Goldgof GM, Levine AG, Bapat SP, Stramer SL, et al. 2021. Magnitude and kinetics of anti-SARS-CoV-2 antibody responses and their relationship to disease severity. Clin. Infect. Dis 72: 301–308. [DOI] [PMC free article] [PubMed] [Google Scholar]
- 12.Woodruff MC, Ramonell RP, Nguyen DC, Cashman KS, Saini AS, Haddad NS, Ley AM, Kyu S, Howell JC, Ozturk T, et al. 2020. Extrafollicular B cell responses correlate with neutralizing antibodies and morbidity in COVID-19. Nat. Immunol 21: 1506–1516. [DOI] [PMC free article] [PubMed] [Google Scholar]
- 13.Suthar MS, Zimmerman MG, Kauffman RC, Mantus G, Linderman SL, Hudson WH, Vanderheiden A, Nyhoff L, Davis CW, Adekunle O, et al. 2020. Rapid generation of neutralizing antibody responses in COVID-19 patients. Cell Rep Med 1: 100040. [DOI] [PMC free article] [PubMed] [Google Scholar]
- 14.Shah VK, Firmal P, Alam A, Ganguly D, and Chattopadhyay S. 2020. Overview of immune response during SARS-CoV-2 infection: lessons from the past. Front. Immunol 11: 1949. [DOI] [PMC free article] [PubMed] [Google Scholar]
- 15.Zost SJ, Gilchuk P, Chen RE, Case JB, Reidy JX, Trivette A, Nargi RS, Sutton RE, Suryadevara N, Chen EC, et al. 2020. Rapid isolation and profiling of a diverse panel of human monoclonal antibodies targeting the SARS-CoV-2 spike protein. Nat. Med 26: 1422–1427. [DOI] [PMC free article] [PubMed] [Google Scholar]
- 16.Liu L, Wang P, Nair MS, Yu J, Rapp M, Wang Q, Luo Y, Chan JF, Sahi V, Figueroa A, et al. 2020. Potent neutralizing antibodies against multiple epitopes on SARS-CoV-2 spike. Nature 584: 450–456. [DOI] [PubMed] [Google Scholar]
- 17.Kreer C, Zehner M, Weber T, Ercanoglu MS, Gieselmann L, Rohde C, Halwe S, Korenkov M, Schommers P, Vanshylla K, et al. 2020. Longitudinal isolation of potent near-germline SARS-CoV-2-neutralizing antibodies from COVID-19 patients. [Published erratum appears in 2020 Cell 182: 1663–1673.] Cell 182: 843–854. [DOI] [PMC free article] [PubMed] [Google Scholar]
- 18.Seydoux E, Homad LJ, MacCamy AJ, Parks KR, Hurl-burt NK, Jennewein MF, Akins NR, Stuart AB, Wan YH, Feng J, et al. 2020. Analysis of a SARS-CoV-2-infected individual reveals development of potent neutralizing antibodies with limited somatic mutation. Immunity 53: 98–105.e5. [DOI] [PMC free article] [PubMed] [Google Scholar]
- 19.Zhang W, Du RH, Li B, Zheng XS, Yang XL, Hu B, Wang YY, Xiao GF, Yan B, Shi ZL, and Zhou P. 2020. Molecular and serological investigation of 2019-nCoV infected patients: implication of multiple shedding routes. Emerg. Microbes Infect 9: 386–389. [DOI] [PMC free article] [PubMed] [Google Scholar]
- 20.Yongchen Z, Shen H, Wang X, Shi X, Li Y, Yan J, Chen Y, and Gu B. 2020. Different longitudinal patterns of nucleic acid and serology testing results based on disease severity of COVID-19 patients. Emerg. Microbes Infect 9: 833–836. [DOI] [PMC free article] [PubMed] [Google Scholar]
- 21.Robbiani DF, Gaebler C, Muecksch F, Lorenzi JCC, Wang Z, Cho A, Agudelo M, Barnes CO, Gazumyan A, Finkin S, et al. 2020. Convergent antibody responses to SARS-CoV-2 in convalescent individuals. Nature 584: 437–442. [DOI] [PMC free article] [PubMed] [Google Scholar]
- 22.Kuri-Cervantes L, Pampena MB, Meng W, Rosenfeld AM, Ittner CAG, Weisman AR, Agyekum RS, Mathew D, Baxter AE, Vella LA, et al. 2020. Comprehensive mapping of immune perturbations associated with severe COVID-19. Sci. Immunol 5: eabd7114. [DOI] [PMC free article] [PubMed] [Google Scholar]
- 23.Ripperger TJ, Uhrlaub JL, Watanabe M, Wong R, Castaneda Y, Pizzato HA, Thompson MR, Bradshaw C, Weinkauf CC, Bime C, et al. 2020. Orthogonal SARS-CoV-2 serological assays enable surveillance of low-prevalence communities and reveal durable humoral immunity. Immunity DOI: 10.1016/j.immuni.2020.10.004. [DOI] [PMC free article] [PubMed] [Google Scholar]
- 24.Zhang L, Zhang F, Yu W, He T, Yu J, Yi CE, Ba L, Li W, Farzan M, Chen Z, et al. 2006. Antibody responses against SARS coronavirus are correlated with disease outcome of infected individuals. J. Med. Virol 78: 1–8. [DOI] [PMC free article] [PubMed] [Google Scholar]
- 25.Algaissi A, Alfaleh MA, Hala S, Abujamel TS, Alamri SS, Almahboub SA, Alluhaybi KA, Hobani HI, Alsulaiman RM, AlHarbi RH, et al. 2020. SARS-CoV-2 S1 and N-based serological assays reveal rapid seroconversion and induction of specific antibody response in COVID-19 patients. Sci. Rep 10: 16561. [DOI] [PMC free article] [PubMed] [Google Scholar]
- 26.Dogan M, Kozhaya L, Placek L, Gunter C, Yigut M, Hardy R, Plassmeyer M, Coatney P, Lillard K, Bukhari Z, et al. 2021. SARS-CoV-2 specific antibody and neutralization assays reveal the wide range of the humoral immune response to virus. Commun. Biol DOI: 10.1038/s42003-021-01649-6. [DOI] [PMC free article] [PubMed] [Google Scholar]
- 27.Heidelberger M, and Kendall FE. 1929. A quantitative study of the precipitin reaction between type Iii pneumococcus polysaccha-ride and purified homologous antibody. J. Exp. Med 50: 809–823. [DOI] [PMC free article] [PubMed] [Google Scholar]
- 28.Zinsser H 1914. Infection and Resistance The Macmillian Company, New York, NY. [Google Scholar]
- 29.Bray D, and Lay S. 1997. Computer-based analysis of the binding steps in protein complex formation. Proc. Natl. Acad. Sci. USA 94: 13493–13498. [DOI] [PMC free article] [PubMed] [Google Scholar]
- 30.Panel C-TG. Coronavirus Disease 2019 (COVID-19) Treatment Guidelines: National Institutes of Health. Available at: https://www.covid19treatmentguidelines.nih.gov/. Accessed: June 22, 2020. [PubMed] [Google Scholar]
- 31.Polack FP, Thomas SJ, Kitchin N, Absalon J, Gurtman A, Lockhart S, Perez JL, Pérez Marc G, Moreira ED, Zerbini C, et al. ; C4591001 Clinical Trial Group. 2020. Safety and efficacy of the BNT162b2 mRNA Covid-19 vaccine. N. Engl. J. Med 383: 2603–2615. [DOI] [PMC free article] [PubMed] [Google Scholar]
- 32.Baden LR, El Sahly HM, Essink B, Kotloff K, Frey S, Novak R, Diemert D, Spector SA, Rouphael N, Creech CB, et al. ; COVE Study Group. 2021. Efficacy and safety of the mRNA-1273 SARS-CoV-2 vaccine. N. Engl. J. Med 384: 403–416. [DOI] [PMC free article] [PubMed] [Google Scholar]
- 33.Tan CW, Chia WN, Qin X, Liu P, Chen MI, Tiu C, Hu Z, Chen VC, Young BE, Sia WR, et al. 2020. A SARS-CoV-2 surrogate virus neutralization test based on antibody-mediated blockage of ACE2-spike protein-protein interaction. Nat. Biotechnol 38: 1073–1078. [DOI] [PubMed] [Google Scholar]
- 34.Yuan M, Wu NC, Zhu X, Lee CD, So RTY, Lv H, Mok CKP, and Wilson IA. 2020. A highly conserved cryptic epitope in the receptor binding domains of SARS-CoV-2 and SARS-CoV. Science 368: 630–633. [DOI] [PMC free article] [PubMed] [Google Scholar]
- 35.Mathew D, Giles JR, Baxter AE, Oldridge DA, Green-plate AR, Wu JE, Alanio C, Kuri-Cervantes L, Pampena MB, D’Andrea K, et al. ; UPenn COVID Processing Unit. 2020. Deep immune profiling of COVID-19 patients reveals distinct immunotypes with therapeutic implications. Science 369: eabc8511. [DOI] [PMC free article] [PubMed] [Google Scholar]
- 36.Varnaite R, García M, Glans H, Maleki KT, Sandberg JT, Tynell J, Christ W, Lagerqvist N, Asgeirsson H, Ljunggren H-G, et al. 2020. Expansion of SARS-CoV-2-specific antibody-secreting cells and generation of neutralizing antibodies in hospitalized COVID-19 patients. J. Immunol 205: 2437–2446. [DOI] [PMC free article] [PubMed] [Google Scholar]
- 37.Yan G, Xing D, Tan S, and Chen Q. 2004. Rapid and sensitive immunomagnetic-electrochemiluminescent detection of p53 antibodies in human serum. J. Immunol. Methods 288: 47–54. [DOI] [PubMed] [Google Scholar]
- 38.Victora GD, and Nussenzweig MC. 2012. Germinal centers. Annu. Rev. Immunol 30: 429–457. [DOI] [PubMed] [Google Scholar]
- 39.Roco JA, Mesin L, Binder SC, Nefzger C, Gonzalez-Figueroa P, Canete PF, Ellyard J, Shen Q, Robert PA, Cappello J, et al. 2019. Class-switch recombination occurs infrequently in germinal centers. Immunity 51: 337–350.e7. [DOI] [PMC free article] [PubMed] [Google Scholar]
- 40.Kaneko N, Kuo HH, Boucau J, Farmer JR, Allard-Chamard H, Mahajan VS, Piechocka-Trocha A, Lefteri K, Osborn M, Bals J, et al. ; Massachusetts Consortium on Pathogen Readiness Specimen Working Group. 2020. Loss of Bcl-6-expressing T follicular helper cells and germinal centers in COVID-19. Cell 183: 143–157.e13. [DOI] [PMC free article] [PubMed] [Google Scholar]
Associated Data
This section collects any data citations, data availability statements, or supplementary materials included in this article.


