

Abstract
Motivation
Understanding whether and which microbes played a mediating role between an exposure and a disease outcome are essential for researchers to develop clinical interventions to treat the disease by modulating the microbes. Existing methods for mediation analysis of the microbiome are often limited to a global test of community-level mediation or selection of mediating microbes without control of the false discovery rate (FDR). Further, while the null hypothesis of no mediation at each microbe is a composite null that consists of three types of null, most existing methods treat the microbes as if they were all under the same type of null, leading to excessive false positive results.
Results
We propose a new approach based on inverse regression that regresses the microbiome data at each taxon on the exposure and the exposure-adjusted outcome. Then, the P-values for testing the coefficients are used to test mediation at both the community and individual taxon levels. This approach fits nicely into our Linear Decomposition Model (LDM) framework, so our new method LDM-med, implemented in the LDM framework, enjoys all the features of the LDM, e.g. allowing an arbitrary number of taxa to be tested simultaneously, supporting continuous, discrete, or multivariate exposures and outcomes (including survival outcomes), and so on. Using extensive simulations, we showed that LDM-med always preserved the FDR of testing individual taxa and had adequate sensitivity; LDM-med always controlled the type I error of the global test and had compelling power over existing methods. The flexibility of LDM-med for a variety of mediation analyses is illustrated by an application to a murine microbiome dataset, which identified several plausible mediating taxa.
Availability and implementation
Our new method has been added to our R package LDM, which is available on GitHub at https://github.com/yijuanhu/LDM.
Supplementary information
Supplementary data are available at Bioinformatics online.
1 Introduction
While most microbiome studies conducted so far have focused on bivariate associations between the microbiome and the covariates of interest (e.g. environmental factors and clinical outcomes) (Bai et al., 2019; Dunlop et al., 2021), increasing studies have emerged recently to elucidate the biological mechanisms underlying the complex interplay between environmental exposures, the microbiome and clinical outcomes. In many cases, it is of interest to understand whether the microbiome plays a mediating role between an exposure and an outcome (Dolan and Chang, 2017; Pope et al., 2017; Wang et al., 2020), as depicted in Figure 1a. For example, does diet have any effect on inflammatory bowel diseases that is mediated through the perturbation of the gut microbiome (Dolan and Chang, 2017)? How does the change in the gut microbiome due to antibiotic exposure cause the change in mouse body weight (Wang et al., 2020)? It is of particular importance to identify the specific microbes that are responsible for the overall mediation effect, which is essential for researchers to develop clinical interventions to modify the outcome by modulating the mediating microbes, e.g. through antibiotics or probiotics that directly modify the number of the microbes, or prebiotics that modify microbial products, such as metabolites (Berg et al., 2020; Quigley and Gajula, 2020).
Fig. 1.

(a) Some effect of the exposure on the outcome is mediated through multiple microbes. (b) T denotes the exposure, the microbes, O the outcome and Z the confounders
Compared to the test of bivariate associations, one challenge in the test of mediation is the composite null hypothesis. Let T denote the exposure (or treatment), the J mediators, O the outcome and Z the confounding covariates; using this notation, the mediation relationships are shown in Figure 1b. To claim a mediation effect of a microbe, both the exposure–microbe and microbe–outcome associations (given the exposure) are required to be significant. Thus, the null hypothesis of no mediation at microbe j is a composite null that consists of no microbe–outcome association, no exposure–microbe association, or neither:
which are referred to as the type-I, type-II and type-III null hypotheses, respectively. It is highly likely that different microbes are under different types of null. For example, antibiotic use may perturb a large number of microbes but most of them do no modify mouse body weight, whereas some microbes remain intact from antibiotic use but do interact with the body weight; of course, there are microbes that are not associated with either factor. In this example, we have all three types of null, and a valid analysis should acknowledge that.
A further challenge in the test of mediation with microbiome data arises from the complex features of the data. The taxa count data are high-dimensional with typically many more taxa than samples, and it is of interest to test all taxa simultaneously for mediation effects with multiple testing correction that controls the false discovery rate (FDR). The data are also sparse (having 50–90% zero counts), compositional (measuring relative abundances that sum to one) and highly overdispersed. In addition, microbiome studies may have complex exposures or outcomes that can be either continuous or discrete, as well as multivariate (comprising multiple components, such as categorical variables with more than two levels); the outcome can even be censored-survival times (Jenq et al., 2015; Spencer et al., 2021). These studies often have potential confounding covariates, small sample sizes (e.g. 30–100) and complex designs [e.g. clustered data (Hu and Satten, 2020), matched sets (Zhu et al., 2021) and longitudinal sampling]. The capability to handle all these features is essential for any statistical method to be practically useful.
In view of the challenges in testing mediation with high-dimensional microbiome data, the two existing methods, MedTest (Zhang et al., 2018) and MODIMA (Hamidi et al., 2019), are restricted to testing the overall mediation effect at the community level. Although other methods, namely CMM (Sohn and Li, 2019) [and CMMB, the extension for binary outcomes (Sohn et al., 2022)], SparseMCMM (Wang et al., 2020) and Zhang’s method (Zhang et al., 2021) attempt to identify individual mediating taxa, they have no control of any error rate (e.g. the FDR). Specifically, MedTest and MODIMA base their tests on distance matrices that summarize the high-dimensional data into between-sample dissimilarity measurements, and thus produce a global P-value only. Also, they treat the taxa as if they are all under the same type of null in their permutation procedures that provide the null distributions of the test statistics, and thus may not control the type I error when this assumption does not hold. Further, although they can accommodate binary outcomes without any modification, MedTest does not allow multivariate exposures or outcomes and MODIMA does not allow adjustment of confounders. Finally, MedTest, by using principal components of the distance matrix as mediators, may not capture mediation effects in rare taxa; MODIMA highly depends on the choice of the distance metric and currently does not provide an omnibus test.
In this article, we focus on testing, rather than estimation, of mediation effects at individual taxa with a goal of controlling the FDR. This strategy is very common in the initial scan of high-dimensional features in omic studies (Asher et al., 2009; Hu and Lin, 2010; Hu et al., 2015); ‘fine mapping’ of mechanistic mediators and formal estimation of their mediation effects can be performed more easily after the dimension is greatly reduced. We find that, the testing objective can be facilitated by using inverse regression that regresses the microbiome data at each taxon on the exposure and the exposure-adjusted outcome. We implement the inverse regression model using our Linear Decomposition Model (LDM) framework (Hu and Satten, 2020; Hu et al., 2021; Zhu et al., 2021) that we developed originally for testing microbiome associations (Hu and Satten, 2020). As the LDM was designed to specifically handle the microbiome data complexities (e.g. high-dimensionality, sparsity and overdispersion), our LDM-based mediation analysis naturally inherits these features. As the LDM models each taxon separately, our approach allows different taxa to be under different types of null. Finally, like MedTest and MODIMA, we also develop a global test of community-level mediation; our global test statistic is a coherent combination of our taxon-specific statistics. The main advantage of our approach is that results for individual taxa are available; neither MedTest nor MODIMA provide taxon-specific results.
The rest of this article is organized as follows. In Section 2, we first give the motivation for using inverse regression and the LDM framework. Then, we consider four ways of testing individual taxa for mediation and then a method that aggregates the taxon-level information to test the overall mediation in a community. In Section 3, we first present simulation results in which we numerically compared the four ways of testing individual taxa and selected the one with the best performance, and we compared our global test to existing tests. Then, we present the application to a real study on murine microbiome. We conclude with Section 4.
2 Materials and methods
2.1 Motivation
Our starting point is the following classical model for multiple mediators (VanderWeele and Vansteelandt, 2014). For a continuous outcome and J continuous (potential) mediators with no exposure–mediator and mediator–mediator interactions, the model specifies a linear model for each mediator and a linear model for the outcome that includes the effects of all mediators:
| (1) |
| (2) |
where the notation was introduced in Figure 1b. It can be derived that the overall (total) mediation effect through takes the form (VanderWeele and Vansteelandt, 2014); note that characterizes the effect of T on Mj given Z, and characterizes the effect of Mj on O given Z and T and all other Mjs. When the mediators are independent of one another conditional on Z and T, each product term can be interpreted as the mediation effect through a single mediator Mj. Even if the mediators are not conditionally independent, a non-zero value of indicates a non-zero contribution of Mj to the overall mediation effect. Thus, our objective can be achieved by testing whether at each potential mediator. However, the forward outcome model (2), although describing the mediation process in a natural order and enabling intuitive forms for the mediation effects, are not easily generalizable to an outcome that is a discrete, multivariate or censored-survival-time variable. In addition, Model (2) does not permit a large number of mediators, e.g. more mediators than samples, unless some regularization is imposed.
2.2 Inverse regression model
The limitations of the forward outcome model motivated us to adopt the inverse regression model that exchanges the positions of the outcome and mediators. Inverse regression is a commonly used approach, which, e.g. has been widely used in genetics studies of multiple phenotypes (Majumdar et al., 2015; O’Reilly et al., 2012; Wu and Pankow, 2015). It has a key advantage of accommodating different types of outcomes. Also, it allows a large number of microbial taxa to be analyzed simultaneously by treating each taxon as the response variable in the regression, one at a time.
Here, we assume that a mediating taxon acts through its relative abundance, so we let Mj denote the relative abundance of taxon j, although our methodology can easily accommodate presence–absence data (Mj taking Value 1 or 0 indicating non-zero read count of taxon j in a sample). We find that, by properly orthogonalizing the exposure variable T and outcome variable O, we can obtain an inverse regression model that ‘merges’ both the mediator model (1) and the forward regression model (2) into one regression. To this end, we define Tr to be the residual of T after orthogonalizing against Z, and Or to be the residual of O after orthogonalizing against (Z, T). We consider the inverse regression model for taxon j
| (3) |
We show in Supplementary Text S1 that and that and coincide. As a result, testing
| (4) |
is equivalent to testing , i.e. whether there exists a mediation effect through taxon j. We can test (4) by obtaining the least-squares estimates from (3), denoted by and , forming the test statistic , and using permutation to provide the null distribution of the test statistic. All of these can be achieved by using the LDM framework with minor modifications.
2.3 Overview of the LDM
Here, we give a brief overview of the LDM. It was originally developed for testing associations between the microbiome and the covariates of interest. It is based on a linear model that regresses the microbiome data at each taxon on the sequentially orthogonalized covariates that include first the confounding covariates that we wish to adjust for and then the covariates that we wish to test. Thus, it allows an arbitrary number of taxa (including arbitrarily rare taxa) to be tested simultaneously. The covariates can be continuous, discrete or multivariate variables, or even censored-survival times; note that the survival times and censoring statuses are first fit by a Cox model to be converted to the Martingale or deviance residuals, which are then used as a generic continuous covariate in the LDM (Hu et al., 2022). The taxon data can be at the relative abundance scale, arcsin-root-transformed relative abundance scale or the presence–absence scale (Hu et al., 2021), and their results can be combined to provide omnibus tests (Zhu et al., 2022). The inference of associations in the LDM is based on permutation (i.e. permuting the orthogonalized covariates) to circumvent making parametric assumptions about the distribution of the microbiome data. Thus, the inference is robust to sparse and overdispersed count data, as well as small sample sizes, and the LDM always has good control of the FDR. Also, the permutation can be conducted to preserve the sample structure [e.g. clustered data (Hu and Satten, 2020), matched sets (Zhu et al., 2021)], so the LDM can accommodate certain complex designs. The covariate types, taxon data scales and sample structures that the LDM supports were summarized in Figure 1 of Zhu et al. (2022). As a result, our mediation analysis implemented in the LDM framework naturally inherits all these features from the LDM.
2.4 Testing mediation effects at individual taxa
As mentioned after Equation (4), it is most natural to consider the following statistic for testing the mediation effect at taxon j:
To provide a reference distribution for this statistic under the composite null of no mediation, we calculate the following statistic under the bth () permutation:
where and are obtained by permuting Tr and Or, separately, to break the T–Mj association given Z and the Mj–O association given (Z, T), respectively, and they are directly available from the LDM. The three product terms in correspond to the test statistics under the type-I, type-II, and type-III null hypotheses. Because is the maximum of three statistics whereas is not, is inherently conservative in the sense that its distribution is more spread out than the true distribution of under a specific type of null (unknown). Finally, the permutation P-value for taxon j is calculated to be , which is then corrected for multiple testing by Sandve’s sequential stopping rule (Sandve et al., 2011) as implemented in the LDM. We refer to this approach to testing individual taxa as LDM-med-product. However, it is unclear how to handle multivariate exposures or outcomes, in which case there are more than one element in or .
A second way is to base the test statistic on the P-values and for testing and , respectively, which naturally accommodate multivariate exposures or outcomes and are directly available from the LDM. Now we consider the test statistic
and assess the significance of by using the same permutation procedure as above and calculating the statistic
where the null P-values and are based on the rank statistics of and , respectively, among all permutation replicates (Westfall and Young, 1993). Note that can also be directly used as an analytical P-value for testing a single mediator (Boca et al., 2014), but here, we choose permutation for inference because permutation is more robust and the permutation replicates are readily available from the LDM. Similarly to , the statistic is inherently conservative. Finally, the permutation P-value is calculated to be and corrected for multiple testing by Sandve’s sequential stopping rule (Sandve et al., 2011) as implemented in the LDM. We refer to this approach as LDM-med-maxP. In fact, this approach was found to be equivalent to LDM-med-product in simple settings, e.g. when all variables are normally distributed (Boca et al., 2014). However, besides the conservative and , the stringent correction of all J tests in both LDM-med-product and LDM-med-maxP tends to make them even more inefficient.
A third approach is to directly apply the MultiMed procedure (Sampson et al., 2018) to the LDM P-values and , which was developed to improve the efficiency of testing a large number of mediators. The idea is to restrict the mediation testing to a subset of taxa that have relatively small and . Here, we briefly describe this procedure; the theoretical properties that guarantee the FDR control can be found in the original papers (Bogomolov and Heller, 2018; Sampson et al., 2018). First, for a nominal FDR level α, find the subset of taxa with relatively small to be , and denote the cardinality of the subset by . Similarly, find the subset with relatively small to be and denote . Then, the downstream testing of mediation is restricted to taxa at the intersection of the two subsets, which can greatly alleviate multiple testing correction. For taxon , define the subset-adjusted P-value
Taxon j is declared to be a mediator if the FDR-adjusted P-value
We call this approach LDM-med-subset. Although the subset-based approach has shown to be more efficient than the approach based on the product of coefficients (similar to our first approach) in the context of controlling the family-wise error rate (Sampson et al., 2018), it is of interest to re-evaluate these approaches in the context of controlling the FDR.
A fourth approach is to directly apply the HDMT procedure (Dai et al., 2022) to the LDM P-values and , which was developed to overcome the conservativeness of a mediation test due to the composite null. The core of the HDMT procedure is based on estimating the proportions of the three types of null and then the underlying mixture null distribution of the statistic . We call this approach LDM-med-HDMT.
2.5 Testing the overall mediation effect in a community
If every taxon in a community is under some type of null (not necessarily the same type), we declare a null community with no mediation effect. Recall that has frequently been used as a P-value for testing a single mediator (Boca et al., 2014). Given these ‘P-values’ at individual taxa, it is straightforward to construct a global test statistic by combining these ‘P-values’. Here, we adopt the Harmonic mean method (Wilson, 2019) to aggregate s, which is more robust to the dependence structure among taxa than Fisher’s method. The harmonic mean of s is , where a smaller value corresponds to a stronger evidence against the null hypothesis. To have a usual test statistic with a reverse directionality, we choose the statistic for the global test to be
We assess the significance of via permutation, since permutation is more robust and the permutation replicates are readily available. The statistic based on bth permutation replicate is where has been introduced earlier. Finally, the permutation P-value for the global test is given by . We call this test LDM-med-global, which is a natural extension of LDM-med-maxP but is also compatible with LDM-med-subset and LDM-med-HDMT in the sense that all are based on the P-values and .
3 Results
3.1 Simulation studies
Our simulations were based on data on 856 taxa of the upper-respiratory-tract (URT) microbiome (Charlson et al., 2010), and the mediator model (1) and the forward outcome model (2) as generative models. We focused on the sample size 100 but also considered 30 in some cases, because our murine microbiome dataset has 36 samples. Suppose that the exposure variable Ti is binary and that an equal number of samples were exposed (Ti = 1) and unexposed (Ti = 0). We considered continuous outcomes as well as binary outcomes. In what follows, we number the taxa by decreasing relative abundance so that Taxon 1 is the most abundant. We considered three mediation mechanisms, in which we assumed the mediating taxa were the top five most abundant taxa (Taxa 1–5), five less abundant taxa (Taxa 51–55) and a mixture of the two sets (Taxa 4–5 and 51–52); we refer to them as M-common, M-rare and M-mixed, respectively. In all scenarios, we selected Taxa 6–10 to be associated with the exposure but not with the outcome, and Taxa 11–15 to be associated with the outcome but not with the exposure, corresponding to the type-I and type-II null taxa, respectively.
To generate the read count data, we first set the baseline (when Ti = 0) relative abundances of all taxa for all samples, denoted by , to the population means that were estimated from the URT data. To induce the effects of the exposure Ti on a set of associated taxa (e.g. the mediating taxa or type-I null taxa), for those unexposed we kept unchanged; for those exposed we decreased for some of the associated taxa by a percentage, which equals for the mediating taxa and (0 or 0.6) for the type-I null taxa, and we redistributed the decreased amount evenly over the remaining of the associated taxa. This way ensures that the relative abundances of non-associated taxa remain intact and the modified satisfies the compositional constraint (unit sum). Note that captures the effects of the exposure on the mediating taxa and captures the effects of the exposure on the type-I null taxa. Specifically, in M-common, the increasing set of the mediating taxa was Taxa 1–2 and the decreasing set was Taxa 3–5; in M-rare, the two sets were Taxa 51–52 and 53–55; in M-mixed, the two sets were Taxa 4 and 52 and Taxa 5 and 51. Among the type-I null taxa, the two sets were Taxa 6–7 and 8–10. The modified represents the mean relative abundances conditional on the exposure value. Then, we introduced sample heterogeneity by drawing the sample-specific composition from the Dirichlet distribution with mean (after modification) and overdispersion θ that was set to 0.02 (as estimated from the URT data). Finally, we generated the read count data using the Multinomial distribution with mean πi and the library sizes (sequencing depth) sampled from and left truncated at 500.
To generate the outcome that is influenced by the mediating taxa, denoted by , and the type-II null taxa, denoted by , we partitioned each set of taxa into two subsets ( and and ) with approximately equal total relative abundance. In particular, we set and to be the increasing and decreasing sets, respectively, that were determined earlier relative to the exposure and have similar total relative abundance; we set and to be Taxa 11–12 and 13–15, respectively. To simulate a continuous outcome, we used the model
| (5) |
where is a scaling function that standardizes a variable to have mean 0 and standard deviance 1, characterizes the direct effect of the exposure on the outcome and was fixed at 0.2 here, characterizes the effects of the mediating taxa on the outcome, characterizes the effects of the type-II taxa and was fixed at 0 or 0.4, and the error term ϵi was drawn from . It can be verified that the taxa that are neither mediators nor type-II null taxa were uncorrelated with the outcome after controlling for Ti, owing to the counterbalancing effects of taxa in and (or and ) on the outcome. To simulate a binary outcome, we calculated the probability with μi being the same linear predictor as in (5), without the error term ϵi.
To simulate a confounder, we note that a confounder has effects on the exposure, the microbiome and the outcome (Fig. 1b). Thus, we first simulated the binary confounder Zi with 70% ‘success’ rate among the exposed and 30% among the unexposed. Then, we used the same decreasing and increasing sets of the mediating taxa as determined earlier, now with the deduction percentage , and the same operation as for the exposure to further modify for those with Zi = 1. Finally, we modified the linear predictor in the outcome model (5) to include the term with fixed at 0.7.
Prior to analysis, we filtered out taxa that were found in fewer than 5 subjects in the dataset, which resulted in ∼460 taxa remaining in analysis. For testing mediation effects at individual taxa, we compared our four approaches: LDM-med-maxP, LDM-med-product, LDM-med-subset and LDM-med-HDMT (using the asymptotic version as recommended because the proportions of the type-I and type-II null taxa are small in all scenarios here). The sensitivity (proportion of the truly mediating taxa that were detected) and empirical FDR were assessed at the nominal level of 10% based on 1000 replicates of data. Note that none of CMM, SparseMCMM and Zhang’s method worked for our simulated data, as they either gave errors (due to the large number of taxa or extensive zero count data) or ran more than 10 h. For testing the overall mediation effect, we applied LDM-med-global and compared it to MedTest and MODIMA whenever the latter were applicable. For MedTest, we adopted the omnibus test based on both the Bray–Curtis and Jaccard distance matrices, which would work well when mediating taxa are abundant and less abundant, respectively, and thus form a complementary pair. For MODIMA, we chose Bray–Curtis, as MODIMA allows one distance measure only and Bray–Curtis is the most commonly used distance in the literature and was also frequently used in the MODIMA paper. The type I error and power were assessed at the nominal level 0.05 based on 10 000 and 1000 replicates of data, respectively.
3.2 Simulation results
For testing mediation at individual taxa, the subset approach (LDM-med-subset) had substantially improved sensitivity over the product (LDM-med-product) and maxP (LDM-med-maxP) approaches in all scenarios, while the latter two always had similar performance (Figs 2–6 and Supplementary Figs S1 and S2). As expected, all three approaches yielded conservative empirical FDR in all scenarios. Although the empirical FDR of the HDMT approach (LDM-med-HDMT) is less conservative (i.e. closer to the nominal level), its sensitivity results are generally comparable to those from LDM-med-subset in all scenarios. For these reasons, we always select LDM-med-subset as the recommended method for testing individual taxa.
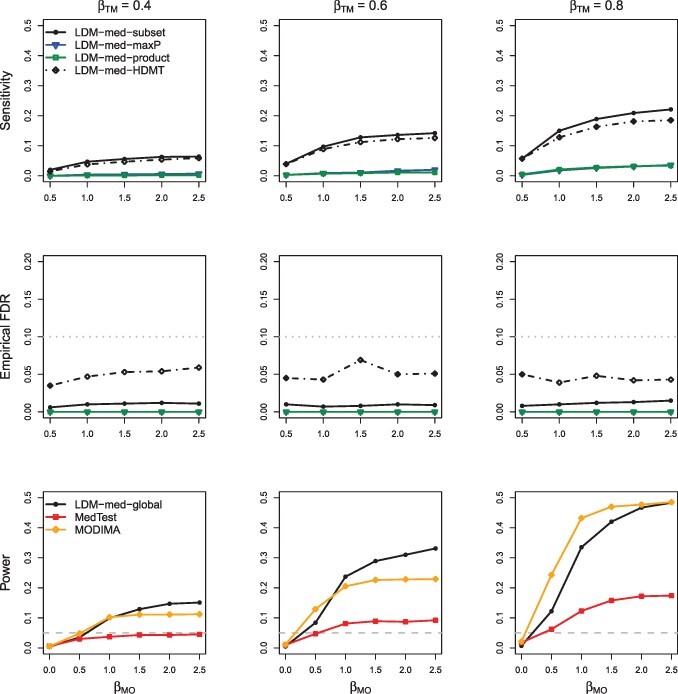
Fig. 2.
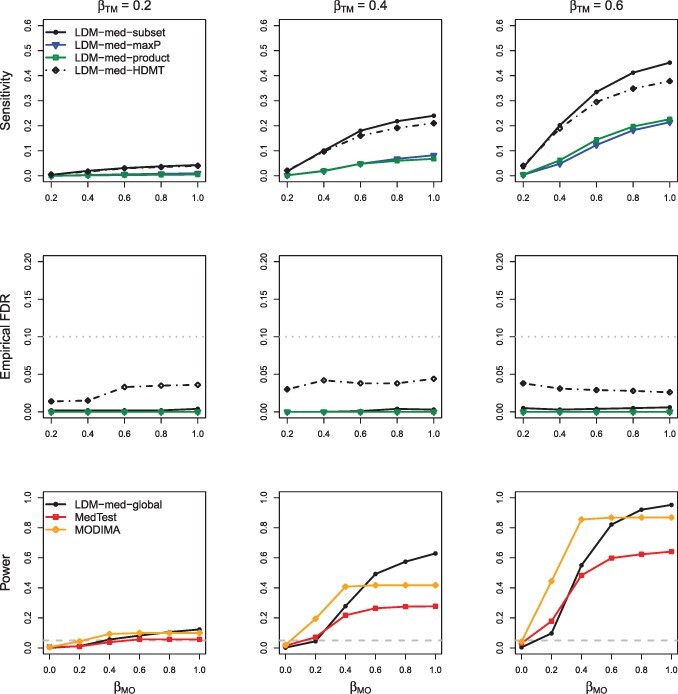
Simulation results in M-mixed with a continuous outcome and no confounder, in the absence of type-I and type-II null taxa ( and ). The upper and middle panels pertain to sensitivity and empirical FDR, respectively, of the four approaches to testing individual taxa: LDM-med-product, LDM-med-maxP, LDM-med-subset and LDM-med-HDMT, which are based on the product of coefficients as the test statistic, the maximum of coefficient P-values as the test statistic, a subset of promising taxa and the HDMT procedure, respectively. The gray dotted line in the middle panel represents the nominal level of 10% for the FDR. The lower panel pertains to power of the proposed global test, LDM-med-global and the existing global tests, MedTest and MODIMA. The gray dashed line there represents the nominal level 0.05 for the type I error
The type I error results of the global tests in M-common, M-rare and M-mixed are summarized in Table 1 and Supplementary Table S1. We considered 12 scenarios under the global null hypothesis, each corresponding to a specific combination of the three types of null taxa in a simulated community. For example, when , the pre-selected mediating taxa reduced to the type-II null taxa ( and ), and both the pre-selected type-I and type-II null taxa reduced to the type-III null taxa ( and ); here the type-III null taxa were viewed as a special case of either the type-I or type-II null taxa whichever existed in the community, so this community was determined to have type-II null taxa only. Clearly, MedTest and MODIMA easily lost control of the type I error whenever the type-I and type-II null taxa coexisted in the community. In all scenarios, LDM-med-global controlled the type I error; in fact, it was conservative as expected. In scenarios that consist of a single type of null taxa, MedTest and MODIMA controlled the type I error; then LDM-med-global appeared to have more conservative type I error than MedTest and MODIMA because LDM-med-global still allowed different taxa to be under different types of null.
Table 1.
Type I error (at level 0.05) of the global tests in M-mixed with a continuous outcome and no confounder, in 12 scenarios under the global null
| Method |
|||||||
|---|---|---|---|---|---|---|---|
| Type(s) of null | LDM- med-global | MedTest | MODIMA | ||||
| 0.0 | 0.4 | 0.0 | 0.0 | II | 0.010 | 0.024 | 0.044 |
| — | — | — | 0.4 | II | 0.007 | 0.024 | 0.048 |
| — | — | 0.6 | 0.0 | I, II | 0.010 | 0.504 | 0.936 |
| — | — | — | 0.4 | I, II | 0.010 | 0.547 | 0.985 |
| 0.6 | 0.0 | 0.0 | 0.0 | I | 0.004 | 0.031 | 0.042 |
| — | — | — | 0.4 | I, II | 0.007 | 0.270 | 0.720 |
| — | — | 0.6 | 0.0 | I | 0.008 | 0.038 | 0.051 |
| — | — | — | 0.4 | I, II | 0.010 | 0.282 | 0.811 |
| 0.0 | 0.0 | 0.0 | 0.0 | III | 0.000 | 0.004 | 0.003 |
| — | — | — | 0.4 | II | 0.005 | 0.018 | 0.039 |
| — | — | 0.6 | 0.0 | I | 0.006 | 0.030 | 0.053 |
| — | — | — | 0.4 | I, II | 0.009 | 0.317 | 0.813 |
Note: MedTest is the omnibus test that combines results from analyzing the Bray–Curtis and Jaccard distances. MODIMA is based on the Bray–Curtis distance. The parameters and determine the type of null that the pre-selected mediating taxa reduce to; controls the existence of the pre-selected type-I null taxa and controls the existence of the pre-selected type-II null taxa.
In the presence of a confounder (Supplementary Table S2), LDM-med-global controlled the type I error even when the confounder was not adjusted for, due to its conservativeness. As this provided no clue to the extent of the confounding effect and thus the capability of LDM-med-global in adjusting for the confounding effect, we considered a variant of LDM-med-global, called LDM-med-global, that used the information on the type of null for each taxon (only available in simulation). Specifically, we modified to be or depending on the actual type of null at taxon j. LDM-med-global yielded inflated type I error when the confounder was not adjusted in the regression and type I error close to 0.05 when it was adjusted, demonstrating that LDM-med-global (and hence LDM-med-global) was effective in adjusting for confounders.
For evaluating power of the global tests, we started with the scenarios when there were neither type-I nor type-II null taxa (), under which MedTest and MODIMA were valid. We also started with the simple case of a continuous outcome and no confounder. In M-common (Supplementary Fig. S1), MedTest and MODIMA were more powerful than LDM-med-global, whereas in M-rare (Supplementary Fig. S2), they were much less powerful than LDM-med-global, demonstrating that MedTest and MODIMA were effective in capturing mediation effects in abundant taxa but in not rare ones. In M-mixed (Fig. 2), the power of LDM-med-global crossed with that of MedTest and MODIMA; LDM-med-global performed best when was relatively large. The relative power of LDM-med-global and MedTest remained largely unchanged when a confounder was introduced to M-mixed (Fig. 3); MODIMA was not included for comparison in this case because it cannot adjust for the confounder. When the type-I and type-II null taxa were both introduced (Fig. 4), they invalidated both MedTest and MODIMA but minimally affected the performance of LDM-med-global. When we switched to a binary outcome (Fig. 5), LDM-med-global lost power to MedTest and MODIMA. We wanted to know whether the power loss was the price that LDM-med-global paid in order to always allow different types of null at different taxa. To investigate this, we considered another variant of LDM-med-global, called LDM-med-global, that assumed the same type of null (unknown) across all taxa as assumed in MedTest and MODIMA, and modified to be . Indeed, LDM-med-global gained substantially power over LDM-med-global and had comparable or even better power than MedTest. Finally, when the sample size was reduced to merely 30 in the same scenario as in Figure 2, we observed similar patterns of results in Figure 6 compared to Figure 2.
Fig. 3.
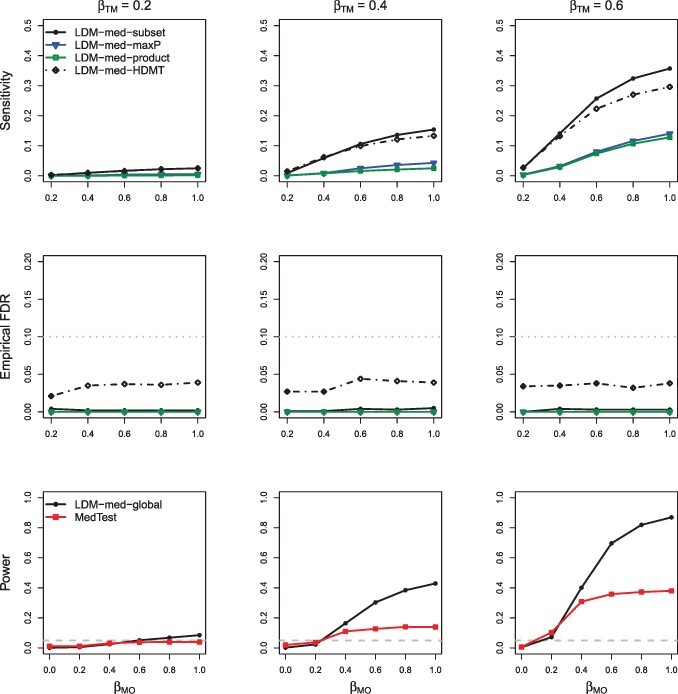
Simulation results in M-mixed with a continuous outcome and a confounder, in the absence of type-I and type-II null taxa. MODIMA was excluded because it does not allow adjustment of confounders
Fig. 4.
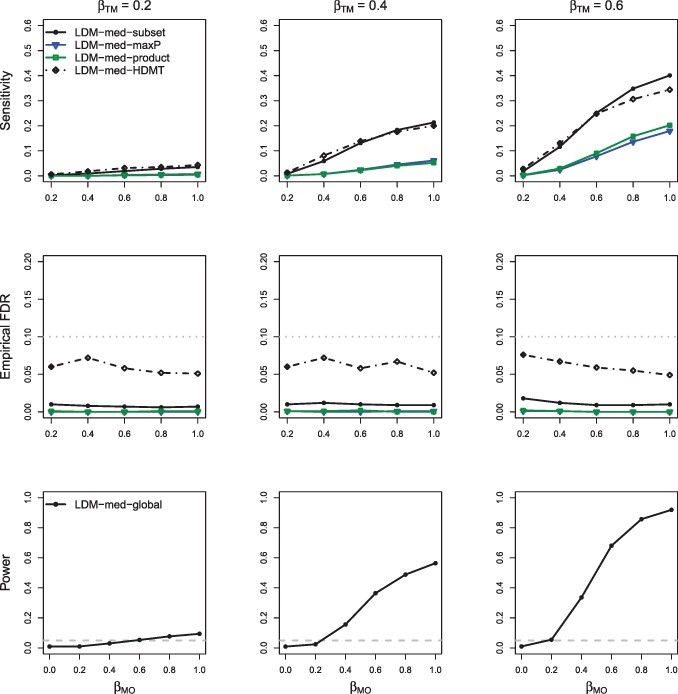
Simulation results in M-mixed with a continuous outcome and no confounder, in the presence of type-I and type-II null taxa ( and ). MedTest and MODIMA were both excluded because they did not control the type I error (Table 1)
Fig. 5.
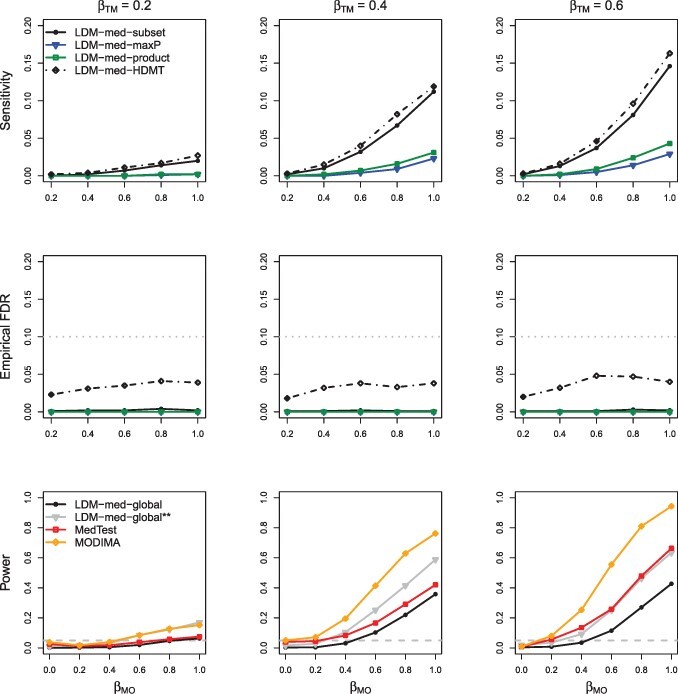
Simulation results in M-mixed with a binary outcome and no confounder, in the absence of type-I and type-II null taxa. LDM-med-global is a variant of LDM-med-global that assumed the same type of null (unknown) for all taxa as was assumed in MedTest. The sample size was increased to 200 to obtain adequate power
Fig. 6.
Simulation results in the same scenario as in Figure 2 but with sample size 30
3.3 Murine microbiome study
We analyzed the data generated from a murine microbiome study (Schulfer et al., 2019), which was conducted to explore whether the sub-therapeutic antibiotic treatment (STAT) would alter the gut microbiome composition and whether the altered gut microbiome would affect the body weight gain later in life. We focused on male mice for this analysis. The male mice were first randomized into the STAT and control groups, which was used as a binary exposure variable in our analysis. Then, their fecal samples were collected longitudinally at Days 21 and 28. Bacterial DNAs were extracted from the fecal samples, sequenced for the 16S rRNA gene, and summarized into a taxa count table that initially contained 149 genera. Samples with <1800 reads, and genera with <10% presence or 0.01% mean relative abundance were filtered out, so the final taxa count table for our analysis included 41 genera and 36 mice (23 exposed to STAT and 13 unexposed); each mouse had two microbiome measurements at both time points. The mice body weight (in grams) prior to sacrifice was measured and used as a continuous outcome variable in our analysis. There were no additional covariates to be adjusted, as all potential confounders had been well-controlled in the randomized experiment.
It can be seen from Supplementary Figure S3 that mice exposed to STAT were heavier than the control mice, with a small Wilcoxon P-value 0.011. This motivated us to test whether this effect of STAT on body weight was mediated through the gut microbiome. For detecting individual mediating taxa (at the nominal FDR level of 20%, which was relatively high because the total number of genera was small), we applied LDM-med-subset and LDM-med-HDMT. For testing the overall mediation effect of the gut microbiome, we applied LDM-med-global, as well as MedTest, MODIMA and SparseMCMM whenever they were applicable. Note that, although the outcome distribution somewhat deviated from the normal distribution (Supplementary Fig. S3), all methods should be robust to the deviation because LDM-related tests treat the outcome as a covariate, and MedTest, MODIMA and SparseMCMM all base their inference on permutation.
All main results were summarized in Table 2. We first restricted our mediation analysis to the cross-sectional microbiome data at Day 28 only. LDM-med-subset detected seven significant mediators, [Ruminococus] (a species that is misclassified to the genus Ruminococcus and is now awaiting to be formally renamed through the appropriate Code of Nomenclature), Candidatus Arthromitus, Clostridiales, Clostridium, Ruminococcus, Dehalobacterium and Oscillospira, among which the first three genera were detected by LDM-med-HDMT. If the nominal FDR level of 10% were used, LDM-med-subset would detect one mediator [Ruminococcus] while LDM-med-HDMT would detect none. These results provided additional support for selecting LDM-med-subset over LDM-med-HDMT. Although SparseMCMM identified six mediators (shown in their Supplementary Table S9), two of which ([Ruminococus] and Clostridium) overlapped with our detection list, SparseMCMM had no control for the FDR. To gain more insights into these results, we performed analysis of the bivariate association between the exposure and the relative abundance of each taxon using the Wilcoxon rank-sum test, and the bivariate association between each taxon and the outcome conditional on the exposure using the standard linear regression (treating the outcome as the response variable, and the exposure and taxon as covariates). We corrected multiple testing in each association analysis by the Benjamini–Hochberg procedure (Benjamini and Hochberg, 1995) at the nominal FDR level of 20%. As shown in Supplementary Table S3, 25 taxa were detected to be associated with the exposure, including all seven mediators detected by LDM-med-subset; five of the seven mediators were confirmed to be associated with the outcome, and the other two mediators ranked next but failed to pass the threshold of significance here. Thus, the mediators identified by LDM-med-subset seem plausible. For testing the community-level mediation, LDM-med-global produced a global P-value 0.0351. SparseMCMM yielded a more significant global P-value 0.004. Both MedTest (the omnibus test of Bray–Curtis and Jaccard distances) and MODIMA (based on the Bray–Curtis distance) produced non-significant global P-values 0.379 and 0.133, respectively.
Table 2.
Mediation analysis of the murine microbiome dataset
| Three analyses |
||||
|---|---|---|---|---|
| Method | Day 28 (continuous outcome) | Days 21 and 28 (clustered samplesb) | Day 28 (multivariate outcomec) | |
| Detected taxa | LDM-med-subset | [Ruminococcus] a | [Ruminococcus] | None |
| (FDR = 20%) | Candidatus Arthromitus | Candidatus Arthromitus a | — | |
| Clostridiales | Clostridiales | — | ||
| Clostridium | Clostridium a | — | ||
| Ruminococcus | — | — | ||
| Dehalobacterium | — | — | ||
| Oscillospira | — | — | ||
| LDM-med-HDMT | [Ruminococcus] | [Ruminococcus] | None | |
| Candidatus Arthromitus | Candidatus Arthromitus | — | ||
| Clostridiales | Clostridiales | — | ||
| — | Clostridium | — | ||
| Global P-value | LDM-med-global | 0.0351 | 0.0387 | 0.633 |
| MedTest | 0.379 | — | — | |
| MODIMA | 0.133 | — | 0.177 | |
| SparseMCMM | 0.004 | — | — | |
Note: [Ruminococcus] is a species that is misclassified to the genus Ruminococcus and is now awaiting to be formally renamed through the appropriate Code of Nomenclature.
Taxa that would have been detected at the nominal FDR level of 10%.
The microbiome data from Days 21 and 28 tend to cluster within subjects, i.e. more correlated within subjects.
The weight gain outcome values were categorized into three categories by the 33rd and 66th percentiles. The detected taxa are listed such that the common taxa generated from different analyses appear in the same rows.
We also performed mediation analysis of the longitudinal (clustered) microbiome data at both Days 21 and 28. Note that the outcome was observed only once per subject. While no other methods exist to analyze mediation of the microbiome data with correlations, LDM-related tests inherited such a capability from the LDM (by setting perm.within.type=‘none’ and perm.between.type=‘free’). Here, a time variable (1/0) indicating Day 28 was included as a covariate Z, as the microbiome composition was found to be significantly different between the two times (P-value 0.040 by the LDM for analyzing the matched-pair data). The results of mediation analysis by LDM-related tests were largely consistent with the previous results based on the data at Day 28 only. We again performed analysis of bivariate associations between the exposure and each taxon by applying the LDM to the clustered data (adjusted for the time effect); we performed analysis of bivariate associations between each taxon and the outcome conditional on the exposure using the standard linear regression (regressing the outcome variable on the exposure, the relative abundances of the taxon at Days 21 and 28, and testing the joint effect of the two relative abundance variables using the F-test). The results were again largely consistent with the previous results on bivariate associations using the data at Day 28 only (Supplementary Table S3).
Finally, to illustrate the capability of LDM-related tests to handle categorical outcome variables, we converted the continuous outcome variable into a three-level categorical variable by the 33rd and 66th percentiles. For this type of outcome variables, only LDM-related tests and MODIMA were applicable, none of which, however, identified any significant mediation effect.
4 Discussion
We presented a new approach to mediation analysis of the microbiome that is based on inverse regression and the LDM framework. We call the mediation framework based on the LDM LDM-med, which consists of LDM-med-subset for testing the taxon-level mediation and LDM-med-global for testing the community-level mediation. LDM-med offers maximum robustness to the complex features in the taxa count data (e.g. high-dimensionality, sparsity and overdispersion), and provides extensive flexibility to accommodate various exposures and outcomes and study designs. Specifically, using the simulated and real data, we demonstrated the capabilities of LDM-med to deal with null taxa under different types of null hypothesis of no mediation, continuous, binary and multivariate outcomes, clustered data with the exposure and outcome variables varying between the clusters, and adjustment of confounding covariates. In addition, LDM-med could also handle clustered data with the exposure and/or outcome variables varying within the clusters (Zhu et al., 2021), and perform analysis at the presence–absence scale using a rarefaction-without-resampling approach (Hu et al., 2021). In summary, LDM-med can be highly useful in practice.
We have added LDM-med to our existing R package LDM. The computation of LDM-med is as efficient as the LDM. For example, using a single-thread MacBook Pro laptop (2.9 GHz Quad-Core Intel Core i7, 16 GB memory), it took 46 s to analyze one simulated dataset having 100 samples and ∼460 taxa (after filtering); it took 126 s to analyze one simulated dataset having 200 samples and ∼700 taxa (after filtering). The murine dataset was at a smaller scale, consisting of 36 mice and 41 genera, so it took only 5 and 12 s to analyze the data at Day 28 only and the data at both Days 21 and 28, respectively.
LDM-med tests the marginal mediation effect for each taxon, and thus the identified mediators may not all be true biological mediators, which are called ‘probable mediators’ but not ‘true mediators’ (Sampson et al., 2018). This compromise was made in order to obtain controlled FDR for the detected mediators, which we deem as critical in the initial ‘scan’ of high-dimensional features to generate ‘targets’ to follow up in the downstream mechanistic study. This strategy has been very common in the analysis of high-dimensional omic data (Asher et al., 2009; Hu et al., 2015; Sampson et al., 2018).
Funding
This work was supported by the National Institutes of Health awards [R01GM116065, R01GM141074 to Y.-J.H.].
Conflict of Interest: none declared.
Supplementary Material
Contributor Information
Ye Yue, Department of Biostatistics and Bioinformatics, Emory University, Atlanta, GA 30322, USA.
Yi-Juan Hu, Department of Biostatistics and Bioinformatics, Emory University, Atlanta, GA 30322, USA.
References
- Asher J.E. et al. (2009) A whole-genome scan and fine-mapping linkage study of auditory-visual synesthesia reveals evidence of linkage to chromosomes 2q24, 5q33, 6p12, and 12p12. Am. J. Hum. Genet., 84, 279–285. [DOI] [PMC free article] [PubMed] [Google Scholar]
- Bai J. et al. (2019) Composition of gut microbiota and its association with body mass index and lifestyle factors in a cohort of 7–18 years old children from the American gut project. Pediatr. Obes., 14, e12480. [DOI] [PubMed] [Google Scholar]
- Benjamini Y., Hochberg Y. (1995) Controlling the false discovery rate: a practical and powerful approach to multiple testing. J. R. Stat. Soc. Ser. B Methodol., 57, 289–300. [Google Scholar]
- Berg G. et al. (2020) Microbiome definition re-visited: old concepts and new challenges. Microbiome, 8, 1–22. [DOI] [PMC free article] [PubMed] [Google Scholar]
- Boca S.M. et al. (2014) Testing multiple biological mediators simultaneously. Bioinformatics, 30, 214–220. [DOI] [PMC free article] [PubMed] [Google Scholar]
- Bogomolov M., Heller R. (2018) Assessing replicability of findings across two studies of multiple features. Biometrika, 105, 505–516. [Google Scholar]
- Charlson E.S. et al. (2010) Disordered microbial communities in the upper respiratory tract of cigarette smokers. PLoS One, 5, e15216. [DOI] [PMC free article] [PubMed] [Google Scholar]
- Dai J.Y. et al. (2022) A multiple-testing procedure for high-dimensional mediation hypotheses. J. Am. Stat. Assoc., 117, 198–213. [DOI] [PMC free article] [PubMed] [Google Scholar]
- Dolan K.T., Chang E.B. (2017) Diet, gut microbes, and the pathogenesis of inflammatory bowel diseases. Mol. Nutr. Food Res., 61, 1600129. [DOI] [PMC free article] [PubMed] [Google Scholar]
- Dunlop A.L. et al. (2021) Vaginal microbiome composition in early pregnancy and risk of spontaneous preterm and early term birth among African American women. Front. Cell. Infect. Microbiol., 11:641005. [DOI] [PMC free article] [PubMed] [Google Scholar]
- Hamidi B. et al. (2019) MODIMA, a method for multivariate omnibus distance mediation analysis, allows for integration of multivariate exposure-mediator-response relationships. Genes, 10, 524. [DOI] [PMC free article] [PubMed] [Google Scholar]
- Hu Y., Li,Y., Satten,G.A., and Hu,Y.-J. (2022) Testing microbiome associations with censored survival outcomes at both the community and individual taxon levels. bioRxiv. 10.1101/2022.03.11.483858. [DOI] [PMC free article] [PubMed] [Google Scholar]
- Hu Y.J., Lin D.Y. (2010) Analysis of untyped SNPs: maximum likelihood and imputation methods. Genet. Epidemiol., 34, 803–815. [DOI] [PMC free article] [PubMed] [Google Scholar]
- Hu Y.-J., Satten G.A. (2020) Testing hypotheses about the microbiome using the linear decomposition model (LDM). Bioinformatics, 36, 4106–4115. [DOI] [PMC free article] [PubMed] [Google Scholar]
- Hu Y.-J. et al. (2015) Proper use of allele-specific expression improves statistical power for cis-eQTL mapping with RNA-seq data. J. Am. Stat. Assoc., 110, 962–974. [DOI] [PMC free article] [PubMed] [Google Scholar]
- Hu Y.-J. et al. (2021) A rarefaction-based extension of the LDM for testing presence–absence associations in the microbiome. Bioinformatics, 37, 1652–1657. [DOI] [PMC free article] [PubMed] [Google Scholar]
- Jenq R.R. et al. (2015) Intestinal Blautia is associated with reduced death from graft-versus-host disease. Biol. Blood Marrow Transplant., 21, 1373–1383. [DOI] [PMC free article] [PubMed] [Google Scholar]
- Majumdar A. et al. (2015) Semiparametric allelic tests for mapping multiple phenotypes: binomial regression and Mahalanobis distance. Genet. Epidemiol., 39, 635–650. [DOI] [PMC free article] [PubMed] [Google Scholar]
- O’Reilly P.F. et al. (2012) MultiPhen: joint model of multiple phenotypes can increase discovery in GWAS. PLoS One, 7, e34861. [DOI] [PMC free article] [PubMed] [Google Scholar]
- Pope J.L. et al. (2017) Microbiota as a mediator of cancer progression and therapy. Transl. Res., 179, 139–154. [DOI] [PMC free article] [PubMed] [Google Scholar]
- Quigley E.M., Gajula P. (2020) Recent advances in modulating the microbiome. F1000Research, 9, 46. [DOI] [PMC free article] [PubMed] [Google Scholar]
- Sampson J.N. et al. (2018) FWER and FDR control when testing multiple mediators. Bioinformatics, 34, 2418–2424. [DOI] [PMC free article] [PubMed] [Google Scholar]
- Sandve G.K. et al. (2011) Sequential Monte Carlo multiple testing. Bioinformatics, 27, 3235–3241. [DOI] [PMC free article] [PubMed] [Google Scholar]
- Schulfer A.F. et al. (2019) The impact of early-life Sub-therapeutic antibiotic treatment (STAT) on excessive weight is robust despite transfer of intestinal microbes. ISME J., 13, 1280–1292. [DOI] [PMC free article] [PubMed] [Google Scholar]
- Sohn M.B., Li H. (2019) Compositional mediation analysis for microbiome studies. Ann. Appl. Stat., 13, 661–681. [Google Scholar]
- Sohn M.B. et al. (2022) A compositional mediation model for a binary outcome: application to microbiome studies. Bioinformatics, 38, 16–21. [DOI] [PubMed] [Google Scholar]
- Spencer C.N. et al. (2021) Dietary fiber and probiotics influence the gut microbiome and melanoma immunotherapy response. Science, 374, 1632–1640. [DOI] [PMC free article] [PubMed] [Google Scholar]
- VanderWeele T., Vansteelandt S. (2014) Mediation analysis with multiple mediators. Epidemiol. Methods, 2, 95–115. [DOI] [PMC free article] [PubMed] [Google Scholar]
- Wang C. et al. (2020) Estimating and testing the microbial causal mediation effect with high-dimensional and compositional microbiome data. Bioinformatics, 36, 347–355. [DOI] [PMC free article] [PubMed] [Google Scholar]
- Westfall P.H., Young S.S. (1993) Resampling-Based Multiple Testing: Examples and Methods for p-Value Adjustment. Wiley, New Jersey. [Google Scholar]
- Wilson D.J. (2019) The harmonic mean p-value for combining dependent tests. Proc. Natl. Acad. Sci. USA, 116, 1195–1200. [DOI] [PMC free article] [PubMed] [Google Scholar]
- Wu B., Pankow J.S. (2015) Statistical methods for association tests of multiple continuous traits in genome-wide association studies. Ann. Hum. Genet., 79, 282–293. [DOI] [PMC free article] [PubMed] [Google Scholar]
- Zhang H. et al. (2021) Testing for mediation effect with application to human microbiome data. Stat. Biosci., 13, 313–328. [DOI] [PMC free article] [PubMed] [Google Scholar]
- Zhang J. et al. (2018) A distance-based approach for testing the mediation effect of the human microbiome. Bioinformatics, 34, 1875–1883. [DOI] [PubMed] [Google Scholar]
- Zhu Z. et al. (2021) Constraining PERMANOVA and LDM to within-set comparisons by projection improves the efficiency of analyses of matched sets of microbiome data. Microbiome, 9, 1–19. [DOI] [PMC free article] [PubMed] [Google Scholar]
- Zhu Z. et al. (2022) Integrative analysis of relative abundance data and presence-absence data of the microbiome using the LDM. Bioinformatics. 10.1093/bioinformatics/btac181. [DOI] [PMC free article] [PubMed] [Google Scholar]
Associated Data
This section collects any data citations, data availability statements, or supplementary materials included in this article.