Abstract
To better understand the molecular mechanism underlying the pathogenesis of multiple sclerosis (MS), we aimed to identify the key genes and microRNAs (miRNA) associated with MS and analyze their interactions. Differentially expressed genes (DEGs) and miRNAs (DEMs) based on the gene miRNA dataset GSE17846 and mRNA dataset GSE21942 were determined using R software. Next, we performed functional enrichment analysis and constructed a protein–protein interaction network. Data validation was performed to ensure the reliability of hub genes. The miRNA-mRNA regulatory network was constructed. In total, 47 DEMs and 843 DEGs were identified. Protein–protein interaction network analysis identified several hub genes, including JUN, FPR2, AKT1, POLR2L, LYZ, CXCL8, HBB, CST3, CTSZ, and MMP9, especially LYZ and CXCL8. We constructed an miRNA-mRNA regulatory network and found that hsa-miR-142-3p, hsa-miR-107, hsa-miR-140-5p, and hsa-miR-613 were the most important miRNAs. This study reveals some key genes and miRNAs that may be involved in the pathogenesis of MS, providing potential targets for the diagnosis and treatment of MS.
Keywords: bioinformatics, genes, microRNA, multiple sclerosis, protein–protein interaction
1. Introduction
Multiple sclerosis (MS) is an autoimmune disease characterized by the demyelination of white matter in the central nervous system. The disease often involves the functions of the pyramidal tract, sensation, cerebellum, vision, intestine, bladder, and brain, thereby presenting a variety of clinical symptoms and signs.[1] The clinical manifestations are mainly weakness of the limbs, vertigo, eye movement disorder, visual impairment, and dysarthria.[2] The majority of the patients are young and middle-aged, with more females than males, and suffer from high rates of recurrence and disability, placing a great burden on themselves, their families, and society.[3] The exact etiology and pathogenesis of MS are not completely clear, but viral infection, abnormal autoimmune regulation, genetic factors, and environmental factors are all considered to be relevant.[4] The diagnosis of MS is currently based primarily on clinical evidence of multiple central nervous system (CNS) foci in time and space, accounting for other diseases that can also cause these lesions.[5] Because of its complexity, diverse clinical manifestations, and lack of specific auxiliary examination indicators, the diagnosis of MS is especially difficult in the early stages. Therefore, it is necessary to identify reliable biomarkers related to MS.
The specific pathogenesis of MS has not yet been clarified. Research results in recent years have shown that the pathogenesis of MS involves a variety of factors, which may be the result of the combined effects of glial cells, immune factors, environmental, and nutritional factors.[6] Studies have found that the inflammatory response in the spinal cord of treated experimental autoimmune encephalomyelitis was significantly improved by suppressing the infiltration of Th1 and Th17 cells in the spinal cord and peripheral immune organs and by reducing the levels of inflammatory factors IL-12 and IL-23, which accompany Th1 and Th17 activation, respectively.[7] This suggests that Th1 and Th17 cells in the peripheral immune system and the inflammatory factors they secrete are the main cause of MS disease progression.[8] The overproduction of inflammatory factors damages oligodendrocytes, causing their necrosis and apoptosis, with subsequent shedding of myelin sheaths.[9] In the pathogenesis of MS, the immune system and glial cell proliferation play a major role in disease progression.[10]
MicroRNAs (miRNAs), a class of endogenous noncoding RNAs, are generally only 18–25 bp in length and are mostly small-molecule single-stranded RNAs.[11] miRNA is generally expressed in eukaryotes, is highly conserved and evolutionarily stable, and plays an important role in regulating gene expression. miRNAs participate in the regulation of target mRNAs through a variety of mechanisms.[12] An miRNA can participate in the regulation of multiple target genes at the same time, and likewise, each gene can be regulated by more than 1 miRNA. Several human diseases, including cancer and immune-related diseases, are characterized by the abnormal expression of miRNAs.[13] Therefore, miRNAs are useful as potential diagnostic and prognostic markers and therapeutic targets for diseases. Recent studies have revealed that miRNAs are closely related to the disease progression of MS. For example, Junker et al analyzed the expression levels of 365 kinds of mature miRNAs in white matter samples from MS lesions and found that miRNA dysregulation reduces CD47 levels in the brain and drives further disease progression.[14] In addition, Du et al demonstrated that miR-326 participates in MS formation by affecting multiple target genes.[15] In summary, miRNAs are involved in the pathogenesis of MS, and multiple miRNAs are abnormally regulated in brain lesions, body fluids, as well as in serum, plasma, and blood cells of MS patients. The question remains, which miRNAs and genes are MS-specific markers.
With the development of high-throughput analysis, a growing number of studies have applied high-throughput techniques to reveal the molecular mechanisms underlying MS occurrence and progression. However, little attention has been paid to the interaction between differentially expressed miRNAs (DEMs) and differentially expressed genes (DEGs) associated with the pathogenesis of MS. The purpose of this study was to screen out key miRNAs and target genes related to MS by applying high-throughput methods to public datasets. The resulting miRNA-mRNA regulatory network may provide new targets for the diagnosis and treatment of MS and allow a better understanding of MS pathogenesis in the future. The results of our study may provide significant insight in the diagnosis and therapeutic treatment of MS.
2. Material and methods
2.1. Microarray dataset
The MS-related microarray dataset (miRNA and mRNA) was searched using the Gene Expression Omnibus (GEO) database,[16] which is the largest, fully public gene expression resource. The gene chip data were acquired
-
1.
from the human miRNA or mRNA expression data and
-
2.
from MS samples and normal specimens.
Analysis was implemented using a sufficient sample size (no less than 10). From this, miRNA and mRNA expression datasets, GSE17846 and GSE21942, respectively, were downloaded.
The microarray data of GSE17846 deposited by Keller et al[17] included total blood samples from 20 patients with MS and 21 healthy controls. The platform used was GPL GPL9040, febit Homo Sapiens miRBase 13.0. The mRNA expression profiling GSE21942 based on the GPL570 platform was performed following Kemppinen et al.[18] Data were derived from 14 subjects with MS and 15 healthy controls.
2.2. Analysis and identification of DEMs and DEGs
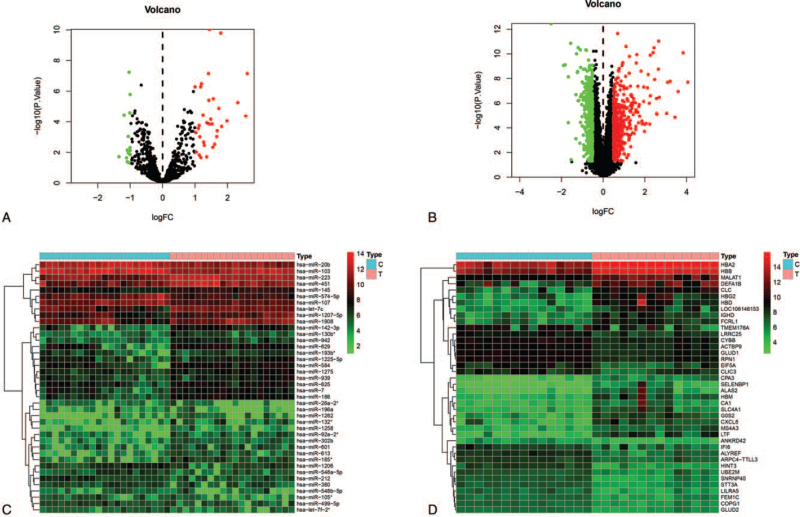
DEMs and DEGs between patients with MS and healthy controls were identified using the linear models for microarray data (LIMMA) method[19] in R 4.04 software (https://www.r-project.org/). Statistical methods were analyzed using unpaired Student t test and Wilcoxon test. The cutoff criteria were |log FC| > 1 and P < .05 to identify DEMs and DEGs. DEGs and DEMs are visualized on volcanic and heat maps drawn using R.
2.3. Enrichment analyses of DEMs and DEGs
Gene ontology (GO) and Kyoto Encyclopedia of Genes and Genomes (KEGG) analyses of the DEMs were conducted using FunRich 3.1.3 software (http://www.funrich.org/).[20] The ClusterProfiler package[21] within R 4.04 software was used to perform functional enrichment analysis of DEGs. Statistical significance was set at P < .05.
2.4. Protein–protein interaction (PPI) network construction and hub gene identification
DEGs were entered into the search tool for the retrieval of interacting genes database[22] to construct a PPI network and screen out the key genes. Subsequently, Cytoscape software was used to visually analyze the PPI network results.
The Molecular Complex Detection plugin in Cytscape software was used to identify the PPI core module, according to the following nodes: score cutoff = 0.2, degree cutoff = 2, maximum depth = 100, k-core = 2 as the module selection criteria. A score of ≥5 was set as the threshold. The degree of network topological features was determined using the cytoHubba[23] plugin in Cytoscape software to screen the hub genes.
2.5. Hub gene validation
Another dataset, GSE43591[24] ([HG-U133_Plus_2] Affymetrix Human Genome U133 Plus 2.0 Array), which included 20 tissue samples (10 MC samples and 10 control samples), was downloaded from the GEO database. We used this dataset to validate the expression status of the hub genes and perform ROC curve analysis using the “pROC” R packages in R 4.04 software. Statistical significance was set at P < .05.
2.6. Construction of the miRNA–mRNA regulatory network
Funrich 3.13 software[25] was used to predict the target genes associated with DEMs. We determined the intersection between the predicted miRNA target genes and DEGs in GSE21942. The miRNA-mRNA regulatory network was constructed and visualized using Cytoscape software.
3. Results
3.1. Identification of DEGs and DEMs
Based on the cutoff criteria, 47 DEMs (33 upregulated and 14 downregulated) were identified in the gene chip GSE17846 (Fig. 1A). In total, 843 genes were identified by GSE21942 microarray, among which 441 DEGs were upregulated and 402 were downregulated (Fig. 1B). The top 10 dysregulated DEMs and DEGs are summarized in Table 1. The hierarchical heat map shows that the DEMs (Fig. 1C) and DEGs (Fig. 1D) are well-categorized into the MS and control groups.
Figure 1.
Expression profiles of DEMs and DEGs. (A) Volcano plot of differentially expressed miRNAs. The red dot represents upregulated miRNAs and the green dot represents downregulated miRNAs. (B) Volcano plot of differentially expressed mRNAs. The red dot represents upregulated mRNAs and green dot represents downregulated mRNAs. (C) Heat map of DEMs in the MS and control groups. (D) Heat map of DEGs in the MS and control groups. DEMs = differentially expressed miRNAs, DEGs = differentially expressed gene, MS = multiple sclerosis.
Table 1.
Top 10 upregulated and downregulated differentially expressed genes and miRNAs.
| miRNAs | mRNAs | ||||
| miRNA | logFC | P value | mRNAs | logFC | P value |
| hsa-miR-142-3p | 2.609188549 | 7.09E-08 | HBD | 4.058817401 | 1.94E-08 |
| hsa-miR-629 | 2.564220483 | 4.19E-05 | LTF | 3.835032846 | 8.09E-11 |
| hsa-miR-185∗ | 2.318755302 | 5.51E-06 | HBG2 | 3.593512312 | 1.14E-07 |
| hsa-miR-613 | 1.985425245 | 8.64E-05 | DEFA1B | 3.443664631 | 1.39E-05 |
| hsa-miR-584 | 1.821268166 | .000198891 | CLC | 3.215168151 | 1.66E-08 |
| hsa-miR-186 | 1.793679289 | 1.60E-10 | HBM | 3.089156026 | 2.04E-08 |
| hsa-miR-302b | 1.733721334 | 1.33E-05 | ALAS2 | 3.044324306 | 6.72E-06 |
| hsa-miR-1258 | 1.682789641 | .000382574 | CXCL8 | 2.694433098 | 3.33E-07 |
| hsa-miR-92a-2∗ | 1.669362114 | .000932554 | CPA3 | 2.662169046 | 9.09E-12 |
| hsa-miR-132∗ | 1.606036456 | .00295529 | G0S2 | 2.649149284 | 1.72E-09 |
| hsa-miR-26a-2∗ | −1.344272883 | .01898761 | HINT3 | −2.498575781 | 3.46E-13 |
| hsa-miR-574-5p | −1.186307164 | 3.70E-05 | SNRNP40 | −1.89903928 | 8.64E-10 |
| hsa-miR-105∗ | −1.109644808 | .022432175 | ALYREF | −1.820692546 | 7.69E-10 |
| hsa-miR-499-5p | −1.088335472 | .006977952 | LILRA5 | −1.669184968 | 7.07E-09 |
| hsa-miR-548b-5p | −1.084736063 | .040853116 | EIF5A | −1.668973269 | 3.80E-05 |
| hsa-miR-212 | −1.058536226 | .000896705 | STT3A | −1.555236553 | 1.38E-11 |
| hsa-miR-380 | −1.057442438 | .010781429 | TMEM176A | −1.535312092 | .039409455 |
| hsa-miR-196a | −1.039155744 | .047062355 | IFI6 | −1.308835288 | .000763724 |
| hsa-miR-20b | −1.034173079 | 5.78E-08 | UBE2M | −1.30404193 | 2.03E-07 |
| hsa-miR-103 | −1.011094128 | 2.63E-05 | COPG1 | −1.275539446 | 9.80E-11 |
3.2. GO and KEGG pathway enrichment of DEMs
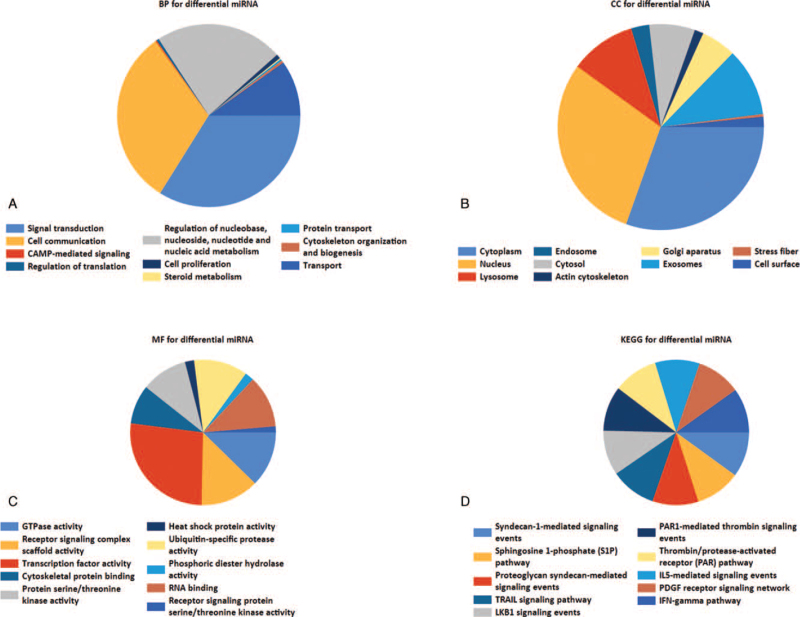
GO enrichment analysis of DEMs shows that in terms of biological processes (BP), the DEMs were mainly enriched in signal transduction, cell communication, regulation of nucleobases, nucleosides, nucleotides, and nucleic acid metabolism (Fig. 2A). In terms of cellular components (CC), DEMs were mainly enriched in the cytoplasm and nucleus (Fig. 2B). In terms of molecular functions (MF), the DEMs were mainly enriched in transcription factor activities and GTPase activities (Fig. 2C). KEGG functional enrichment analysis showed that the DEMs were enriched in proteoglycan syndecan-mediated signaling events, TRAIL signaling pathways, and sphingosine 1-phosphate pathways (Fig. 2D).
Figure 2.
GO and KEGG functional enrichment analysis of DEMs. (A) Biological process for differential miRNA. (B) Cellular component for differential miRNA. (C) Molecular function for differential miRNA. (D) KEGG pathway of differential miRNAs. GO = gene ontology, KEGG = Kyoto Encyclopedia of Genes and Genomes, DEMs = differentially expressed miRNAs.
3.3. GO and KEGG pathway enrichment of DEGs
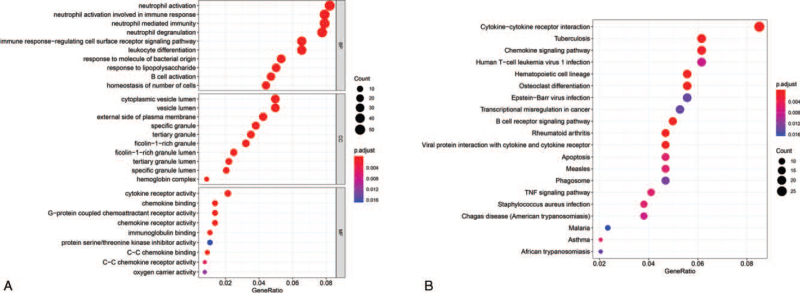
Within the BP functional group, DEGs were mainly enriched in neutrophil activation, neutrophil activation involved in immune response, and neutrophil-mediated immunity. In the CC function group, DEGs were mainly enriched in specific granules, tertiary granule lumens, and tertiary granules. DEGs were mainly enriched in chemokine binding, G-protein coupled chemoattractant receptor activity, and chemokine receptor activity in the MF functional group (Fig. 3A). In addition, KEGG pathway analysis (Table 2) showed that the DEGs were mainly enriched in cytokine-cytokine receptor interaction, tuberculosis, and chemokine signaling pathways (Fig. 3B).
Figure 3.
GO and KEGG functional enrichment analysis of DEGs. (A) GO functional and (B) KEGG pathway analyses of the differentially expressed mRNAs. GO = gene ontology, KEGG = Kyoto Encyclopedia of Genes and Genomes.
Table 2.
Top 5 GO terms and pathways enrichment analysis of DEGs (P < .05).
| Ontology | ID | Description | P value | Genes |
| BP | GO:0042119 | neutrophil activation | 1.64E-12 | HBB/MS4A3/LTF/APAF1/CYBB/TCN1/PTPRJ/ALDOA/CTSZ/CAMP/NPC2/CXCL8/CHI3L1/FCER1G/OSTF1/MMP25/S100A11/GSN/FCAR/FPR2/GNS/ARSB/MIF/DEFA1B/TYROBP/CEACAM8/CYBA/LRG1/TCIRG1/HVCN1/MMP8/SERPINA1/CXCR2/CTSD/MMP9/PRKCD/GSTP1/CRISP3/ORMDL3/SIGLEC9/FCGR2B/KRT1/DNASE1L3/RAB5B/OLFM4/DEFA4/CDA/CST3/CEACAM6/LCN2/GAA/OSCAR/ANXA3/LYZ |
| BP | GO:0002283 | neutrophil activation involved in immune response | 8.40E-12 | HBB/MS4A3/LTF/APAF1/CYBB/TCN1/PTPRJ/ALDOA/CTSZ/CAMP/NPC2/CHI3L1/FCER1G/OSTF1/MMP25/S100A11/GSN/FCAR/FPR2/GNS/ARSB/MIF/DEFA1B/TYROBP/CEACAM8/CYBA/LRG1/TCIRG1/HVCN1/MMP8/SERPINA1/CXCR2/CTSD/MMP9/PRKCD/GSTP1/CRISP3/ORMDL3/SIGLEC9/KRT1/DNASE1L3/RAB5B/OLFM4/DEFA4/CDA/CST3/CEACAM6/LCN2/GAA/OSCAR/ANXA3/LYZ |
| BP | GO:0002446 | neutrophil mediated immunity | 2.10E-11 | HBB/MS4A3/LTF/APAF1/CYBB/TCN1/PTPRJ/ALDOA/CTSZ/CAMP/NPC2/CHI3L1/FCER1G/OSTF1/MMP25/S100A11/GSN/FCAR/FPR2/GNS/ARSB/MIF/DEFA1B/TYROBP/CEACAM8/CYBA/LRG1/TCIRG1/HVCN1/MMP8/SERPINA1/CXCR2/CTSD/MMP9/PRKCD/GSTP1/CRISP3/ORMDL3/SIGLEC9/KRT1/DNASE1L3/RAB5B/OLFM4/DEFA4/CDA/CST3/CEACAM6/LCN2/GAA/OSCAR/ANXA3/LYZ |
| BP | GO:0043312 | neutrophil degranulation | 2.20E-11 | HBB/MS4A3/LTF/APAF1/CYBB/TCN1/PTPRJ/ALDOA/CTSZ/CAMP/NPC2/CHI3L1/FCER1G/OSTF1/MMP25/S100A11/GSN/FCAR/FPR2/GNS/ARSB/MIF/DEFA1B/TYROBP/CEACAM8/CYBA/LRG1/TCIRG1/HVCN1/MMP8/SERPINA1/CXCR2/CTSD/MMP9/PRKCD/GSTP1/CRISP3/ORMDL3/SIGLEC9/KRT1/RAB5B/OLFM4/DEFA4/CDA/CST3/CEACAM6/LCN2/GAA/OSCAR/ANXA3/LYZ |
| BP | GO:0048872 | homeostasis of number of cells | 2.03E-08 | PRDX1/GATA2/ZFP36L1/FCER1G/PDE4B/IL7/HSPA9/P4HTM/ALAS2/AKT1/MIF/ASXL1/TNFAIP3/AHSP/KRAS/LYAR/PMAIP1/TRIM58/CXCR2/EPB42/CCR2/TNFSF14/FAM210B/DMTN/FLT3/BAX/IL7R/CCR7/BPGM |
| CC | GO:0042581 | specific granule | 1.55E-10 | MS4A3/LTF/CYBB/TCN1/PTPRJ/CTSZ/CAMP/CHI3L1/MMP25/FCAR/FPR2/VAMP1/CEACAM8/CYBA/LRG1/HVCN1/MMP8/CTSD/CRISP3/ORMDL3/OLFM4/DEFA4/LCN2/OSCAR/ANXA3/LYZ |
| CC | GO:1904724 | tertiary granule lumen | 7.23E-10 | HBB/LTF/TCN1/ALDOA/CAMP/LRG1/MMP8/CTSD/MMP9/CRISP3/OLFM4/CDA/CST3/OSCAR/LYZ |
| CC | GO:0070820 | tertiary granule | 6.81E-09 | HBB/LTF/CYBB/TCN1/ALDOA/CAMP/FCER1G/FCAR/FPR2/VAMP1/CEACAM8/CYBA/LRG1/TCIRG1/MMP8/CTSD/MMP9/CRISP3/OLFM4/CDA/CST3/GAA/OSCAR/LYZ |
| CC | GO:0035580 | specific granule lumen | 3.78E-08 | LTF/TCN1/CTSZ/CAMP/CHI3L1/LRG1/MMP8/CTSD/CRISP3/OLFM4/DEFA4/LCN2/OSCAR/LYZ |
| CC | GO:0060205 | cytoplasmic vesicle lumen | 9.97E-08 | HBB/LTF/HBA2/APAF1/TCN1/ALDOA/CALR/CTSZ/CAMP/NPC2/CHI3L1/OSTF1/S100A11/GSN/HYOU1/GNS/ARSB/MIF/DEFA1B/LRG1/MMP8/SERPINA1/CTSD/PRKCD/GSTP1/CRISP3/FASLG/OLFM4/DEFA4/CDA/LCN2/OSCAR/LYZ/GNLY |
| MF | GO:0019956 | chemokine binding | 1.57E-07 | CCR3/CXCR4/CXCR2/CCR2/CCR6/ITGB3/CCR5/CXCR3/CCR7 |
| MF | GO:0001637 | G-protein coupled chemoattractant receptor activity | 2.32E-07 | CCR3/CXCR4/CXCR2/CCR2/CCR6/CXCR5/CCR5/CXCR3/CCR7 |
| MF | GO:0004950 | chemokine receptor activity | 2.32E-07 | CCR3/CXCR4/CXCR2/CCR2/CCR6/CXCR5/CCR5/CXCR3/CCR7 |
| MF | GO:0019957 | C-C chemokine binding | 4.84E-07 | CCR3/CXCR4/CCR2/CCR6/CCR5/CCR7 |
| MF | GO:0004896 | cytokine receptor activity | 8.47E-06 | CCR3/IL4R/CSF2RA/CXCR4/CXCR2/CCR2/CCR6/IL13RA1/CXCR5/FLT3/IL7R/CCR5/CXCR3/CCR7 |
| Pathways | hsa04640 | Cytokine-cytokine receptor interaction | 2.55E-08 | CD22/HLA-DPB1/CD24/IL7/HLA-DOB/CD3G/CR2/IL4R/CD1E/MS4A1/CSF2RA/FCER2/CD19/IL1B/CD9/FLT3/IL7R/ITGB3/HLA-DQB1 |
| Pathways | hsa04662 | Tuberculosis | 4.24E-08 | GSK3B/LILRA5/CD22/RASGRP3/AKT1/CR2/BLNK/CD79B/NFKBIA/KRAS/CD72/CD79A/CD19/JUN/FCGR2B/LILRA4/FOS |
| Pathways | hsa05323 | Chemokine signaling pathway | 1.54E-06 | CXCL8/ICAM1/HLA-DPB1/ATP6V0D1/ATP6V1B2/HLA-DOB/ACP5/ATP6AP1/TCIRG1/JUN/IL1B/LTB/IL23A/IFNG/FOS/HLA-DQB1 |
| Pathways | hsa04380 | Human T-cell leukemia virus 1 infection | 1.69E-06 | LILRA5/IRF9/TNFRSF1A/ACP5/AKT1/TYROBP/BLNK/NFKBIA/CYBA/JUNB/JUN/FCGR2B/FOSL2/IL1B/LILRA4/IFNG/ITGB3/OSCAR/FOS |
| Pathways | hsa04061 | Hematopoietic cell lineage | 4.16E-06 | CCR3/CXCL8/TNFRSF1A/TNFRSF10A/TNFRSF10C/CXCR4/CXCR2/CCR2/TNFSF14/CCR6/CXCR5/CCR5/CXCR3/CCR7/XCL2/XCL1 |
3.4. PPI network construction and hub gene identification
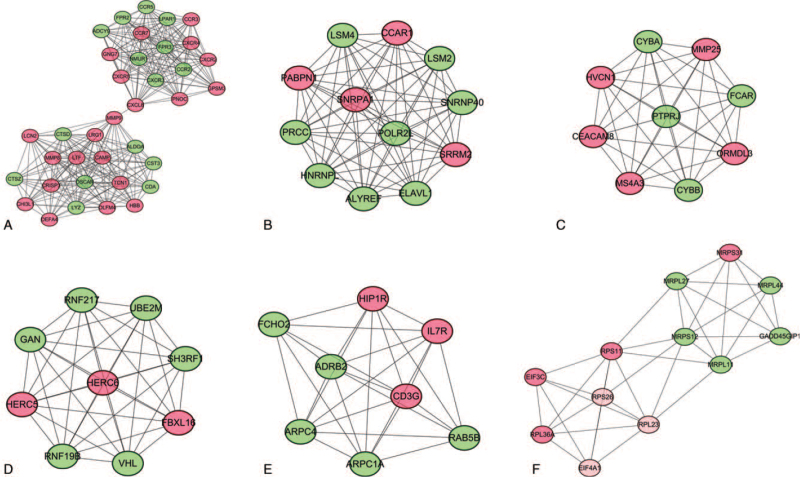
Using the selected DEGs, a PPI network containing 343 nodes (155 upregulated and 188 downregulated) and 1004 interacting pairs was constructed. Six highly interconnected modules that satisfied a score ≥5 were selected from the whole PPI network (Fig. 4). Then, using the “Degree algorithm” of the CytoHubba plugin to further analyze the PPI, 10 key genes, JUN, FPR2, AKT1, POLR2L, LYZ, CXCL8, HBB, CST3, CTSZ, and MMP9, were obtained. Among these, the hub genes FPR2, GNG7, CTSD, LYZ, CXCL8, HBB, CST3, CTSZ, and MMP9 were included in module 1, and the hub gene POLR2L was included in module 2. These 10 genes may be particularly relevant to MS.
Figure 4.
Top 6 modules in the protein–protein interaction network for DEGs. (A) Module 1. (B) Module 2. (C) Module 3. (D) Module 4. € Module 5. (F) Module 6. Nodes represent DEGs. Edges stand for the regulation association between nodes. Red and green nodes represent upregulated and downregulated genes, respectively. DEGs = differentially expressed gene.
Subsequently, functional annotation of the genes in each module was performed. KEGG enrichment analysis (Table 3) demonstrated that in module 1, FPR2 was enriched in Staphylococcus aureus infection, LYZ was enriched in salivary secretion, and CXCL8 was enriched in viral protein interaction with cytokines and cytokine receptors, chemokine signaling pathways, and cytokine-cytokine receptor interactions. No remaining hug genes were found in the KEGG pathway.
Table 3.
KEGG pathway analysis of genes in modules.
| Ontology | ID | Description | P value | Genes |
| Pathways | hsa04061 | Viral protein interaction with cytokine and cytokine receptor | 3.25E-08 | CCR5/CCR2/CXCR3/CXCR2/CXCL8/CXCR4/CCR3/CXCR5/CCR7 |
| Pathways | hsa04062 | Chemokine signaling pathway | 8.08E-08 | CCR5/CCR2/CXCR3/CXCR2/CXCL8/ADCY9/CXCR4/CCR3/GNG7/CXCR5/CCR7 |
| Pathways | hsa04060 | Cytokine-cytokine receptor interaction | 4.12E-05 | CCR5/CCR2/CXCR3/CXCR2/CXCL8/CXCR4/CCR3/CXCR5/CCR7/IL7R |
| Pathways | hsa03010 | Ribosome | .000106708 | RPL36A/MRPS12/RPS11/RPS26/MRPL11/MRPL27/RPL23 |
| Pathways | hsa04970 | Salivary secretion | .000456702 | LYZ/CST3/ADCY9/CAMP/ADRB2 |
| Pathways | hsa05150 | Staphylococcus aureus infection | .00061457 | FPR2/FPR3/DEFA4/CAMP/FCAR |
| Pathways | hsa05163 | Human cytomegalovirus infection | .001109677 | CCR5/CXCR2/CXCL8/ADCY9/CXCR4/CCR3/GNG7 |
3.5. Hub gene validation
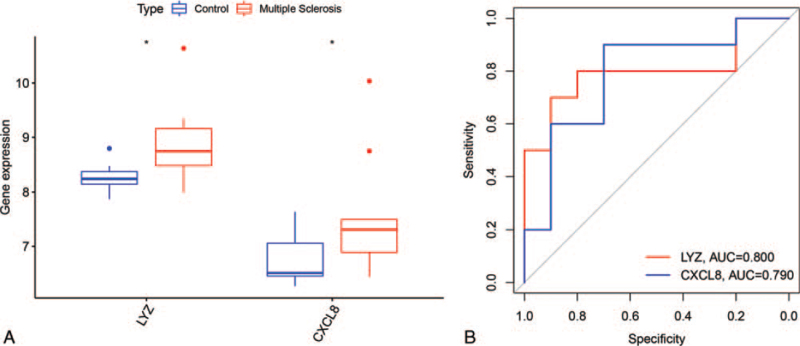
To verify the robustness of the hub genes, R software (https://www.r-project.org/) was used to screen the DEGs between MS samples and normal samples in another dataset, GSE43591. We overlapped the DEGs of GSE43591 and the hub genes and found that only 2 genes (LYZ and CXCL8) were present as both DEGs and hub genes. LYZ and CXCL8 were both highly expressed in the MS samples (Fig. 5A). The area under the curve of LYZ and CXCL8 was 0.800 and 0.790, respectively (Fig. 5B).
Figure 5.
Validation of the 2 hub genes. (A) control indicates normal group samples. ∗P < .05 vs the control. (B) The area under the curve of 2 hub genes for MS vs control ranges from 0.790 to 0.800. MS = multiple sclerosis.
3.6. Construction of an miRNA-mRNA regulatory network
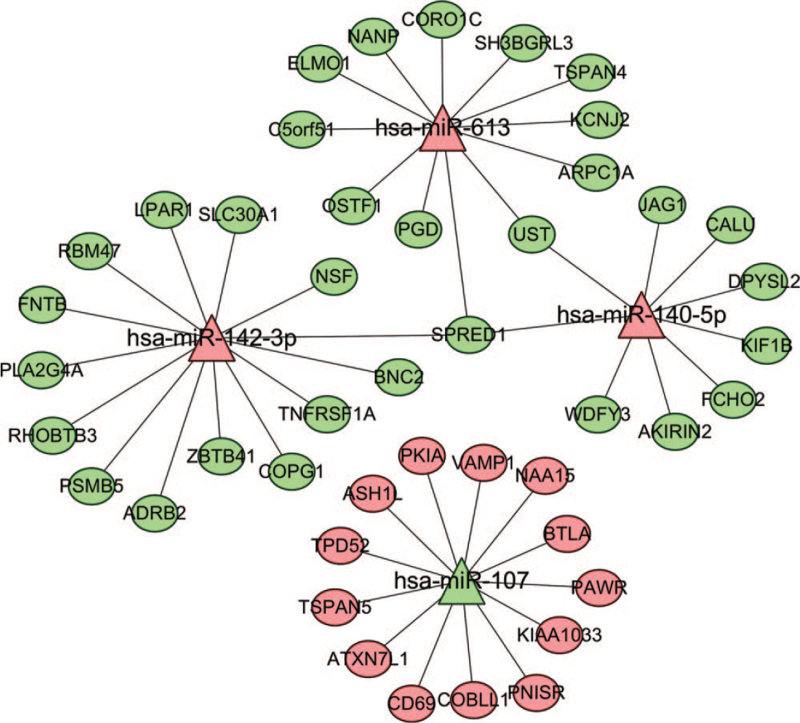
For 4 of the 47 DEMs, 1161 differentially expressed target genes were predicted. The target gene mRNAs in common between the FunRich software predictions and the DEGs in GSE21942 were then used to construct the miRNA-mRNA regulatory network. This constructed network included 48 miRNA-mRNA pairs between the 4 miRNAs and 45 mRNAs (Fig. 6).
Figure 6.
Regulatory network of miRNA–mRNA. The oval node represents mRNA, the triangle node represents miRNA, the line represents the targeted regulation relationship between them, the green represents the downregulation of miRNA or mRNA in MS samples, and the red represents the upregulation of miRNA or mRNA in MS samples. MS = multiple sclerosis.
Among the 4 miRNAs, only 1 miRNA (hsa-miR-107) was downregulated in MS peripheral blood, whereas the other miRNAs (hsa-miR-142-3p, hsa-miR-140-5p, and hsa-miR-613) were upregulated. Using the CentiScaPe app in Cytoscape software, we found that hsa-miR-142-3p, hsa-miR-107, hsa-miR-140-5p, and hsa-miR-613 played important roles in the miRNA-mRNA regulatory network. hsa-miR-142-3p was negatively regulated by multiple mRNAs, including ADRB2, BNC2, COPG1, FNTB, LPAR1, NSF, PLA2G4A, PSMB5, RBM47, RHOBTB3, SLC30A1, SPRED1, TNFRSF1A, and ZBTB41. hsa-miR-107 was negatively regulated by multiple mRNAs, including ASH1L, ATXN7L1, BTLA, CD69, COBLL1, KIAA1033, NAA15, PAWR, PKIA, PNISR, TPD52, TSPAN5, and VAMP1. hsa-miR-140-5p was negatively regulated by multiple mRNAs, including AKIRIN2, CALU, DPYSL2, FCHO2, JAG1, KIF1B, SPRED1, UST, and WDFY3. Finally, hsa-miR-613 was negatively regulated by multiple mRNAs, including ARPC1A, C5orf51, CORO1C, ELMO1, KCNJ2, NANP, OSTF1, PGD, SH3BGRL3, SPRED1, TSPAN4, and UST. Given these observations, SPRED1 was to be the most versatile and significant mRNA regulator in the network, as it was involved in the regulation of 3 different miRNAs: hsa-miR-142-3p, hsa-miR-140-5p, and hsa-miR-613.
4. Discussion
MS is caused by demyelination or axonal degradation resulting from the inflammatory response of the immune system to the CNS and leads to neurological dysfunction corresponding to the injury, with high recurrence and disability rates.[26] As the diagnosis of MS mainly relies on clinical manifestations and magnetic resonance imaging examinations, there is currently no specific diagnosis for early-stage MS. Indeed, MS is a disease caused by multiple biological systems and the result of complex factors, characterized by intricate interactions between genes and signaling pathways. To elucidate the pathogenesis of MS, we used high-throughput data analysis techniques to comprehensively analyze the biological functions and interactions of MS-related genes.
In this study, critical mRNAs and miRNAs were identified based on a series of bioinformatics analyses, including PPI network construction, functional and pathway enrichment analysis, module analysis, and miRNA-mRNA regulatory pair prediction. Here, topology analysis identified 10 DEGs as hub genes (JUN, FPR2, AKT1, POLR2L, LYZ, CXCL8, HBB, CST3, CTSZ, and MMP9), which may play an important role in the development of MS. Additionally, by analyzing the miRNA-mRNA regulatory network, we found that there were 4 miRNAs (hsa-miR-142-3p, hsa-miR-107, hsa-miR-140-5p, and hsa-miR-613) in the network that may be potential biomarkers for MS initiation and progression.
Studies have confirmed that some of these hub genes are closely related to the occurrence of MS. CXCL8 is a member of the CXC chemokine family and is a major mediator of the inflammatory response. Bartosik-Psujek et al found that CXCL8 levels were higher in the serum of MS patients than in that of healthy people[27]; similarly, in our study, we found that CXCL8 was upregulated in MS. HBB was found to be upregulated in mitochondrial fractions isolated from MS cortex and is thought to be involved in linking neuronal energetics to epigenetic changes in histones; moreover, it might provide neuroprotection in MS by supporting neuronal metabolism.[28,29] In addition, accumulating evidence suggests that CST3 plays an important role in immunity, cellular oxidative stress, inflammatory response, and MS pathogenesis.[30,31] Euan et al found that the lack of cathepsin Z (CTSZ) reduces the efficiency of IL-1β secretion by antigen-presenting cells, which in turn reduces the ability of mice to produce Th17 responses, which is a key step in the pathogenesis of MS.[32] Finally, a large number of experiments have confirmed that MMP9 plays a key role in the development and progression of MS and can be used as an important monitoring index for the severity and outcome of the disease.[33–35] However, the remaining hub genes identified here have not been studied in relation to MS and, thus, present an interesting direction for further research.
Additionally, analysis of the miRNA-mRNA regulatory network revealed 4 miRNAs (hsa-miR-142-3p, hsa-miR-107, hsa-miR-140-5p, and hsa-miR-613) that may be critical for MS pathogenesis. In recent years, a large number of studies on MS have revealed that miRNAs are closely related to the disease progression of MS. Indeed, miRNAs are involved in the pathology of MS, and various miRNAs exhibit abnormal expression in brain lesions, body fluids, serum, plasma, and blood cells of MS patients.[36–39] Arruda et al found that the expression of miR-16, miR-155, and miR-142-3p is higher in CD4+ and CD8+ T cells in MS patients than in controls.[40] Keller et al[17] detected the downregulation of hsa-miR-107 and upregulation of hsa-miR-613 in blood cells of MS patients compared with controls. Regev et al found significant differences in serum hsa-miR-140-5p levels between the normal population and MS patients and suggested that hsa-miR-140-5p could be used as a biomarker for the diagnosis and monitoring of MS.[41] Thus, it is reasonable to conclude that these miRNAs are involved in the pathogenesis of MS.
In-depth analysis of the functional and pathway enrichment of DEGs and DEMs revealed a clear difference in GO functional enrichment. DEMs were mainly enriched in proteoglycan syndecan-mediated signaling events, the TRAIL signaling pathway, and the sphingosine 1-phosphate pathway. Studies have shown that TNF-related apoptosis-inducing ligand (TRAIL) is responsible for immunosuppressive, immunoregulatory, and immune-effector functions and inhibits T cell activation, cell cycle progression, and interferon and interleukin-4 production.[42] Sphingosine 1-phosphate (S1P), a sphingolipid metabolite, is found in a wide variety of cells and is involved in pathophysiological processes such as apoptosis, neurogenesis, immunosuppression, and injury repair in the CNS.[43] S1P is involved in the occurrence and development of MS, and S1P receptor modulators can be used to treat patients with MS.[44] In contrast, DEGs were mainly enriched in cytokine–cytokine receptor interactions, tuberculosis, and chemokine signaling pathways. Chemokines, chemotactic cytokines that can induce inflammatory cells to infiltrate and aggregate to specific sites, play an important role in the development of the inflammatory response.[45] In particular, chemokine-induced white blood cells enter the CNS and produce an inflammatory response, promote the generation of demyelinating lesions, and affect the course and progression of MS.[46] Therefore, the chemokine signaling pathway plays an important role in MS.
However, there are some limitations in our study, such as small sample size and lack of experimental verification. Therefore, we still need a large sample size and extensive validation analysis to confirm our hypothesis.
5. Conclusions
Using gene expression microarrays to explore differences in gene expression profiles, 4 miRNAs (hsa-mir-199a-5p, hsa-mir-199b-5p, hsa-mir-532-3p, and hsa-mir-429) and 10 genes (FPR2, GNG7, CTSD, LYZ, CXCL8, HBB, CST3, CTSZ, and MMP9, especially LYZ and CXCL8) were found to be potential biomarkers for the prognosis of MS patients. Through further research on the core genes and miRNAs of MS, the DEGs and DEMs screened in this study may become potential biomarkers and key targets of MS.
Acknowledgments
We acknowledge GEO database for providing their platforms and contributors for uploading their meaningful datasets.
Author contributions
Conceptualization: Zhong-bo Xu, Xin Feng.
Data curation: Xin Feng.
Formal analysis: Zhong-bo Xu, Wei-na Zhu.
Methodology: Zhong-bo Xu, Wei-na Zhu.
Software: Zhong-bo Xu, Xin Feng.
Supervision: Ming-liang Qiu.
Validation: Ming-liang Qiu.
Writing – original draft: Zhong-bo Xu.
Writing – review & editing: Zhong-bo Xu.
Footnotes
Abbreviations: BP = biological process, CC = cellular component, DEG = differentially expressed gene, GEO = gene expression omnibus, GO = gene ontology, KEGG = Kyoto Encyclopedia of Genes and Genomes, MF = molecular function, MS = multiple sclerosis, PPI = protein–protein interaction.
How to cite this article: Xu Zb, Feng X, Zhu Wn, Qiu Ml. Identification of key genes and microRNAs for multiple sclerosis using bioinformatics analysis. Medicine. 2021;100:48(e27667).
The authors have no funding and conflicts of interests to disclose.
The datasets generated during and/or analyzed during the current study are publicly available.
References
- [1].Siffrin V, Vogt J, Radbruch H, Nitsch R, Zipp FJTin. Multiple sclerosis - candidate mechanisms underlying CNS atrophy. Trends Neurosci 2010;33:202–10. [DOI] [PubMed] [Google Scholar]
- [2].Tsang BK, Macdonell R. Multiple sclerosis- diagnosis, management and prognosis. Aust Fam Physician 2011;40:948–55. [PubMed] [Google Scholar]
- [3].Sorensen P, Sellebjerg F, Hartung H, Montalban X, Comi G, Tintoré M. The apparently milder course of multiple sclerosis: changes in the diagnostic criteria. Ther Nat Hist 2020;143:2637–52. [DOI] [PubMed] [Google Scholar]
- [4].Vidal-Jordana A, Montalban XJ, Nco NA. Multiple sclerosis: epidemiologic. Clin Therapeut Aspect 2017;27:195–204. [DOI] [PubMed] [Google Scholar]
- [5].Lemus H, Warrington A, Rodriguez MJNc. Multiple sclerosis: mechanisms of disease and strategies for myelin and axonal repair 2018;36:01–11. [DOI] [PMC free article] [PubMed] [Google Scholar]
- [6].Stadelmann C. Multiple sclerosis as a neurodegenerative disease: pathology, mechanisms and therapeutic implications. Curr Opin Neurol 2011;24:224–9. [DOI] [PubMed] [Google Scholar]
- [7].Quan MY, Song XJ, Liu HJ, et al. Amlexanox attenuates experimental autoimmune encephalomyelitis by inhibiting dendritic cell maturation and reprogramming effector and regulatory T cell responses. J Neuroinflammation 2019;16:52. [DOI] [PMC free article] [PubMed] [Google Scholar]
- [8].Sospedra M, Martin R. Immunology of multiple sclerosis. Semin Neurol 2016;36:115–27. [DOI] [PubMed] [Google Scholar]
- [9].Yeung MSY, Djelloul M, Steiner E, et al. Publisher correction: dynamics of oligodendrocyte generation in multiple sclerosis. Nature 2019;566:E9. [DOI] [PubMed] [Google Scholar]
- [10].Kasper LH, Shoemaker J. Multiple sclerosis immunology: the healthy immune system vs the MS immune system. Neurology 2010;74: (Suppl 1): S2–8. [DOI] [PubMed] [Google Scholar]
- [11].Shukla GC, Singh J, Barik S. MicroRNAs: processing, maturation, target recognition and regulatory functions. Mol Cell Pharmacol 2011;3:83–92. [PMC free article] [PubMed] [Google Scholar]
- [12].Bartel DP. MicroRNAs: target recognition and regulatory functions. Cell 2009;136:215–33. [DOI] [PMC free article] [PubMed] [Google Scholar]
- [13].Lu J, Getz G, Miska EA, et al. MicroRNA expression profiles classify human cancers. Nature 2005;435:834–8. [DOI] [PubMed] [Google Scholar]
- [14].Junker A, Krumbholz M, Eisele S, et al. MicroRNA profiling of multiple sclerosis lesions identifies modulators of the regulatory protein CD47. Brain 2009;132(Pt 12):3342–52. [DOI] [PubMed] [Google Scholar]
- [15].Du C, Liu C, Kang J, et al. MicroRNA miR-326 regulates TH-17 differentiation and is associated with the pathogenesis of multiple sclerosis 2009;10:1252–9. [DOI] [PubMed] [Google Scholar]
- [16].Edgar R, Domrachev M, Lash AE. Gene expression omnibus: NCBI gene expression and hybridization array data repository. Nucleic Acids Res 2002;30:207–10. [DOI] [PMC free article] [PubMed] [Google Scholar]
- [17].Keller A, Leidinger P, Lange J, et al. Multiple sclerosis: microRNA expression profiles accurately differentiate patients with relapsing-remitting disease from healthy controls. PLoS One 2009;4:e7440. [DOI] [PMC free article] [PubMed] [Google Scholar]
- [18].Kemppinen AK, Kaprio J, Palotie A, Saarela J. Systematic review of genome-wide expression studies in multiple sclerosis. BMJ Open 2011;1:e000053. [DOI] [PMC free article] [PubMed] [Google Scholar]
- [19].Ritchie ME, Phipson B, Wu D, et al. limma powers differential expression analyses for RNA-sequencing and microarray studies. Nucleic Acids Res 2015;43:e47. [DOI] [PMC free article] [PubMed] [Google Scholar]
- [20].Fonseka P, Pathan M, Chitti SV, Kang T, Mathivanan S. FunRich enables enrichment analysis of OMICs datasets. J Mol Biol 2020;166747. [DOI] [PubMed] [Google Scholar]
- [21].Yu G, Wang L, Han Y, He QJOajoib. clusterProfiler: an R package for comparing biological themes among gene clusters 2012;16:284–7. [DOI] [PMC free article] [PubMed] [Google Scholar]
- [22].Szklarczyk D, Gable AL, Lyon D, et al. STRING v11: protein-protein association networks with increased coverage, supporting functional discovery in genome-wide experimental datasets. Nucleic Acids Res 2019;47(D1):D607–13. [DOI] [PMC free article] [PubMed] [Google Scholar]
- [23].Chin CH, Chen SH, Wu HH, Ho CW, Ko MT, Lin CY. cytoHubba: identifying hub objects and sub-networks from complex interactome. BMC Syst Biol 2014;8: (Suppl 4): S11. [DOI] [PMC free article] [PubMed] [Google Scholar]
- [24].Jernas M, Malmestrom C, Axelsson M, et al. MicroRNA regulate immune pathways in T-cells in multiple sclerosis (MS). BMC Immunol 2013;14:32. [DOI] [PMC free article] [PubMed] [Google Scholar]
- [25].Pathan M, Keerthikumar S, Ang CS, et al. FunRich: an open access standalone functional enrichment and interaction network analysis tool. Proteomics 2015;15:2597–601. [DOI] [PubMed] [Google Scholar]
- [26].Ciccarelli O, Barkhof F, Bodini B, et al. Pathogenesis of multiple sclerosis: insights from molecular and metabolic imaging. Lancet Neurol 2014;13:807–22. [DOI] [PubMed] [Google Scholar]
- [27].Bartosik-Psujek H, Stelmasiak Z. The levels of chemokines CXCL8, CCL2 and CCL5 in multiple sclerosis patients are linked to the activity of the disease. Eur J Neurol 2005;12:49–54. [DOI] [PubMed] [Google Scholar]
- [28].Bamm VV, Henein MEL, Sproul SLJ, Lanthier DK, Harauz G. Potential role of ferric hemoglobin in MS pathogenesis: effects of oxidative stress and extracellular methemoglobin or its degradation products on myelin components. Free Radic Biol Med 2017;112:494–503. [DOI] [PubMed] [Google Scholar]
- [29].Brown N, Alkhayer K, Clements R, et al. Neuronal hemoglobin expression and its relevance to multiple sclerosis neuropathology. J Mol Neurosci 2016;59:01–17. [DOI] [PMC free article] [PubMed] [Google Scholar]
- [30].Nakashima I, Fujinoki M, Fujihara K, et al. Alteration of cystatin C in the cerebrospinal fluid of multiple sclerosis. Ann Neurol 2007;62:197–200. discussion 5. [DOI] [PubMed] [Google Scholar]
- [31].Zi M, Xu Y. Involvement of cystatin C in immunity and apoptosis. Immunol Lett 2018;196:80–90. [DOI] [PMC free article] [PubMed] [Google Scholar]
- [32].Allan ERO, Campden RI, Ewanchuk BW, et al. A role for cathepsin Z in neuroinflammation provides mechanistic support for an epigenetic risk factor in multiple sclerosis. J Neuroinflammation 2017;14:103. [DOI] [PMC free article] [PubMed] [Google Scholar]
- [33].Hamedani SY, Taheri M, Sajjadi E, et al. Up regulation of MMP9 gene expression in female patients with multiple sclerosis. Hum Antibodies 2016;24:59–64. [DOI] [PubMed] [Google Scholar]
- [34].Mirowska-Guzel D, Gromadzka G, Czlonkowski A, Czlonkowska A. Association of MMP1, MMP3, MMP9, and MMP12 polymorphisms with risk and clinical course of multiple sclerosis in a Polish population. J Neuroimmunol 2009;214:113–7. [DOI] [PubMed] [Google Scholar]
- [35].Sabbagh S, Nadeali Z, Dehghani L, et al. Association study between functional polymorphisms of MMP9 gene promoter and multiple sclerosis susceptibility in an Iranian population. Iran J Public Health 2019;48:1697–703. [PMC free article] [PubMed] [Google Scholar]
- [36].Jernås M, Malmeström C, Axelsson M, et al. MicroRNA regulate immune pathways in T-cells in multiple sclerosis (MS) 2013;14:32. [DOI] [PMC free article] [PubMed] [Google Scholar]
- [37].De Santis G, Ferracin M, Biondani A, et al. Altered miRNA expression in T regulatory cells in course of multiple sclerosis. J Neuroimmunol 2010;226:165–71. [DOI] [PubMed] [Google Scholar]
- [38].Haghikia A, Haghikia A, Hellwig K, et al. Regulated microRNAs in the CSF of patients with multiple sclerosis: a case-control study. Neurology 2012;79:2166–70. [DOI] [PubMed] [Google Scholar]
- [39].Siegel SR, Mackenzie J, Chaplin G, Jablonski NG, Griffiths L. Circulating microRNAs involved in multiple sclerosis. Mol Biol Rep 2012;39:6219–25. [DOI] [PubMed] [Google Scholar]
- [40].Arruda LC, Lorenzi JC, Sousa AP, et al. Autologous hematopoietic SCT normalizes miR-16, -155 and -142-3p expression in multiple sclerosis patients. Bone Marrow Transplant 2015;50:380–9. [DOI] [PubMed] [Google Scholar]
- [41].Regev K, Healy BC, Paul A, et al. Identification of MS-specific serum miRNAs in an international multicenter study. Neurol Neuroimmunol Neuroinflamm 2018;5:e491. [DOI] [PMC free article] [PubMed] [Google Scholar]
- [42].Falschlehner C, Schaefer U, Walczak H. Following TRAIL's path in the immune system. Immunology 2009;127:145–54. [DOI] [PMC free article] [PubMed] [Google Scholar]
- [43].Fang Z, Pyne S, Pyne NJ. Ceramide and sphingosine 1-phosphate in adipose dysfunction. Prog Lipid Res 2019;74:145–59. [DOI] [PubMed] [Google Scholar]
- [44].Chun J, Giovannoni G, Hunter SJD. Sphingosine 1-phosphate receptor modulator therapy for multiple sclerosis: differential downstream receptor signalling and clinical profile effects. Drugs 2021;81:207–31. [DOI] [PMC free article] [PubMed] [Google Scholar]
- [45].Cui L, Chu S, Chen NJIi. The role of chemokines and chemokine receptors in multiple sclerosis. Int Immunopharmacol 2020;83:106314. [DOI] [PMC free article] [PubMed] [Google Scholar]
- [46].Ghafouri-Fard S, Honarmand K, Taheri M. A comprehensive review on the role of chemokines in the pathogenesis of multiple sclerosis. Metab Brain Dis 2021;36:375–406. [DOI] [PubMed] [Google Scholar]


