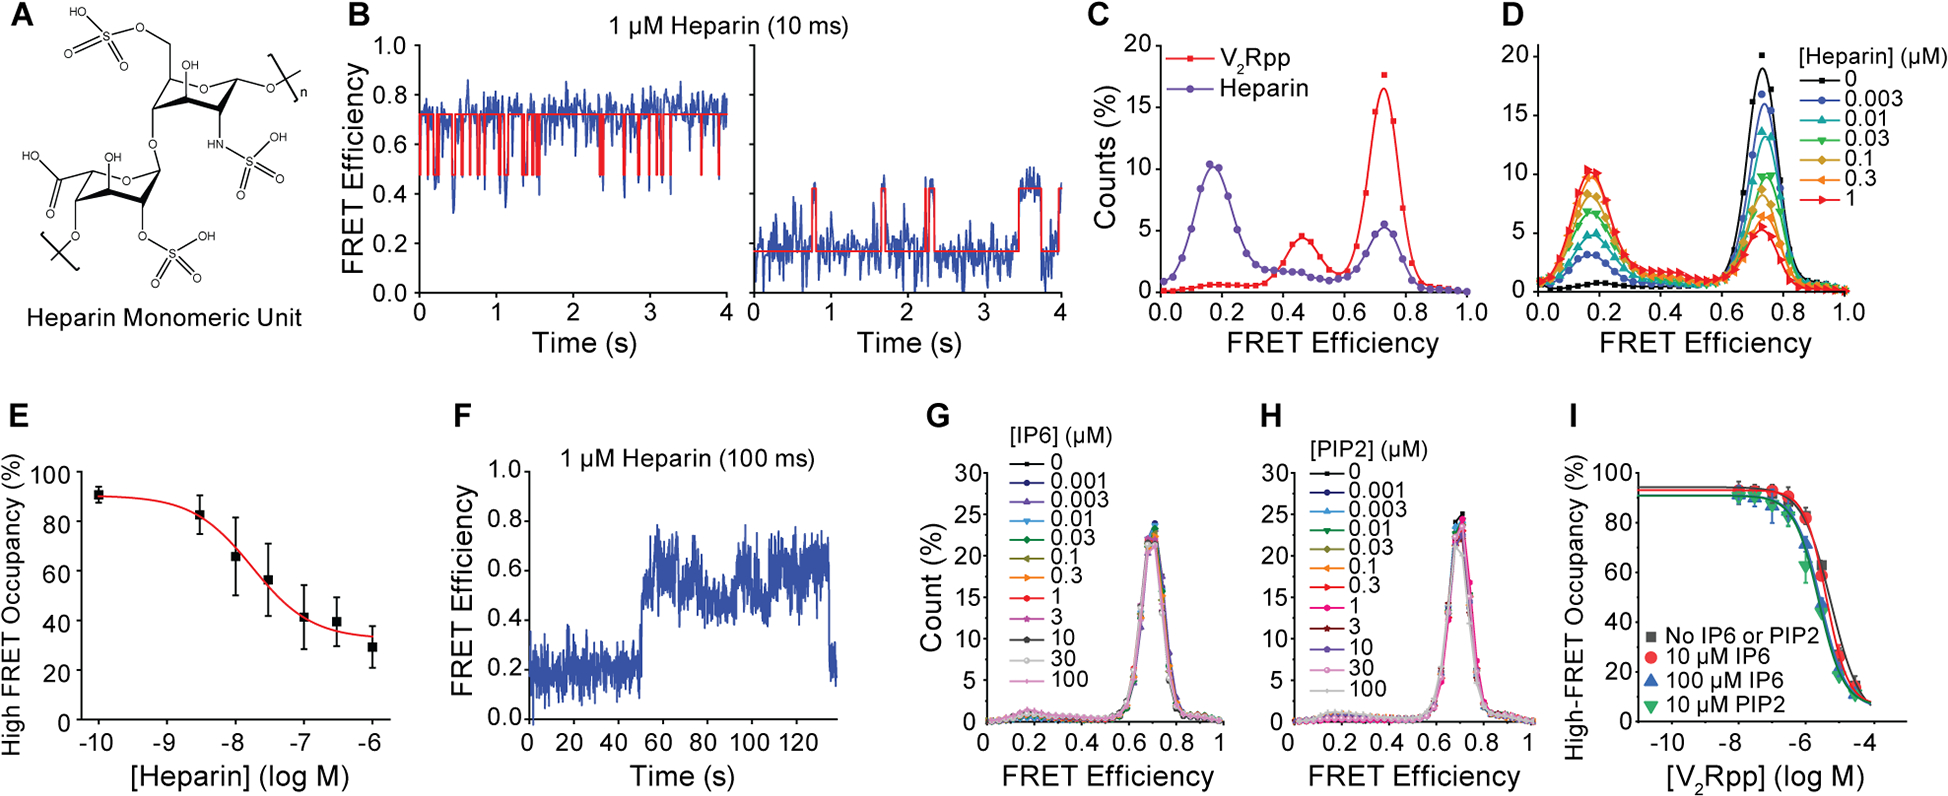
Figure 3. Activation of β-arrestin1 by heparin, IP6 and PIP2.

A, Structure of heparin. B, Representative smFRET traces from experiments imaging βarr1 tail sensor in the presence of 1 μM heparin with 10 ms time resolution. C, Overlay of FRET histograms experiments with 1 μM heparin (purple) and V2Rpp (red). D, FRET histograms and E, high-FRET state occupancy (symbols) from experiments imaging βarr1 tail sensor in the presence of the indicated concentrations of heparin. Line is a fit to a dose-response function (red line) with Hill slope of 1.0 and EC50 of 17 nM. F, Example trace recorded at 100 ms time resolution in the presence of 1 μM heparin showing rare switching between dynamic modes. Error bars, mean ± S.D. of two repeats. G, Population FRET histograms of βarr1 C tail sensor, imaged at 100 ms time resolution, with indicated concentrations of IP6 and H, PIP2. I, Ensemble average high-FRET inactive state occupancy as a function of V2Rpp concentrations in the absence and presence of indicated concentrations of IP6 or PIP2 (symbols) fit to dose-response functions (lines), revealing no substantial change in EC50 values.
