eLife logoLink to eLife
. 2022 Jun 13;11:e75844. doi: 10.7554/eLife.75844

RNA-binding proteins direct myogenic cell fate decisions

Joshua R Wheeler 1,2,3,4,5,, Oscar N Whitney 6,, Thomas O Vogler 2,7,8, Eric D Nguyen 2,9, Bradley Pawlikowski 7, Evan Lester 1,2, Alicia Cutler 7, Tiffany Elston 7, Nicole Dalla Betta 7, Kevin R Parker 10, Kathryn E Yost 10, Hannes Vogel 4, Thomas A Rando 11,12,13, Howard Y Chang 10,14, Aaron M Johnson 9,15, Roy Parker 3,, Bradley B Olwin 7,
Editors: Douglas L Black16, James L Manley17
PMCID: PMC9191894  PMID: 35695839

Abstract

RNA-binding proteins (RBPs), essential for skeletal muscle regeneration, cause muscle degeneration and neuromuscular disease when mutated. Why mutations in these ubiquitously expressed RBPs orchestrate complex tissue regeneration and direct cell fate decisions in skeletal muscle remains poorly understood. Single-cell RNA-sequencing of regenerating Mus musculus skeletal muscle reveals that RBP expression, including the expression of many neuromuscular disease-associated RBPs, is temporally regulated in skeletal muscle stem cells and correlates with specific stages of myogenic differentiation. By combining machine learning with RBP engagement scoring, we discovered that the neuromuscular disease-associated RBP Hnrnpa2b1 is a differentiation-specifying regulator of myogenesis that controls myogenic cell fate transitions during terminal differentiation in mice. The timing of RBP expression specifies cell fate transitions by providing post-transcriptional regulation of messenger RNAs that coordinate stem cell fate decisions during tissue regeneration.

Research organism: Mouse

Introduction

Skeletal muscle is among the longest-lived tissues in the human body, is essential for locomotion, respiration, and longevity, and thus requires constant maintenance (Sharples et al., 2015). Skeletal muscle is comprised of postmitotic myofibers that house resident muscle stem cells (MuSCs), which can repair skeletal muscle following damage (Lepper et al., 2011; Murphy et al., 2011; Sambasivan et al., 2011; Shi and Garry, 2006). MuSCs are typically quiescent, but (Feige et al., 2018) in response to muscle injury, MuSCs activate, proliferate, and then either self-renew or differentiate and fuse to repair myofibers (Baghdadi and Tajbakhsh, 2018; Sincennes et al., 2016).

Single-cell analyses of regenerating muscle demonstrate the rich cellular complexity governing myogenesis and make two key observations (De Micheli et al., 2020; Dell’Orso et al., 2019; Giordani et al., 2019). First, in response to damage, MuSCs exit quiescence and progress through a hierarchical, dynamic myogenic program and either commit to terminal differentiation or self-renew and reacquire a quiescent state. Second, as activated MuSCs progress through myogenesis, MuSCs experience dramatic global changes in gene expression (Barruet et al., 2020). This rapid change in gene expression requires MuSCs to regulate a vast amount of newly transcribed RNA encoding fate-specifying transcription factors and skeletal muscle contractile apparatus constituents, among other myogenic proteins.

RNA is regulated by an arsenal of abundant RNA-binding proteins (RBPs). Although much of the effort to understand the roles of RBPs in myogenesis has focused on specific RBPs associated with disease (Apponi et al., 2011), recent work has identified functions for RBPs not involved in neuromuscular diseases that include (1) maintenance of MuSCs quiescence (de Morrée et al., 2017), (2) MuSC activation and expansion (Cho and Doles, 2017; Farina et al., 2012), (3) myogenic differentiation (Hausburg et al., 2015; Vogler et al., 2018), and (4) MuSC-self-renewal (Chenette et al., 2016; Hausburg et al., 2015).

RBPs regulate RNA splicing, where RNA is targeted and bound by RBPs co-transcriptionally to ensure correct splicing of nascent RNA transcripts (Dassi, 2017; Hentze et al., 2018) where alternative RBP-mediated splicing yields a rich diversity of RNA isotypes critical for translating proteins that regulate myogenesis (Brinegar et al., 2017; Imbriano and Molinari, 2018; Nakka et al., 2018; Weskamp et al., 2020). The loss of specific RBPs and the resultant effects on splicing affect MuSC quiescence, MuSC activation, and differentiation; mutations in RBPs are associated with muscular dystrophies and age-related neuromuscular diseases (Calado et al., 2000; Hinkle et al., 2019; Xue et al., 2020; Yu et al., 2009). Amyotrophic lateral sclerosis, inclusion body myopathy, and muscular dystrophies are caused by RBP mutations, leading to progressive muscle degeneration (Lukong et al., 2008; Xue et al., 2020). In these disorders, disease-causing mutations frequently impair RBP splicing function (Cortese et al., 2014; Singh et al., 2018; Taylor et al., 2016). Restoring RBP splicing function prevents or delays the onset of these disorders, identifying splicing dysregulation as a key driver of pathology (Naryshkin et al., 2014; Scotti and Swanson, 2016; Wirth et al., 2020).

Even though RBPs are essential for skeletal muscle regeneration and are frequently mutated in neuromuscular disease, little is known regarding the mechanisms regulating the timing of RBP function during myogenesis or the mechanisms by which RBPs influence myogenic cell fate decisions. Using single-cell RNA-sequencing, we examined temporal RBP expression of several neuromuscular disease-associated RBPs in MuSCs during myogenic differentiation to clarify the timing of RPB expression during muscle regeneration and identify networks of RBPs involved in myogenic cell fate transitions.

Results

Myogenic cell fate transitions revealed by single-cell RNA-sequencing

Skeletal muscle has a remarkable ability to repair following injury mediated by MuSCs, which activate, proliferate, and differentiate to produce the majority of myonuclei by 4 days post injury (dpi) (De Micheli et al., 2020; Cuter et al., 2019). During this time, MuSCs self-renew to replenish the quiescent MuSC stem cell population as demonstrated by DNA-lineage-tracing experiments (De Micheli et al., 2020; Cuter et al., 2019). MuSCs undergo dramatic transcriptional changes during myogenesis, of which the resultant RNA is regulated by RBPs. Yet, the timing and function of RBPs during myogenesis remain understudied. Here, we sought to define RBP function in individual cells during MuSC activation, proliferation, differentiation, and self-renewal.

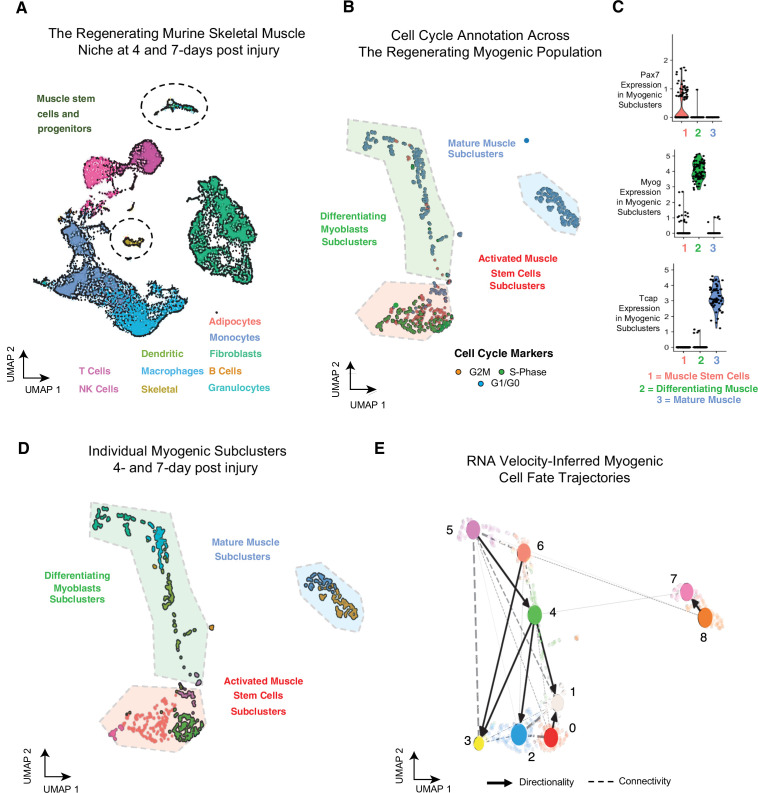
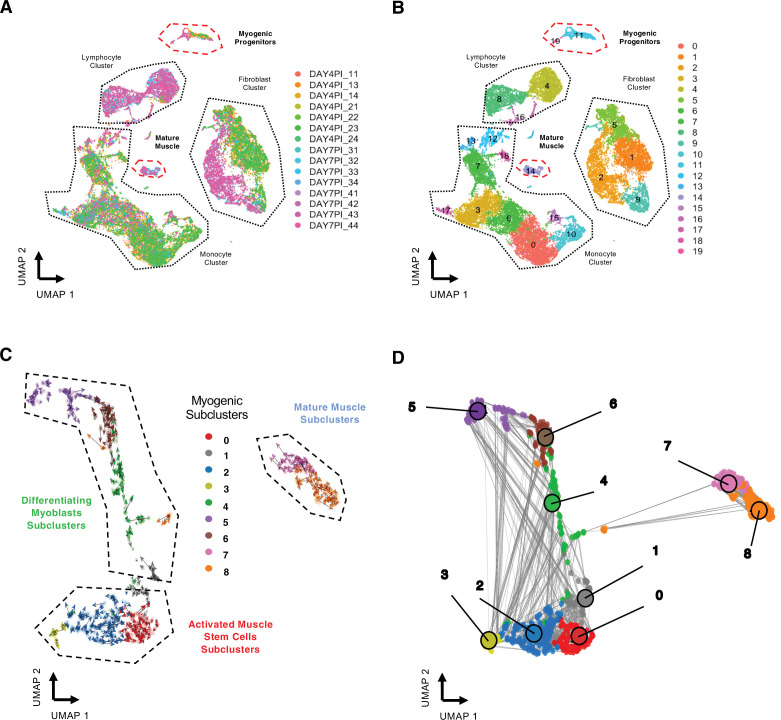
We performed single-cell RNA-sequencing on regenerating skeletal muscle at 4 dpi and 7 dpi following an injury by BaCl2 injection into adult mouse tibialis anterior (TA) muscles (Caldwell et al., 1990). We observed infiltration of immune cells, dynamic cycling of individual fibro/adipogenic progenitors (FAPs), and a robust myogenic progenitor population in the sequencing datasets (Figure 1A, Figure 1—figure supplement 1A and B). Sequencing dataset analyses show strong reproducibility amongst biological replicates (Figure 1—figure supplement 1A and B) defining the cellular composition of regenerating skeletal muscle. The cellular constituents we identified overlap with recently published muscle single-cell RNA-sequencing datasets (Barruet et al., 2020; De Micheli et al., 2020; Dell’Orso et al., 2019). Thus, acutely injured muscle undergoes similar cellular regeneration irrespective of the inciting injury.

Figure 1. Single-cell analysis reveals myogenic cell fate transitions in regenerating skeletal muscle.

(A) Single-cell atlas of regenerating skeletal muscle at 4 and 7 days post injury (dpi). (B) Cell cycle scoring in regenerating myogenic subclusters. (C) Violin plots showing expression of myogenic markers of regeneration per myogenic clusters. (D) Myogenic subclusters comprising the regenerating myogenic cellular population. (E) RNA velocity-inferred myogenic cell fate trajectories. See also Figure 1—figure supplement 1.

Figure 1.

Figure 1—figure supplement 1. Related to Figure 1.

Figure 1—figure supplement 1.

(A) Uniform manifold approximation and projection (UMAP) of regenerating skeletal muscle at 4 and 7 days post injury (dpi) with colored individual sequencing libraries (B) and by individual cellular clusters. (C) RNA velocity of myogenic subclusters. (D) Velocity-inferred cell–cell connectivity between myogenic subclusters.

Gene expression and cell cycle scoring analysis of the myogenic cells reveals three dominant myogenic clusters: (i) a proliferative Pax7-positive MuSC population, (ii) a differentiating Myogenin (Myog)-positive population exiting cell cycle, and (iii) a postmitotic, terminally differentiating muscle population expressing sarcomeric mRNAs (Figure 1B and C, Figure 1—figure supplement 1C). These dominant myogenic populations are further subclassified into nine subclusters that define the regenerating myogenic population (Figure 1D) and may represent cells at various points along a more continuous differentiation trajectory or may reflect specific cell state transition points during myogenesis.

We next identified temporal dynamics between each of the nine myogenic subclusters using RNA velocity (Bergen et al., 2020), which infers cellular dynamics for a single cell by comparing the ratio of unspliced, pre-mRNA to mature mRNA (La Manno et al., 2018). RNA velocity shows myogenic differentiation directionality within specific subclusters (Figure 1—figure supplement 1C), resolving myogenic differentiation trajectories using processed and unprocessed RNA (Figure 1—figure supplement 1C). To infer connectivity and directionality between the nine subclusters, we employed partition-based graph abstraction (PAGA), which estimates connectivity among different subclusters while preserving global data topology, providing a more granular analysis than traditional pseudotemporal analyses (Wolf et al., 2019). PAGA identified a directed connectivity between the myogenic subclusters 0–6 (Figure 1E, Figure 1—figure supplement 1D) where we see robust connections between MuSC clusters and differentiating clusters. These connections highlight the inherent complexity of MuSC cell fate decisions (Figure 1—figure supplement 1D). Very few connections lead to mature muscle, suggesting that progenitor MuSC fate decisions are plastic. By contrast, the commitment to terminal differentiation may follow a single universal pathway. Together, these data reveal a trajectory map of in vivo myogenesis during muscle regeneration.

RNA-binding protein expression is temporally defined during myogenesis

The mechanisms of myogenic cell fate change are likely multifactorial and include post-transcriptional regulation of mRNAs. Post-transcriptional regulation permits rapid and dynamic cell fate changes in myogenic cells that is critical for cell fate transitions (Hausburg et al., 2015), but is poorly understood during myogenesis at a cellular resolution (Apponi et al., 2011; Hinkle et al., 2019; Weskamp et al., 2020). Since a number of RBP transcripts increase during muscle regeneration, examining the timing and magnitude of expression for RBPs in individual MuSCs may reveal an unexplored role for RBPs in mediating myogenic cell fate transitions (Weskamp et al., 2020). We hypothesize that RBP expression timing influences myogenic cell fates by post-transcriptionally regulating RNA. We defined RBP expression in MuSCs, focusing on myogenic subclusters 0–6. The MuSCs in these subclusters undergoing cell fate changes to either self-renew, continue to proliferate, or terminally differentiate. Thus, examining RNA regulation in these cells may reveal roles for RBPs in directing cell fate decisions.

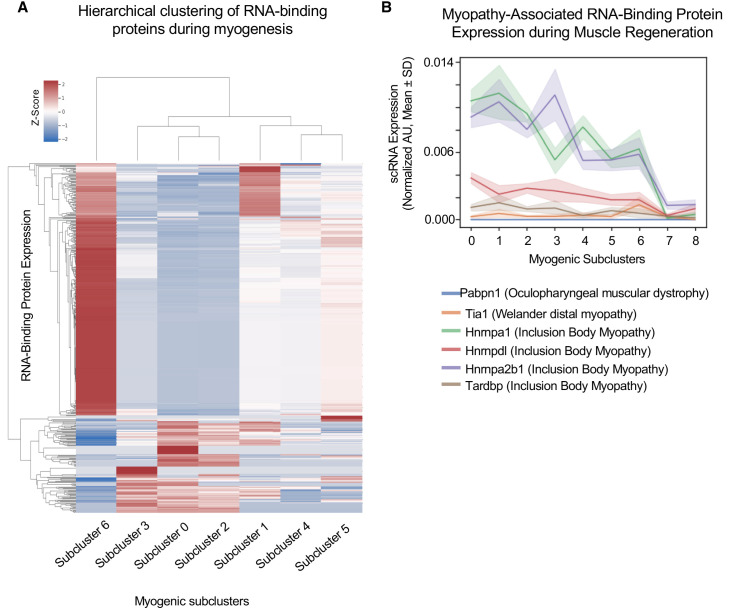
We first examined which RBPs are expressed in MuSCs in subclusters 0–6 (Castello et al., 2012; Perez-Perri et al., 2018) and subsequently performed hierarchical clustering for the expressed RBP transcripts in each subcluster (Figure 2A). These results identify networks of RBPs that are either upregulated or downregulated in specific subclusters. Thus, as the transcriptional state of MuSCs changes so too does the expression of RBP networks.

Figure 2. Cluster-specific RNA-binding protein expression is temporally defined during myogenesis.

Figure 2.

(A) Hierarchical clustering of RNA-binding protein expression in myogenic subclusters 1–6 during myogenesis. (B) Line plot of select myopathy-associated RNA-binding protein expression in subclusters 0–8 during myogenesis.

We hypothesized that RBP expression timing relates to the times in which those RBPs are functioning. Thus, dysfunction of RBPs at specific cell states may disrupt cell fate decisions and explain broadly why mutations or dysfunction in many RBPs cause neuromuscular diseases. For example, Tardbp (TDP-43) dysfunction impairs myogenic proliferation, whereas loss of Hnrnpa1 disrupts terminal myogenic differentiation (Liu et al., 2017; Vogler et al., 2018). Focusing on these disease-associated RBPS, we found that Tardbp expression is highest in subcluster 1, and in contrast, Hnrnpa2b1 expression is highest in subcluster 3, while Tia1 expression is highest in subcluster 6 (Figure 2B). Thus, distinct disease-associated RBP expression profiles peak in different subclusters, corresponding to different time points during myogenesis and distinct cell fate decisions.

Two of the most highly expressed RBPs are Hnrnpa1 and Hnrnpa2b1 (Figure 2B), and when disrupted cause inclusion body myopathy (Kim et al., 2013). Hnrnpa1 and Hnrnpa2b1 expression is highest in select proliferating and differentiating subclusters. While Hnrnpa1 function is essential for muscle differentiation, Hnrnpa2b1 function in muscle is unknown (Li et al., 2020). Thus, we focused on Hnrnpa2b1 as a model RBP for understanding cell state-specific RBP function. Defining the role for Hnrnpa2b1 in specific cell states may provide insight into how disruption of this RBP causes inclusion body myopathy.

Hnrnpa2b1 expression dynamics in regenerating skeletal muscle

Hnrnpa2b1 regulates RNA splicing, stability, and transport (Alarcón et al., 2015; Geissler et al., 2016; Percipalle et al., 2002) and, in stem cells, Hnrnpa2b1 regulates differentiation (Wang et al., 2018) and proliferation (He and Smith, 2009). Thus, we hypothesized that Hnrnpa2b1 may function as a myogenic RNA regulator during differentiation.

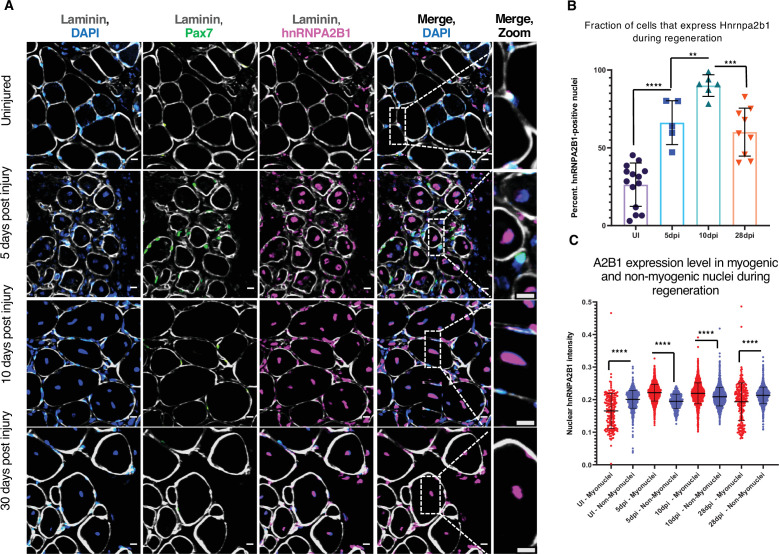
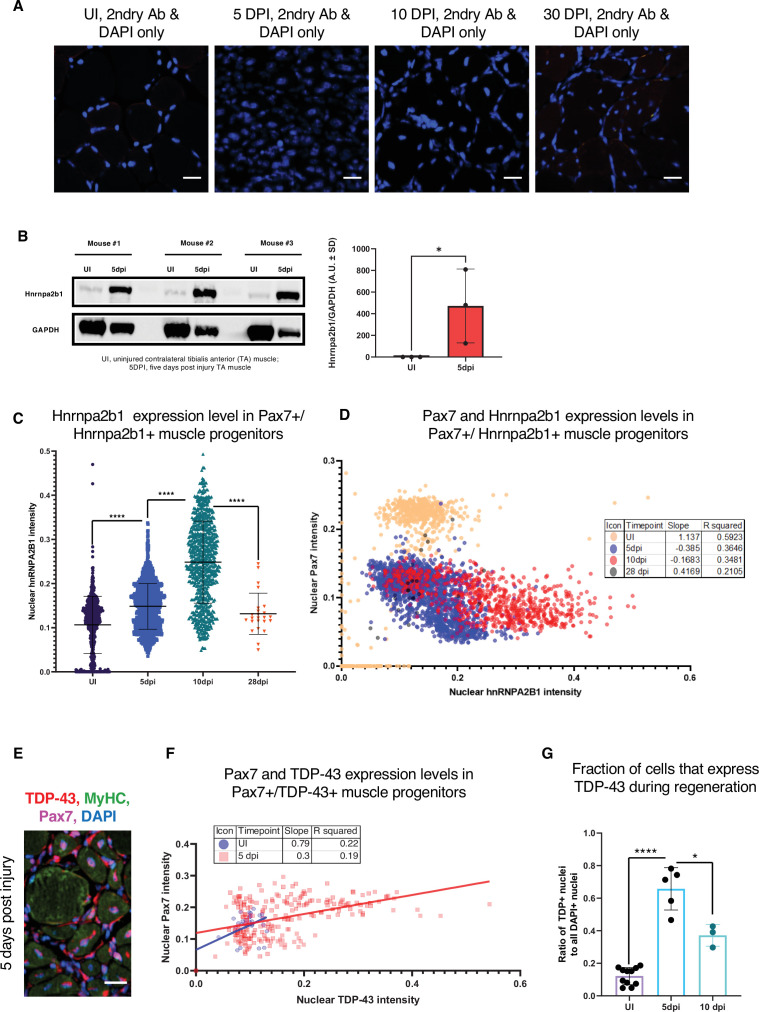
We examined the levels of Hnrnpa2b1 protein in regenerating muscle in vivo where in uninjured muscle, Hnrnpa2b1 is present in a subset of Pax7-postitive MuSCs and in some peripherally located myonuclei in mature skeletal muscle fibers (Figure 3A and B, Figure 3—figure supplement 1A). By 5 dpi, Hnrnpa2b1 protein levels increase and Hnrnpa2b1 is present in the majority of Pax7-postitive MuSCs and centrally located myonuclei of immature regenerating myofibers (Figure 3A–C, Figure 3—figure supplement 1A and B). Hnrnpa2b1 levels peak at 10 dpi in both Pax7-positive MuSCs and regenerating myofibers and then Hnrnpa2b1 levels decline as myofibers fully regenerate by 28 dpi (Figure 3A–C, Figure 3—figure supplement 1A,C and D). Therefore, the changes in Hnrnpa2b1 protein levels correlate well with expression dynamics detected by single-cell sequencing in regenerating muscle.

Figure 3. Hnrnpa2b1 is upregulated in myogenic nuclei during skeletal muscle regeneration.

(A) Hnrnpa2b1 immunoreactivity in uninjured (UI), 5, 10, and 30 days post injury (dpi) regenerating mouse muscle. All images represent n = 3 biological replicates; scale = 20 µM. (B) Nuclear Hnrnpa2b1 immunoreactivity in UI, 5, 10, and 28 dpi regenerating muscle. (C) Nuclear Hnrnpa2b1 immunoreactivity intensity in either myonuclei or non-myonuclei in UI, 5, 10, and 28 dpi regenerating muscle. See also Figure 3—figure supplement 1.

Figure 3.

Figure 3—figure supplement 1. Related to Figure 3.

Figure 3—figure supplement 1.

(A) Secondary-only immunoreactivity controls of muscle sections for all time points assessed by immunofluorescence (IF) in Figure 1A. (B) Quantified Western blot analysis of Hnrnpa2b1 protein expression from whole uninjured (UI) and 5 days post injury (dpi) regenerating muscle (one-tailed Student’s t-test). (C) Hnrnpa2b1 nuclear intensity in Pax7-positive myonuclei in UI, 5, 10, and 28 dpi regenerating muscle. (D) Scatter plot and R2 values for expression changes in myonuclear Pax7 and Hnrnpa2b1 in UI, 5, 10, and 28 dpi regenerating muscle. (E) Immunoreactivity in 5 dpi regenerating muscle for Tardbp, myosin heavy chain (Myhc), and Pax7. (F) Scatter plot and R2 values for Tardbp expression changes in Pax7 myonuclei in UI and 5 dpi. (G) Tardbp nuclear protein in UI, 5 dpi , and 10 dpi regenerating muscle. All images represent n = 3 biological replicates; scale = 20 µM. All quantified data represent mean ± SD, two-tailed Student’s t-test p-value: *<0.05, **<0.01, ***<0.001, ****<0.0001 unless otherwise stated.
Figure 3—figure supplement 1—source data 1. Related to Figure 3B.
Raw and annotated Western blot image of Hnrnpa2b1 and Gapdh protein expression from whole uninjured (UI) and 5 days post injury mouse tibialis anterior muscle.

These results show that Hnrnpa2b1 expression increases in both Pax7-positive MuSCs and regenerating myofibers early during regeneration . By contrast, Tardbp expression peaks at 5 dpi, near the peak of muscle progenitor proliferation (Figure 3—figure supplement 1E–G). As Tardbp is critical for early muscle regeneration, Hnrnpa2b1 may play a similarly critical role later during muscle regeneration.

Hnrnpa2b1 is required for myoblast differentiation

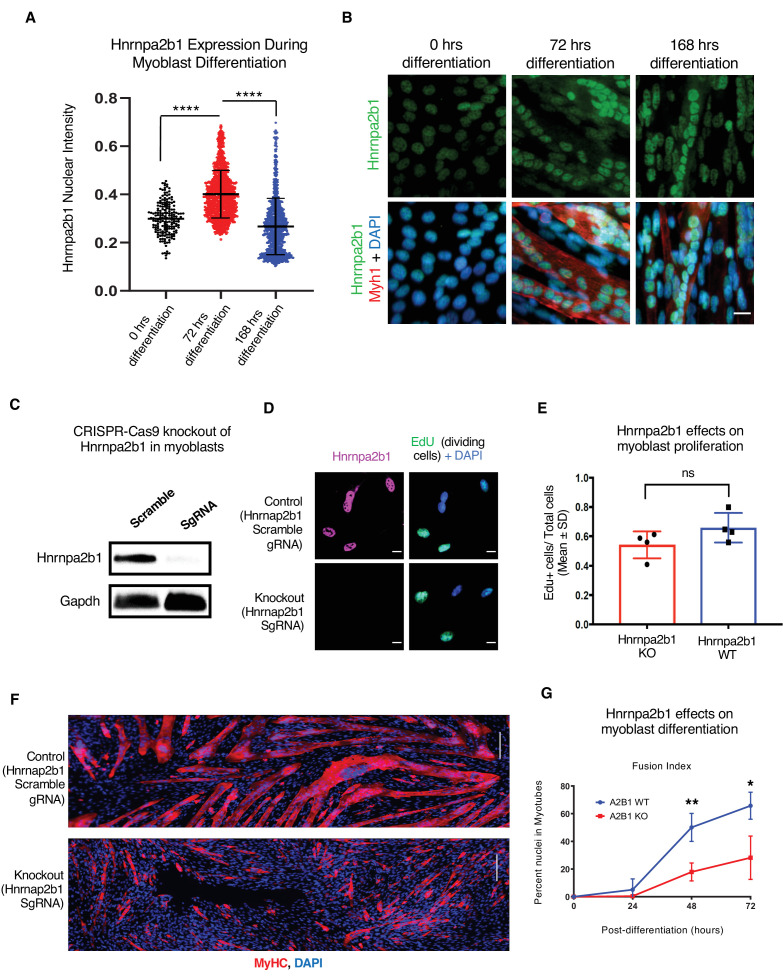
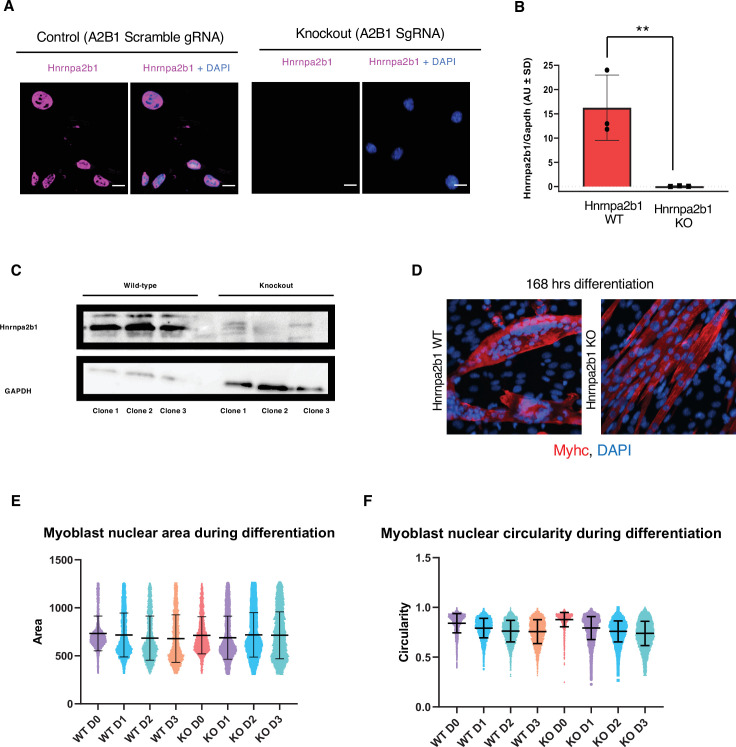
To better understand the role of Hnrnpa2b1 during myogenesis, we examined the protein levels of Hnrnpa2b1 in both proliferating and differentiating myoblasts. Hnrnpa2b1 immunoreactivity increases during myoblast differentiation, peaking by 3 days of differentiation, and declines as differentiating myoblasts and myotubes mature (Figure 4A and B). The levels of transcript mirror Hnrnpa2b1 expression in vivo and suggest a role for Hnrnpa2b1 in regulating differentiation, and thus, we predict that a functional requirement for Hnrnpa2b1 is highest during differentiation. To test this hypothesis, we knocked out Hnrnpa2b1 in myoblasts using CRISPR/Cas9 and assessed the consequences of Hnrnpa2b1 loss on myoblast proliferation and differentiation (Figure 4C, Figure 4—figure supplement 1A and B). Hnrnpa2b1 wild type (WT) and knockout (KO) cells show no significant differences in proliferation when labeled with a timed pulse of the thymidine analog 5-ethynyl-2′-deoxyuridine (EdU; Figure 4D and E). The Hnrnpa2b1 WT and KO populations exhibit no differences in nuclear morphology (Figure 4—figure supplement 1E and F).

Figure 4. Hnrnpa2b1 is required for myogenic differentiation.

(A) Hnrnpa2b1 nuclear protein in exponentially growing myoblasts (0 hr) and differentiating myotubes at 72 and 168 hr. (B) Immunoreactivity of Hnrnpa2b1 in myoblasts and differentiating myotubes. (C) Western blot analysis of CRISPR-Cas9 knockout (KO) and scrambled sequence Hnrnpa2b1 sgRNA-treated C2C12 myoblasts. (D) EdU-pulsed wild type (WT) myoblasts and Hnrnpa2b1 KO myoblasts (scale = 10 µM). (E) Quantification of EdU incorporation in WT and KO Hnrnpa2b1 myoblasts (ns = nonsignificant). (F) Immunoreactivity for Myhc in differentiating WT and KO Hnrnpa2b1 myotubes (scale = 200 µM). (G) Quantification of Fusion Index (percentage of nuclei fused into myotubes) during differentiation in either WT or KO Hnrnpa2b1 myotubes. All quantified data represent mean ± SD, two-tailed Student’s t-test p-value: *<0.05, **<0.01, ***<0.001, ****<0.0001 unless otherwise stated. See also Figure 4—figure supplement 1.

Figure 4—source data 1. Related to Figure 4C.
Raw and annotated Western blot image of Hnrnpa2b1 and Gapdh in wild type (WT) and Hnrnpa2b1 knockout (KO C2C12 myoblasts).

Figure 4.

Figure 4—figure supplement 1. Related to Figure 4.

Figure 4—figure supplement 1.

(A) Hnrnpa2b1 protein in wild type (WT) and Hnrnpa2b1 knockout (KO) myoblasts (scale = 10 µM). (B) Western blot intensity quantification of Hnrnpa2b1 in WT and Hnrnpa2b1 KO C2C12 myoblasts. (C) Western blot image of Hnrnpa2b1 in WT and Hnrnpa2b1 KO C2C12 myoblasts. (D) Myhc immunoreactivity in Hnrnpa2b1 WT and KO 168 hr differentiated C2C12 myotubes. (E, F) Quantification of Hnrnpa2b1 WT and KO myoblast nuclear area and circularity during differentiation. All images represent n = 3 biological replicates from three independent Hnrnpa2b1 WT and KO clones: scale = 20 µM. All quantified data represent mean ± SD, two-tailed Student’s t-test p-value: **<0.01.

Differentiation is impaired upon loss of Hnrnpa2b1. After 48 hr of differentiation, Hnrnpa2b1 WT myoblasts had largely differentiated into multinucleated, myosin heavy chain-positive myotubes (Figure 4F and G). Conversely, Hnrnpa2b1 KO myoblasts were unable to form large multinucleated myotubes (Figure 4F and G). The Hnrnpa2b1 KO differentiation defect persisted after 3 days of differentiation in culture. These results suggest that Hnrnpa2b1 KO myoblasts are unable to effectively differentiate (Figure 4G, Figure 4—figure supplement 1C). Thus, Hnrnpa2b1 function is required for differentiation, but not proliferation.

Hnrnpa2b1 is a myogenic splicing regulator critical for terminal myogenic differentiation

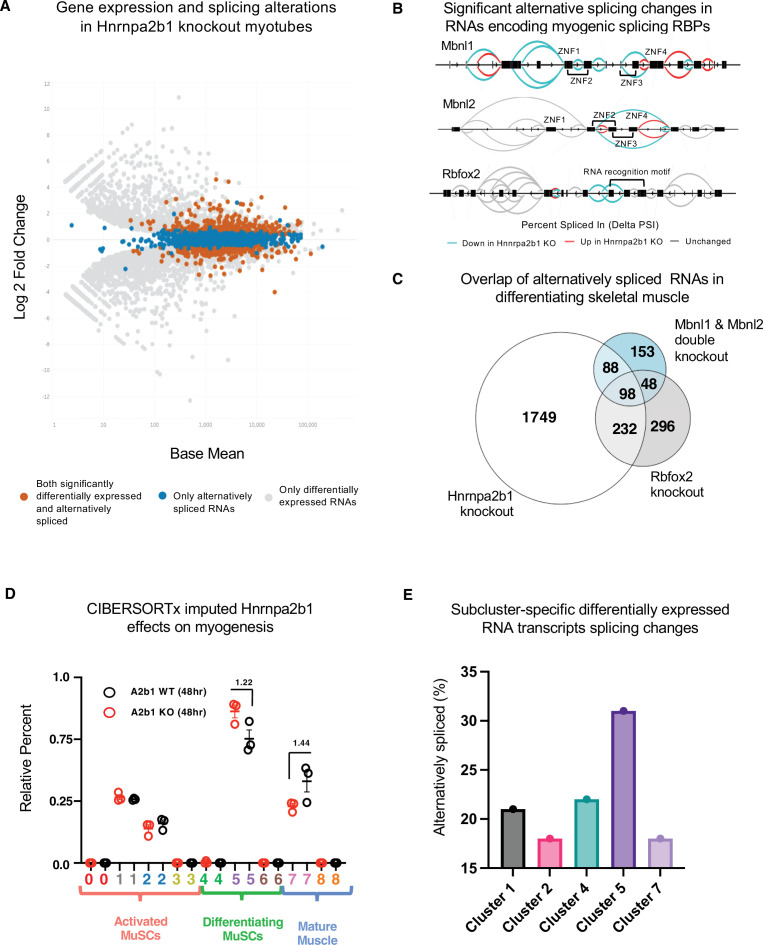
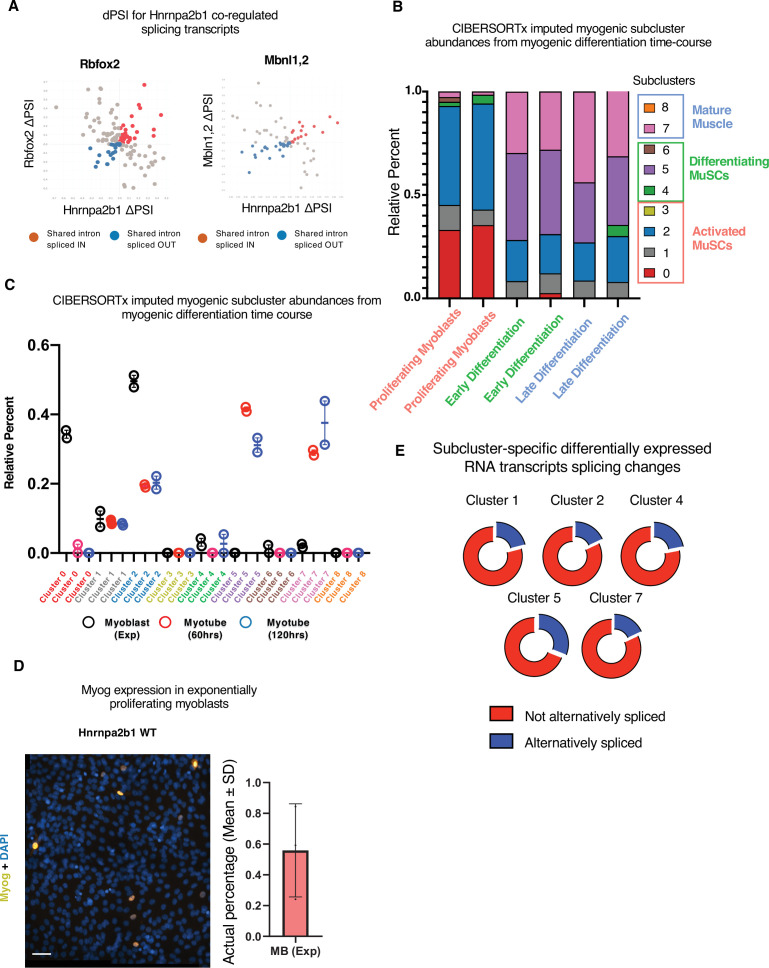
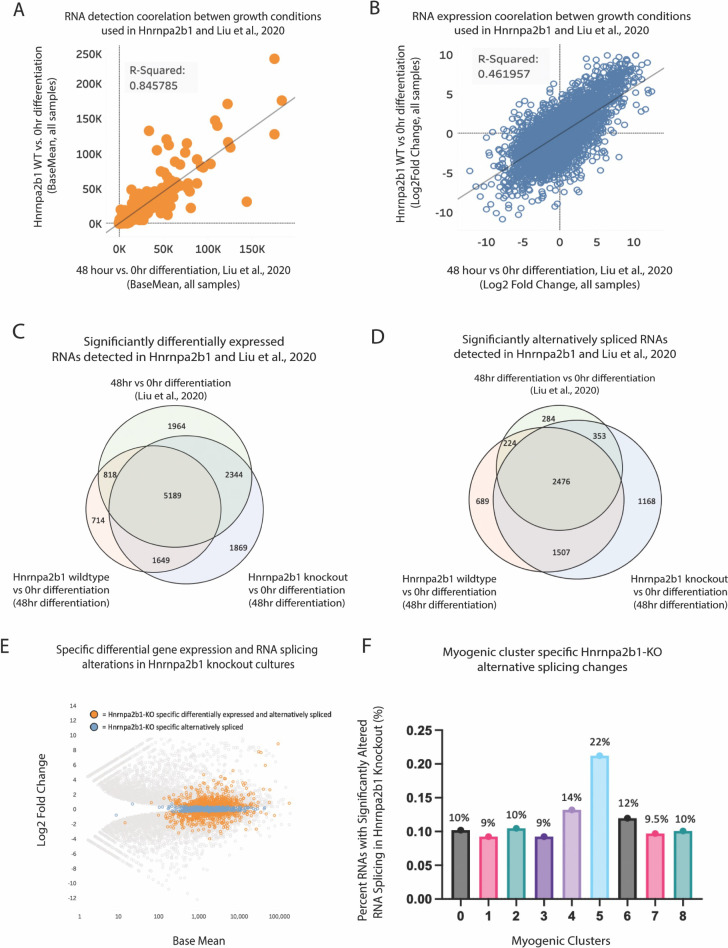
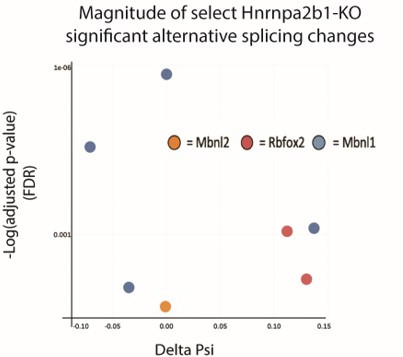
We hypothesized that Hnrnpa2b1 regulates RNA splicing during muscle differentiation, and that altered Hnrnpa2b1-mediated splicing may lead to impaired muscle differentiation. To test this hypothesis, we performed high-coverage RNA-sequencing of Hnrnpa2b1 KO cells and WT differentiating myotubes. The transcripts detected correlate closely to previously published myogenic differentiation datasets, indicating negligible effects due to differing growth conditions (Figure 5—figure supplement 2A and B). Differential splicing analysis identifies 2167 alternatively spliced RNAs of which 40% are differentially expressed (Figure 5A, Figure 5—figure supplement 2E). Differential splicing analysis reveals that Hnrnpa2b1 regulates the splicing of other RBPs. Many of these RBPs in turn regulate RNA splicing, including Mbnl1, Mbnl2, and Rbfox2 (Figure 5B). Loss of Rbfox2 or loss of both Mbnl1 and Mbnl2 impairs myogenic differentiation (Lee et al., 2013; Singh et al., 2014), and thus Hnrnpa2b1 loss appears to lead to the exclusion of Mbnl1, Mbnl2, and Rbfox2 exons encoding zinc fingers and RNA recognition motifs, respectively, which are predicted to disrupt function of these RBPs (Figure 5B). Thus, the splicing regulator cascade resulting from Hnrnpa2b1 loss disrupts Mbnl1, Mbnl2, and Rbfox2 splicing and may impair myogenesis.

Figure 5. Hnrnpa2b1 is a myogenic splicing regulator critical for terminal myogenic differentiation.

(A) Differential gene expression identified by DESeq2 in wild type (WT) and Hnrnpa2b1 knockout (KO) myotubes after 48 hr of differentiation with alternative splicing changes identified by LeafCutter (differential gene expression significance p-adjusted<0.05, splicing false discovery rate [FDR] p-value<0.05). (B) Sashimi plots of significant alternative splicing changes (delta percent spliced in [dPSI]) for Mbnl1, Mbnl2, Rbfox2 in differentiating Hnrnpa2b1 KO myotubes. (C) Venn diagram of significantly altered spliced transcripts in Hnrnpa2b1 KO, Mbnl1/Mbnl2 double KO (Thomas et al., 2017), and Rbfox2 KO (Singh et al., 2014) differentiating myogenic cultures. (D) Myogenic-trained CIBERSORTx-imputed stacked bar chart of myogenic subcluster percentages in C2C12 differentiation time course (Trapnell et al., 2010). (E) Myogenic-trained CIBERSORTx machine learning imputed percentages of myogenic clusters from WT and KO Hnrnpa2b1 differentiating myotubes. Y-axis refers to fold change between myogenic cluster percentages. See also Figure 5—figure supplement 1.

Figure 5.

Figure 5—figure supplement 1. Related to Figure 5.

Figure 5—figure supplement 1.

(A) Hnrnpa2b1-Rbfox or Hnrnpa2b1-Mbnl1/Mbnl2 delta percent spliced in (dPSI) changes in shared significantly altered spliced RNAs. (B, C) Myogenic-trained CIBERSORTx-imputed percentages of myogenic clusters from RNA-sequencing performed in biological duplicate of C2C12 differentiation time course (Trapnell et al., 2010). (D) Myogenin immunoreactivity and DAPI nuclear staining of exponentially proliferating C2C12 myoblasts. Bar plot represents percentage of myogenin+ proliferating C2C12 myoblasts, n = 3 biological replicates, scale = 50 µM. (E) Percentage of Hnrnpa2b1 knockout (KO) splicing alterations in significantly differentially expressed transcripts identified per myogenic cluster.
Figure 5—figure supplement 2. Related to Figure 5 – a distinct Hnrnpa2b1 gene expression and splicing program during differentiation.

Figure 5—figure supplement 2.

(A, B) Correlation of base mean and log2 fold change between Hnrnap2b1KO myoblasts and WT myoblasts differentiated for 48 hr and C2C12 myoblasts differentiated for 48 hr from Xue et al., 2020. RNA-sequencing data was compared against 0 hr proliferating myoblasts from Xue et al., 2020. (C, D) Venn diagrams showing differentially expressed genes identified by DESeq2 and alternative spliced transcripts identified by LeafCutter for 48 hr differentiation (Xue et al., 2020) for Hnrnpa2b1 WT cells and Hnrnpa2b1 KO cells. All data are compared to 0 hr proliferating myoblasts from Xue et al., 2020. (E) MA plot for differential gene expression changes identified in Hnrnpa2b1 KO cells compared to 0 hr proliferating myoblasts from Xue et al., 2020. Specific alternatively spliced transcripts identified in (D) are highlighted. (F) Impact of Hrnpa2b1 KO-specific alternatively spliced transcripts identified in (D) on differentially expressed transcripts present in single-cell myogenic clusters. Three independent RNA-sequencing datasets were analyzed for 0 and 48 hr cultures from Liu et al., and for Hnrnpa2b1 WT and KO.

We performed differential splicing analysis of Mbnl1, Mbnl2, and Rbfox2 in differentiating Hnrnpa2b1 KO cells (Lee et al., 2013; Singh et al., 2014). The alternatively spliced RNAs in Hnrnpa2b1 KO cells, compared to Mbnl1, Mbnl2 double KO cells, significantly overlap (hypergeometric p-value=1.2 × 10-77). Similarly, alternatively spliced RNAs in Hnrnpa2b1 KO cells and Rbfox2 KO cells also overlap (hypergeometric p-value=6.1 × 10-143) (Figure 5C), demonstrating that Hnrnpa2b1 loss likely leads to altered splicing of RNAs regulated by Mbnl1, Mbnl2, and Rbfox2, respectively. As RBPs function together to co-regulate the splicing of target RNAs (Klinck et al., 2014; Venables et al., 2013), Mbnl1, Mbnl2, Rbfox2, and Hnrnpa2b1 may cooperatively regulate target RNA splicing. Indeed, Mbnl1, Mbnl2, Rbfox2, and Hnrnpa2b1 KOs exhibit identical splice site location and share changes in splicing of target RNAs (Figure 5—figure supplement 1A). Thus, a network of RBPs, including Mbnl1, Mbnl2, Rbfox2, and Hnrnpa2b1, appear to cooperatively regulate RNA splicing during muscle differentiation.

The RBPs cooperating in regulating splicing during muscle differentiation may function at different stages of differentiation, and thus, whether Hnrnpa2b1 regulates the splicing of Mbnl1, Mbnl2, Rbfox2, and Hnrnpa2b1 directly or whether the cooperation is in part due to sequencing cell populations at different stages of differentiation is unclear. To distinguish these possibilities, we mapped Hnrnpa2b1 splicing at the single-cell level. To test whether Hnrnpa2b1 loss results arrests myogenic cells at specific myogenic stages, we quantified the impact of Hnrnpa2b1 KO on myogenic subcluster abundances. We employed CIBERSORTx, a machine learning tool, to impute myogenic subcluster percentages as CIBERSORTx is trained on single-cell sequencing data to estimate cell-type abundances present in bulk RNA-sequencing (Newman et al., 2019).

We first trained CIBERSORTx on our myogenic single-cell dataset and then imputed cell-type abundances in a muscle differentiation time course with bulk RNA sequences obtained from proliferating myoblasts and differentiating myotubes at 60 and 120 hr (Trapnell et al., 2010). Myogenic-trained CIBERSORTx reveals enrichment for proliferative MuSCs subclusters in the proliferating myoblast population. Conversely, the differentiating myotubes show a shift towards differentiating subclusters and are proportional to differentiation duration (Figure 5—figure supplement 1B and C). Myogenic-trained CIBERSORTx identifies a small fraction of differentiated cells within the proliferating myoblasts population (Figure 5—figure supplement 1B and C). To confirm whether the machine learning was accurate, we assessed immunoreactivity for myogenin, a marker of differentiation, in proliferating myoblasts and found myogenin-positive cells present at similar percentages as predicted by CIBERSORTx (Figure 5—figure supplement 1C and D). Together, these results demonstrate that myogenic-trained CIBERSORTx is capable of imputing myogenic subcluster abundances from bulk RNA-sequencing data.

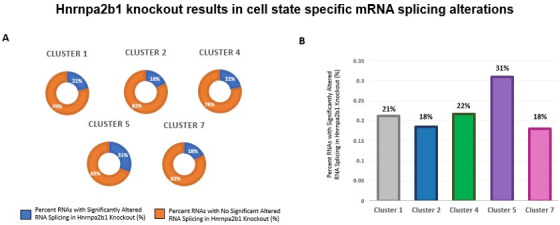
Next, we tested the impact of Hnrnpa2b1 KO using myogenic-trained CIBERSORTx. Hnrnpa2b1 KO cells show an enrichment for subcluster 5 myogenic cell signatures and a decrease in subcluster 7 (Figure 5D), demonstrating that Hnrnpa2b1 KO cells are slow to transition to subcluster 7 and accumulate in subcluster 5. We then used CIBERSORTx to examine the impact of Hnrnpa2b1 KO on specific myogenic cell states. We first performed differential gene expression analysis for each of the subclusters identified by CIBERSORTx (clusters 2–5, 7) to identify differentially expressed genes enriched in the cells of each specific cluster. These differentially expressed genes provide a molecular signature for the cells at each of these specific stages embedded in bulk RNA-sequencing data. By examining the splicing changes for the differentially expressed genes, we found that Hnrnpa2b1 KO alters splicing in each of these clusters, with cluster 5 showing the most changes in splicing (Figure 5E, Figure 5—figure supplement 1E, Figure 5—figure supplement 2F). Using this approach, we can control for population-wide cell state differences and demonstrate that Hnrnpa2b1 is a key splicing regulator in specific differentiating myogenic cell states.

RBP engagement scoring delineates timing of RBP function during myogenesis

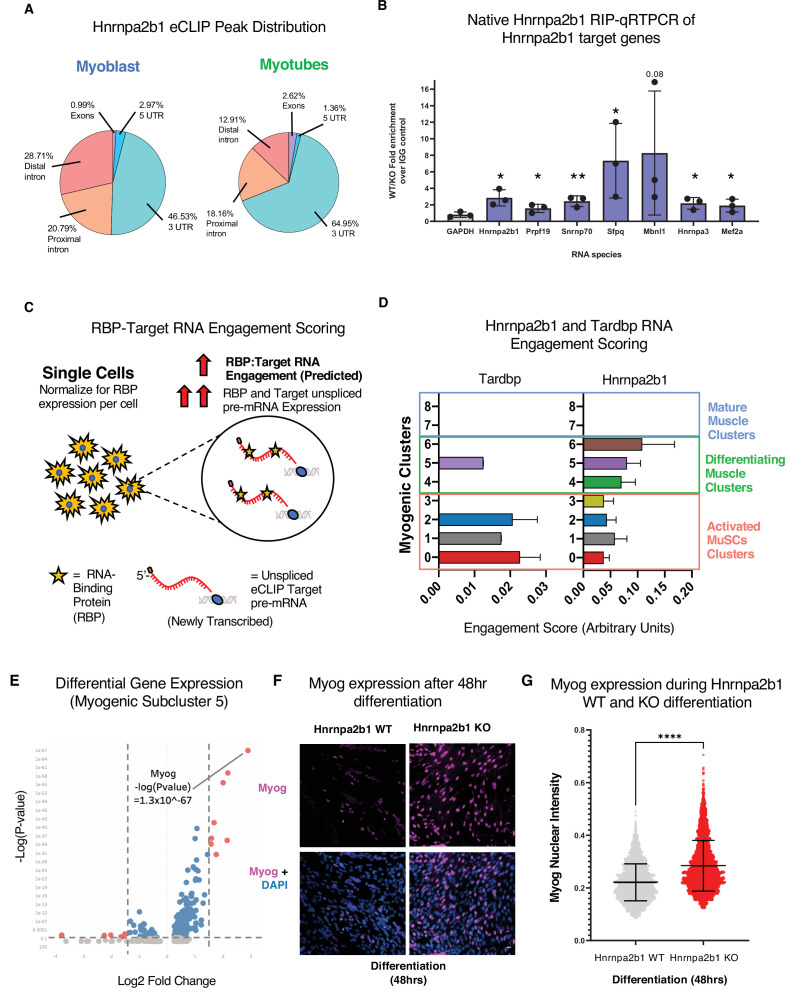
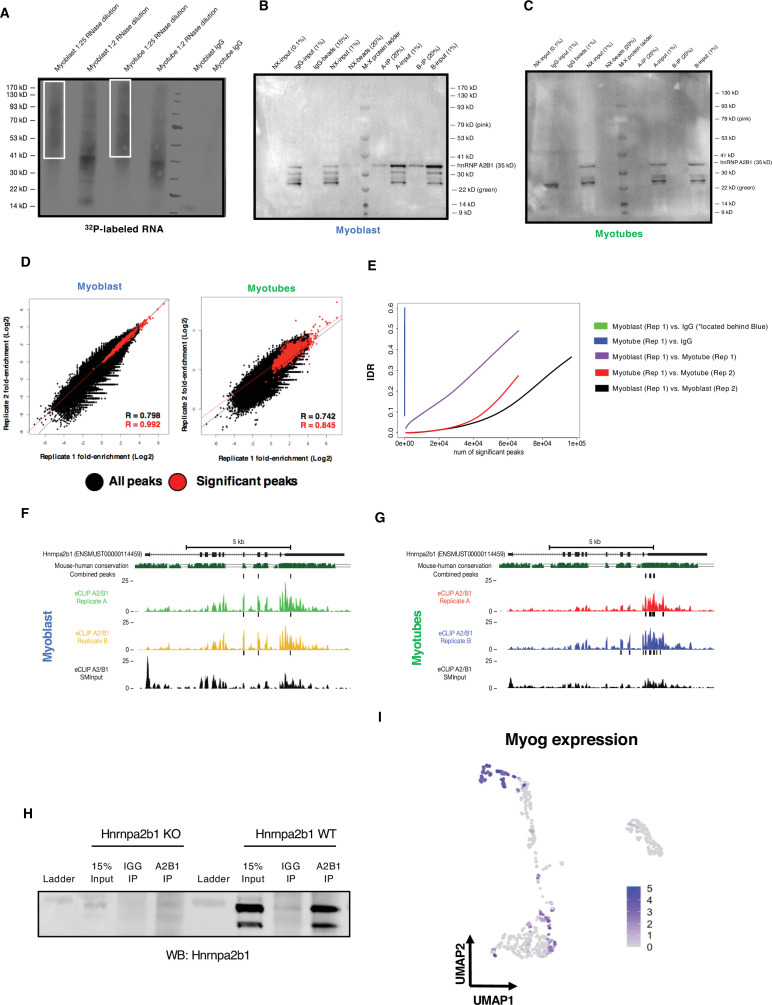
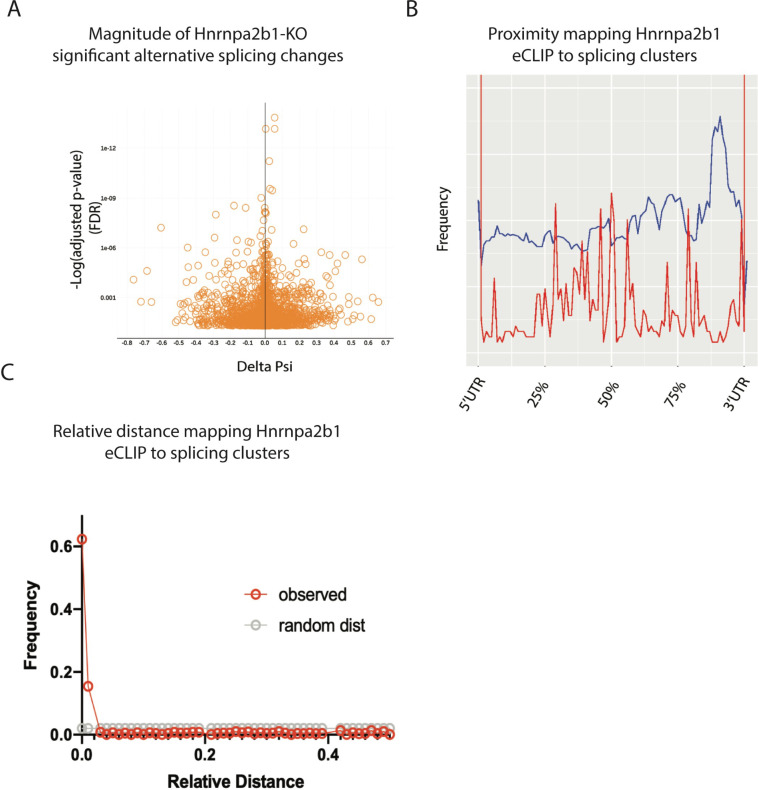
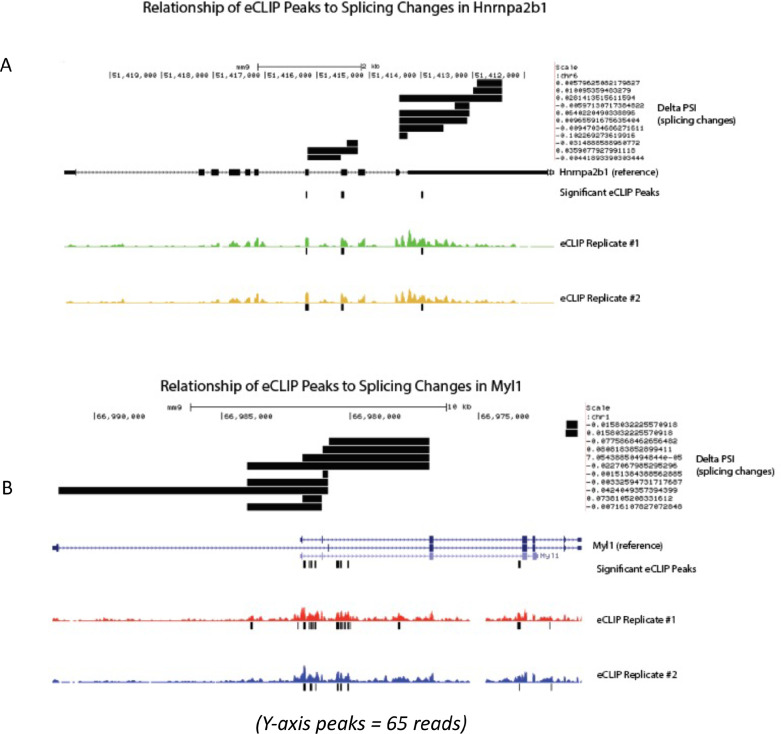
The expression of an RBP and RBP target RNAs is necessary for an RBP to alter splicing of the RPB target. Therefore, expression of Hnrnpa2b1 target RNAs during myogenic differentiation governs when Hnrnpa2b1 is capable of splicing target transcripts. To identify Hnrnpa2b1 target RNAs during myogenesis, we performed Hnrnpa2b1 enhanced UV crosslinking and immunoprecipitation (eCLIP) in both myoblasts and myotubes (Figure 6A, Figure 6—figure supplement 1A–C). Hnrnpa2b1 eCLIP reveals 808 binding sites across 247 genes for myoblasts and 1030 binding sites across 137 genes for myotubes, which are significantly enriched compared to size-matched input (reflecting all RNA–protein interactions in the input) (Figure 6—figure supplement 1D). Hnrnpa2b1 RNA target eCLIP peaks were highly correlated between biological replicates, had thousands of reproducible eCLIP clusters by irreproducible discovery rate analysis, and capture prior identified Hnrnpa2b1 RNA targets including Hnrnpa2b1’s own 3′UTR (Figure 6—figure supplement 1D–G; Martinez et al., 2016). Analysis of Hnrnpa2b1 RNA-binding sites reveals an enrichment for binding sites in the 3′UTR and proximal introns of target RNAs, potentially indicating a role of Hnrnpa2b1 in RNA localization or translation (Figure 6A). Further, Hnrnpa2b1 binding maps closely to splicing clusters, indicating a role for Hnrnpa2b1 in splicing regulation (Figure 6—figure supplement 2B and C). Hnrnpa2b1 binding spatially correlates to splicing changes in the two significantly differentially spliced transcripts Hnrnpa2b1 and Myl1 (Figure 6—figure supplement 3A and B). We validated the interaction of Hnrnpa2b1 with several target RNAs using RIP qRT-PCR (Figure 6B, Figure 6—figure supplement 1H).

Figure 6. RNA engagement scoring delineates functional timing of RNA-binding proteins (RBPs) during myogenesis.

(A) Genomic distribution of Hnrnpa2b1 enhanced UV crosslinking and immunoprecipitation (eCLIP) peaks in myoblasts and myotubes. (B) Native (non-denaturing) Hnrnpa2b1 RNA immunoprecipitation (RIP)-qRT-PCR of RNA targets identified by eCLIP. (C) Schematic for RBP-Target RNA engagement scoring. (D) RBP-Target RNA engagement scoring of Tardbp and Hnrnpa2b1 in myogenic subclusters (median ± 95% CI across all RBP-RNA engagement scores in each myogenic subcluster). (E) Differential gene expression analysis of myogenic subcluster 5. (F) Myog immunoreactivity in wild type (WT) and Hnrnpa2b1 knockout (KO) 48 hr differentiated myotubes. (G) Myog immunoreactivity signal intensity in differentiating WT and Hnrnpa2b1 KO myotubes (mean ± SD, two-tailed Student’s t-test p-value: ****<0.0001). See also Figure 6—figure supplement 1.

Figure 6.

Figure 6—figure supplement 1. Related to Figure 6.

Figure 6—figure supplement 1.

(A) Autoradiogram of 32P-labeled Hnrnpa2b1 RNA–RNA complexes fractionated by PAGE (B) and (C) immunoprecipitation of Hnrnpa2b1 RNA complexes used for enhanced UV crosslinking and immunoprecipitation (eCLIP) in C2C12 myoblasts or myotubes (n = 2 biologically independent samples). (D) Scatter plots indicate correlation between significant Hnrnpa2b1 RNA eCLIP peaks in biological replicates. Scatter plots represent fold enrichment for each region in Hnrnpa2b1 RNA eCLIP relative to paired size-matched input with significant peaks in red (p≤10–8 over size-matched input). (E) Irreproducible discovery rate (IDR) analysis comparing peak fold enrichment across indicated eCLIP datasets. (F) Integrative Genomics Viewer (IGV) tracing showing Hnrnpa2b1 RNA 3′UTR eCLIP peaks in Hnrnpa2b1 RNA transcript in myoblasts and (G) myotubes (H), where dark boxes denote significantly enriched binding sites above SMInput (p<10–8). Western blot for Hnrnpa2b1 used in RNA immunoprecipitation experiments in both Hnrnpa2b1 RNA wild type and knockout (KO) C2C12 cells. (I) Uniform manifold approximation and projection (UMAP) displaying Myog expression across myogenic single cells.
Figure 6—figure supplement 1—source data 1. Related to Figure 6—figure supplement 1A-C.
(A) Raw and annotated blot of autoradiogram of 32P-labeled Hnrnpa2b1 RNA–RNA complexes fractionated by PAGE (B) and (C) immunoprecipitation of Hnrnpa2b1 RNA complexes used for enhanced UV crosslinking and immunoprecipitation (eCLIP) in C2C12 myoblasts or myotubes (n = 2 biologically independent samples).
Figure 6—figure supplement 2. Related to Figure 6 – magnitude and spatial location for significant Hnrnap2b1 knockout (KO) splicing alterations.

Figure 6—figure supplement 2.

(A) Volcano plot showing delta percent spliced in (dPSI) versus p-value (false discovery rate [FDR]) for significant splicing changes detected in Hnrnpa2b1 KO cells. (B) Global proximity mapping of Hnrnpa2b1 enhanced UV crosslinking and immunoprecipitation (eCLIP) sites and significantly alternatively spliced clusters. (C) Relative distance mapping for eCLIP sites to alternative splice clusters using bedtools reldist.
Figure 6—figure supplement 3. Related to Figure 6 – mapped relationship of enhanced UV crosslinking and immunoprecipitation (eCLIP) peaks to splicing change magnitude in significantly differentially spliced transcripts.

Figure 6—figure supplement 3.

(A) UCSC gene track mapping delta percent sliced in (dPSI) (splicing changes) in reference to annotated Hnrnpa2b1 exons, introns, and Hnrnpa2b1 eCLIP-binding sites. (B) UCSC gene track showing dPSI (splicing changes) in reference to annotated Myl1 exons, introns, and Hnrnpa2b1 eCLIP-binding sites.

Having defined Hnrnpa2b1 mRNA targets, we next looked to develop a computational toolset to identify myogenic cells in which Hnrnpa2b1 is functioning. We reasoned that many RBPs engage with target RNAs co-transcriptionally to regulate RNA splicing (Fu and Ares, 2014). Newly transcribed RNAs or pre-mRNAs can be identified as RNAs that contain introns. These newly transcribed pre-mRNAs can then be computationally defined in single-cell data (La Manno et al., 2018) where RBP function will correlate with the expression level of an RBP and the RBP’s target pre-mRNA. For example, RBP function is predicted to occur in cells with both high RBP expression and target pre-mRNAs expression, which we term ‘RBP engagement scoring’ (Figure 6C).

We validated RBP engagement scoring on a well-characterized RBP, Tardbp, a splicing RBP required for myoblast proliferation. Prior eCLIP experiments identified Tardbp RNA targets (Vogler et al., 2018), and if our computation approach is valid, Tardbp engagement scores should be higher in proliferating myoblasts than differentiated myotubes. We quantified Tardbp and target RNA expression in single cells, assigned engagement scores to each of these cells, and then examined the engagement scores for all the cells in a given subcluster to examine the impact of Tardbp at each stage of myogenesis. Tardbp engagement scores are higher in proliferating myoblasts than in myogenic cells undergoing differentiation (Figure 6D), consistent with the functional requirement of Tardbp in proliferating myoblasts. We then performed RBP engagement scoring for Hnrnpa2b1 by examining the pre-mRNA levels of Hnrnpa2b1 target RNAs and Hnrnpa2b1 in single cells and correlated the expression of Hnrnpa2b1 target RNAs to Hnrnpa2b1 expression. Myogenic subclusters 5 and 6 showed the highest Hnrnpa2b1 engagement scores (Figure 6D), suggesting that Hnrnpa2b1 splicing function is highest in cells in subclusters 5 and 6. Thus, an Hnrnpa2b1 KO may arrest cells at these stages, causing impaired differentiation.

Delayed or slowed progression through subcluster 6 would lead to cells accumulating in the preceding subcluster 5. To test if Hnrnpa2b1 KO leads to an accumulation of cells in subcluster 5, we performed differential gene expression analysis on myogenic subclusters 5 and 6. Myog is significantly enriched in subcluster 5 (p-value=1 × 10-67) (Figure 6E, Figure 6—figure supplement 1I). We examined myogenin immunoreactivity in differentiated Hnrnpa2b1 KO and WT cells. Hnrnpa2b1 KO cells are significantly enriched in the myogenin-positive cell population (Figure 6F and G), demonstrating a requirement for Hnrnpa2b1 for commitment to terminal differentiation.

Discussion

RBP dysfunction contributes to neuromuscular disease (Apponi et al., 2011; Farina et al., 2012), yet the mechanisms leading to disease phenotypes and the roles of RBPs in regulating myogenic cell fate decisions remain poorly understood. Using multiomic and single-cell technologies, we finely mapped RBP expression during myogenesis, discovering that RBP expression and function correlates with specific myogenic cell states. We define a role for the disease-associated RBP, Hnrnpa2b1, in directing MuSC commitment to terminal differentiation where Hnrnpa2b1 influences global RNA splicing by regulating RBPs that splice distinct target mRNAs. The computational tools we employed allowed us to pinpoint the precise cell state in which Hnrnpa2b1 functions to guide cell fate decisions.

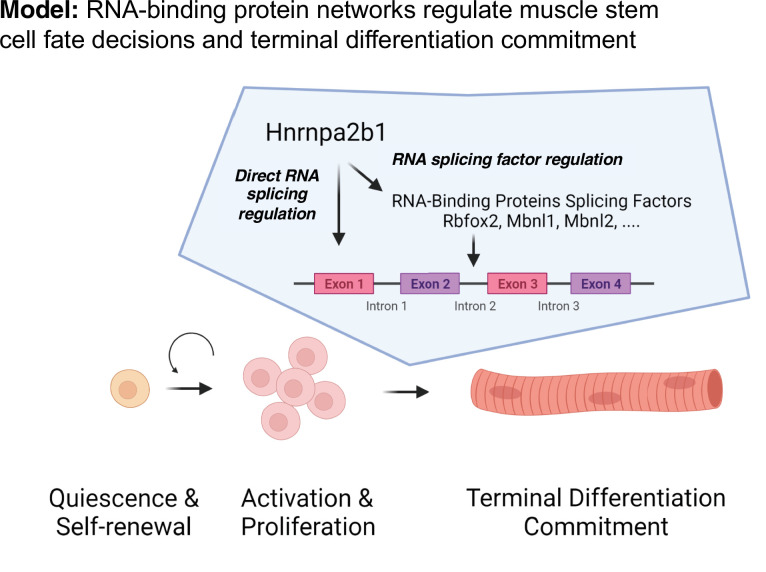
We propose a model to temporally define RBP function during muscle regeneration whereby the expression of an RBP and the RBP’s target RNAs is required, providing precise timing for RPB function (Figure 7). Whether an RBP is functioning will depend upon the expression of the RBP as well as expression of the RBP target RNAs. Thus, even though an RBP transcript is present, the RBP will not function unless the target RNAs are present, ensuring that RBPs do not function ubiquitously during muscle repair or muscle development. The observation that one splicing RBP regulates the splicing of an RBP that in turn regulates splicing of RNA targets adds combinatorial control and redundancy to myogenic differentiation. The network of shared RBPs ensures that splicing and RNA regulation function during a specific cell state, which we propose is a universal property occurring during development and in a number of regenerating tissues and organs.

Figure 7. Discrete RNA-binding protein functional timing and expression as a dynamic post-transcriptional regulatory mechanism for directing myogenic fate decisions.

Figure 7.

The model we propose explains the seemingly discordant myogenic phenotypes resulting from mutations in different RBPs that are consistent with the observation that KOs of distinct RBPs exhibit overlapping phenotypes . We speculate that RBPs function in concert at a specific cell state to regulate a wide array of messenger RNA targets that coordinate cell fate transitions. RBP dysfunction in diseases is therefore likely cell state-defined and RBP mutations disproportionately impact a specific cell’s state. The resultant effect of an RPB mutation is delayed cell fate transition, a complete block of cell fate transition, or selection of an alternative cell fate. A better understanding of the complex events contributing to alterations in cell state transitions occurring when RBPs are mutated could lead to the development of new approaches for cell-state-specific therapeutic intervention (Ferlini et al., 2021).

Materials and methods

Mice

Mice were bred and housed according to the National Institutes of Health (NIH) guidelines for the ethical treatment of animals in a pathogen-free facility at the University of Colorado at Boulder. The University of Colorado Institutional Animal Care and Use Committee (IACUC) approved all animal protocols and procedures and studies complied with all ethical regulations. IACUC protocol number 2516, Animal Welfare Assurance number A3646-01. WT mice were genotype C57BL/6 (Jackson Laboratories). Cells and TA muscles were isolated from 3- to 6-month-old male and female WT mice.

Mouse injuries

Male and female mice between 3 and 6 months of age were anesthetized with isoflurane and the left TA muscle was injected with 50 μl of 1.2% BaCl2. The injured and contralateral TA muscles were harvested at the indicated time points.

TA collections and cell isolations

TA muscles were dissected and placed into 400 U/ml collagenase at 37°C for 1 hr with shaking and then placed into Ham’s F-12C supplemented with 15% horse serum to inactivate the collagenase. Cells were passed through three strainers of 100, 70, and 40 µm (BD Falcon) and flow through was centrifuged at 1500 × g for 5 min, and the cell pellets were resuspended in Ham’s F-12C. To remove dead cells and debris, cells were passed over Miltenyi dead cell removal kit columns (Cat# 130-090-101). To remove RBCs, cells were incubated with antiTer119 micro magnetic beads and passed over a Miltenyi column (Cat# 130-049-901). For adult uninjured Tas, six TA muscles (from three mice) were pooled together. For injured TA muscles, two TA muscles from two different mice were pooled together. Cells were then counted using a Bio-Rad TC20 automated cell counter and processed with a 10X Genomics single-cell sequencing kit.

Single-cell sequencing

To capture, label, and generate transcriptome libraries of individual cells, we used the 10X Genomics Chromium Single Cell 3′ Library and Gel Bead Kit v2 (Cat# PN-120237) following the manufacturer’s protocols. Briefly, the single-cell suspension, RT-PCR master mix, gel beads, and partitioning oil were loaded into a Single Cell A Chip 10 genomics chip, placed into the chromium controller, and the Chromium Single Cell A program was run to generate Gel Bead-In-EMulsion (GEMs) that contain RT-PCR enzymes, cell lysates and primers for Illumina sequencing, barcoding, and poly-DT sequences. GEMs were then transferred to PCR tubes and the RT-PCR reaction was run to generate barcoded single-cell identified cDNA. Barcoded cDNA was used to make sequencing libraries for analysis with Illumina sequencing. We captured 1709 cells from young uninjured muscle, 5077 from the 4 dpi muscle, and 2668 from the 7 dpi muscle. Sequencing was completed on an Illumina NovaSeq 6000 using paired-end 150 cycle 2 × 150 reads by the genomics and microarray core at the University of Colorado Anschutz Medical Campus.

Single-cell Informatics

Preprocessing was performed using Cellranger v3.0.1 (10X Genomics) count module that was used for alignment using cellranger-mm10-3.0.0 refdata, filtering, barcode counting, and UMI counting of the single-cell FASTQs. Postprocessing was performed using Seurat according to standardized workflows (Butler et al., 2018; Stuart et al., 2019). In brief, using RStudio (v4.0.0), Seurat objects were created for each Cellranger processed sample by importing filtered_gene_bc_matrices. Multiple Seurat objects then were merged, filtered, normalized, feature selected, scaled, and clustered. Nonlinear dimensional reduction was performed using uniform manifold approximation and projection (UMAP).

RNA velocity using the scVelo pipeline was performed according to standardized workflows (La Manno et al., 2018). In brief, Velocyto was run in Python v3.6.3 using Samtools v1.8, cellranger-mm10-3.0.0 refdata, and masking repetitive elements to generate unspliced/spliced/ambiguous read count Loom file for each 10X cellranger preprocessed library. Seurat objects of myogenic clusters (.rds files) were converted in RStudio to loom files using LoomR. In a virtual environment, Velocyto Loom files were concatenated and merged with Seurat exported myogenic Loom in Scanpy. The scVelo pipeline was then used to perform log normalization and filtering. RNA velocity was then imputed using stochastic modeling. RNA velocities were projected on pre-computed UMAP embeddings and annotated clusters.

RBP Engagement Scoring was performed by first determining the raw unspliced reads for every gene at single-cell level using Veloctyo as above. Metadata containing raw reads counts and unspliced reads imputed using Veloctyo were exported from Scanpy anndata objects for single cells contained within myogenic clusters and were exported and reimported into RStudio (v.4.0.0). To calculate an RBP-RNA engagement score for a given RBP, CLIP target genes of a given RBP genes were subset and unspliced read counts and total RBP counts were normalized to total read counts in a given cell. Scoring then represents the fraction of normalized unspliced reads of target RNAs to normalized amounts of a given RBP. To extrapolate to a given cluster, scores were then summed across all cells in a given cluster and data was represented by the median of these scores for a given cluster of cells. Target genes were identified using publicly available eCLIP datasets for Tardbp.

CIBERSORTx of myogenic clusters was performed according to published workflows (Newman et al., 2019). In brief, a single-cell reference txt file was created from our Seurat processed single-cell RNA-seq dataset. A mixture file for bulk RNA-sequencing samples was created using TPM values extracted from StringTie serve as input. A single-cell reference txt matrix of cells organized by myogenic clusters was then used to train CIBERSORTx using default parameters (Supplementary file 3). Cell fractions were then imputed using 100 permutations for significance analysis.

Immunofluorescence staining of tissue sections

TA muscles were dissected, fixed on ice for 2 hr with 4% paraformaldehyde, and then transferred to PBS with 30% sucrose at 4°C overnight. Muscle was mounted in O.C.T. (Tissue-Tek) and cryo-sectioned on a Leica cryostat to generate 10-μm-thick sections. Frozen tissues and sections were stored at –80°C. Prior to immunofluorescent staining, tissue sections were post-fixed in 4% paraformaldehyde for 10 min at room temperature (RT) and washed three times for 5 min in PBS. Staining with anti-Pax7, Laminin, and Hnrnpa2b1 antibodies required heat-induced epitope retrieval, which was performed by placing post-fixed slides in citrate buffer, pH 6.0, and subjected them to 6 min of high-pressure cooking in a Cuisinart model CPC-600 pressure cooker. For immunostaining, tissue sections were permeabilized with 0.25% Triton-X100 (Sigma) in PBS containing 2% bovine serum albumin (Sigma) for 60 min at RT. Incubation with primary antibody occurred at 4°C overnight followed by incubation with secondary antibody at RT for 1 hr. Primary antibodies included anti-Pax7 (Developmental Studies Hybridoma Bank, University of Iowa, USA) at 1:750, rabbit anti-laminin (Sigma-Aldrich) at 1:200, and a mouse anti-Hnrnpa2b1 (ab6102, Abcam) at 1:200. Alexa Fluor secondary antibodies (Molecular Probes) were used at a 1:1000 dilution. For analysis that included EdU detection, EdU staining was completed prior to antibody staining using the Click-iT EdU Alexa Fluor 488 detection kit (Molecular Probes) following the manufacturer’s protocols. Sections were incubated with 1 μg/ml DAPI for 10 min at RT then mounted in Mowiol supplemented with DABCO (Sigma-Aldrich) or ProLong Gold (Thermo) as an anti-fade agent. All microscopy images used for quantitation were taken of samples cultured, immunohistochemically stained, and imaged in parallel and under identical conditions to enable quantitative comparison.

Cell culture and growth conditions

C2C12 myoblast cells

Immortalized murine myoblasts (American Type Culture Collection CRL-1772) were maintained on uncoated standard tissue culture plastic or gelatin-coated coverslips for imaging experiments at 37°C with 5% CO2 in Dulbecco's Modified Eagle Medium (DMEM) with 20% fetal bovine serum and 1% penicillin/streptomycin. To induce myoblast differentiation and fusion into myotubes, C2C12 myoblasts at 80% confluence were switched to DMEM media supplemented with 5% horse serum, 1% penicillin/streptomycin, and 1X Insulin-Transferrin-Selenium in DMEM. Cell lines were validated using RNA deep sequencing concurrent with certification provided by the manufacturer. Cells tested negative for mycoplasma contamination by the BioFrontiers cell culture core facility.

Hnrnpa2b1 CRISPR-Cas9 knockout and EdU incorporation

CRISPR-Cas9 knockout was performed in C2C12 myoblasts. Single-guide RNA (sgRNA) against Hnrnpa2b1 (5′-GAGTCCGCGATGGAG) were designed using (crispr.mit.edu) and cloned into pSpCas9(BB)–2A-Puro (PX459). C2C12 myoblasts were transfected with JetPrime using the manufacturer’s protocols. Myoblasts that integrated the CRISPR construct were selected with puromycin (1 µg/ml) for 1 week. Three independent myoblasts KO and WT clones were isolated using a cloning ring to selectively detach clonal populations via trypsinization. Clonal population KO was validated via immunofluorescence (IF) and Western blotting against Hnrnpa2b1 with anti-Hnrnpa2b1 antibodies (ab6102 and ab31645). EdU incorporation: C2C12 myoblasts were incubated with 10 µM EdU (Life Technologies) for 3 hr. Cells were washed, fixed, and stained using the methods described below.

Immunofluorescence staining of cells

C2C12 myoblast cells were washed with PBS in a laminar flow hood and fixed with 4% paraformaldehyde for 10 min at RT in a chemical hood. Cells were permeabilized with 0.25% Triton-X100 in PBS containing 2% bovine serum albumin (Sigma) for 1 hr at RT. Cells were incubated with primary antibody at 4°C overnight, then incubated with secondary antibody at RT for 1 hr. Primary antibodies included mouse anti-Hnrnpa2b1 (ab6102, Abcam) at 1:200, mouse-anti-myogenin (ab82843, Abcam), and a mouse anti-MHC MF-20 (Developmental Studies Hybridoma Bank, University of Iowa) at undiluted, ‘neat’ concentration. Alexa Fluor secondary antibodies (Molecular Probes) were used at a 1:1,000 dilution.

Microscopy and image analyses

Images were captured on a Nikon inverted spinning disk confocal microscope. Objectives used on the Nikon were ×10/0.45 NA Plan Apo, ×20/0.75 NA Plan Apo, and ×40/0.95 Plan Apo. Confocal stacks were projected as maximum intensity images for each channel and merged into a single image. Brightness and contrast were adjusted for the entire image as necessary against secondary antibody-treated control immunofluorescent sections. Cellprofiler was used to quantify immunohistochemistry (IHC) and IF images using custom analysis pipelines unless otherwise stated.

Western blotting of cell and tissue lysates

Western blot was performed according to standard protocols. Equal volumes (20 µl) of fractions were then resolved on a 4–12% Bis-Tris SDS-PAGE gel and transferred to a nitrocellulose membrane (Bio-Rad). Primary antibodies included mouse anti-Hnrnpa2b1 (1:200; ab6102, Abcam) and monoclonal rabbit anti-GAPDH (14C10) conjugated to HRP (1:2000; Cell Signaling, 3683S).

Hnrnpa2b1 eCLIP sequencing

C2C12 myoblasts were seeded at 6 × 10⁶ cells per 15 cm plate, grown 24 hr at 37°C, 5% CO2, and either harvested (undifferentiated myoblasts) or differentiated in differentiation media for 4 days. Hnrnpa2b1 eCLIP was performed according to established protocols (Nguyen et al., 2018; Van Nostrand et al., 2016). In brief, Hnrnpa2b1-RNA interactions were stabilized with UV crosslinking (254 nm, 150 mJ/cm2). Cell pellets were collected and snap-frozen in liquid N2. Cells were thawed, lysed in eCLIP lysis buffer (50 mM Tris-HCl pH 7.4, 100 mM NaCl, 1% NP-40, 0.1% SDS, 0.5% sodium deoxycholate, and 1× protease inhibitor), and sonicated (Bioruptor). Lysate was RNAse I (Ambion, 1:25) treated to fragment RNA. Protein-RNA complexes were immunoprecipitated using the rabbit polyclonal anti-Hnrnpa2b1 (ab31645, Abcam) antibody. One size-matched input (SMInput) library was generated per biological replicate using an identical procedure without immunoprecipitation. Stringent washes were performed as described, RNA was dephosphorylated (FastAP, Fermentas), T4 PNK (NEB), and a 3′ end RNA adaptor was ligated with T4 RNA ligase (NEB). Protein-RNA complexes were resolved on an SDS-PAGE gel, transferred to nitrocellulose membranes, and RNA was extracted from membrane. After RNA precipitation, RNA was reverse-transcribed using SuperScript IV (Thermo Fisher Scientific), free primer was removed, and a 3′ DNA adapter was ligated onto cDNA products with T4 RNA ligase (NEB). Libraries were PCR-amplified and dual-indexed (Illumina TruSeq HT). Pair-end sequencing was performed on Illumina NextSeq sequencer.

eCLIP bioinformatic and statistical analysis

Read processing and cluster analysis for Hnrnpa2b1 eCLIP were performed as previously described (Van Nostrand et al., 2016; Vogler et al., 2018). Briefly, 3′ barcodes and adapter sequences were removed using standard eCLIP scripts. Reads were trimmed, filtered for repetitive elements, and aligned to the mm9 reference sequence using STAR. PCR duplicate reads were removed based on the read start positions and randomer sequence. Bigwig files for genome browser display were generated based on the location of the second paired-end reads. Peaks were identified using the encode_branch version of CLIPPER using the parameter ‘-s mm9.’ Peaks were normalized against size-matched input by calculating fold enrichment of reads in IP versus input and were designated as significant if the number of reads in the IP sample was greater than in the input sample, with a Bonferroni corrected Fisher’s exact p-value<10–8.

RNA-sequencing library preparation and sequencing

C2C12 Hnrnpa2b1-WT and KO myoblasts were seeded at 6 × 10⁶ cells per 15 cm plate, grown for 24 hr at 37°C, 5% CO2, and differentiated via serum withdrawal and ITS supplementation for 2 days. Differentiated C2C12 myoblasts and myotubes were washed with PBS in a laminar flow hood and scraped from the tissue culture plate. Total RNA was extracted using a QIAGEN RNeasy Plus Mini Kit, following the manufacturer’s instructions. Isolated RNA quality was assessed by the CU Boulder BioFrontiers Next-Gen Sequencing core facility using an Agilent tape station. Isolated RNA was sent to the University of Colorado Cancer Center Genomics and Microarray Core for ‘Ribominus’ Ribosomal RNA depletion, NGS library preparation, and total RNA sequencing.

RNA-sequencing informatics

All RNA-sequencing data preprocessing was carried using standardized Nextflow RNA-sequencing (nf-core/rnaseq) with STAR alignment (genome GRCm39), transcriptome mapping with Salmon, and in silico ribosomal depletion using SortMeRNA. Differential gene expression was performed on feature counts tables using DESeq2 (Love et al., 2014). RNA splicing analysis was performed using LeafCutter (Li et al., 2018).

CLIP/splicing cluster analysis

The locations of splicing clusters generated using LeafCutter and Hnrnpa2b1 eCLIP peaks from myotubes were each compared against genes in the mm10 refGene table from the UCSC Genome Browser to determine the number of clusters or peaks overlapping each gene. The overlap of each cluster or peak was then subdivided into coverage of either UTR or segments of the gene, divided into percentiles along the gene. These were normalized and plotted against each other using R and ggplot2.

Relative distance

Relative distance between splicing clusters generated using LeafCutter and Hnrnpa2b1 eCLIP peaks from myotubes were generated using the bedtools reldist command, using eCLIP peaks as the first input, and splicing clusters in genes with eCLIP peaks as the second input (Favorov et al., 2012).

QAPA poly-A analysis

As previously described, RNA-sequencing reads were trimmed, in silico ribodepleted, and reads were mapped to an mm10 3′UTR annotation file using Salmon v0.13.1. Quantification of alternative polyadenylation (QAPA) was then used to estimate relative alternative 3′UTR isoform usage (Ha et al., 2018). Lengthening or shortening of a gene’s poly(A) tail was determined by first calculating a proximal poly(A) site usage (PPAU) defined as the percentage of reads mapping to the most proximal poly(A) site relative to reads mapping to the whole 3′UTR. ΔPPAU was then calculated as the median PPAU Hnrnpa2b1 KO – median PPAU WT (three replicates per condition). A gene with a ΔPPAU >20 was defined as having a shortened poly(A) tail, and a gene with a ΔPPAU < –20 was defined as having a lengthened poly(A) tail.

Hnrnpa2b1 immunoprecipitation and qRT-PCR

C2C12 Hnrnpa2b1-WT and KO myoblasts were seeded at 6 × 10⁶ cells per 15 cm plate, grown 24 hr at 37°C, 5% CO2, and harvested as undifferentiated myoblasts. Myoblasts were lysed in a CHAPS-based buffer and pre-cleared using protein-A bound Dynabeads (Thermo, 10001D). Pre-cleared cell lysates were incubated with rabbit polyclonal anti-Hnrnpa2b1 antibody (ab31645, Abcam). Antibody-bound Hnrnpa2b1 was bound to protein-A Dynabeads overnight and magnetically isolated from the whole-cell lysate. Hnrnpa2b1-bound RNA was isolated from the Dynabead-Antibody-Hnrnpa2b1 complex via TRIZol RNA purification. cDNA libraries were created from purified RNA via oligo-DT priming and SuperScriptIII-enzyme reverse transcription. cDNA libraries were probed against Hnrnpa2b1-eCLIP hits chosen as a subset of the significantly enriched Gene Ontology terms via quantitative, real-time PCR (qRT-PCR). Primers used target Gapdh, Hnrnpa2b1, Prpf19, Snrnp70, Sfpq, Mbnl1, Hnrnpa3, and Mef2a. (Primer sequence is given in Supplementary file 1.) qRT-PCR was performed using SYBR-Green qRT-PCR reagent (Bio-Rad), and fluorescent emission was measured using a Bio-Rad CFX384 Real-Time PCR Detection system.

Acknowledgements

We thank J Dragavon, J Orth for help with microscopy and the CU Microscopy Cores (supported by NIST-CU 70NANB15H226, NIH1S10RR026680-01A1), as well as the University of Colorado Cancer Center Genomics Core (supported by NIH-P30CA46934). We thank Theodore E Ewachiw and Yang Zhao for their technical assistance. The research was supported by NIH-T32GM008497 (JRW, EDN, TOV, and EL), NIH-F30NS093682 (JRW), NIH-F30AR068881 (TOV), NIH-GM045443 (RP), NIH-R35GM119575 (AMJ), Paul O’Hara II Seed Grant from ACS-IRG Grant Program (AMJ), NIH-AR049446 and NIH-AR070360 (BBO), NIH-RM1-HG007735 (HYC), Glenn Foundation for Biomedical Research (BBO), and a Butcher Innovation Award NSF IGERT 1144807 (JRW and TOV), UC Boulder BSI and UROP programs (ONW). RP and HYC are investigators of the Howard Hughes Medical Institute.

Funding Statement

The funders had no role in study design, data collection and interpretation, or the decision to submit the work for publication.

Contributor Information

Roy Parker, Email: roy.parker@colorado.edu.

Bradley B Olwin, Email: olwin@colorado.edu.

Douglas L Black, University of California, Los Angeles, United States.

James L Manley, Columbia University, United States.

Funding Information

This paper was supported by the following grants:

  • National Institutes of Health T32GM008497 to Joshua R Wheeler, Thomas O Vogler, Eric D Nguyen.

  • National Institutes of Health NIH-F30NS093682 to Joshua R Wheeler.

  • National Institutes of Health NIH-F30AR068881 to Thomas O Vogler.

  • National Institutes of Health NIH-GM045443 to Roy Parker.

  • National Institutes of Health NIH-R35GM119575 to Aaron M Johnson.

  • National Institutes of Health NIH-AR049446 to Bradley B Olwin.

  • National Institutes of Health NIH-AR070360 to Bradley B Olwin.

  • American Cancer Society IRG Paul O'Hara II Seed Grant to Aaron M Johnson.

  • National Institutes of Health NIH-RM1-HG007735 to Howard Y Chang.

  • National Science Foundation NSF IGERT 1144807 to Joshua R Wheeler, Thomas O Vogler.

  • Glenn Foundation for Medical Research to Bradley B Olwin.

  • University of Colorado Boulder Biological Sciences Initiative to Oscar N Whitney.

  • University of Colorado Boulder University of Colorado Undergraduate Research Program to Oscar N Whitney.

  • Howard Hughes Medical Institute to Howard Y Chang, Roy Parker.

Additional information

Competing interests

No competing interests declared.

No competing interests declared.

Reviewing editor, eLife.

Serves on the scientific board of Satellos Biosciences.

Author contributions

Conceptualization, Data curation, Formal analysis, Investigation, Methodology, Validation, Writing – original draft, Writing – review and editing.

Conceptualization, Data curation, Formal analysis, Investigation, Methodology, Validation, Writing – original draft, Writing – review and editing.

Conceptualization, Investigation, Methodology, Validation, Writing – original draft, Writing – review and editing.

Formal analysis, Investigation, Methodology, Writing – review and editing.

Formal analysis, Investigation, Writing – review and editing.

Formal analysis, Investigation, Writing – review and editing.

Investigation, Writing – review and editing.

Investigation, Writing – review and editing.

Investigation, Writing – review and editing.

Data curation, Investigation, Writing – review and editing.

Investigation, Writing – review and editing.

Investigation, Writing – review and editing.

Project administration, Supervision, Writing – review and editing.

Project administration, Supervision, Writing – review and editing.

Project administration, Supervision, Writing – review and editing.

Conceptualization, Funding acquisition, Project administration, Supervision, Writing – original draft, Writing – review and editing.

Conceptualization, Funding acquisition, Project administration, Supervision, Writing – original draft, Writing – review and editing.

Ethics

Mice were bred and housed according to National Institutes of Health (NIH) guidelines for the ethical treatment of animals in a pathogen-free facility at the University of Colorado at Boulder. The University of Colorado Institutional Animal Care and Use Committee (IACUC) approved all animal protocols and procedures and studies complied with all ethical regulations. IACUC protocol number 2516, animal welfare assurance number A3646-01.

Additional files

Transparent reporting form
Supplementary file 1. Primers used for RIP-qPCR.
elife-75844-supp1.xlsx (9.8KB, xlsx)
Supplementary file 2. Hnrnpa2b1 eCLIP mapping in Myoblasts and Myotubes.
elife-75844-supp2.xlsx (214.7KB, xlsx)
Supplementary file 3. Hnrnpa2b1 KO differential gene expression.
elife-75844-supp3.xlsx (1.6MB, xlsx)
Supplementary file 4. Hnrnpa2b1 KO cluster expression.
elife-75844-supp4.xlsx (226.5KB, xlsx)
Supplementary file 5.
elife-75844-supp5.xlsx (62MB, xlsx)
Supplementary file 6. RNA-binding proteins expressed in myogenic clusters 0 - 6.
elife-75844-supp6.xlsx (14.4KB, xlsx)

Data availability

Sequencing data is publicly available (SRA accession: PRJNA717101, GEO accession: GSE152467, GSE106553).

The following datasets were generated:

Wheeler JR, Whitney O, Olwin B, Parker R. 2020. Hnrnpa21 regulates myogenic fate plasticity. NCBI Gene Expression Omnibus. GSE152467

Wheeler JR, Whitney O, Olwin B, Parker R. 2021. RNA-Binding Proteins Direct Myogenic Cell Fate Decisions. NCBI BioProject. PRJNA717101

Nguyen ED, Wheeler JR, Vogler TO, Johnson AM. 2022. RNA-binding proteins direct myogenic cell fate decisions. NCBI Gene Expression Omnibus. GSE106553

The following previously published datasets were used:

Trapnell C, Williams BA, Pertea G, Mortazavi A, Kwan G, van Baren MJ, Salzberg SL, Wold BJ, Pachter L. 2010. Transcript assembly and abundance estimation from RNA-Seq reveals thousands of new transcripts and switching among isoforms. NCBI Gene Expression Omnibus. GSE20846

Singh RK, Xia Z, Bland CS, Kalsotra A, Ruddy M, Curk T, Ule J, Li W, Cooper TA. 2014. Rbfox2-coordinated alternative splicing of Mef2d and Rock2 controls myoblast fusion during myogenesis. NCBI Gene Expression Omnibus. GSE58928

Thomas JD, Bardhi O, Aslam FN, Sznajder LJ. 2017. Disrupted prenatal RNA processing and myogenesis in congenital myotonic dystrophy. NCBI Gene Expression Omnibus. GSE97806

References

  1. Alarcón CR, Goodarzi H, Lee H, Liu X, Tavazoie S, Tavazoie SF. HNRNPA2B1 Is a Mediator of m(6)A-Dependent Nuclear RNA Processing Events. Cell. 2015;162:1299–1308. doi: 10.1016/j.cell.2015.08.011. [DOI] [PMC free article] [PubMed] [Google Scholar]
  2. Apponi LH, Corbett AH, Pavlath GK. RNA-binding proteins and gene regulation in myogenesis. Trends in Pharmacological Sciences. 2011;32:652–658. doi: 10.1016/j.tips.2011.06.004. [DOI] [PMC free article] [PubMed] [Google Scholar]
  3. Baghdadi MB, Tajbakhsh S. Regulation and phylogeny of skeletal muscle regeneration. Developmental Biology. 2018;433:200–209. doi: 10.1016/j.ydbio.2017.07.026. [DOI] [PubMed] [Google Scholar]
  4. Barruet E, Garcia SM, Striedinger K, Wu J, Lee S, Byrnes L, Wong A, Xuefeng S, Tamaki S, Brack AS, Pomerantz JH. Functionally heterogeneous human satellite cells identified by single cell RNA sequencing. eLife. 2020;9:e51576. doi: 10.7554/eLife.51576. [DOI] [PMC free article] [PubMed] [Google Scholar]
  5. Bergen V, Lange M, Peidli S, Wolf FA, Theis FJ. Generalizing RNA velocity to transient cell states through dynamical modeling. Nature Biotechnology. 2020;38:1408–1414. doi: 10.1038/s41587-020-0591-3. [DOI] [PubMed] [Google Scholar]
  6. Brinegar AE, Xia Z, Loehr JA, Li W, Rodney GG, Cooper TA. Extensive alternative splicing transitions during postnatal skeletal muscle development are required for calcium handling functions. eLife. 2017;6:e27192. doi: 10.7554/eLife.27192. [DOI] [PMC free article] [PubMed] [Google Scholar]
  7. Butler A, Hoffman P, Smibert P, Papalexi E, Satija R. Integrating single-cell transcriptomic data across different conditions, technologies, and species. Nature Biotechnology. 2018;36:411–420. doi: 10.1038/nbt.4096. [DOI] [PMC free article] [PubMed] [Google Scholar]
  8. Calado A, Tomé FM, Brais B, Rouleau GA, Kühn U, Wahle E, Carmo-Fonseca M. Nuclear inclusions in oculopharyngeal muscular dystrophy consist of poly(A) binding protein 2 aggregates which sequester poly(A) RNA. Human Molecular Genetics. 2000;9:2321–2328. doi: 10.1093/oxfordjournals.hmg.a018924. [DOI] [PubMed] [Google Scholar]
  9. Caldwell CJ, Mattey DL, Weller RO. Role of the basement membrane in the regeneration of skeletal muscle. Neuropathology and Applied Neurobiology. 1990;16:225–238. doi: 10.1111/j.1365-2990.1990.tb01159.x. [DOI] [PubMed] [Google Scholar]
  10. Castello A, Fischer B, Eichelbaum K, Horos R, Beckmann BM, Strein C, Davey NE, Humphreys DT, Preiss T, Steinmetz LM, Krijgsveld J, Hentze MW. Insights into RNA biology from an atlas of mammalian mRNA-binding proteins. Cell. 2012;149:1393–1406. doi: 10.1016/j.cell.2012.04.031. [DOI] [PubMed] [Google Scholar]
  11. Chenette DM, Cadwallader AB, Antwine TL, Larkin LC, Wang J, Olwin BB, Schneider RJ. Targeted mRNA Decay by RNA Binding Protein AUF1 Regulates Adult Muscle Stem Cell Fate, Promoting Skeletal Muscle Integrity. Cell Reports. 2016;16:1379–1390. doi: 10.1016/j.celrep.2016.06.095. [DOI] [PMC free article] [PubMed] [Google Scholar]
  12. Cho DS, Doles JD. Single cell transcriptome analysis of muscle satellite cells reveals widespread transcriptional heterogeneity. Gene. 2017;636:54–63. doi: 10.1016/j.gene.2017.09.014. [DOI] [PMC free article] [PubMed] [Google Scholar]
  13. Cortese A, Plagnol V, Brady S, Simone R, Lashley T, Acevedo-Arozena A, de Silva R, Greensmith L, Holton J, Hanna MG, Fisher EMC, Fratta P. Widespread RNA metabolism impairment in sporadic inclusion body myositis TDP43-proteinopathy. Neurobiology of Aging. 2014;35:1491–1498. doi: 10.1016/j.neurobiolaging.2013.12.029. [DOI] [PMC free article] [PubMed] [Google Scholar]
  14. Cuter A, Pawlikowski B, Wheeler J, Betta ND, Elston T, O’Rourke R, Jones K, Olwin BB. A Cellular Atlas of Skeletal Muscle Regeneration and Aging. bioRxiv. 2019 doi: 10.1101/635805. [DOI]
  15. Dassi E. Handshakes and Fights: The Regulatory Interplay of RNA-Binding Proteins. Frontiers in Molecular Biosciences. 2017;4:e67. doi: 10.3389/fmolb.2017.00067. [DOI] [PMC free article] [PubMed] [Google Scholar]
  16. De Micheli AJ, Laurilliard EJ, Heinke CL, Ravichandran H, Fraczek P, Soueid-Baumgarten S, De Vlaminck I, Elemento O, Cosgrove BD. Single-Cell Analysis of the Muscle Stem Cell Hierarchy Identifies Heterotypic Communication Signals Involved in Skeletal Muscle Regeneration. Cell Reports. 2020;30:3583–3595. doi: 10.1016/j.celrep.2020.02.067. [DOI] [PMC free article] [PubMed] [Google Scholar]
  17. de Morrée A, van Velthoven CTJ, Gan Q, Salvi JS, Klein JDD, Akimenko I, Quarta M, Biressi S, Rando TA. Staufen1 inhibits MyoD translation to actively maintain muscle stem cell quiescence. PNAS. 2017;114:E8996–E9005. doi: 10.1073/pnas.1708725114. [DOI] [PMC free article] [PubMed] [Google Scholar]
  18. Dell’Orso S, Juan AH, Ko KD, Naz F, Perovanovic J, Gutierrez-Cruz G, Feng X, Sartorelli V. Single cell analysis of adult mouse skeletal muscle stem cells in homeostatic and regenerative conditions. Development (Cambridge, England) 2019;146:dev174177. doi: 10.1242/dev.174177. [DOI] [PMC free article] [PubMed] [Google Scholar]
  19. Farina NH, Hausburg M, Betta ND, Pulliam C, Srivastava D, Cornelison D, Olwin BB. A role for RNA post-transcriptional regulation in satellite cell activation. Skeletal Muscle. 2012;2:e21. doi: 10.1186/2044-5040-2-21. [DOI] [PMC free article] [PubMed] [Google Scholar]
  20. Favorov A, Mularoni L, Cope LM, Medvedeva Y, Mironov AA, Makeev VJ, Wheelan SJ. Exploring massive, genome scale datasets with the GenometriCorr package. PLOS Computational Biology. 2012;8:e1002529. doi: 10.1371/journal.pcbi.1002529. [DOI] [PMC free article] [PubMed] [Google Scholar]
  21. Feige P, Brun CE, Ritso M, Rudnicki MA. Orienting Muscle Stem Cells for Regeneration in Homeostasis, Aging, and Disease. Cell Stem Cell. 2018;23:653–664. doi: 10.1016/j.stem.2018.10.006. [DOI] [PMC free article] [PubMed] [Google Scholar]
  22. Ferlini A, Goyenvalle A, Muntoni F. RNA-targeted drugs for neuromuscular diseases. Science (New York, N.Y.) 2021;371:29–31. doi: 10.1126/science.aba4515. [DOI] [PubMed] [Google Scholar]
  23. Fu XD, Ares M. Context-dependent control of alternative splicing by RNA-binding proteins. Nature Reviews. Genetics. 2014;15:689–701. doi: 10.1038/nrg3778. [DOI] [PMC free article] [PubMed] [Google Scholar]
  24. Geissler R, Simkin A, Floss D, Patel R, Fogarty EA, Scheller J, Grimson A. A widespread sequence-specific mRNA decay pathway mediated by hnRNPs A1 and A2/B1. Genes & Development. 2016;30:1070–1085. doi: 10.1101/gad.277392.116. [DOI] [PMC free article] [PubMed] [Google Scholar]
  25. Giordani L, He GJ, Negroni E, Sakai H, Law JYC, Siu MM, Wan R, Corneau A, Tajbakhsh S, Cheung TH, Le Grand F. High-Dimensional Single-Cell Cartography Reveals Novel Skeletal Muscle-Resident Cell Populations. Molecular Cell. 2019;74:609–621. doi: 10.1016/j.molcel.2019.02.026. [DOI] [PubMed] [Google Scholar]
  26. Ha KCH, Blencowe BJ, Morris Q. QAPA: a new method for the systematic analysis of alternative polyadenylation from RNA-seq data. Genome Biology. 2018;19:e45. doi: 10.1186/s13059-018-1414-4. [DOI] [PMC free article] [PubMed] [Google Scholar]
  27. Hausburg MA, Doles JD, Clement SL, Cadwallader AB, Hall MN, Blackshear PJ, Lykke-Andersen J, Olwin BB. Post-transcriptional regulation of satellite cell quiescence by TTP-mediated mRNA decay. eLife. 2015;4:e03390. doi: 10.7554/eLife.03390. [DOI] [PMC free article] [PubMed] [Google Scholar]
  28. He Y, Smith R. Nuclear functions of heterogeneous nuclear ribonucleoproteins A/B. Cellular and Molecular Life Sciences. 2009;66:1239–1256. doi: 10.1007/s00018-008-8532-1. [DOI] [PMC free article] [PubMed] [Google Scholar]
  29. Hentze MW, Castello A, Schwarzl T, Preiss T. A brave new world of RNA-binding proteins. Nature Reviews. Molecular Cell Biology. 2018;19:327–341. doi: 10.1038/nrm.2017.130. [DOI] [PubMed] [Google Scholar]
  30. Hinkle ER, Wiedner HJ, Black AJ, Giudice J. RNA processing in skeletal muscle biology and disease. Transcription. 2019;10:1–20. doi: 10.1080/21541264.2018.1558677. [DOI] [PMC free article] [PubMed] [Google Scholar]
  31. Imbriano C, Molinari S. Alternative Splicing of Transcription Factors Genes in Muscle Physiology and Pathology. Genes. 2018;9:e107. doi: 10.3390/genes9020107. [DOI] [PMC free article] [PubMed] [Google Scholar]
  32. Kim HJ, Kim NC, Wang YD, Scarborough EA, Moore J, Diaz Z, MacLea KS, Freibaum B, Li S, Molliex A, Kanagaraj AP, Carter R, Boylan KB, Wojtas AM, Rademakers R, Pinkus JL, Greenberg SA, Trojanowski JQ, Traynor BJ, Smith BN, Topp S, Gkazi AS, Miller J, Shaw CE, Kottlors M, Kirschner J, Pestronk A, Li YR, Ford AF, Gitler AD, Benatar M, King OD, Kimonis VE, Ross ED, Weihl CC, Shorter J, Taylor JP. Mutations in prion-like domains in hnRNPA2B1 and hnRNPA1 cause multisystem proteinopathy and ALS. Nature. 2013;495:467–473. doi: 10.1038/nature11922. [DOI] [PMC free article] [PubMed] [Google Scholar]
  33. Klinck R, Fourrier A, Thibault P, Toutant J, Durand M, Lapointe E, Caillet-Boudin ML, Sergeant N, Gourdon G, Meola G, Furling D, Puymirat J, Chabot B. RBFOX1 cooperates with MBNL1 to control splicing in muscle, including events altered in myotonic dystrophy type 1. PLOS ONE. 2014;9:e107324. doi: 10.1371/journal.pone.0107324. [DOI] [PMC free article] [PubMed] [Google Scholar]
  34. La Manno G, Soldatov R, Zeisel A, Braun E, Hochgerner H, Petukhov V, Lidschreiber K, Kastriti ME, Lönnerberg P, Furlan A, Fan J, Borm LE, Liu Z, van Bruggen D, Guo J, He X, Barker R, Sundström E, Castelo-Branco G, Cramer P, Adameyko I, Linnarsson S, Kharchenko PV. RNA velocity of single cells. Nature. 2018;560:494–498. doi: 10.1038/s41586-018-0414-6. [DOI] [PMC free article] [PubMed] [Google Scholar]
  35. Lee KY, Li M, Manchanda M, Batra R, Charizanis K, Mohan A, Warren SA, Chamberlain CM, Finn D, Hong H, Ashraf H, Kasahara H, Ranum LPW, Swanson MS. Compound loss of muscleblind-like function in myotonic dystrophy. EMBO Molecular Medicine. 2013;5:1887–1900. doi: 10.1002/emmm.201303275. [DOI] [PMC free article] [PubMed] [Google Scholar]
  36. Lepper C, Partridge TA, Fan CM. An absolute requirement for Pax7-positive satellite cells in acute injury-induced skeletal muscle regeneration. Development (Cambridge, England) 2011;138:3639–3646. doi: 10.1242/dev.067595. [DOI] [PMC free article] [PubMed] [Google Scholar]
  37. Li YI, Knowles DA, Humphrey J, Barbeira AN, Dickinson SP, Im HK, Pritchard JK. Annotation-free quantification of RNA splicing using LeafCutter. Nature Genetics. 2018;50:151–158. doi: 10.1038/s41588-017-0004-9. [DOI] [PMC free article] [PubMed] [Google Scholar]
  38. Li M, Zhuang Y, Batra R, Thomas JD, Li M, Nutter CA, Scotti MM, Carter HA, Wang ZJ, Huang XS, Pu CQ, Swanson MS, Xie W. HNRNPA1-induced spliceopathy in a transgenic mouse model of myotonic dystrophy. PNAS. 2020;117:5472–5477. doi: 10.1073/pnas.1907297117. [DOI] [PMC free article] [PubMed] [Google Scholar]
  39. Liu TY, Chen YC, Jong YJ, Tsai HJ, Lee CC, Chang YS, Chang JG, Chang YF. Muscle developmental defects in heterogeneous nuclear Ribonucleoprotein A1 knockout mice. Open Biology. 2017;7:e160303. doi: 10.1098/rsob.160303. [DOI] [PMC free article] [PubMed] [Google Scholar]
  40. Love MI, Huber W, Anders S. Moderated estimation of fold change and dispersion for RNA-seq data with DESeq2. Genome Biology. 2014;15:e550. doi: 10.1186/s13059-014-0550-8. [DOI] [PMC free article] [PubMed] [Google Scholar]
  41. Lukong KE, Chang K, Khandjian EW, Richard S. RNA-binding proteins in human genetic disease. Trends in Genetics. 2008;24:416–425. doi: 10.1016/j.tig.2008.05.004. [DOI] [PubMed] [Google Scholar]
  42. Martinez FJ, Pratt GA, Van Nostrand EL, Batra R, Huelga SC, Kapeli K, Freese P, Chun SJ, Ling K, Gelboin-Burkhart C, Fijany L, Wang HC, Nussbacher JK, Broski SM, Kim HJ, Lardelli R, Sundararaman B, Donohue JP, Javaherian A, Lykke-Andersen J, Finkbeiner S, Bennett CF, Ares M, Jr, Burge CB, Taylor JP, Rigo F, Yeo GW. Protein-RNA Networks Regulated by Normal and ALS-Associated Mutant HNRNPA2B1 in the Nervous System. Neuron. 2016;92:780–795. doi: 10.1016/j.neuron.2016.09.050. [DOI] [PMC free article] [PubMed] [Google Scholar]
  43. Murphy MM, Lawson JA, Mathew SJ, Hutcheson DA, Kardon G. Satellite cells, connective tissue fibroblasts and their interactions are crucial for muscle regeneration. Development (Cambridge, England) 2011;138:3625–3637. doi: 10.1242/dev.064162. [DOI] [PMC free article] [PubMed] [Google Scholar]
  44. Nakka K, Ghigna C, Gabellini D, Dilworth FJ. Diversification of the muscle proteome through alternative splicing. Skeletal Muscle. 2018;8:e8. doi: 10.1186/s13395-018-0152-3. [DOI] [PMC free article] [PubMed] [Google Scholar]
  45. Naryshkin NA, Weetall M, Dakka A, Narasimhan J, Zhao X, Feng Z, Ling KKY, Karp GM, Qi H, Woll MG, Chen G, Zhang N, Gabbeta V, Vazirani P, Bhattacharyya A, Furia B, Risher N, Sheedy J, Kong R, Ma J, Turpoff A, Lee C-S, Zhang X, Moon Y-C, Trifillis P, Welch EM, Colacino JM, Babiak J, Almstead NG, Peltz SW, Eng LA, Chen KS, Mull JL, Lynes MS, Rubin LL, Fontoura P, Santarelli L, Haehnke D, McCarthy KD, Schmucki R, Ebeling M, Sivaramakrishnan M, Ko C-P, Paushkin SV, Ratni H, Gerlach I, Ghosh A, Metzger F. Motor neuron disease. SMN2 splicing modifiers improve motor function and longevity in mice with spinal muscular atrophy. Science (New York, N.Y.) 2014;345:688–693. doi: 10.1126/science.1250127. [DOI] [PubMed] [Google Scholar]
  46. Newman AM, Steen CB, Liu CL, Gentles AJ, Chaudhuri AA, Scherer F, Khodadoust MS, Esfahani MS, Luca BA, Steiner D, Diehn M, Alizadeh AA. Determining cell type abundance and expression from bulk tissues with digital cytometry. Nature Biotechnology. 2019;37:773–782. doi: 10.1038/s41587-019-0114-2. [DOI] [PMC free article] [PubMed] [Google Scholar]
  47. Nguyen ED, Balas MM, Griffin AM, Roberts JT, Johnson AM. Global profiling of hnRNP A2/B1-RNA binding on chromatin highlights LncRNA interactions. RNA Biology. 2018;15:901–913. doi: 10.1080/15476286.2018.1474072. [DOI] [PMC free article] [PubMed] [Google Scholar]
  48. Percipalle P, Jonsson A, Nashchekin D, Karlsson C, Bergman T, Guialis A, Daneholt B. Nuclear actin is associated with A specific subset of hnRNP A/B-type proteins. Nucleic Acids Research. 2002;30:1725–1734. doi: 10.1093/nar/30.8.1725. [DOI] [PMC free article] [PubMed] [Google Scholar]
  49. Perez-Perri JI, Rogell B, Schwarzl T, Stein F, Zhou Y, Rettel M, Brosig A, Hentze MW. Discovery of RNA-binding proteins and characterization of their dynamic responses by enhanced RNA interactome capture. Nature Communications. 2018;9:4408. doi: 10.1038/s41467-018-06557-8. [DOI] [PMC free article] [PubMed] [Google Scholar]
  50. Sambasivan R, Yao R, Kissenpfennig A, Van Wittenberghe L, Paldi A, Gayraud-Morel B, Guenou H, Malissen B, Tajbakhsh S, Galy A. Pax7-expressing satellite cells are indispensable for adult skeletal muscle regeneration. Development (Cambridge, England) 2011;138:3647–3656. doi: 10.1242/dev.067587. [DOI] [PubMed] [Google Scholar]
  51. Scotti MM, Swanson MS. RNA mis-splicing in disease. Nature Reviews. Genetics. 2016;17:19–32. doi: 10.1038/nrg.2015.3. [DOI] [PMC free article] [PubMed] [Google Scholar]
  52. Sharples AP, Hughes DC, Deane CS, Saini A, Selman C, Stewart CE. Longevity and skeletal muscle mass: the role of IGF signalling, the sirtuins, dietary restriction and protein intake. Aging Cell. 2015;14:511–523. doi: 10.1111/acel.12342. [DOI] [PMC free article] [PubMed] [Google Scholar]
  53. Shi X, Garry DJ. Muscle stem cells in development, regeneration, and disease. Genes & Development. 2006;20:1692–1708. doi: 10.1101/gad.1419406. [DOI] [PubMed] [Google Scholar]
  54. Sincennes MC, Brun CE, Rudnicki MA. Concise Review: Epigenetic Regulation of Myogenesis in Health and Disease. Stem Cells Translational Medicine. 2016;5:282–290. doi: 10.5966/sctm.2015-0266. [DOI] [PMC free article] [PubMed] [Google Scholar]
  55. Singh RK, Xia Z, Bland CS, Kalsotra A, Scavuzzo MA, Curk T, Ule J, Li W, Cooper TA. Rbfox2-coordinated alternative splicing of Mef2d and Rock2 controls myoblast fusion during myogenesis. Molecular Cell. 2014;55:592–603. doi: 10.1016/j.molcel.2014.06.035. [DOI] [PMC free article] [PubMed] [Google Scholar]
  56. Singh RK, Kolonin AM, Fiorotto ML, Cooper TA. Rbfox-Splicing Factors Maintain Skeletal Muscle Mass by Regulating Calpain3 and Proteostasis. Cell Reports. 2018;24:197–208. doi: 10.1016/j.celrep.2018.06.017. [DOI] [PMC free article] [PubMed] [Google Scholar]
  57. Stuart T, Butler A, Hoffman P, Hafemeister C, Papalexi E, Mauck WM, Hao Y, Stoeckius M, Smibert P, Satija R. Comprehensive Integration of Single-Cell Data. Cell. 2019;177:1888–1902. doi: 10.1016/j.cell.2019.05.031. [DOI] [PMC free article] [PubMed] [Google Scholar]
  58. Taylor JP, Brown RH, Cleveland DW. Decoding ALS: from genes to mechanism. Nature. 2016;539:197–206. doi: 10.1038/nature20413. [DOI] [PMC free article] [PubMed] [Google Scholar]
  59. Thomas JD, Sznajder ŁJ, Bardhi O, Aslam FN, Anastasiadis ZP, Scotti MM, Nishino I, Nakamori M, Wang ET, Swanson MS. Disrupted prenatal RNA processing and myogenesis in congenital myotonic dystrophy. Genes & Development. 2017;31:1122–1133. doi: 10.1101/gad.300590.117. [DOI] [PMC free article] [PubMed] [Google Scholar]
  60. Trapnell C, Williams BA, Pertea G, Mortazavi A, Kwan G, van Baren MJ, Salzberg SL, Wold BJ, Pachter L. Transcript assembly and quantification by RNA-Seq reveals unannotated transcripts and isoform switching during cell differentiation. Nature Biotechnology. 2010;28:511–515. doi: 10.1038/nbt.1621. [DOI] [PMC free article] [PubMed] [Google Scholar]
  61. Van Nostrand EL, Pratt GA, Shishkin AA, Gelboin-Burkhart C, Fang MY, Sundararaman B, Blue SM, Nguyen TB, Surka C, Elkins K, Stanton R, Rigo F, Guttman M, Yeo GW. Robust transcriptome-wide discovery of RNA-binding protein binding sites with enhanced CLIP (eCLIP) Nature Methods. 2016;13:508–514. doi: 10.1038/nmeth.3810. [DOI] [PMC free article] [PubMed] [Google Scholar]
  62. Venables JP, Lapasset L, Gadea G, Fort P, Klinck R, Irimia M, Vignal E, Thibault P, Prinos P, Chabot B, Abou Elela S, Roux P, Lemaitre JM, Tazi J. MBNL1 and RBFOX2 cooperate to establish a splicing programme involved in pluripotent stem cell differentiation. Nature Communications. 2013;4:2480. doi: 10.1038/ncomms3480. [DOI] [PubMed] [Google Scholar]
  63. Vogler TO, Wheeler JR, Nguyen ED, Hughes MP, Britson KA, Lester E, Rao B, Betta ND, Whitney ON, Ewachiw TE, Gomes E, Shorter J, Lloyd TE, Eisenberg DS, Taylor JP, Johnson AM, Olwin BB, Parker R. TDP-43 and RNA form amyloid-like myo-granules in regenerating muscle. Nature. 2018;563:508–513. doi: 10.1038/s41586-018-0665-2. [DOI] [PMC free article] [PubMed] [Google Scholar]
  64. Wang H, Liang L, Dong Q, Huan L, He J, Li B, Yang C, Jin H, Wei L, Yu C, Zhao F, Li J, Yao M, Qin W, Qin L, He X. Long noncoding RNA miR503HG, a prognostic indicator, inhibits tumor metastasis by regulating the HNRNPA2B1/NF-κB pathway in hepatocellular carcinoma. Theranostics. 2018;8:2814–2829. doi: 10.7150/thno.23012. [DOI] [PMC free article] [PubMed] [Google Scholar]
  65. Weskamp K, Tank EM, Miguez R, McBride JP, Gómez NB, White M, Lin Z, Gonzalez CM, Serio A, Sreedharan J, Barmada SJ. Shortened TDP43 isoforms upregulated by neuronal hyperactivity drive TDP43 pathology in ALS. The Journal of Clinical Investigation. 2020;130:1139–1155. doi: 10.1172/JCI130988. [DOI] [PMC free article] [PubMed] [Google Scholar]
  66. Wirth B, Karakaya M, Kye MJ, Mendoza-Ferreira N. Twenty-Five Years of Spinal Muscular Atrophy Research: From Phenotype to Genotype to Therapy, and What Comes Next. Annual Review of Genomics and Human Genetics. 2020;21:231–261. doi: 10.1146/annurev-genom-102319-103602. [DOI] [PubMed] [Google Scholar]
  67. Wolf FA, Hamey FK, Plass M, Solana J, Dahlin JS, Göttgens B, Rajewsky N, Simon L, Theis FJ. PAGA: graph abstraction reconciles clustering with trajectory inference through a topology preserving map of single cells. Genome Biology. 2019;20:e59. doi: 10.1186/s13059-019-1663-x. [DOI] [PMC free article] [PubMed] [Google Scholar]
  68. Xue YC, Ng CS, Xiang P, Liu H, Zhang K, Mohamud Y, Luo H. Dysregulation of RNA-Binding Proteins in Amyotrophic Lateral Sclerosis. Frontiers in Molecular Neuroscience. 2020;13:78. doi: 10.3389/fnmol.2020.00078. [DOI] [PMC free article] [PubMed] [Google Scholar]
  69. Yu Z, Wang AM, Robins DM, Lieberman AP. Altered RNA splicing contributes to skeletal muscle pathology in Kennedy disease knock-in mice. Disease Models & Mechanisms. 2009;2:500–507. doi: 10.1242/dmm.003301. [DOI] [PMC free article] [PubMed] [Google Scholar]

Editor's evaluation

Douglas L Black 1

Wheeler and colleagues examine genetic pathways of myogenesis in regenerating muscle. Using extensive single cell and whole-genome analyses, they uncover a new role for the RNA binding protein hnRNP A2B1, showing that it plays a key role in defining muscle-specific splicing patterns during development.

Decision letter

Editor: Douglas L Black1

In the interests of transparency, eLife publishes the most substantive revision requests and the accompanying author responses.

Decision letter after peer review:

[Editors’ note: the authors submitted for reconsideration following the decision after peer review. What follows is the decision letter after the first round of review.]

Thank you for submitting your work entitled "RNA-binding proteins direct myogenic cell fate decisions" for consideration by eLife. Your article has been reviewed by 3 peer reviewers, and the evaluation has been overseen by a Reviewing Editor and a Senior Editor. The following individual involved in review of your submission has agreed to reveal their identity: Maurice Swanson (Reviewer #3).

Comments to the Authors:

We are sorry to say that, after consultation with the reviewers, we have decided that your work cannot be considered further for publication by eLife.

All of the reviewers found the single cell analysis to be a valuable contribution to the field. However, none of the reviewers were convinced by the evidence that hnRNP A2B1 is a key mediator of the myogenic program. These findings were felt to be overstated. It was not clear why this particular factor was chosen for detailed analysis. Given these concerns, it was felt that the manuscript would require very extensive revisions, which would go beyond the revision policy of eLife.

Reviewer #1:

The authors used single cell sequencing at days 4 and 7 following mouse skeletal muscle injury to identify nine myogenic subclusters. RNA velocity and partition-based graph abstraction were used to identify temporal dynamics and connectivity between clusters. Analysis of RBP mRNA levels shows striking differences between clusters. This is not particularly surprising as one would expect the same if a class of 1500 or, so genes of another category were analyzed. They focus on several RBP known to be involved in disease and specifically Hnrnpa2b1 early during muscle regeneration which they show is increased in Pax7+ cells and in centrally localized nuclei of regenerating myofibers and decline four weeks later. Loss of Hnrnpa2b1 by CRISPR KO in the mouse C2C12 myoblast cell line reduces muscle differentiation (although it is unclear whether whether this result is derived from multiple independent clones or a single clone, and clonal isolates of C2C12 can have a wide variation in differentiation potential) and results in altered splicing of >2000 RNAs including other RNA binding proteins that regulate splicing as well as other RNA processing. To address the possibility that Hnrnpa2b1a is required for myogenic cell population transitions during regeneration, they used a machine learning approach inputting single cell sequence, C2C12 differentiation and Hnrnpa2b1 RNA-seq data. The result suggests a hypothesis that Hnrnpa2b1 splicing function is required for transitions of specific myogenic populations, which unfortunately the authors take as fact. eCLIP analysis of Hnrnpa2b1-associated RNAs in C2C12 proliferating and differentiated cultures was used to identify surprisingly small numbers of genes (247 and 137, respectively) perhaps owing to the high quality of the approach. The data was used to derive a so-called RBP engagement score correlating the expression of the RBP and its target pre-mRNA at the level of single cells. The results were used to support the hypothesis that Hnrnpa2b1 is required for transition from subclusters during myogenic cell transitions.

The results presented are of high quality and when released it will be a very useful data set. The analyses performed lead to reasonable hypothesis but, unfortunately, rarely are they tested and done so directly and rigorously. The authors generated a great deal of data that appears to be of high quality and then tried to make several attempts at connections to RNA binding proteins in human disease, splicing regulation and cross regulation of other RNA binding proteins with Hnrnpa2b1 as a major central regulator of muscle differentiation. Conclusions were often based on inference and correlation or lacked sufficient experimental support.

The results presented are of high quality and when released it will be a very useful data set. One main and in fact disturbing issue with the paper is the superficiality of many of the conclusions and a lack of rigor with regard to making conclusions, a list of only some examples is below. There are many examples of possibilities suggested, implied and what could be the case based on the data, but often the conclusions are based on highly derivative data and the likelihood of coming away with a solid new piece of information is quite weak. The analyses performed lead to reasonable hypothesis but rarely are they tested and done so directly and rigorously to a satisfying endpoint. A few conjectures are reasonable to present; however, some of their major conclusions are very weakly supported and other explanations are just as likely. One example is the conclusions that Hnrnpa2b1 is required for myogenic differentiation and that it is implied to be "a central regulator within a network of splicing factors that directs specific myogenic cell fate". The direct evidence that Hnrnpa2b1 is required for myogenic differentiation comes from CRISPR/Cas9 mediated knock out in C2C12. Clonal Hnrnpa2b1 knock out mouse C2C12 cell lines were generated and Figure 4 shows statistically significant reduced differentiation; however, it is very important to know whether this result is derived from multiple independent clones or a single clone. This information is not available in the manuscript. Clonal isolates of C2C12 will have a wide variation in differentiation potential given the heterogeneity of cells within the parental population. The authors need to demonstrate that the reduced differentiation potential is consistent among several KO cell lines; or show that the phenotype can be rescued by Hnrnpa2b1 expression. Another approach to avoid issues of clonal variability is to use siRNA knock down in a standard C2C12 culture that is known to be efficient throughout the period required for differentiation. With regard to the conclusion that Hnrnpa2b1 is among central regulators, like many statements and conclusions presented, it is quite possible but without a clear demonstration that loss of Hnrnpa2b1 has a consistent physiological effect, it could also be a minor player.

If the authors were to generate a conditional Hnrnpa2b1 KO that was muscle specific and tamoxifen-induced in adult mice (all doable), then did a regeneration assay as in Figure 1, would they find a critical role for Hnrnpa2b1 in regeneration and would they find blockage between subcluster 5 and 6? This would be the definitive experiment to support what is proposed but this is too much to ask.

In the end the technology the single cell Seq, eCLIP etc, are fantastic approaches but are also screens that need to be validated and while I don't understand the computational analysis (and who among the majority of reviewers of such work do), it does require subjective decisions of filtering and criteria selection that is largely opaque so also needs strong experimental validation to produce conclusions that will stand the test of time. In this manuscript I worry that the use of sophisticated technologies and derivative computational analysis supplants definitive experiments, independent validation and well supported conclusions.

Reviewer #2:

In this manuscript, the authors used single cell RNA-sequencing, machine learning and other strong techniques to determine the timing of RPB expression during muscle regeneration and identify the networks of RBPs involved in myogenic cell fate transitions.

Authors goal is novel and well framed. Their conclusions are mostly well supported by their extensive set of experiments and deep analysis of their result.

Through the data and analysis presented in the manuscript, the authors achieved their goal. Furthermore, the new information presented here has the potential to be used by several groups with expertise in specific muscle disorders to more deeply understand the mechanism behind those diseases.

Strengths

1. The research in this paper is novel in an area that is under-explored in the splicing field and furthermore it has strong implications in muscle diseases and muscle cell regeneration. I agree with authors' statement: "little is known regarding the mechanisms regulating the timing of RBP function during myogenesis or the mechanisms by which RBPs influence myogenic cell fate decision". Thus, this manuscript has the potential to fill this interesting gap of knowledge in the muscle field.

2. The usage of machine learning is to explore post-transcriptional regulation during cell differentiation is very interesting

3. Using single cell RNA-sequencing in muscle stem cells is a strong novelty and appropriate to achieve the goal of the study.

Weakness

1. It is unclear how the authors discriminate the direct effect of Hnrnpa2b1 on splicing and expression from the fact that cells are not differentiating. This is my main concern since we know that there are extensive changes during normal myogenesis and C2C12 myoblast differentiation into myotubes. I personally think that many, many of the changes that you are detecting are due to the absence of differentiation. I think this aspect / caveat should be discussed and/or rule out.

1. Please, justify some of your statements with references or rationale from your side. One example is in line 169-171: "Although the mechanism of myogenic cell fate change is clearly multifactorial, a likely driver of rapid and dynamic cell fate changes is post-transcriptional control of RNA.". Why? Where are you basing this hypothesis on?

2. Same here (lines 177-178): "While RBP expression increases during muscle regeneration…". All RBPs are upregulated during muscle regeneration?? If so, please, provide the evidence.

3. Figure 4 A-B: please support the microscopy evidence with a more quantitative method for protein expression such as Western blotting. Measuring intensity in microscopy images from immunofluorescence experiments is not an accurate way to quantify levels of protein expression especially when comparing different images. Please, also state which cells are you using in the text and the figure legend. Are those C2C12 cells? I guess so since those cells are used in other panels of Figure 4. But, please, clarify this.

4. How are you discriminating the direct effect of Hnrnpa2b1 on splicing and expression from the fact that myoblasts are not differentiating into myotubes? This is my main concern since we know that there are extensive transcriptional and post-transcriptional changes during in vivo myogenesis and in vitro C2C12 myoblast differentiation into myotubes. I personally think that many of the changes that you are detecting might due to the absence of differentiation.

Reviewer #3:

Wheeler et al. use a number of informative tools to investigate the roles of RNA binding proteins (RBPs) in skeletal muscle cell fate decisions initially with scRNAseq of BaCl2 damaged TA muscle 4- and 7-days post injury (dpi) combined with machine learning and RBP engagement scoring to highlight a prominent role for Hnrnpa2b1 as a key myogenic differentiation factor. This conclusion is substantiated by analysis of C2C12 myogenic differentiation in vitro, where the authors unexpectedly discover that this RBP is not essential for myoblast proliferation but is required for myogenic differentiation. Identification of direct downstream splicing targets using RNAseq and eCLIP revealed that Mbnl1, Mbnl2 and Rbfox2, known RBP regulators of myogenesis, were altered in Hnrnpa2b1 KOs suggesting that this RBP is a central splicing and differentiation regulator. To differentiate direct vs indirect effects on splicing, eCLIP is performed and together with RBP engagement scoring and assignment of gene expression signatures to specific clusters indicates a subcluster 5 to 6 block due to Hnrnpa2b1 loss. While previous work has highlighted functions for various RBPs in muscle diseases, this study constitutes a significant addition since it alters our prior views of Hnrnpa2b1 functions during cell proliferation and differentiation, provides insights into stage-specific functions, and details an experimental pathway to similarly classify other ubiquitously expressed RBPs.

The presentation is generally clear but several issues should be addressed.

1. Figures 2A, B and 3. Given the RBP hierarchical clustering and scRNA expression analysis of myogenic clusters, which revealed similar patterns for Hnrnpa1 and Hnrnpa2b1 (except for Subcluster 3), additional justification should be included for the subsequent exclusive focus on Hnrnpa2b1. For example, in Figure 3, do expression characteristics following injury differ between these two RBPs?

2. Figure 4F. Additional information on the differentiation defect in Hnrnpa1b1 KO myoblasts would be helpful – do the KO myoblasts show any morphological changes after differentiation induction?

4. Figure 5B. The exon/intron patterns for Mbnl1, Mbnl2 and Rbfox2 appear to differ significantly from the UCSC browser view (in contrast, Hnrnpa2b1 in Figure S6F/G is correct) so confirm genomic coordinates. In addition, discuss the exons that are up/down in the Hnrnpa2b1 KO and how these alternative splicing patterns might affect the activity or localization of the encoded RBP isoforms.

5. Figure 6A. The majority of Hnrnpa2b1 eCLIP tags are in the 3'UTR (myoblasts, ~47%; myotubes ~65%) so does this suggest that the predominant problem in Hnrnpa2b1 KOs is RNA localization, translation and/or turnover. On p16 (last sentence), note that in myoblasts distal intron binding sites predominate over proximal.

[Editors’ note: further revisions were suggested prior to acceptance, as described below.]

Thank you for submitting your article "RNA-binding proteins direct myogenic cell fate decisions" for consideration by eLife. Your article has been reviewed by 3 peer reviewers, and the evaluation has been overseen by Reviewing Editor Douglas Black and Senior Editor James Manley. The reviewers have opted to remain anonymous.

The reviewers have discussed their reviews with one another, and the Reviewing Editor has drafted this to help you prepare a revised submission.

Since this study was previously rejected for publication in eLife, this submission is considered a new manuscript.

Wheeler and colleagues investigate the roles of RNA binding proteins in muscle cell fate decisions initially using single cell (sc)RNAseq analysis of injured skeletal muscle at 4- and 7-days post injury. They develop a myogenesis trajectory map and focus on three cell populations that are divided into 9 subclusters defined for connectivity. MuSC RBP expression in subclusters 0-6 revealed high expression of Hnrnpa1 and Hnrnpa2b1. Hnrnpa2b1 levels were seen to increase during regeneration in Pax7+ MuSCs and myofibers. Hnrnpa2b1 knockout clones continue to proliferate but fail to differentiate, and exhibit a large number splicing alterations from wildtype cells, including in the developmental regulators Mbnl1, Mbnl2 and Rbfox2. Direct RNA targets of Hnrnpa2b1 were identified by eCLIP. They use a machine learning tool to estimate myogenic subcluster contributions to bulk RNAseq datasets of proliferating and differentiating myoblasts, with Hnrnpa2b1 loss predicted to lead to subcluster-specific splicing changes.

All of the reviewers found this study to be of interest – providing new insights into RNA metabolism in differentiating muscle and defining stage-specific functions of an important RBP. Nevertheless, a number of issues were raised regarding the data interpretation as well as aspects of the bioinformatics analysis. Addressing these will require additional analyses and other modifications to the study.

Essential revisions

1. There are extensive changes in splicing during normal myogenesis and C2C12 myoblast differentiation into myotubes. The Hnrnpa2b1 C2C12 knockout clones fail to differentiate, so many of the splicing effects may simply reflect failed differentiation and not direct regulation by Hnrnpa2b1. This question was brought up in reviews of the earlier study and is still a concern that is not resolved by the new analyses and bioinformatics. Transcriptional and posttranscriptional changes observed in the Hnrnpa2b1 KO cells should be compared to those known to occur during normal C2C12 cell differentiation (data available in Singh et al., Molecular Cell 2014 PMID: 25087874 and possibly elsewhere). This analysis will allow the authors to discuss how the Hnrnpa2b1 splicing program might differ from a presumably larger program occurring with differentiation.

2. The majority of Hnrnpa2b1 eCLIP tags are in the 3'UTR (myoblasts, ~47%; myotubes ~65%). However, the final model is that Hnrnpa2b1 regulates cell fate decisions via modulation of RNA splicing of both direct targets and alterations in other splicing regulators. It seems likely that other Hnrnpa2b1-mediated events will be equally if not more important. Processes potentially affected by 3' UTR binding include mRNA translation, localization and decay, all of which likely contribute to a differentiation program. The authors should assess whether transcripts bound by Hnrnpa2b1 in their 3' UTR show changes in overall expression rather than splicing in response to Hnrnpa2b1 depletion. Are these 3' UTR binding sites found adjacent to recognition elements for muscle specific microRNAs? Given the many examples of RNA binding proteins of this type affecting differentiation by modulating the processing of pri or pre-miRNAs to mature miRNAs, the authors should examine their existing RNAseq and iCLIP data for evidence of Hnrnpa2b1 affecting miRNA precursors. They should consider profiling the miRNAs in their cells by short RNA sequencing.

3. The genomic data and bioinformatic analyses are not sufficiently described to be adequately assessed.

A. The authors identified over 2000 target RNAs altered in Hnrnpa2b1 KO cells, were these genes or alternative splicing events? It is not clear what degree of confidence can be placed on these findings. How many replicates were profiled? What is the magnitude of the splicing changes? What criteria were used to determine if these changes resulted from direct regulation by Hnrnpa2b1 or were due to indirect effects such as failure to differentiate as described above?

B. The authors point out altered splicing in the splicing regulators Mbnl1/2 and Rbfox2. From the data shown, it is difficult to judge the magnitude of splicing changes, and whether they are sufficient to actually have an impact on their downstream targets.

C. The quality of eCLIP data is unclear. The number of tags before cluster identification is not described in the main text. From the examples shown in Figure S6 F,G, the CLIP tags are widely distributed and somewhat similar to the input. This is an indication of a possible high background in the IP, which may explain the small number of significant peaks when normalized to input. It is unclear whether the binding sites identified by CLIP support splicing changes identified by RNA-seq.

D. Validation of the engagement scoring is not presented. While an RBP and its target need to be coexpressed for a regulatory process to occur, it is not clear how co-expression alone will provide a measure of regulatory activity. For example, if an RBP suppresses gene expression, it might be anticorrelated with its targets.

Reviewer #1:

RNA binding proteins (RBPs) play key roles in muscle stem cell (MuSC) quiescence, activation and self-renewal, and disease-associated RBP mutations have been linked to severe muscle loss. In this study, Wheeler and colleagues investigate RBP roles in muscle cell fate decisions initially using single cell (sc)RNAseq analysis of injured skeletal muscle at 4- and 7-days post injury. To define the myogenesis trajectory map they subsequently focus on three cell populations that are further divided into 9 subclusters followed by RNA velocity and partition-based abstraction to highlight inter-cluster connectivity and directionality. MuSC RBP expression in subclusters 0-6 revealed high expression of Hnrnpa1 and Hnrnpa2b1, and since a previous study demonstrated myofibril hypoplasia in mouse Hnrnpa1 knockout mice, they pursued Hnrnpa2b1. Hnrnpa2b1 levels increase during regeneration in Pax7+ MuSCs and myofibers. Multiple Hnrnpa2b1 knockout clones show significant myoblast fusion, but not proliferation, defects and splicing alterations in the developmental regulators Mbnl1, Mbnl2 and Rbfox2. Since the observed splicing changes could result from indirect effects of differentiation failure, they used a machine learning tool to determine myogenic subcluster levels from bulk RNAseq datasets of proliferating and differentiating myoblasts. They find that Hnrnpa2b1 loss leads to subcluster-specific splicing changes, and direct vs indirect RNA targets were identified by eCLIP and RNA engagement scoring. While previous studies have analyzed scRNAseq of regenerating muscle, this study provides novel insights into stage-specific functions of an important RBP and thus provides an experimental pathway to similarly classify additional RBPs. Although prior studies have also analyzed scRNAseq of regenerating muscle, the RBP emphasis and experimental strategy is novel and the observed effects of Hnrnpa2b1 loss on the splicing of other developmental splicing factors is an important contribution. Hnrnpa21 C2C12 knockout clones fail to differentiate, so a remaining concern is that many of the splicing effects may simply reflect failed differentiation although the authors could address this issue by knockout an unrelated gene that is required for C2C12 differentiation.

Reviewer #2:

In this manuscript, the authors used single cell RNA-sequencing, machine learning and other novel techniques to determine the timing of RPB expression during muscle regeneration and identify the networks of RBPs involved in myogenic cell fate transitions.

[Editors’ note: further revisions were suggested prior to acceptance, as described below.]

Thank you for resubmitting your work entitled "RNA-binding proteins direct myogenic cell fate decisions" for further consideration by eLife. Your revised article has been evaluated by James Manley (Senior Editor) and Douglas Black (Reviewing Editor).

The manuscript has been improved but there are some remaining issues that need to be addressed, as outlined below:

Regarding the correlation of the hnRNP A2B1 binding to splicing regulation, you should consider the standard approach of generating an RBP map that shows clip binding density in relation to a metagene derived from all the up and downregulated exons. There are several tools available for doing this and you should assess whether they can be applied to your data. Such a map would be useful to determine whether splicing activation and repression by hnRNP A2B1 showed similar dependence on binding site position relative the exon as seen with some other regulators, and whether hnRNP A2B1 behaves similarly to its homolog hnRNP A1. In the absence of such a map or in addition, it would also be helpful to show an example or two of a clip peak mapping to a strongly regulated exon. As the data are currently presented it is difficult to assess the Clip in relation to the splicing changes, which your response indicates you want to emphasize.

eLife. 2022 Jun 13;11:e75844. doi: 10.7554/eLife.75844.sa2

Author response


[Editors’ note: the authors resubmitted a revised version of the paper for consideration. What follows is the authors’ response to the first round of review.]

Comments to the Authors:

We are sorry to say that, after consultation with the reviewers, we have decided that your work cannot be considered further for publication by eLife.

All of the reviewers found the single cell analysis to be a valuable contribution to the field. However, none of the reviewers were convinced by the evidence that hnRNP A2B1 is a key mediator of the myogenic program. These findings were felt to be overstated. It was not clear why this particular factor was chosen for detailed analysis. Given these concerns, it was felt that the manuscript would require very extensive revisions, which would go beyond the revision policy of eLife.

Reviewer #1:

The authors used single cell sequencing at days 4 and 7 following mouse skeletal muscle injury to identify nine myogenic subclusters. RNA velocity and partition-based graph abstraction were used to identify temporal dynamics and connectivity between clusters. Analysis of RBP mRNA levels shows striking differences between clusters. This is not particularly surprising as one would expect the same if a class of 1500 or, so genes of another category were analyzed. They focus on several RBP known to be involved in disease and specifically Hnrnpa2b1 early during muscle regeneration which they show is increased in Pax7+ cells and in centrally localized nuclei of regenerating myofibers and decline four weeks later. Loss of Hnrnpa2b1 by CRISPR KO in the mouse C2C12 myoblast cell line reduces muscle differentiation (although it is unclear whether whether this result is derived from multiple independent clones or a single clone, and clonal isolates of C2C12 can have a wide variation in differentiation potential) and results in altered splicing of >2000 RNAs including other RNA binding proteins that regulate splicing as well as other RNA processing. To address the possibility that Hnrnpa2b1a is required for myogenic cell population transitions during regeneration, they used a machine learning approach inputting single cell sequence, C2C12 differentiation and Hnrnpa2b1 RNA-seq data. The result suggests a hypothesis that Hnrnpa2b1 splicing function is required for transitions of specific myogenic populations, which unfortunately the authors take as fact. eCLIP analysis of Hnrnpa2b1-associated RNAs in C2C12 proliferating and differentiated cultures was used to identify surprisingly small numbers of genes (247 and 137, respectively) perhaps owing to the high quality of the approach. The data was used to derive a so-called RBP engagement score correlating the expression of the RBP and its target pre-mRNA at the level of single cells. The results were used to support the hypothesis that Hnrnpa2b1 is required for transition from subclusters during myogenic cell transitions.

The results presented are of high quality and when released it will be a very useful data set. The analyses performed lead to reasonable hypothesis but, unfortunately, rarely are they tested and done so directly and rigorously. The authors generated a great deal of data that appears to be of high quality and then tried to make several attempts at connections to RNA binding proteins in human disease, splicing regulation and cross regulation of other RNA binding proteins with Hnrnpa2b1 as a major central regulator of muscle differentiation. Conclusions were often based on inference and correlation or lacked sufficient experimental support.

We thank the reviewer for their thoughtful comments. As the reviewer raises several points in this comment, for clarity, we have separated out each of these points and will address each below in turn.

The results presented are of high quality and when released it will be a very useful data set. One main and in fact disturbing issue with the paper is the superficiality of many of the conclusions and a lack of rigor with regard to making conclusions, a list of only some examples is below. There are many examples of possibilities suggested, implied and what could be the case based on the data, but often the conclusions are based on highly derivative data and the likelihood of coming away with a solid new piece of information is quite weak. The analyses performed lead to reasonable hypothesis but rarely are they tested and done so directly and rigorously to a satisfying endpoint. A few conjectures are reasonable to present; however, some of their major conclusions are very weakly supported and other explanations are just as likely.

The reviewer's major criticism is many of our conclusions lack experimental validation. We have toned down the language in our manuscript to better align with the presented data.

We would make additional two points in response to the reviewer’s comments.

First, the experimental tools utilized in our manuscript serve to support our conclusions. Our experiments define a role for RNA-binding proteins (RBPs) in directing cell fates. We experimentally confirm the role for one RBP, Hnrnpa2b1, in regulating cell fate decisions. We use a multiomic, genetic, biochemical, and novel computational approaches to support these conclusions. Our work serves as a testament to the power of using a multidisciplinary approach to generate fresh insights into RBP and RNA biology.

Second, we agree that our datasets and methodologies will be of broad interest to the scientific community. Our approach provides a model for the use of multiomic technologies in exploring gene expression regulation during complex biologic processes.

One example is the conclusions that Hnrnpa2b1 is required for myogenic differentiation and that it is implied to be "a central regulator within a network of splicing factors that directs specific myogenic cell fate". The direct evidence that Hnrnpa2b1 is required for myogenic differentiation comes from CRISPR/Cas9 mediated knock out in C2C12. Clonal Hnrnpa2b1 knock out mouse C2C12 cell lines were generated and Figure 4 shows statistically significant reduced differentiation; however, it is very important to know whether this result is derived from multiple independent clones or a single clone. This information is not available in the manuscript. Clonal isolates of C2C12 will have a wide variation in differentiation potential given the heterogeneity of cells within the parental population. The authors need to demonstrate that the reduced differentiation potential is consistent among several KO cell lines; or show that the phenotype can be rescued by Hnrnpa2b1 expression. Another approach to avoid issues of clonal variability is to use siRNA knock down in a standard C2C12 culture that is known to be efficient throughout the period required for differentiation. With regard to the conclusion that Hnrnpa2b1 is among central regulators, like many statements and conclusions presented, it is quite possible but without a clear demonstration that loss of Hnrnpa2b1 has a consistent physiological effect, it could also be a minor player.

The reviewer makes two points here which we address below.

The major criticism is the perceived lack experimental rigor in supporting our conclusions. Here, the reviewer focuses on our knockout experiments as an example of a lack of our experimental rigor. The reviewer contests that three independent clones are necessary to define a triplicate and to make any biologic claim as to the impact of Hnrnpa2b1 loss on splicing changes. The reviewer states, "this information is not available in the manuscript." In two separate sections of our original manuscript, we detailed our generation and use of three biologic clones. First, in the figure legend, we state "All images represent n=3 biological replicates from 3 independent WT and KO Hnrnpa2b1 clones” (Figure S4). Second, in the methods section, we write "Myoblasts KO and WT clones were isolated using cloning ring and selectively detaching clonal populations via trypsinization. Clonal population KO was validated via immunofluorescence and western blotting."

The next issue raised by the reviewer centers on Hnrnpa2b1 impacting RNA splicing. The evidence we provide for this claim is three-fold.

(i) In three separate Hnrnpa2b1 KO clones, loss of Hnrnpa2b1 results in arrest of myogenic differentiation. RNA sequencing shows global splicing alterations in the differentiating Hnrnpa2b1 KO cells compared to wild type. As discussed more thoroughly below, we also show that Hnrnpa2b1 splicing directly impacts specific cell states. Thus, the detected splicing defects are a result of Hnrnpa2b1 functioning as a splicing regulator and are not a result of sequencing populations of cells in different differentiation states.

(ii) Hnrnpa2b1 loss results in the altered splicing for several RBP including Rbfox2, Mbnl1, and Mbnl2. RIP and eCLIP experiments show Hnrnpa2b1 binds to the RNA encoding these RBPs. These results show Hnrnpa2b1 regulates the splicing of myogenic RBPs including Rbfox2, Mbnl1, and Mbnl2. Therefore, Hnrnpa2b1 also directly regulates the splicing of other RBP splicing factors.

(iii) Hnrnpa2b1 knockout results in the loss of function for Rbfox2, Mbnl1, and Mbnl2 due to the altered splicing of key domains in these proteins. The altered splicing results in the exclusion of exons encoding zinc finger domains and RNA recognition motifs involved in RNA binding. We show that the altered spliced RNA populations significantly overlap between Hnrnpa2b1, Rbfox2, Mbnl1, and Mbnl2 KO cell lines. These results are compatible with Hnrnpa2b1 loss resulting in the mis-splicing of Rbfox2, Mbnl1, and Mbnl2 leading to impaired splicing function in these RBPs.

Together, we provide evidence for Hnrnpa2b1 interacting and regulating the splicing of other RBPs including Rbfox2, Mbnl1, and Mbnl2. We further define the timing of Hnrnpa2b1 splicing functionality at a single cell level. These results support our assertion that Hnrnpa2b1 is a central splicing regulator.

If the authors were to generate a conditional Hnrnpa2b1 KO that was muscle specific and tamoxifen-induced in adult mice (all doable), then did a regeneration assay as in Figure 1, would they find a critical role for Hnrnpa2b1 in regeneration and would they find blockage between subcluster 5 and 6? This would be the definitive experiment to support what is proposed but this is too much to ask.

In this comment, the reviewer asks us to make a conditional Hnrnpa2b1 knockout mouse. As the reviewer points out though, “(while) this would be the definitive experiment… this is too much to ask.” We agree that this experiment is beyond the scope of the current manuscript.

We would make two additional points.

First, the complexity and expense of this experiment is unreasonable. The reviewer is requesting a conditional Hnrpa2b1 muscle stem cell specific knockout mouse. Next, the reviewer is asking for single cell RNA sequencing in both conditional knockout and wild type Hnrnpa2b1 mice. Single cell RNA sequencing would be necessary at multiple time points following injury in both wild type and knockout mice. Then, the reviewer is requesting bioinformatic and immunohistochemical validation. This is all to show Hnrnpa2b1 knockout stem cells accumulate in myogenic subcluster 5 and 6. This experimental is unreasonable in its scope and complexity, requiring substantial resources and time. It is unlikely we could complete this request in less than 3 years.

Second, successful completion of this experiment does little to add to the overall conclusions already presented in our manuscript. We show a role for Hnrnpa2b1 in regulating myogenic fate decisions and terminal differentiation. This conclusion is built upon in vitro and in vivo experiments. Further, the reviewer is missing a critical aspect of our manuscript. Our goal is to develop and share a bioinformatic approach which generates insight into the functionality of RBPs using multiomic datasets. Using this approach, we identify and characterize the role for Hnrnpa2b1 in both in vitro and in vivo systems. Our results show the power of our computational approach in generating fresh insight from multiomic data. Additional experiments do little to add to the presented conclusions.

In the end the technology the single cell Seq, eCLIP etc, are fantastic approaches but are also screens that need to be validated and while I don't understand the computational analysis (and who among the majority of reviewers of such work do), it does require subjective decisions of filtering and criteria selection that is largely opaque so also needs strong experimental validation to produce conclusions that will stand the test of time. In this manuscript I worry that the use of sophisticated technologies and derivative computational analysis supplants definitive experiments, independent validation and well supported conclusions.

We appreciate the reviewer's honesty in their review of our manuscript. Here, the reviewer states "I don't understand the computational analysis." We trust the other reviewers have expertise in this area and can/have provided a fair review of our approaches.

We agree with the reviewer that bioinformatic tools serve as a screening method. These methods need experimental validation. Indeed, this is precisely what we show in our manuscript. We show the power of bioinformatics to yield new insight which we confirm using "definitive experiments" and "independent validation."

Reviewer #2:

1. Please, justify some of your statements with references or rationale from your side. One example is in line 169-171: "Although the mechanism of myogenic cell fate change is clearly multifactorial, a likely driver of rapid and dynamic cell fate changes is post-transcriptional control of RNA.". Why? Where are you basing this hypothesis on?

We thank the reviewer for this feedback and have supported this statement with literature underscoring the role of splicing defects present in skeletal muscle disease and extensive splicing transitions during skeletal muscle development (Apponi et al., 2011; Hinkle et al., 2019; Weskamp et al., 2021).

2. Same here (lines 177-178): "While RBP expression increases during muscle regeneration…". All RBPs are upregulated during muscle regeneration?? If so, please, provide the evidence.

We thank the reviewer for this feedback and have clarified our statement.

3. Figure 4 A-B: please support the microscopy evidence with a more quantitative method for protein expression such as Western blotting. Measuring intensity in microscopy images from immunofluorescence experiments is not an accurate way to quantify levels of protein expression especially when comparing different images. Please, also state which cells are you using in the text and the figure legend. Are those C2C12 cells? I guess so since those cells are used in other panels of Figure 4. But, please, clarify this.

We thank the reviewer for this feedback and would like to clarify our use of immunofluorescence microscopy for quantitative comparison. All immunofluorescence images taken for quantification were cultured, stained, and imaged in parallel, under identical conditions. Each condition was paired with a control stained with only secondary antibody. Therefore, we feel that our immunofluorescence images are suitable for quantitative comparison. We have clarified this methodology in the methods section. We have also revised all figure legend to identify any images and data referring to C2C12 cells.

4. How are you discriminating the direct effect of Hnrnpa2b1 on splicing and expression from the fact that myoblasts are not differentiating into myotubes? This is my main concern since we know that there are extensive transcriptional and post-transcriptional changes during in vivo myogenesis and in vitro C2C12 myoblast differentiation into myotubes. I personally think that many of the changes that you are detecting might due to the absence of differentiation.

The reviewer is inquiring about the splicing changes in Hnrnpa2b1 knockout cells. The observed splicing changes may be due to Hnrnpa2b1 regulating splicing. Or the splicing changes may be due to sequencing two different cell populations. We agree with the reviewer that this is an important stipulation of our data. We have changed the language in our manuscript to reflect this possibility. In addition, we have performed analyses detailed below which show Hnrpa2b1 is a direct RNA splicing regulator.

To control for population-wide differences, we revisited our CIBERSORT analysis. This analysis defines the single cell cluster abundances in both the knockout and wild type cell populations. Cluster 2, cluster 3, cluster 4, cluster 5, and cluster 7 comprise both the knockout and wild type cell populations (See Figure 5E). We next performed differential gene expression analysis for each of these clusters. Differentially expressed genes are enriched in the cells in these particular clusters. This provides a molecular footprint for the cells at these particular stages. We examined the splicing changes for these differentially expressed genes. We find that Hnrnpa2b1 loss leads to splicing alterations in each of these clusters with cluster 5 showing the most splicing changes. This analysis allows us to control for population-wide cell state differences. The results support our contention that Hnrnpa2b1 is a key splicing regulator in particular cell states.

We would further note this analysis shows the power of our bioinformatic approach in defining cell state phenotypes. We expect this approach to be of broad interest to the developmental biology field provided the historic challenge with studying differentiation phenotypes.

Author response image 1. Impact of Hnrnpa2b1 KO on mRNA splicing of myogenic cluster-specific differentially expressed mRNA transcripts.

Author response image 1.

(A) and (B) Differential gene expression analysis was performed on individual single cell myogenic clusters to identify significantly differentially expressed transcripts. The presence of splicing alterations identified in Hnrnpa2b1 KO cells were assessed in the significantly differentially expressed transcripts. Presented is the percentage of splicing alteration in significantly differentially expressed transcripts identified per myogenic cluster.

Reviewer #3:

The presentation is generally clear but several issues should be addressed.

1. Figures 2A, B and 3. Given the RBP hierarchical clustering and scRNA expression analysis of myogenic clusters, which revealed similar patterns for Hnrnpa1 and Hnrnpa2b1 (except for Subcluster 3), additional justification should be included for the subsequent exclusive focus on Hnrnpa2b1. For example, in Figure 3, do expression characteristics following injury differ between these two RBPs?

We have provided additional justification for our focus on Hnrnpa2b1.

2. Figure 4F. Additional information on the differentiation defect in Hnrnpa1b1 KO myoblasts would be helpful – do the KO myoblasts show any morphological changes after differentiation induction?

We conducted additional analyses examining for morphological changes. We analyzed the area and circularity of Hnrnpa2b1 wild type and KO myoblasts during differentiation (Supplementary Figure 4E and F). Here, we find minor differences in nuclear area and circularity between differentiating Hnrnpa2b1 WT and KO myoblasts. We have commented on these changes in the Results section.

4. Figure 5B. The exon/intron patterns for Mbnl1, Mbnl2 and Rbfox2 appear to differ significantly from the UCSC browser view (in contrast, Hnrnpa2b1 in Figure S6F/G is correct) so confirm genomic coordinates. In addition, discuss the exons that are up/down in the Hnrnpa2b1 KO and how these alternative splicing patterns might affect the activity or localization of the encoded RBP isoforms.

We thank the reviewer for their astute comments. Here, the reviewer makes two points which we separate out below.

In the first point, the reviewer comments that gene plots for Mbnl1, Mbnl2, and Rbfox2 are different than the UCSC web browser. We appreciate the reviewer bringing this to our attention. The splicing sashimi plots presented in Figure 5B are based on the GENCODE data from GRCm38/mm10. We have validated the splicing coordinates for each of these genes in the UCSC web browser and find that they accurately map to GRCm38/mm10. We have updated the Figure legend to reflect this.

In the second comment, the reviewer asks for a discussion of the exons that are “up/down in the Hnrpa2b1 KO and how these alternative splicing may affect” these transcripts. We have included a discussion of these findings specifically for the impact of splicing alterations on Mbnl1, Mbnl2, and Rbfox2.

5. Figure 6A. The majority of Hnrnpa2b1 eCLIP tags are in the 3'UTR (myoblasts, ~47%; myotubes ~65%) so does this suggest that the predominant problem in Hnrnpa2b1 KOs is RNA localization, translation and/or turnover. On p16 (last sentence), note that in myoblasts distal intron binding sites predominate over proximal.

The issue raised by the reviewer is whether Hnrnpa2b1 knockout impacts 3’UTR site selection. We performed additional analyses examining 3'UTR site selection in Hnrnpa2b1 knockout cells. In this analysis, we quantified 3'UTR site section using QAPA (Ha et al., 2018). QAPA provides a calculation for relative usage of alternative 3′ UTR isoforms based on transcript abundance. Our results show Hnrnpa2b1 loss has minimal impact on 3’UTR site selection (see Author response image 2). Thus, while Hnrnpa2b1 binds to the 3’-end of target RNAs, our results show Hnrnpa2b1 has little impact on 3’UTR location. As the reviewer rightfully points out, Hnrnpa2b1 3’-interactions may be related to Hnrnpa2b1 influencing RNA localization or decay. We have edited the text accordingly.

Author response image 2. Hnrnpa2b1 KO has minimal effect on alternative polyadenylation site selection.

Author response image 2.

(A) Analysis of alternative polyadenylation (APA) from Hnrnpa2b1 wild type and KO RNA-seq data using QAPA (Quantification of Alternative Polyadenylation, HA et al., 2018) reveals loss of Hnrnpa2b1 results in no charge in the 3’UTR site selection for the majority of mRNA transcripts.

[Editors’ note: what follows is the authors’ response to the second round of review.]

The reviewers have discussed their reviews with one another, and the Reviewing Editor has drafted this to help you prepare a revised submission.

Essential revisions

1. There are extensive changes in splicing during normal myogenesis and C2C12 myoblast differentiation into myotubes. The Hnrnpa2b1 C2C12 knockout clones fail to differentiate, so many of the splicing effects may simply reflect failed differentiation and not direct regulation by Hnrnpa2b1. This question was brought up in reviews of the earlier study and is still a concern that is not resolved by the new analyses and bioinformatics. Transcriptional and posttranscriptional changes observed in the Hnrnpa2b1 KO cells should be compared to those known to occur during normal C2C12 cell differentiation (data available in Singh et al., Molecular Cell 2014 PMID: 25087874 and possibly elsewhere). This analysis will allow the authors to discuss how the Hnrnpa2b1 splicing program might differ from a presumably larger program occurring with differentiation.

The issue is whether the gene expression and splicing changes are due to impaired differentiation or due to Hnrnpa2b1 loss. The reviewer asks for gene expression and splicing analysis of proliferating and differentiating C2C12s. This analysis will identify expression and splicing changes associated with differentiation. These expression changes are then compared to the gene and splicing changes seen in Hnrna2bp1 knockout. Hnrnpa2b1-specific splicing changes denote an Hnrnpa2b1 regulatory program distinct from normal differentiation-induced changes.

We completed the requested analysis (See Figure 1). Data presented herein can be incorporated as supplemental data upon request.

RNA sequencing datasets with comparable sequencing depth, quality, and differentiation growth conditions were selected and compared to Hnrnpa2b1 wild type and knockout cell lines (Liu et al., 2020). While gene expression changes may arise due to different growth or sequencing conditions, the differentiating datasets correlate between detected RNA transcripts and gene expression changes (Figure 1A-B). Thus, the datasets can be meaningfully compared.

We next performed differential gene expression and differential splicing analysis (Figure 1C-D). We compared each dataset to a 0hr proliferating myoblast population. These results identify transcripts which are differentially expressed or spliced because of differentiation. Most differentially expressed and spliced transcripts overlap. These shared transcripts likely represent the larger differentiation-induced gene expression program. A subset of unique splicing and expression changes are present in each condition. These unique changes may arise due to differences in growth conditions and heterogeneity of timing for differentiation. In Hnrnpa2b1 knockout (KO) cells a much larger number of unique differentially expressed and alternatively spliced transcripts is present. Thus, the Hnrnpa2b1-KO-specifc transcripts denote a gene expression and splicing program distinct from normal differentiation.

Consistent with our prior observations, a subset of Hnrnpa2b1-KO-specifc alternatively spliced transcripts are differentially expressed (Figure 1E). Hnrnpa2b1-KO-specifc alternatively spliced transcripts are also overrepresented in select myogenic clusters (Figure 1F). These results are consistent with our original results positing an Hnrnpa2b1-cell state specific function during muscle differentiation.

Finally, we note while CIBERSORTx deconvolution show variations in differentiation dynamics between the wild type and Hnrnpa2b1-KO, the differences are small with respect to the total population (Manuscript Figure 5D). Thus, most gene expression changes likely reflect an Hnrnpa2b1-centric regulatory program.

2. The majority of Hnrnpa2b1 eCLIP tags are in the 3'UTR (myoblasts, ~47%; myotubes ~65%). However, the final model is that Hnrnpa2b1 regulates cell fate decisions via modulation of RNA splicing of both direct targets and alterations in other splicing regulators. It seems likely that other Hnrnpa2b1-mediated events will be equally if not more important. Processes potentially affected by 3' UTR binding include mRNA translation, localization and decay, all of which likely contribute to a differentiation program.

We agree with the reviewer. While we chose to focus on the impact of Hnrnpa2b1 on RNA splicing, Hnrnpa2b1 likely has diverse roles in RNA regulation. This is a point acknowledged in the manuscript.

The main issue raised regards the function of Hnrnpa2b1 binding to target RNA 3’UTR’s. These functions include RNA stabilization, splicing, poly-adenylation site selection, and miRNA interaction. To decouple these from each other, we performed analyses examining the effects on Hnrnpa2b1 3’UTR-bound RNAs (See Author response images 3 and 4).

Altogether, our results identify RNA splicing regulation as a major function of Hnrnpa2b1 during myogenesis. As we cannot exclude the influence of Hnrnpa2b1 3’UTR interaction on RNA localization or translation, we have discussed these possibilities in the manuscript.

The authors should assess whether transcripts bound by Hnrnpa2b1 in their 3' UTR show changes in overall expression rather than splicing in response to Hnrnpa2b1 depletion.

We completed the requested analysis (Author response image 3A-B). The majority (81%) of Hnrnpa2b1-bound 3’UTRs show no change in expression in Hnrnpa2b1-knockout cells.

Author response image 3. Hnrnpa2b1-KO shows limited impact on gene expression or poly-A site selection for 3’UTR-Hnrnpa2b1 bound transcripts.

Author response image 3.

(A) MA plot of Hnrnpa2b1-3’UTR bound RNA expression in Hnrnpa2b1-KO cells (B) Distribution of significantly differentially expressed transcripts in Hnrnpa2b1-KO cells. (C) QAPA analysis of Hnrnpa2b1-KO showing impact on 3’UTR and poly-A site selection.

We also examined the role of Hnrnpa2b1-KO on alternative 3’UTR use and poly-adenylation selection. These results show no significant difference in Hnrnpa2b1-KO on alternative 3’UTR use and poly-adenylation selection. For completeness, we also include this analysis (Author response image 3C).

Given the many examples of RNA binding proteins of this type affecting differentiation by modulating the processing of pri or pre-miRNAs to mature miRNAs, the authors should examine their existing RNAseq and iCLIP data for evidence of Hnrnpa2b1 affecting miRNA precursors. They should consider profiling the miRNAs in their cells by short RNA sequencing.

We completed the requested analysis (Author response image 4A-B). The majority (98%) of miRNA precursors show no significant change in expression Hnrnpa2b1-knockout cells.

Author response image 4. Impact of Hnrnpa2b1-KO on pre-miRNA expression and 3’UTR interaction.

Author response image 4.

(A) MA plot for pre-miRNA expressed in Hnrnap2b1-KO cells. (B) Percentage of significantly differentially expressed pre-miRNA in Hnrnap2b1-KO cells. (C) Venn diagram showing overlap between Hnrnpa2b1-3’UTR target RNAs and target genes for pre-miRNAs detected in Hnrnpa2b1-WT/KO RNA-sequencing. (D) Venn diagram showing overlap between Hnrnpa2b1-3’UTR target RNAs and differentially expressed miRNAs target genes (Zhou et al., 2020).

The reviewer is also requesting for small RNA sequencing on our Hnrnpa2b1-WT and KO cell populations. The sequencing depth of 100-200 million reads per library in our Hnrnpa2b1-WT and KO cell populations is necessary for detecting intronic reads to permit accurate splicing analysis. At this sequencing depth, even lowly expressed pre-miRNA precursors are comprehensively profiled by our sequencing.

Are these 3' UTR binding sites found adjacent to recognition elements for muscle specific microRNAs?

The reviewer is asking about the proximity of microRNAs to Hnrnpa2b1 3’UTR RNA binding sites. To address this point, we performed two additional analyses.

First, we used miwalk to map target genes for the pre-miRNA detected in our sequencing datasets (Sticht et al., 2018). Miwalk-identified miRNA target genes were then compared to all Hnrnpa2b1-3’UTR transcripts. No overlap is seen between pre-miRNA targets and Hnrnpa2b1-3’UTR targets (Author response image 4C).

Next, we performed differential gene expression analysis for small RNA sequencing performed on 0-hr and 48-hr in differentiating C2C12 cells (Zhou et al., 2020). Target gene interactions for significantly differentially expressed 48-hr miRNAs were predicted using miwalk (Sticht et al., 2018). The miRNA bound genes were then compared to Hnrnpa2b1-3’UTR target transcripts. Again, no overlap is seen in differentially expressed miRNA and Hnrnpa2b1-3’UTR transcripts (Figure 3D).

The limited change in pre-miRNA expression in Hnrnap2b1-KO cells and absence of co-target transcript binding argues Hnrnpa2b1 has a limited impact on miRNA biosynthesis and function.

3. The genomic data and bioinformatic analyses are not sufficiently described to be adequately assessed.

The reviewer makes several points and requests several additional analyses. We separate out each point and discuss below. Analysis results are presented in Figure 6—figure supplement 2 and Author response image 5.

Author response image 5. Magnitude and spatial location for significant Hnrnap2b1-KO splicing alterations.

Author response image 5.

Δ PSI and p-value for significant splicing changes detected in MBNL1/2 and Rbfox2.

A. The authors identified over 2000 target RNAs altered in Hnrnpa2b1 KO cells, were these genes or alternative splicing events? It is not clear what degree of confidence can be placed on these findings. How many replicates were profiled? What is the magnitude of the splicing changes? What criteria were used to determine if these changes resulted from direct regulation by Hnrnpa2b1 or were due to indirect effects such as failure to differentiate as described above?

The first issue raised regards the number of splicing changes detected. To clarify, a total of 12,292 splicing changes are present in Hnrnpa2b1-KO cells. Of these, 2,571 splicing changes are significant (FDR<0.05) across a total of 2,167 genes. We have edited the text to make this point clearer.

The next point is the degree of confidence and criteria used for detecting splicing changes. The algorithms used to determine splicing alterations are well-established. These algorithms are amongst the best for detecting splicing changes from short read sequencing (Li and Knowles et al., 2018). Briefly, Leafcutter splicing analysis first identifies alternative excised introns from split-reads. These introns must have at least 6 nucleotides mapping into each exon and greater than 30 detected reads across all samples. A Dirichlet-Multinomial generalized linear model is then applied. This model allows for differential intron excision between two groups. A Benjamini-Hochberg FDR is then calculated to identify significantly differentially excised introns. This analysis permits high-confidence identification of splicing changes from short read sequencing.

The reviewer inquires about the number of replicates profiled. We generated three Hnrnpa2b1 knockout and wildtype C2C12 clones. We profiled each clonal population with deep RNA sequencing (>100 million reads per library). Thus, all data represents three independent biologic replicates per condition. We have clarified this point in the methods section and thank the reviewer for bringing this point to our attention.

Next, the reviewer asks us to examine the size of detected splicing changes. We have performed the requested analysis by plotting δ-PSI versus p-value (FDR) (Figure 6—figure supplement 3A).

Finally, the reviewer queries whether the splicing changes are a result of Hnrpa2b1 knockout, or are due to changes in differentiation state. We refer the reviewer to comment #1 and Figure 5—figure supplement 2 for a thorough discussion and associated results addressing this point.

B. The authors point out altered splicing in the splicing regulators Mbnl1/2 and Rbfox2. From the data shown, it is difficult to judge the magnitude of splicing changes, and whether they are sufficient to actually have an impact on their downstream targets.

The issue raised by the reviewer is whether the observed splicing changes in Mbnl1/2 and Rbfox2 are sufficient to cause altered splicing.

Two observations suggest that splicing changes in Mbnl1/2 and Rbfox2 result in altered function. First, significant splicing changes in Mbnl1/2 and Rbfox2 center on key RNA-binding protein domains (Manuscript Figure 5B). Second, Hnrnpa2b1-KO, Mbnl1/2-KO and Rbfox2-KO show significant overlap in spliced transcripts (Manuscript Figure 5C and S5A). These results strongly implicate impaired splicing functionality in Mbnl1/2 and Rbfox2. We have also plotted δ-PSI versus p-value (FDR) for significant splicing changes in Mbnl1/2 and Rbfox2 (Author response image 5).

C. The quality of eCLIP data is unclear. The number of tags before cluster identification is not described in the main text. From the examples shown in Figure S6 F,G, the CLIP tags are widely distributed and somewhat similar to the input. This is an indication of a possible high background in the IP, which may explain the small number of significant peaks when normalized to input. It is unclear whether the binding sites identified by CLIP support splicing changes identified by RNA-seq.

The reviewer is inquiring about the quality of our eCLIP data.

The advantage of using eCLIP is the inclusion of a size matched input (SMinput) control (van Nostrand et al., 2016). The size mapped input reflects all RNA-protein complexes which migrate in the desired size range. As such, a size matched input, IG-IP control, and Hnrnpa2b1-IP are all sequenced and mapped. Hnrnpa2b1 peaks are then normalized against size matched input by calculating fold enrichment of reads in IP versus input. Significant peaks are identified if the number of reads in the IP sample was greater than in the input sample, with a Bonferroni corrected Fisher exact p-value less than 10–8. The small number of significant peaks identified is thus a reflection of the high stringency of the eCLIP approach. The use of SMinput, strict p-value cut-off, and the exclusion of peaks identified in IgG-IP control provide high confidence for Hnrnpa2b1-bound RNAs.

The reviewer also contests the eCLIP peak distribution across the Hnrnpa2b1 transcript is a sign of high background. Indeed, sequencing peaks distribute across the transcripts in Manuscript Figure S6F-G. However, dark colored boxes are also shown in this figure. The dark boxes denote significantly enriched binding sites above SMInput (p-value less than 10–8). These binding sites center on Hnrnpa2b1’s own 3’UTR, which are previously identified interaction targets for Hnrnpa2b1. We apologize for not making this point clearer and have updated the text to reflect this.

It is unclear whether the binding sites identified by CLIP support splicing changes identified by RNA-seq.

Here, the reviewer is asking how Hnrnpa2b1 eCLIP binding sites relate to splicing changes. If Hnrnpa2b1 binds to target RNAs, then Hnrnpa2b1 may regulate the splicing of target transcripts. Thus, splicing changes and binding sites should be proximally related. To test this, we performed distance and proximity mapping analyses (Author response image 4C-D).

First, we examined the location of splicing changes and eCLIP binding sites. Here, we mapped the locations of splicing clusters and eCLIP peaks using bedtools. We then determined the number of splicing or eCLIP peaks overlapping each gene. We subdivided each splicing cluster and eCLIP peak into percentiles across each gene to compare events across all target genes. The results show proximity of Hnrnpa2b1 eCLIP binding sites to splicing alterations (Figure 6—figure supplement 2B).

Second, we performed relative distance mapping for eCLIP and splicing clusters. These results show eCLIP peaks are more likely to be proximal to an alternative splicing change than by random chance (Figure 6—figure supplement 2C).

These results show Hnrnpa2b1 target RNA binding and splicing changes are proximally related. Thus, Hnrnpa2b1 interaction contributes to the splicing of target transcripts.

D. Validation of the engagement scoring is not presented. While an RBP and its target need to be coexpressed for a regulatory process to occur, it is not clear how co-expression alone will provide a measure of regulatory activity. For example, if an RBP suppresses gene expression, it might be anticorrelated with its targets.

The reviewer makes two points in this comment.

First, the reviewer asks for validation of engagement scoring.

We believe the data presented provides sufficient validation for engagement scoring. Hnrnpa2b1 engagement scoring shows a higher score in differentiating myogenic cluster 5 (Manuscript Figure 6D). A high engagement score suggests higher Hnrnpa2b1 functionality in those clusters. Thus, Hnrnpa2b1-KO would impact clusters 5. Indeed, machine learning shows Hnrnpa2b1-KO leads to increased number of cells arrested in myogenic cluster 5 (Manuscript Figure 5D). And, by immunofluorescent staining, we detect an increase in cells enriched in myogenic cluster 5 (Manuscript Figure 6E-G). Finally, we show Hnrnpa2b1-KO spliced transcripts impact myogenic cluster 5 transcripts (Manuscript Figure 5E and Figure 5—figure supplement 2F). These results provide computational and experimental validation for engagement scoring.

The second point relates to the limits of engagement scoring. The reviewer asserts a limitation is the reliance on co-expressed RBPs and transcripts. We concur. Indeed, engagement scoring relies on the principle that target RNAs and RBP are detected. In our analysis we are examining the expression of an RBP and its RNA targets across all cells within a cluster. We recognize not every cell will express a target RNA either due to limits of detection or due to transcriptional absence. We note that engagement scoring aggregates RNA target expression across all cells within a cluster. Thus, the absence of select transcripts has a limited impact on the ability to assign RBP cluster functionality. In this regard, our method is analogous to assigning transcription factor functionality in single cells (Schep et al., 2017). These methods permit the assessment of functionality in the setting of sparse data points.

[Editors’ note: further revisions were suggested prior to acceptance, as described below.]

The manuscript has been improved but there are some remaining issues that need to be addressed, as outlined below:

Regarding the correlation of the hnRNP A2B1 binding to splicing regulation, you should consider the standard approach of generating an RBP map that shows clip binding density in relation to a metagene derived from all the up and downregulated exons. There are several tools available for doing this and you should assess whether they can be applied to your data. Such a map would be useful to determine whether splicing activation and repression by hnRNP A2B1 showed similar dependence on binding site position relative the exon as seen with some other regulators, and whether hnRNP A2B1 behaves similarly to its homolog hnRNP A1. In the absence of such a map or in addition, it would also be helpful to show an example or two of a clip peak mapping to a strongly regulated exon. As the data are currently presented it is difficult to assess the Clip in relation to the splicing changes, which your response indicates you want to emphasize.

We have provided the latter as we have extensive information regarding the splice sites already included in the manuscript and we have revised the information to make this clearer to the readers. See Figure 5 Supplement 2, Figure 6 Supplement 2 and Figure 6 Supplement 3.

We find that Hnrnpa2b1 and Myl1 show the most significant splicing alterations and harbor eCLIP binding sites. We have added an additional supplement to demonstrate the requested mapping. The data are now Figure 6 Supplement 3.

We have revised the manuscript to address the requested changes and hope that the reviewers are satisfied with our responses. The revised manuscript, revised figures and supplements are included.

Associated Data

    This section collects any data citations, data availability statements, or supplementary materials included in this article.

    Data Citations

    1. Wheeler JR, Whitney O, Olwin B, Parker R. 2020. Hnrnpa21 regulates myogenic fate plasticity. NCBI Gene Expression Omnibus. GSE152467
    2. Wheeler JR, Whitney O, Olwin B, Parker R. 2021. RNA-Binding Proteins Direct Myogenic Cell Fate Decisions. NCBI BioProject. PRJNA717101 [DOI] [PMC free article] [PubMed]
    3. Nguyen ED, Wheeler JR, Vogler TO, Johnson AM. 2022. RNA-binding proteins direct myogenic cell fate decisions. NCBI Gene Expression Omnibus. GSE106553 [DOI] [PMC free article] [PubMed]
    4. Trapnell C, Williams BA, Pertea G, Mortazavi A, Kwan G, van Baren MJ, Salzberg SL, Wold BJ, Pachter L. 2010. Transcript assembly and abundance estimation from RNA-Seq reveals thousands of new transcripts and switching among isoforms. NCBI Gene Expression Omnibus. GSE20846 [DOI] [PMC free article] [PubMed]
    5. Singh RK, Xia Z, Bland CS, Kalsotra A, Ruddy M, Curk T, Ule J, Li W, Cooper TA. 2014. Rbfox2-coordinated alternative splicing of Mef2d and Rock2 controls myoblast fusion during myogenesis. NCBI Gene Expression Omnibus. GSE58928 [DOI] [PMC free article] [PubMed]
    6. Thomas JD, Bardhi O, Aslam FN, Sznajder LJ. 2017. Disrupted prenatal RNA processing and myogenesis in congenital myotonic dystrophy. NCBI Gene Expression Omnibus. GSE97806 [DOI] [PMC free article] [PubMed]

    Supplementary Materials

    Figure 3—figure supplement 1—source data 1. Related to Figure 3B.

    Raw and annotated Western blot image of Hnrnpa2b1 and Gapdh protein expression from whole uninjured (UI) and 5 days post injury mouse tibialis anterior muscle.

    Figure 4—source data 1. Related to Figure 4C.

    Raw and annotated Western blot image of Hnrnpa2b1 and Gapdh in wild type (WT) and Hnrnpa2b1 knockout (KO C2C12 myoblasts).

    Figure 6—figure supplement 1—source data 1. Related to Figure 6—figure supplement 1A-C.

    (A) Raw and annotated blot of autoradiogram of 32P-labeled Hnrnpa2b1 RNA–RNA complexes fractionated by PAGE (B) and (C) immunoprecipitation of Hnrnpa2b1 RNA complexes used for enhanced UV crosslinking and immunoprecipitation (eCLIP) in C2C12 myoblasts or myotubes (n = 2 biologically independent samples).

    Transparent reporting form
    Supplementary file 1. Primers used for RIP-qPCR.
    elife-75844-supp1.xlsx (9.8KB, xlsx)
    Supplementary file 2. Hnrnpa2b1 eCLIP mapping in Myoblasts and Myotubes.
    elife-75844-supp2.xlsx (214.7KB, xlsx)
    Supplementary file 3. Hnrnpa2b1 KO differential gene expression.
    elife-75844-supp3.xlsx (1.6MB, xlsx)
    Supplementary file 4. Hnrnpa2b1 KO cluster expression.
    elife-75844-supp4.xlsx (226.5KB, xlsx)
    Supplementary file 5.
    elife-75844-supp5.xlsx (62MB, xlsx)
    Supplementary file 6. RNA-binding proteins expressed in myogenic clusters 0 - 6.
    elife-75844-supp6.xlsx (14.4KB, xlsx)

    Data Availability Statement

    Sequencing data is publicly available (SRA accession: PRJNA717101, GEO accession: GSE152467, GSE106553).

    The following datasets were generated:

    Wheeler JR, Whitney O, Olwin B, Parker R. 2020. Hnrnpa21 regulates myogenic fate plasticity. NCBI Gene Expression Omnibus. GSE152467

    Wheeler JR, Whitney O, Olwin B, Parker R. 2021. RNA-Binding Proteins Direct Myogenic Cell Fate Decisions. NCBI BioProject. PRJNA717101

    Nguyen ED, Wheeler JR, Vogler TO, Johnson AM. 2022. RNA-binding proteins direct myogenic cell fate decisions. NCBI Gene Expression Omnibus. GSE106553

    The following previously published datasets were used:

    Trapnell C, Williams BA, Pertea G, Mortazavi A, Kwan G, van Baren MJ, Salzberg SL, Wold BJ, Pachter L. 2010. Transcript assembly and abundance estimation from RNA-Seq reveals thousands of new transcripts and switching among isoforms. NCBI Gene Expression Omnibus. GSE20846

    Singh RK, Xia Z, Bland CS, Kalsotra A, Ruddy M, Curk T, Ule J, Li W, Cooper TA. 2014. Rbfox2-coordinated alternative splicing of Mef2d and Rock2 controls myoblast fusion during myogenesis. NCBI Gene Expression Omnibus. GSE58928

    Thomas JD, Bardhi O, Aslam FN, Sznajder LJ. 2017. Disrupted prenatal RNA processing and myogenesis in congenital myotonic dystrophy. NCBI Gene Expression Omnibus. GSE97806


    Articles from eLife are provided here courtesy of eLife Sciences Publications, Ltd

    RESOURCES