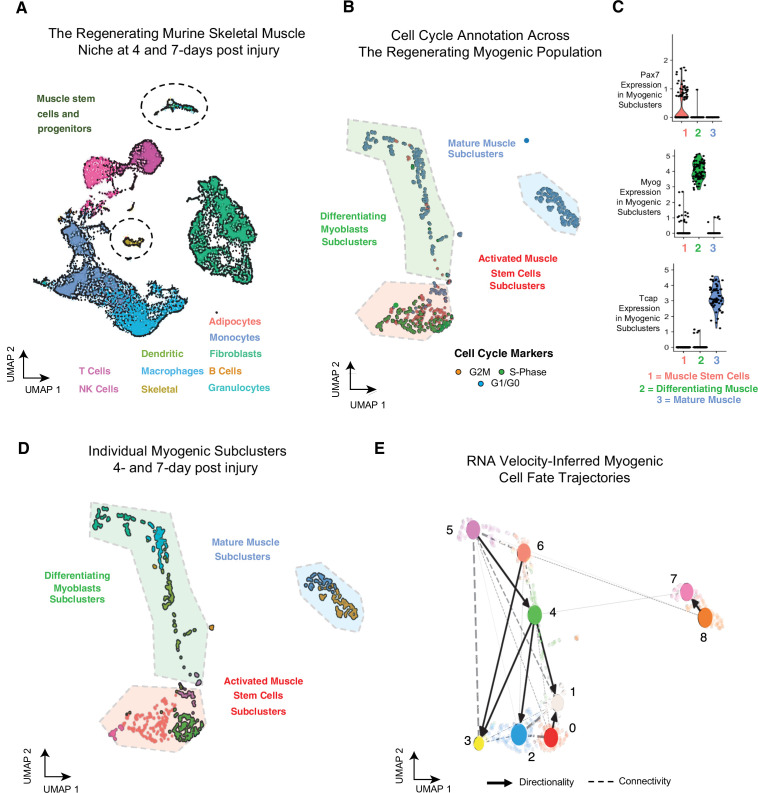
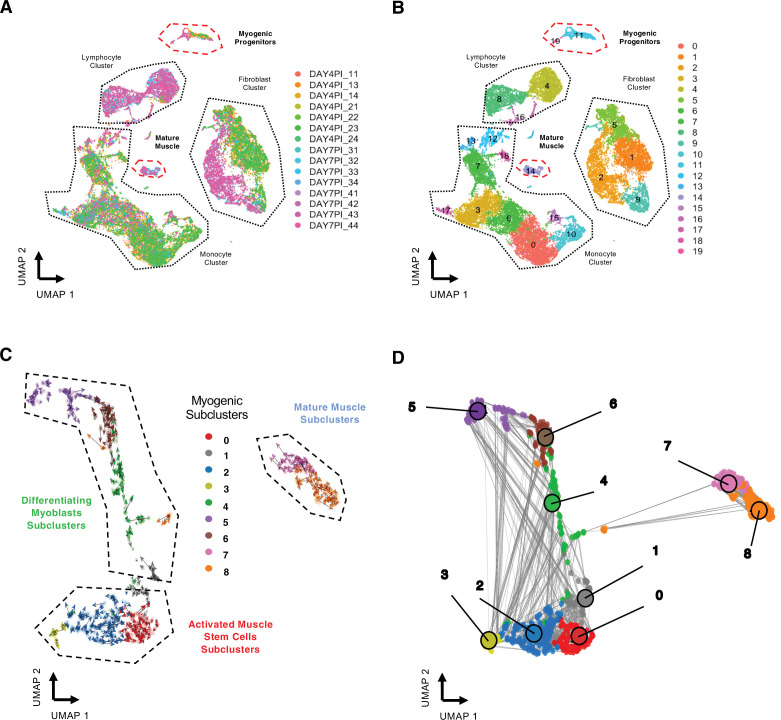
Figure 1. Single-cell analysis reveals myogenic cell fate transitions in regenerating skeletal muscle.
(A) Single-cell atlas of regenerating skeletal muscle at 4 and 7 days post injury (dpi). (B) Cell cycle scoring in regenerating myogenic subclusters. (C) Violin plots showing expression of myogenic markers of regeneration per myogenic clusters. (D) Myogenic subclusters comprising the regenerating myogenic cellular population. (E) RNA velocity-inferred myogenic cell fate trajectories. See also Figure 1—figure supplement 1.


