

Abstract
This study was undertaken as part of the NIH “Facilities of Research-Spinal Cord Injury” project to support independent replication of published studies. Here, we repeated a study reporting that a combinatorial treatment with transplants of Schwann cells, systemic delivery of Rolipram to enhance cyclic AMP levels, and intra-spinal injections of dibutyryl cyclic AMP enhanced locomotor recovery in rats after contusion injuries at the thoracic level. We compared the following experimental groups: 1) rats that received Schwann cell transplants, systemic Rolipram, and injections of db-cyclic AMP (the combined treatment group that showed the greatest improvement in function); 2) rats that received Schwann cell transplants only and implantation of empty pumps as control; 3) rats that received Rolipram only and implantation of empty pumps as control, and 4) control rats that received no treatment other than the injection of DMEM into the spinal cord and implantation of empty pumps. The principal findings reported in Pearse et al. were not replicated in that the combined treatment group did not exhibit greater recovery on any of the measures, although the group that received Schwann cells only did exhibit enhanced recovery on several of the outcome measures. The failure of the combined treatment may be due in part to less successful engraftment of Schwann cells in our study vs. Pearse et al. Issues relating to failures to replicate, especially when effect size is small, are discussed.
Keywords: Contusion injury, Locomotor recovery, Re-myelination, Axon regeneration, Sprouting, Motor system, Rats, Cyclic nucleotides
Introduction
In recent years, there have been numerous reports of interventions that either enhance sparing of function and/or promote repair mechanisms including axon regeneration so as to enhance recovery of function after spinal cord injury. Although a number of strategies show promise for enhancing recovery, a barrier to translation is that promising findings are often not re-evaluated in independent replications to assess the robustness and reproducibility of the effects. To meet this need, the NINDS launched the “Facilities of Research Excellence-Spinal Cord Injury” (FORE-SCI) replication project, in which promising published studies are independently replicated. Studies are selected for replication by an independent scientific advisory committee and executed by one of the sites funded by the FORE-SCI Project. Here, we repeat an experiment in which rats that received a combinatorial treatment of transplants of Schwann cells, systemic delivery Rolipram to enhance cyclic AMP levels, and intra-spinal injections of dibutyryl cyclic AMP exhibited enhanced locomotor recovery after contusion injuries at the thoracic level (Pearse et al., 2004).
The original study was based on the general rationale that numerous interventions seem to produce incremental improvements in regenerative growth and/or recovery of function, and so combining different interventions might produce additive or even multiplicative beneficial effects (a combinatorial approach). The specific interventions were as follows: 1) transplants of Schwann cells into the area of the lesion to promote axon regeneration; 2) treatment with Rolipram®, a phosphodiesterase (PDE) inhibitor, to increase levels of cyclic nucleotides, especially cyclic AMP in the brain and spinal cord; 3) injections of dibutyryl cyclic AMP (db-CAMP) a non hydrolyzable analog of cyclic AMP into the spinal cord near the injury site. Rats received contusion injuries and then each of the individual interventions and interventions in different combinations. Pearse et al. reported that maximal functional improvement (locomotor function) was obtained with the combined treatment with all 3 interventions. Consistent with the requirements of the FORE-SCI replication project, our goal here was to repeat as closely as possible the key experiments reported in Pearse et al. (2004).
Materials and methods
Planning the replication study was hampered by the lack of details about the exact procedures in the original publication, which is a common problem with papers published in modern high impact journals. The original authors were contacted for clarification of procedural details that were unclear. Despite our concerted effort to do things in the same way, there were some discrepancies in procedures due to misunderstanding. Instances of where our experimental procedures were different from those of the original report are noted below. All experimental protocols and procedures were approved by the Institutional Animal Care and Use Committee at the University of California, Irvine.
The original report described results from a total of 8 different groups of animals, with some analyses limited to a subset of the groups. Based on recommendations of the scientific steering committee, we focused on the 4 treatment groups that were seen as representing the key comparison groups. The groups were: 1) rats that received Schwann cell transplants, systemic Rolipram, and injections of db-cyclic AMP (the combined treatment group that showed the greatest improvement in function); 2) rats that received Schwann cell transplants only and implantation of empty pumps as control; 3) rats that received Rolipram only and implantation of empty pumps as control, and 4) control rats that received an injection of DMEM into the spinal cord (a control for Schwann cell transplant surgery) and implantation of empty pumps.
Discussions with the original authors revealed that the overall study was carried out by running different squads of animals at different times over a period of several years. Data from different squads were then combined for graphical presentation and statistical analysis. Running in squads is necessary because of the large number of treatment groups involved, but an important consequence is that different treatment groups are actually not run simultaneously. It was neither practical nor feasible within the constraints of the contract to carry out the experiment in exactly the same way as in the original study (that is, by running small squads of animals over a period of years). Thus, we ran two large squads composed of different experimental groups (called here Squad #1 and Squad #2).
The original authors felt that it was important to obtain the test strain (Fischer rats) from the same supplier that had supplied the rats for the original report because of concerns about possible genetic variability between suppliers or even between the colonies maintained by the same supplier in different locations. Accordingly, rats were purchased from Harlan (Indianapolis, IN). It should be noted that Harlan Lab warrants that rats maintained in different sites do not differ genetically.
To avoid any issues arising from small differences in the methods of preparation of Schwann cells, we obtained Schwann cells from the original authors. Thus, coordinating the replication experiment required that we obtain a sufficient number of rats of the appropriate strain (Fischer), age and sex from a particular supplier (Harlan) and a sufficient number of Schwann cells from Dr. Bunge’s lab at the appropriate time for transplantation after SCI. The Schwann cells were then amplified in culture at University of California at Irvine prior to transplantation.
Squad 1
The first squad of rats was run beginning in December 2008. Animals were handled for 2 weeks (a critical step because Fischer rats are emotionally reactive, which complicates functional testing). Thirty two rats then received moderate contusion injuries and implantations of osmotic minipumps on December 15.
Surgical procedures
Rats were anesthetized with ketamine/xylazine (50 mg/kg, 10 mg/kg). When supplemental anesthesia was required, one fourth of the original dose was given. It should be noted that Pearse et al. used 1–2% halothane in a mixture of 70% nitrous oxide and 30% oxygen for anesthesia. Our standard IACUC protocol for spinal cord injury surgery at the time the experiments were done was the ketamine/xylazine mixture, and we felt that this modification in experimental protocol would be inconsequential for the primary outcome measures. Body temperature was maintained by placing rats on a water-circulating jacketed heating pad at 37±0.5 °C. The skin over the upper thoracic area was shaved and cleaned with a Betadyne solution. The skin was incised, and then the connective and muscle tissue were bluntly dissected to expose the vertebrae. A laminectomy was performed involving T8 and half of T9 taking care not to damage the spinal cord during the dorsal lamina removal. Rats were then transferred to the stage of the NYU impactor and received moderate contusion injuries (10 g from 12.5 mm, 2 mm rod diameter) on the exposed dura mater of the spinal cord.
After completion of the contusion injuries, muscles were sutured with 5–0 chromic gut, and the skin was closed with surgical staples. Two rats died during or shortly after surgery due to anesthetic complications. Of the remaining 30 rats, 20 were implanted with two osmotic minipumps that contained Rolipram (Alzet model 2001, Cupertino, CA; delivery rate = 0.5 mg/kg/day); 10 were implanted with two minipumps that were empty (control). The pumps were implanted for 1 week and then exchanged a week later for two more model 2001 osmotic mini-pumps for a total of 14 days of administration.
Three rats were euthanized on the day after surgery because they or their cage mates extracted their implanted osmotic minipumps causing major mutilation to their back skin. The surviving rats (n = 27) included 18 in which the osmotic minipumps contained Rolipram and 9 in which the osmotic minipumps were empty.
Post operative care
Following surgery, rats were immediately placed on a water-circulating jacketed heating pad. After recovering from the anesthetic, rats were housed 4–5 per cage. This is highly preferred by our animal care and use committee in order to promote social interactions and animal welfare. It should be noted, however, that rats in Pearse et al. were housed singly (more on this below). For 10–14 days after surgery, rats received daily injections of lactated ringers (5 mg/100 g, sub-cutaneously) for hydration, the analgesic Buprenex (Buprenorphine, 0.01 mg/kg), and Baytril (Enroflaxacin 2.5 mg/kg, sub-cutaneously) for prophylactic treatment against urinary tract infections (UTIs).
Rats were monitored twice daily for general health, coat quality (indicative of normal grooming activity) and mobility within the cage. Rats with moderate contusion injuries typically resume these activities the day following injury. In addition, signs of paralysis were monitored, including lack of hind limb movement, tail flaccidity, and instability/uncoordinated movement. Rats were also monitored for signs of skin lesions on the paralyzed limbs or autophagia of the toes. None of the rats exhibited skin lesions or autophagia throughout the experiment. Bladders were manually expressed twice daily for the entire length of the study. Rats were monitored for urinary tract infections (UTIs) for the entire duration of the experiment and no UTIs were observed.
Our animal care protocol calls for the following: if an animal failed to resume normal activities, showed evidence of skin lesions or autophagia, or had symptoms of UTI, the veterinarian was consulted and, if distress continued, the animal was euthanized. None of the rats were euthanized for these reasons. Other situations that led to euthanasia are noted elsewhere.
Behavioral assessment between the time of the spinal cord injury and the transplant surgery
Hindlimb locomotor function was assessed with the Basso, Beattie, and Bresnahan Locomotor Rating Scale (BBB) (Basso et al., 1996) at 2, 4, and 6 days post-injury. The BBB is a 21-point scale designed to assess hind limb locomotor deficits and recovery after injury to the thoracic spinal cord. This scale provides a measure of hindlimb function ranging from complete paralysis to normal locomotion by assessing hind limb joint movements, stepping, trunk position and stability, forelimb–hindlimb coordination, paw placement, toe clearance, and tail position. Bladders were manually evacuated 5–10 min prior to being placed in the open field (150 × 100 cm) for the prescribed 4 minute time period. Rating of hindlimb movement and locomotion was scored simultaneously by two observers who were blind to the treatment groups. Subscore analyses were carried out as in Pearse et al. (2004). Rats whose BBB scores were below a level that allowed subscore analysis received a subscore of “0” for the statistical analyses.
Seven rats (3 that received Rolipram and 4 that received empty minipumps) exhibited high locomotor scores that were well out of the range of what is expected following moderate contusion injuries (BBB scores in these rats ranged from 11 to 20 on day 2 post-lesion). These rats were excluded from the analyses of the main experiment. Pearse et al. also report excluding animals that did not exhibit flaccid paralysis after the injury, but do not give the number of animals excluded on this basis. The 7 rats with high BBB scores received Schwann cell transplants on day 7 post-injury, and were killed 7 days later in order to assess transplant survival. This left the control group with empty minipumps with n = 5.
One rat from the Rolipram group was euthanized 7 days post-injury because the bladder ruptured during manual expression.
Transplant surgeries and injections of dibutyryl cyclic AMP
Rats received Schwann cell transplants, control injections of DMEM and injections of db-cAMP at 7 days post-injury. The 13 rats with Rolipram-filled minipumps were divided into two groups based on BBB scores. The db-cAMP and the Rolipram were made up fresh prior to each surgery. To the extent possible, we tried to match groups by sorting pairs of rats with similar scores into the two groups and by formulating groups with similar overall mean scores. One group (n = 6) received Schwann cell transplants and injections of db-cAMP (this is the main combined treatment group that exhibited enhanced recovery in the Pearse et al. study); the other group (n = 7) received DMEM injections. The 4 remaining rats with empty minipumps received DMEM injections. One rat with an empty osmotic minipump died during the transplantation surgery due to anesthetic complications. Thus, after attrition due to all causes, group sizes for the first squad were as follows:
Rolipram minipumps + Schwann cell transplants + db-cAMP injections: n = 6
Rolipram minipumps + DMEM n = 7
Empty minipumps + DMEM n = 4.
Adherent cultures of Schwann cells in T75 flasks were shipped from Dr. M. Bunge’s lab at the University of Miami to the Dr. Steward’s lab at University of California, Irvine, 4 days prior to transplantation. At the University of Miami, the nerves from adult rats were harvested on January 24, 2008, nerves were cut into 3 mm explants and kept for 4 weeks in D10 medium. Then, explants were enzymatically dissociated, plated on PLL dishes with D10–3M and grown to confluence. Cells were purified by treatment with Thy1.1 antibody and were frozen at passage 1 on March 4, 2008.
Upon arrival, cell medium was changed with D10/3M supplied by Dr. Bunge’s lab (DMEM, 10% FBS, 1% Pen/Strep with 0.8 ug/ml forskolin, 0.02 mg/ml pituitary extract 2.5 nM heregulin) and cells were placed in a humidified incubator with 5% CO2. The culture media was changed after 2 days and cells were ready for transplant after 4 days. On the day of transplant confluent cells were harvested from flasks by rinsing two times with HBSS and then incubating with 3 ml trypsin–EDTA. Cell suspensions were placed in a tube containing 1 ml D10/GM (DMEM, 10% FBS, 0.01% Gentamycin) to inactivate the trypsin. Flasks were further rinsed with 3 ml D10/M to retrieve cells. Cell suspensions were centrifuged at 1500 rpm (405 × g) for 10 min at room temperature and cell pellets resuspended in 2 ml D10/M with trituration using a small bore pipette. Cell counts were obtained by trypan blue staining. An additional 3 ml D10/M media were added to the cell suspension and cells again centrifuged at 1500 rpm for 5 min at room temperature. Cell pellets were resuspended in an appropriate volume of DMEM-F12 to generate 2 × 10⁶ cells per 6 μl (3 × 10⁸ cells/ml). Cell viability was assessed by trypan blue staining at 4 h post-harvest and 97% of the cells were found to be viable at this time.
One week post contusion injury, rats were injected with 2 × 10⁶ Schwann cells in 6 μl at the center of the lesion at a depth of 1 mm over a 3 minute time period. The needle was left in place for 3 min and then was withdrawn 50% of the way. After 30 s the needle was withdrawn the rest of the way. After the Schwann cells were transplanted, 0.25 μl of 50 mM db-cAMP was injected at a total of 4 sites: 2 sites at 4 mm rostral to the center of the lesion; 2 sites at 4 mm caudal; each site was 0.5 mm lateral to the midline at a depth of 0.5 mm.
Injections of retrograde tracers
To assess the projections from brainstem regions to sites caudal to the injury, Pearse et al. used retrograde tracing techniques in which Fast Blue was injected into the spinal cord caudal to the injury. For Squad 1, we used Fast Blue obtained from Sigma. At 9 weeks post-injury, rats were anesthetized as above, a laminectomy was performed at T10–T11, and Fast Blue was injected 7 mm caudal to the original injury site at a total of 4 sites: 0.6 mm lateral to the dorsal sulcus bilaterally at a depth of 1 mm and 2 mm. Injections were made using a 10 μl syringe with a glass pulled pipette (tip diameter approximately 50 μm). Each injection was 0.15 μl of 2% aqueous Fast Blue. Each injection was made over 3 min with an additional 3-minute waiting period after the injection to prevent leakage of the tracer.
Unfortunately, there was no detectable retrograde labeling in the brainstem with Fast Blue for the rats in Squad 1. Investigations of the reasons for the failure revealed that there might have been a problem with the Fast Blue we used. Dr. Pearse indicated in early conversations that they had obtained their Fast Blue from Sigma, and so we obtained ours from there too. Further investigation revealed however that the product that Pearse had used had been discontinued by Sigma, and that the Fast Blue that we obtained from Sigma came from an overseas supplier. This may explain the failure to obtain satisfactory retrograde labeling. In order to minimize the chances for retrograde labeling failure for Squad 2, we used fluorogold, which is reliable in our hands.
Fluorogold™ (Fluorochrome, LLC, Denver) injections were made at T10–T11 essentially as described above for Fast Blue at 11 weeks post injury. The 11 week time point was chosen because the post-injection survival time for fluorogold is 2 days, whereas it is 2 weeks for Fast Blue. In this way, rats were killed at the same post-injury time point as in Pearse et al. (11 weeks post-injury). Injections were made as above using a 10 μl syringe with a glass pulled pipette. One injection was made at the midline (dorsal sulcus), and two other injections where made 0.5 mm from midline bilaterally, For each injection the pipette was lowered to depth of 0.5 mm, then a 2-minute waiting period took place prior to injecting the fluorogold for a total of 5 min each injection. After each injection, there was an additional 2-minute waiting period to prevent leakage of the fluorogold. No behavioral testing was conducted after injections of fluorogold.
Functional testing post-transplantation
Post-transplantation, animals were assessed using a number of functional outcome measures including the BBB locomotor scale, a grid walk task, a ladder beam, footprint analysis using paint on the feet, kinematic analysis, and sensory testing using von Frey hairs. Animals were handled for 3 weeks prior to injury and trained on each task as described below. Assessments were carried out on different post-injury days to avoid fatiguing the animals.
BBB analysis was carried out on post-injury days 16, 23, 29, 38, 43, 49, 60, 64, and 70 as described above.
Grid walk analysis was carried out on post-injury days 23, 25, 32, 36, 42, 50, 58, and 64. Animals were trained on the irregular grid walk at least five times prior to baseline testing. Rats crossed a 1.3 m long horizontal grid (3 mm spacing) with at least ten randomly assigned gaps ranging from 1 to 5 cm that changed from session to session. Each testing session involved three trials. The number of slips and falls for each leg were counted, and the total of number of errors including both slips and falls were calculated. This test is a skilled walking task with a focus on forelimb–hindlimb coordination (that is, the rats’ ability to place the hindlimb on a grid bar that had previously been contacted by the forelimb).
Footprint analysis was carried out prior to injury and on post-injury days 21, 31, 39, 45, 59, and 66. Rats’ front paws were painted with blue paint and the hind paws were painted in a red color, and the rats were allowed to cross a 1.2 M plexi-glass runway lined with paper. Each testing session involved three trials. Hind foot exorotation, base of support, and stride length were measured.
Ladder beam testing was carried out on post-injury day 65. Animals were pre-trained on the ladder beam task twice prior to testing. Rats crossed a 1.2 M ladder beam with evenly spaced 0.635 cm metal diameter rods for a total of three trials. The task was videotaped from beneath with a Canon ELURA 100A and then analyzed offline for the total number of footfalls. This test is skilled walking task that assesses the rats’ ability to place the hindlimb on a bar previously contacted by the forelimb.
Video kinematic analysis was carried out on post-injury day 67. Animals were trained on the kinematic task prior to testing. Rats crossed a 1.2 M plexi-glass runway with a 1 cm × 1 cm grid on the floor of the runway. Foot placement was recorded with a Canon ELURA 100A camera placed beneath the runway. Videos from 3 trials per rat were assessed off-line to measure hind foot exorotation, base of support, and stride length.
Squad 2
The second squad of 66 rats received contusion injuries on Feb 10, 2009 and transplantation or control surgery 7 or 8 days later on Feb 17th or 18th, 2009. Surgical and transplant procedures were identical to those for Squad #1. Five rats died at the time of the spinal cord injury surgery due to surgical or anesthetic complications. Two rats died the following day due to post-surgical complications and one other rat was euthanized due to mutilation at the minipump implantation site. Of the surviving rats (n = 58) 31 had received osmotic minipumps that were empty (controls) and 27 had minipumps that contained Rolipram.
Locomotor testing by BBB was carried out 2, 4, and 6 days post-injury. Thirteen animals (six that received Rolipram and seven that had empty minipumps) were eliminated from the study because they exhibited high locomotor scores that were outside of the range of what is expected following contusion injuries (BBB scores in these rats ranged from 18 to 20 at two days post-lesion). This exclusion left 25 rats in the control group with empty minipumps and 20 in the group with Rolipram-filled minipumps.
The rats with Rolipram-filled minipumps were divided into two groups that were matched based on BBB scores. One group (n = 12) received Schwann cell transplants and injections of db-cAMP (this is the main combined treatment group that exhibited enhanced recovery in the Pearse et al. study); the other group (n = 6) received DMEM injections. Similarly, rats with empty minipumps were divided into two groups; one group (n = 7) received Schwann cell transplants and the other group (n = 14) received DMEM injections.
Schwann cell transplants and control injections were carried out at either 7 or 8 days post-injury using a batch of Schwann cells that were received on February 12, 2009. Six rats that had surgery on Feb 17th, 2009 (7 days post-injury) died due to surgical or anesthetic complications. Additionally, two rats that received surgery on this day died the following day due to post-surgical complications. Three rats that received surgery on Feb 18th, 2009 (8 days post-injury) died due to surgical or anesthetic complications, and two others died the following day due to post-surgical complications. Thus, after attrition due to all causes, group sizes for the second squad were as follows:
Rolipram minipumps + Schwann cell transplants + db-cAMP injections: n = 7
Rolipram minipumps + DMEM injections: n = 6
Empty minipumps + DMEM injections: n = 12
Empty minipumps + Schwann cells n = 7.
Post-transplantation, BBB analysis was carried out on post-injury days 14, 16, 23, 29, 31, 38, 43, 49, 59, 64, and 69. Grid walk analysis was carried out on post-injury days 23, 32, 36, 42, and 50. Footprint analysis was carried out on post-injury days 21, 24, 38, 44, 59, and 66. Ladder beam analysis was carried out on post-injury day 62. Video kinematic analysis was carried out on post-injury day 69.
Histological analyses
Histological analyses included: 1) assessment of lesion size; 2) assessment of the number of myelinated axons at the lesion epicenter and the nature of the myelin (Schwann cell vs. oligodendrocyte derived); 3) assessment of the distribution of Schwann cells by immunohistochemistry for P-75; and 4) Assessment of the number of retrogradely labeled neurons in the reticular formation and raphe nuclei.
Pearse et al. also assessed the density of 5HT axons below the injury using immunohistochemistry, and we had intended to do this as well. Due to a misunderstanding of their procedure, however, we collected the tissue in a different way than in Pearse et al., precluding the analysis that they performed. Specifically, Pearse et al. carried out the analysis of 5HT labeled axons in a separate group of animals in which the entire block containing the lesion and adjacent regions was sectioned. Then 5HT axon density was assessed in specific regions in each section based on the appearance of the lesion in that section. We had intended to carry out the analysis of 5HT axon density in the same animals in which myelinated axons were assessed, and so we prepared the tissue differently as described below. Unfortunately, this decision made it impossible to carry out the analysis that Pearse et al. performed. Given the inability to carry out the same analyses, we did not analyze 5HT staining.
At the end of the testing period, rats were killed with an overdose of Euthasol® (100 mg/kg) and perfused with 4% paraformaldehyde. The osmotic pumps were checked for patency and the spinal cord was inspected for damage at the sites of injections. The spinal cord was dissected out and a 6 mm block of the spinal cord containing the lesion was divided into three 2 mm blocks with the center block of 2 mm at the epicenter of the lesion. The 2 mm block at the epicenter of the lesion was embedded in plastic, and 1 μm sections were taken and stained with toluidine blue. The 2 mm blocks immediately rostral and caudal to the center of the lesion were frozen in TissueTek® (VWR) and sectioned on a cryostat in the sagittal plane at 20 μm. Sections were mounted on microscope slides and kept at room temperature until used for immunohistochemistry.
Quantitative assessment of myelinated axons and the nature of myelination (Schwann cell vs. oligodendrocyte-derived)
Schwann cell myelinated axons and oligodendrocyte myelinated axons in the lesion area and intact white matter were counted separately using StereoInvestigator (Microbrightfield) software by systematic random sampling. Schwann cell myelinated vs. oligodendrocyte myelinated axons were counted at 63× in 300 sampling boxes (15 × 10 μm) in a sampling grid set by StereoInvestigator over the different sample areas. Myelinated axons were scored as to type (Schwann cell vs. oligodendrocyte-derived) and StereoInvestigator software calculated the total numbers of Schwann cell and oligodendrocyte myelinated axons in the defined areas.
Assessment of the distribution of Schwann cells by immunohistochemistry for P-75
Alternate sections through the block containing the lesion were immuno-stained for P-75. In most cases, Schwann cells extended nearly to or beyond the 2 mm blocks, so further 8 mm blocks were taken rostral and caudal to these, and stained in the same way for P-75.
Assessment of retrogradely labeled neurons in the reticular formation and raphe nuclei
Brains were sectioned at 20 μm using a cryostat, and one section each 200 μm was collected. All sections from Bregma-9 mm (as per Paxinos) to approximately Bregma-14.6 were imaged at 4× and 10× and photo-montages were assembled to count the number of fluorogold positive cells in the raphe nucleus and reticular formation. To be consistent with the Methods of Pearse et al., these were profile counts that were not collected using a stereological technique.
Although Pearse et al. state that some animals received BDA injections into the cortex to label the corticospinal tract (CST), we did not carry out these experiments because the data on CST labeling were not shown in the original paper, and Pearse et al. report that there were no differences in CST distribution between treatment groups.
Results
BBB analyses of hindlimb locomotor function
The general pattern of locomotor deficit and recovery was similar to what was reported by Pearse et al. for the control groups (Fig. 1A). The group that received the combined treatment and the group that received Rolipram but no Schwann cells had higher BBB scores than the control group at all post-injury intervals but differences were not statistically significant by repeated measures ANOVA. The final BBB score was around 10 for the control group, and around 12 for the combined treatment group and the group that received DMEM and Rolipram. Repeated measures ANOVA revealed no significant differences between treatment groups (F = 0.93, p = 0.42) a significant difference across days post-lesion (F = 44.09, p < 0.0001). BBB subscores were virtually identical across treatment groups (Fig. 1B; repeated measures ANOVA, F = 0.01, p = 0.99) and a significant difference across days post lesion (F = 9.73, p < 0.0001) with a repeated measures ANOVA. By the end of the testing period, all groups had somewhat higher BBB subscores than the control groups of Pearse et al.
Fig. 1.
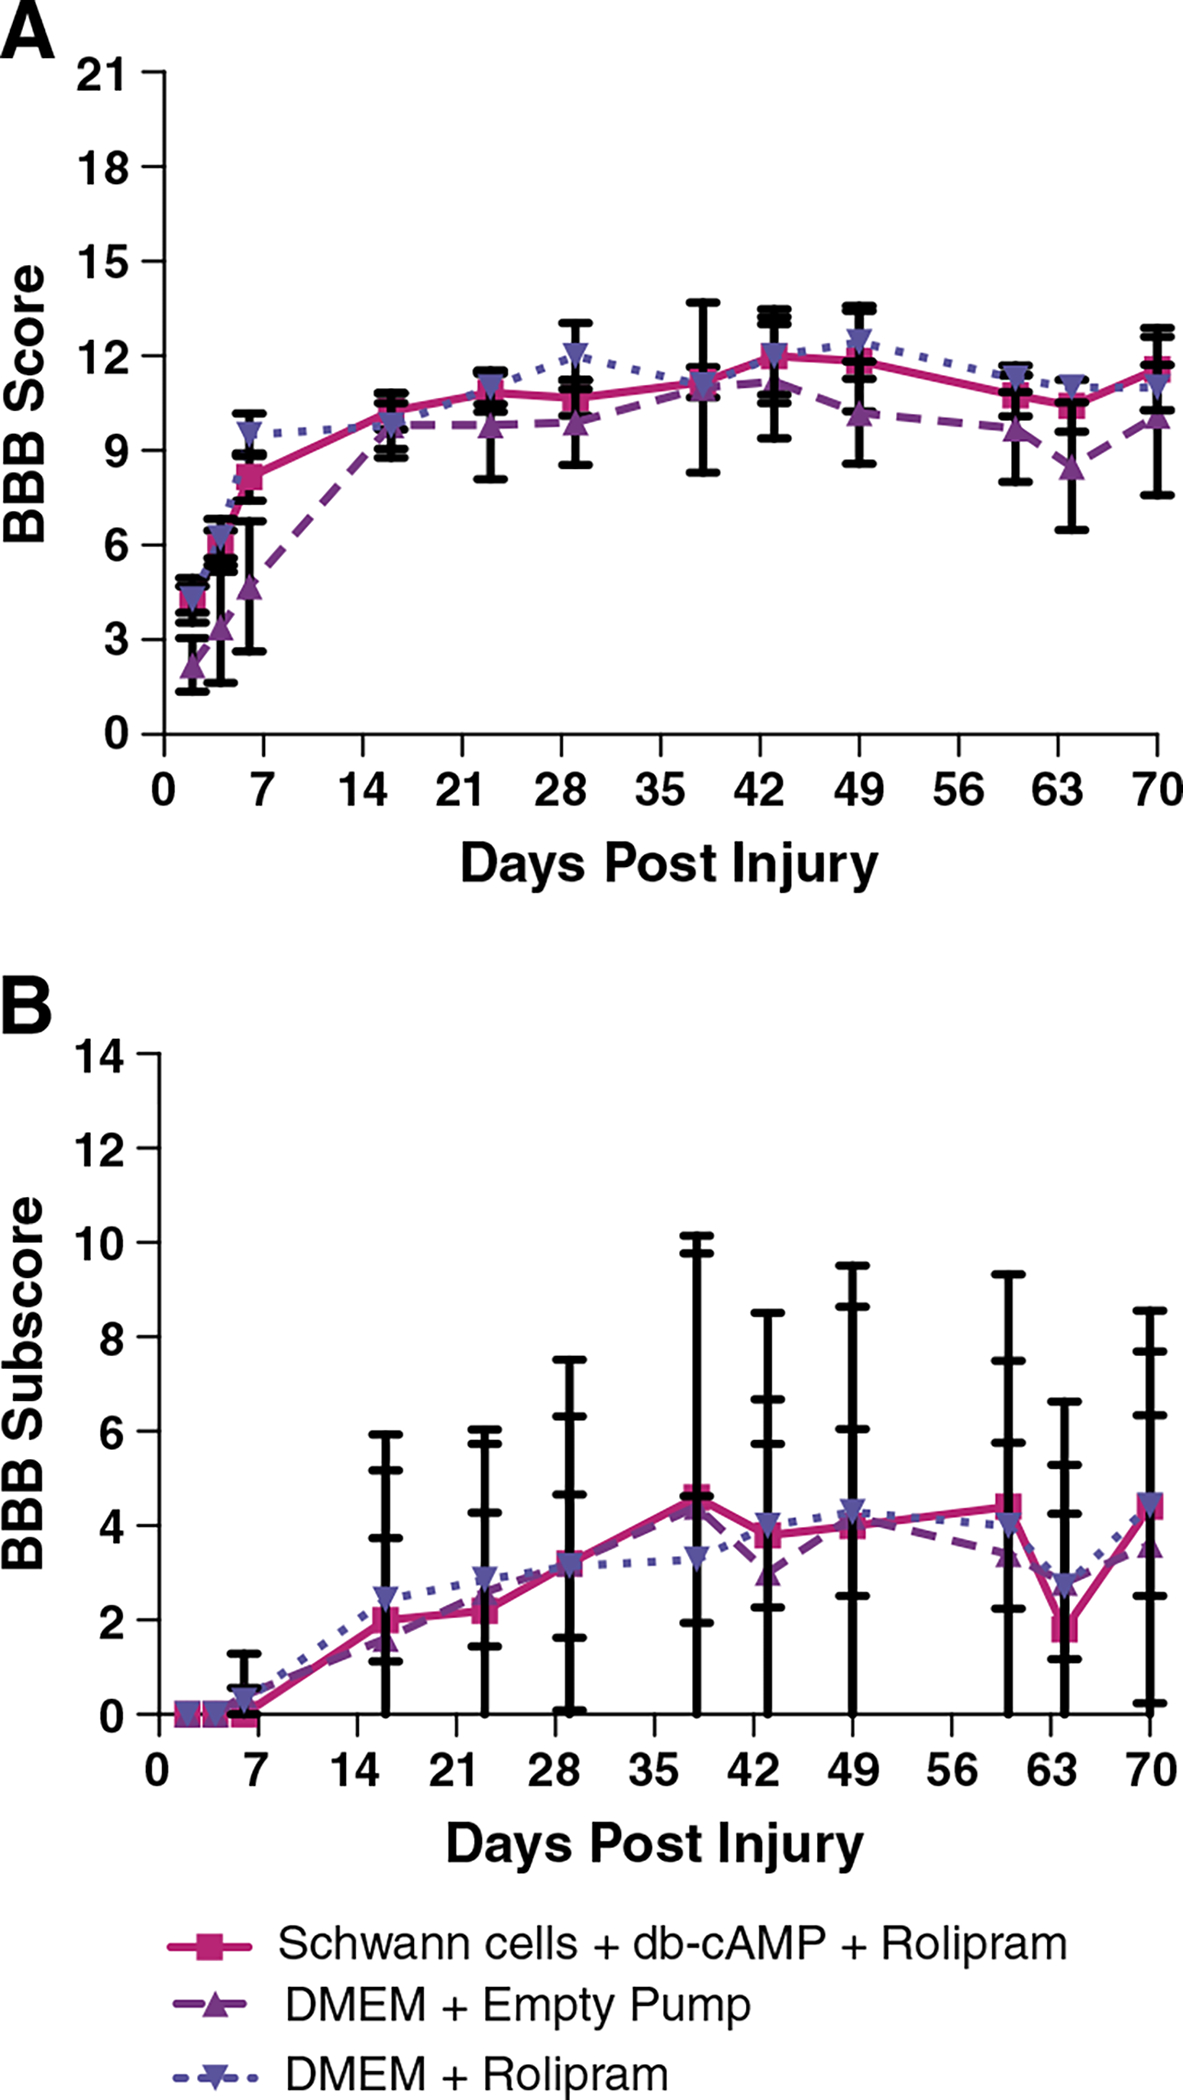
A) BBB analyses of hindlimb locomotor function in Squad 1: A) BBB scores across days post-injury. Repeated measures ANOVA revealed no significant differences between treatment groups (F = 0.93, p = 0.42) and a significant difference across days post-lesion (F = 44.09, p < 0.0001). B) BBB subscores. There was no significant difference between treatment groups (F = 0.01, p = 0.99) and a significant difference across days post lesion (F = 9.73, p < 0.0001) with a repeated measures ANOVA.
Footprint analyses using paint
The footprint analyses assessed hind foot exorotation, base of support, and stride length. Pearse et al. present data for only the 8-week post-injury time point, but we analyzed several time points (Fig. 2).
Fig. 2.

Footprint analysis using paint for Squad 1: A) the graph illustrates the average combined right and left paw rotation data at different times post-SCI. Repeated measures ANOVA revealed no significant differences between treatment groups (F = 0.28, p = 0.99) and across days post-lesion (F = 0.98, p = 0.45). B) The bar graph illustrates the average combined right and left paw rotation data at 66 days post-SCI (the final day on which animals were tested using footprint analysis). There was no significant difference between groups by ANOVA (F = 0.31, p = 0.74). C) The graph illustrates the average base of support at different times post-SCI. There were no significant differences between treatment groups (F = 1.05, p = 0.38) and across days post-lesion (F = 2.14, p = 0.051) by repeated measures ANOVA. D) The bar graph illustrates the average base of support at 66 days post-SCI. There was no significant difference between groups by ANOVA (F = 1.219, p = 0.34). E) The graph illustrates the average stride length at different times post-SCI. Repeated measures ANOVA revealed no significant differences between treatment groups (F = 0.44, p = 0.66) and across days post-lesion (F = 1.44, p = 0.20). F) The bar graph illustrates the average stride length at 66 days post-SCI. There was no significant difference between groups by ANOVA (F = 2.68, p = 0.13).
Paw rotation
During locomotion, un-injured rats rotate their hindpaws outwards at a characteristic angle (exorotation). Following spinal cord injury, if the animals can bear weight, the paw is rotated outwards at a greater angle to maintain stability, and the degree of exorotation decreases towards control values as the rats recover locomotor ability. Pearse et al. report that uninjured Fischer rats exhibited about 13° of exorotation during locomotion, untreated rats with moderate contusion injuries exhibited about 25° of exorotation, and the optimal treatment group (acute Schwann cells, db-cAMP and Rolipram) exhibited about 15° of exorotation, which is closer to the values in uninjured control rats.
Fig. 2A illustrates exorotation across testing days for the rats in Squad 1, and Fig. 2B illustrates the combined right and left paw rotation data from the 66 day time point, which is directly comparable to the data from Pearse et al. On the final day of testing, the untreated rats exhibited about 18° of exorotation whereas the rats that received the combined treatment exhibited about 10°. The absolute values of the data are somewhat different than in Pearse et al. for all groups, but differences between groups on the final day of testing are similar to what Pearse reported (that is, rats that received the combined treatment exhibited more normal paw rotation than untreated control rats). Thus, considering only the final day of testing, our results are similar to what Pearse et al. report. One way ANOVA revealed that there was no statistically significant difference between groups (F = 0.31, p = 0.74), however. Importantly, the graph of paw rotation over time reveals considerable variability across days, so that a different relationship between groups would be seen depending on the day of testing.
Base of support
During locomotion, normal rats place their hindfeet at a characteristic distance apart (called base of support). The base of support is wider in spinal cord injured rats that are able to bear weight because of instability, and the base of support decreases toward control values as animals recover locomotor ability. Pearse et al. report that base of support in uninjured control rats was about 2 cm; in untreated rats with moderate contusion injuries, average base of support at 66 days post-injury was approximately 4 cm; and in the combined treatment group (acute Rolipram, db-cAMP and Schwann cells) base of support was about 2.5 cm, which is closer to un-injured control values.
Fig. 2C illustrates base of support across testing days for the rats in Squad 1, and Fig. 2D illustrates the base of support data from the 66 day time point. On the final day of testing, the average base of support in the untreated injured control group is about 4 cm, which is exactly comparable to what is reported in Pearse et al. The combined treatment group has a slightly narrower base of support (about 3.5 cm) but this is not significantly different than the un-treated injured control by ANOVA (F = 1.21, p = 0.34).
Stride length
During locomotion, normal rats exhibit a characteristic length of stride. Stride length is shorter in spinal cord injured rats that are able to step, and increases toward control values as animals recover locomotor ability. Pearse et al. did not report data on stride length. Because these data are readily available from the footprint data, we added this analysis. Fig. 2E illustrates the data for stride length across testing days and Fig. 2F illustrates the stride length at 66 days post-injury. There were no significant differences between groups in this measure by ANOVA (F = 2.76, p = 0.13).
Video kinematic analysis
In addition to the footprint analysis with paint, hindlimb use during locomotion was also assessed using video kinematics. Pearse et al. did not carry out this analysis, so no comparable data are available. The same parameters were measured as in the footprint analysis using paint (paw rotation: Fig. 3A, base of support: Fig. 3B, and stride length: Fig. 3C). There were no significant differences between groups on any of the measures by ANOVA (paw rotation: F = 2.21, p = 0.16, base of support: F = 0.41, p = 0.67, stride length: F = 0.90, p = 0.44). It should be noted that the values for the degrees of paw rotation were different from what was obtained from the footprint analysis with paint because of a small difference in measurement technique necessitated by the difficulty of precisely determining toe position in the videos. In contrast, base of support and stride length were measured in exactly the same way and the values were almost identical.
Fig. 3.

Video kinematic analysis for Squad 1 at 67 days post-injury: A) average combined right and left paw rotation. B) Average base of support. C) Average stride length. There were no significant differences between groups on any of the measures by ANOVA (paw rotation: F = 2.21, p = 0.16, base of support: F = 0.41, p = 0.67, stride length: F = 0.90, p = 0.44).
Hindlimb placement in the grid walk task
Normal rats can cross a grid with minimal if any foot slips (the grid walk task). Spinal cord injured rats that are able to bear weight can cross a grid, but exhibit many footslips (called footfall errors). As the rats recover, the number of footfall errors decreases. Assessment of hindlimb placement accuracy when animals crossed a grid revealed no differences between groups at any post-lesion interval. The number of footfall errors in all groups was about the same (average of 12–16) as in the untreated control groups of Pearse et al. Fig. 4A illustrates the data from testing at different post-injury days and Fig. 4B illustrates the data from the final day of testing. One-way ANOVA revealed that there was no statistically significant difference between groups at 64 days (F = 1.74, p = 0.21). Again, the data were highly variable across the post-injury survival period, and so the relationship between groups varies across testing days. For example, on days 42, 49, and 56, the scores of the 3 groups were essentially identical.
Fig. 4.

Hindlimb placement in the grid walk task-Squad #1: A) the graph illustrates the average number of hindlimb footfall errors at different times post-SCI. Repeated measures ANOVA revealed no significant differences between treatment groups (F = 0.01, p = 0.99) and across days post-lesion (F = 1.82 and p = 0.09). B) The bar graph illustrates the average number of footfall errors at 64 days post-SCI (the final day on which animals were tested in the grid walk task). There was no statistically significant difference between groups at 64 days by ANOVA (F = 1.74, p = 0.21).
Hindlimb placement in the ladder beam task
The grid walk and ladder beam are related measures of an animal’s ability to place their hindlimbs during locomotion. Normal rats can cross a ladder beam with minimal if any foot slips. Spinal cord injured rats that are able to bear weight can cross but exhibit footfall errors. As the rats recover, the number of footfall errors decreases. Measures of footfall errors with the ladder beam at 65 days post lesion yielded error scores of 7.73 ± 7.34 for the combined treatment group; 9.20 ± 9.89 for the vehicle + empty pump, and 7.3 ± 8.9 for the vehicle + Rolipram groups (ANOVA: F = 0.08, p = 0.92).
Squad 2
BBB analyses of hindlimb locomotor function
The general pattern of deficit and recovery was similar to what was seen in Squad 1 and reported by Pearse et al. for the control groups (Fig. 5A). The final BBB score for the control group was around 12. Interestingly, all 3 treatment groups scored slightly higher on the BBB than the control at most post-injury intervals, and the group that received Schwann cells only exhibited the highest scores. Repeated measures ANOVA revealed no significant differences between treatment groups (F = 0.84, p = 0.49) and a significant difference across days post-lesion (F = 98.04, p < 0.0001). In Squad 2, BBB subscores did not differ across groups (repeated measures ANOVA: F = 0.89, p = 0.46 for treatment groups), but there were significant differences across days post lesion (F = 31.98, p < 0.0001) with repeated measures ANOVA. BBB subscores were higher for the combined treatment group and the control group (vehicle and empty pump, see Fig. 5B).
Fig. 5.

A) BBB analyses of hindlimb locomotor function in Squad 2: A) BBB scores across days post-injury. Repeated measures ANOVA revealed no significant differences between treatment groups (F = 0.84, p = 0.49) and a significant difference across days post-lesion (F = 98.04, p < 0.0001). B) BBB subscores. BBB subscores did not differ (F = 0.89, p = 0.46), but a significant difference across days post injury (F = 31.98, p < 0.0001 was revealed with a repeated measures ANOVA.
Footprint analyses using paint
Paw rotation
Fig. 6A illustrates paw exorotation across testing days for the rats in Squad 2. Repeated measures ANOVA revealed no significant differences between treatment groups (F = 2.65, p = 0.07) and a significant difference across days post-lesion (F = 3.94, p = 0.001). On the final day of testing at 66 days post lesion (Fig. 6B), rats in all groups exhibited approximately 24–26° of exorotation. There was no significant difference between groups by ANOVA (F = 1.16, p = 0.35). The absolute values of the data are different than for Squad 1, and are more comparable to the values reported by Pearse for the control untreated rats. Again, the graph of paw rotation over time reveals considerable variability over time, so that a different relationship between groups would be seen depending on the day of testing.
Fig. 6.

Footprint analysis using paint for Squad 2: A) the graph illustrates the average combined right and left paw rotation data at different times post-SCI. Repeated measures ANOVA revealed no significant differences between treatment groups (F = 2.65, p = 0.07) and a significant difference across days post-lesion (F = 3.94, p = 0.001). B) The bar graph illustrates the average combined right and left paw rotation data at 66 days post-SCI (the final day on which animals were tested using footprint analysis). There was no significant difference between groups by ANOVA (F = 1.16, p = 0.35). C) The graph illustrates the average base of support at different times post-SCI. Repeated measures ANOVA revealed no significant differences between treatment groups (F = 1.95, p = 0.15) and across the days post-lesion (F = 0.93, p = 0.47). D) The bar graph illustrates the average base of support at 66 days post-SCI. There were no significant differences between groups at 66 days post-lesion (F = 0.89, p = 0.46). E) The graph illustrates the average stride length at different times post-SCI. Repeated measures ANOVA revealed significant differences across days post-lesion (F = 6.40, p < 0.0001). F) The bar graph illustrates the average stride length at 66 days post-SCI. There were no significant differences between groups at 66 days post-lesion (F = 0.19, p = 0.90).
Base of support
Fig. 6C illustrates a plot of base of support across testing days for the rats in Squad 2, and Fig. 6D illustrates the base of support data at 66 days post-injury. As for Squad 1, on the final day of testing, the average base of support in the untreated control group is about 4 cm. The combined treatment group again has a slightly narrower base of support (about 3.5 cm), and other groups were also very near this level. Repeated measures ANOVA revealed no significant differences between treatment groups (F = 1.95, p = 0.15). There were no significant differences between groups at 66 days post-lesion (F = 0.89, p = 0.46).
Stride length
Fig. 6E illustrates the data for stride length across testing days and Fig. 6F illustrates the stride length at 66 days post-injury. Repeated measures ANOVA revealed significant differences across days post-lesion (F = 6.40, p < 0.0001). There were no significant differences between groups at 66 days post-lesion (F = 0.19, p = 0.90).
Video kinematic analysis
Kinematic analyses for Squad 2 are illustrated in Fig. 7. Fig. 7A illustrates data for paw rotation; Fig. 7B illustrates base of support, and Fig. 7C illustrates stride length. There were no significant differences between groups on any of the measures by ANOVA (paw rotation: F = 0.41, p = 0.75, base of support: F = 1.53, p = 0.23, stride length: F = 0.82, p = 0.49). As for Squad 1, the values for the degrees of paw rotation were different from what was obtained from the footprint analysis with paint whereas the values for base of support and stride length were almost identical.
Fig. 7.

Video kinematic analysis for Squad 2 at 69 days post-injury: A) average combined right and left paw rotation. B) Average base of support. C) Average stride length. There were no significant differences between groups on any of the measures by ANOVA (paw rotation: F = 0.41, p = 0.75, base of support: F = 1.53, p = 0.23, stride length: F = 0.82, p = 0.49).
Hindlimb placement in the grid walk task
Fig. 8A illustrates the data for hindlimb placement in the grid walk task from testing at different post-injury days and Fig. 8B illustrates the data from the final day on which grid walk was assessed (65 days post-injury). There were no significant differences between groups at 65 days post-lesion (F = 2.05, p = 0.13).
Fig. 8.

Hindlimb placement in the grid walk task-Squad 2: A) the graph illustrates the average number of hindlimb footfall errors at different times post-SCI. There were no significant differences between treatment groups (repeated measures anova; F = 0.63, p = 0.60), but there were significant differences across days post-lesion (repeated measures anova; F = 31.26, p = < 0.0001) B) The bar graph illustrates the average number of footfall errors at 65 days post-SCI (the final day on which animals were tested in the grid walk task). There were no significant differences between groups at 65 days post-lesion (F = 2.053, p = 0.13).
Hindlimb placement in the ladder beam task
The results from the ladder beam task were similar to the grid walk task. At 65 days post-lesion, error scores were 3.89 ± 0.61 for the combined treatment group; 0.95 ± 1.45 for the Schwann cells + empty pump group; 3.17 ± 5.68 for the vehicle + empty pump, and 7.56 ± 9.77 for the vehicle + Rolipram groups (ANOVA: F = 2.08, p = 0.13).
Combined data from Squads 1 and 2
The data from Pearse et al. were generated from different squads of rats run over a period of several years, and the data are presented in a single combined analysis. Accordingly, we combined the data from Squad 1 and Squad 2 into a single analysis.
BBB analyses of hindlimb locomotor function
Fig. 9A illustrates the combined BBB analysis and Fig. 9B illustrates the BBB subscores. Again, the final BBB score for the control group was around 12. In the combined analysis, the group that received Schwann cells only exhibited higher scores than any of the other groups across most of the testing period, but for unknown reasons exhibited lower scores on the final 2 days of testing. Repeated measures ANOVA revealed no significant differences between treatment groups (F = 1.33, p = 0.28) and a significant difference across days post-lesion (F = 140.92, p < 0.0001). There were no significant differences between groups at 69 days post-lesion (F = 0.87, p = 0.46).
Fig. 9.

A) BBB analyses of hindlimb locomotor function for Squads 1 and 2 combined: A) BBB scores across days post-injury. Repeated measures ANOVA revealed no significant differences between treatment groups (F = 1.33, p = 0.28) and a significant difference across days post-lesion (F = 140.92, p < 0.0001). There were no significant differences between groups at 69 days post-lesion (F = 0.87, p = 0.46). B) BBB subscores. Repeated measures ANOVA revealed no significant differences between treatment groups (F = 0.83, p = 0.49) and a significant difference across days post-lesion (F = 31.72, p < 0.0001). C) BBB scores in the subset of rats in which the “error” parameter reported by the NYU device was less than 10%. Repeated measures ANOVA revealed no significant differences between treatment groups (F = 1.59, p = 0.21) and a significant difference across days post-lesion (F = 120.22, p < 0.0001). D) BBB Subscores in the subset of rats in which the “error” parameter reported by the NYU device was less than 10%. Repeated measures ANOVA revealed no significant differences between treatment groups (F = 0.90, p = 0.46) and a significant difference across days post-lesion (F = 25.85, p < 0.0001).
Nevertheless, the group that received Schwann cells only exhibited higher average BBB scores at all post-lesion testing intervals after the transplants, which would be significant based on a non-parametric statistic such as a sign test. In the case of the BBB subscore (Fig. 9B), repeated measures ANOVA revealed no significant differences between treatment groups (F = 0.83, p = 0.49) and a significant difference across days post-lesion (F = 31.72, p < 0.0001), all groups recovered to a level that was somewhat higher than the control groups of Pearse et al.
One of the factors that became apparent through direct discussions with Pearse et al. after our experiments were completed is that they excluded rats in which injury parameters recorded by the NYU device were out of a predefined range (“error” readings more than 10%). Our experience is that in many cases, acceptable lesions are produced even when the NYU device indicates an error, and so we tested rats after injury and included all whose BBB scores fall within the expected range. Given this difference in procedure, we re-analyzed the combined group BBB data excluding animals in which NYU readout indicated errors greater than 10% (Figs. 9C and D). In total, 10 rats were excluded from the analyses on this basis, leaving group sizes of 8 animals in the combined treatment group (Schwann cells, db-cAMP and Rolipram), 7 animals in the Schwann cell and empty pump group, 12 animals in the DMEM and empty pump group, and 13 animals in the DMEM and Rolipram group. The general pattern of results was virtually identical; again, the group that received Schwann cells only had higher BBB scores than the other groups. For BBB scores, repeated measures ANOVA revealed no significant differences between treatment groups (F = 1.59, p = 0.21) and a significant difference across days post-lesion (F = 120.22, p < 0.0001). For BBB subscores, repeated measures ANOVA revealed no significant differences between treatment groups (F = 0.90, p = 0.46) and a significant difference across days post-lesion (F = 25.85, p < 0.0001).
Footprint analysis using paint
Paw rotation
Fig. 10A illustrates paw exorotation across testing days for the combined data from Squad 1 and Squad 2, and Fig. 10B illustrates the combined right and left paw rotation data at 65–66 days post-injury. On the final day of testing, rats in all groups exhibited an average of approximately 20–25° of exorotation. There were no statistically significant differences between groups by ANOVA (F = 0.87, p = 0.47). As in the data from the two squads plotted separately, the relationship between groups varies depending on the day of testing. Analyses of the subset of rats in which the “error” parameter reported by the NYU device was less than 10% revealed a similar pattern of results (Supplementary Fig. 1).
Fig. 10.

Footprint analysis using paint for Squads 1 and 2 combined: A) the graph illustrates the average combined right and left paw rotation data at different times post-SCI. Repeated measures ANOVA did not reveal significant changes between treatment groups (F = 1.63, p = 0.20), but there are significant differences across days post-lesion (F = 2.63, p = 0.009). B) The bar graph illustrates the average combined right and left paw rotation data at 66 days post-SCI (the final day on which animals were tested using footprint analysis). There were no statistically significant differences between groups by ANOVA (F = 0.87, p = 0.47). C) The graph illustrates the average base of support at different times post-SCI. There were significant differences between treatment groups (repeated measures ANOVA; F = 3.01, p = 0.04), but not significant differences across days post-lesion (F = 1.7, p = 0.09). D) The bar graph illustrates the average base of support at 66 days post-SCI. There were no statistically significant differences between groups by ANOVA (F = 1.40, p = 0.26). E) The graph illustrates the average stride length at different times post-SCI. Repeated measures ANOVA did not reveal significant changes between treatment groups (F = 1.86, p = 0.15), but there are significant differences across days post-lesion (F = 2.11, p = 0.03). F) The bar graph illustrates the average stride length at 66 days post-SCI. There were no statistically significant differences between groups by ANOVA (F = 0.19, p = 0.90).
Base of support
Fig. 10C illustrates a plot of base of support across testing days for the combined data, and Fig. 10D illustrates the base of support data at 65–66 days post-injury. The group that received the combined treatment had a narrower base of support than other groups on all testing days except day 21. On the final day of testing, the average base of support in the untreated injured control group and the group that received Rolipram only is about 4 cm. The combined treatment group and the group that received Rolipram again had a narrower base of support (about 3.5 cm). There were no statistically significant differences between groups by ANOVA (F = 1.40, p = 0.26). Analyses of the subset of rats in which the “error” parameter reported by the NYU device was less than 10% revealed a similar pattern of results (Supplementary Fig. 2).
Stride length
Fig. 10E illustrates the data for stride length across testing days and Fig. 10F illustrates the stride length on 65–66 days post-injury. There were no significant differences between groups in this measure (F = 0.19, p = 0.90). Analyses of the subset of rats in which the “error” parameter reported by the NYU device was less than 10% revealed a similar pattern of results (Supplementary Fig. 3).
Video kinematic analysis
Kinematic analyses for the combined data from Squads 1 and 2 are illustrated in Figs. 11A, B and C. Fig. 11A illustrates data for paw rotation; Fig. 11B illustrates base of support, and Fig. 11C illustrates stride length. There were no significant differences between groups on any of the measures by ANOVA (paw rotation: F = 0.28, p = 0.84, base of support: F = 1.16, p = 0.34, stride length: F = 0.90, p = 0.43). Analyses of the subset of rats in which the “error” parameter reported by the NYU device was less than 10% revealed a similar pattern of results (Supplementary Fig. 4).
Fig. 11.

Video kinematic analysis for Squads 1 and 2 combined at 67 and 69 days post-injury: A) average combined right and left paw rotation. B) Average base of support. C) Average stride length. There were no significant differences between groups on any of the measures by ANOVA (paw rotation: F = 0.28, p = 0.84, base of support: F = 1.16, p = 0.34, stride length: F = 0.90, p = 0.43).
Hindlimb placement in the grid walk task
Fig. 12A illustrates the data for hindlimb placement in the grid walk task from testing at different post-injury days and Fig. 12B illustrates the data from the final day of testing. The one way ANOVA revealed significant differences between groups (F = 46.15, p < 0.0001); post-hoc comparisons by a Tukey’s multiple comparison tests are shown in Table 1. The group that received Schwann cells only exhibited significantly better performance (fewer footfall errors) than all other groups. The group that received combined treatment had fewer errors than the group that received DMEM + Rolipram, but did not differ from the control (DMEM + empty pump).
Fig. 12.

Hindlimb placement in the grid walk task for Squad 1 and Squad 2 combined: A) the graph illustrates the average number of hindlimb footfall errors at different times post-SCI. There were no significant differences between treatment groups (F = 2.62, p = 0.06) and across the days post-lesion (F = 5.86, p = 0.08). B) The bar graph illustrates the average number of footfall errors at 65 days post-SCI (the final day on which animals were tested in the grid walk task). The one way ANOVA was highly significant (F = 46.15, p < 0.0001); post-hoc comparisons by a Tukey’s multiple comparison tests are shown in the table.
Table 1.
Post-hoc comparisons of scores for hindlimb placement in the gridwalk task for squad 1 & 2 combined.
| Tukey’s multiple comparison test | Mean diff. | P value |
|---|---|---|
|
| ||
| SC + DB cAMP + Rolipram vs. SC + empty pump | 7.513 | P>0.05 |
| SC + DB cAMP + Rolipram vs. DMEM + empty pump | 2.072 | P>0.05 |
| SC + DB cAMP + Rolipram vs. DMEM + Rolipram | −3.73 | P>0.05 |
| SC + empty pump vs. DMEM + empty pump | −5.441 | P>0.05 |
| SC + empty pump vs. DMEM + Rolipram | −11.25 | P<0.05 |
| DMEM + empty pump vs. DMEM + Rolipram | −5.802 | P>0.05 |
Analyses of the subset of rats in which the “error” parameter reported by the NYU device was less than 10% revealed a similar pattern of results (Supplementary Fig. 5).
Hindlimb placement in the ladder beam task
For the ladder beam, there were no significant differences between groups (Supplementary Figure 6). Error scores were 3.64 ± 0.95 for the combined treatment group; 0.95 ± 1.45 for the Schwann cells + empty pump group; 4.94 ± 7.39 for the vehicle + empty pump, and 7.39 ± 8.91 for the vehicle + Rolipram groups (F = 1.37, p = 0.26).
Anatomical assessments
Examination of toluidine blue stained sections through the lesion epicenter in the different groups revealed a typical lesion pathology in rats that did not receive Schwann cells. Lesions varied in size and some were asymmetrical. Figs. 13 and 14 illustrate 6 examples of the lesion in the two groups that did not receive Schwann cells. The lesion site was characterized by a large and sometimes lobulated cavity that was crisscrossed with tissue bridges made up primarily of connective tissue and astrocyte processes. In the two groups that received Schwann cells, there was less cavitation in most cases and large numbers of Schwann cells and myelinated axons were evident in the core of the lesion in most animals (Figs. 15 and 16). There were, however, 1–2 outliers in each group in which there were large cavities and no obvious collections of Schwann cells. Thus, the Schwann cell transplants did not fill the lesion sites in all cases.
Fig. 13.

Examples of toluidine blue stained sections through the lesion epicenter in cases that received empty pumps and DMEM.
Fig. 14.

Examples of toluidine blue stained sections through the lesion epicenter in cases that received Rolipram and DMEM.
Fig. 15.

Examples of toluidine blue stained sections through the lesion epicenter in cases that received Schwann cells and empty pumps.
Fig. 16.

Examples of toluidine blue stained sections through the lesion epicenter in cases that received the combined treatment (Rolipram, Schwann cells and injections of db-cAMP).
Quantitative analyses of total lesion areas (including cavities and scar tissue) revealed no significant differences between groups (F = 1.43, p = 0.25). Similarly, although the mean cavity area at the lesion epicenter was smallest in the group that received the combined treatment (Fig. 17B), there were no statistically significant differences in cavity area between groups (F = 0.99, p = 0.41). Because there were obvious outliers, we also analyzed the data eliminating the cases with cavities larger than 1 mm2. Again, the mean cavity area at the lesion epicenter was smallest in the group that received the combined treatment, but ANOVA revealed that differences between groups were not statistically significant (F = 2.40, p = 0.08). Measures of spared tissue (including the Schwann cell transplants) are illustrated in Fig. 17C, and Fig. 17D illustrates a scatterplot of the relationship between lesion area and BBB scores in the different groups. The points from the different groups were distributed around the same regression line.
Fig. 17.

Quantitative analyses of lesion and cavity areas in the different groups. A) Lesion area. There were no statistically significant differences between groups by ANOVA (F = 1.43, p = 0.25). B) Cavity area. There were no statistically significant differences between groups by ANOVA (F = 0.99, p = 0.41). C) Amount of spared tissue (including Schwann cell transplant) at the lesion epicenter. There were no statistically significant differences between groups by ANOVA (F = 2.095, p = 0.12). D) Relationship between amount of spared tissue and BBB scores in individual animals.
Immunostaining for P-75 revealed large numbers of Schwann cells in rats that received Schwann cell transplants, but Schwann cells were also present in rats that did not receive Schwann cell transplants (data not shown). Indeed, it was not possible to distinguish between cases based on the distribution of Schwann cells. This is consistent with many previous studies that have documented extensive Schwann cell migration into the spinal cord after spinal cord injury.
Drs. Pearse and Bunge examined our plastic sections from groups that received Schwann cells, and felt that Schwann cell survival was sub-optimal in at least some rats. Thus, the question arose whether eliminating rats with poor transplant survival might bring out an effect of the successful transplants. Transplanted Schwann cells tend to fill the lesion area, so the more Schwann cells that survive, the smaller the cavity. To assess whether our failure to see enhanced recovery in groups that received Schwann cells was due to poor transplant survival in a subset of rats, we divided the transplant groups into sub-groups with the largest vs. the smallest cavities and compared BBB scores on the final day of testing. As illustrated in Supplementary Table 1, eliminating rats with large cavities did not change the relationship between treated vs. control groups.
Quantification of axon numbers at the lesion epicenter
The quantitative analyses of myelinated axons in the different groups are illustrated in Fig. 18. Figs. 18A–C illustrate average counts of peripheral myelinated axons (axons myelinated by Schwann cells), central myelinated axons (axons myelinated by oligodendrocytes) and total myelinated axons for both the lesion area and the rim of spared white matter. These counts include all rats. The group that received the combined treatment had the largest number peripheral myelinated axons in the lesion, but interestingly, the group that received Schwann cells only had the smallest number. Other groups had intermediate numbers. One way ANOVA revealed that there was a significant difference between groups (F = 3.95, p = 0.014), but post-hoc analyses by Tukey’s multiple comparison test revealed that the only significant difference was between the combined treatment group and the group that received Schwann cells only (p < 0.05).
Fig. 18.

Counts of myelinated axons and type of myelin at the lesion epicenter. Comparisons of numbers of axons myelinated by Schwann cells revealed a significant difference between groups (ANOVA: F = 3.95, p = 0.014), but post-hoc analyses by Tukey’s multiple comparison test revealed that the only significant difference was between the combined treatment group and the group that received Schwann cells only (p < 0.05). Comparisons of central myelinated axons and total myelinated axons by ANOVA revealed no significant differences between groups (F = 2.48, p = 0.07 for central myelinated axons and F = 2.21, p = 0.10 for total axons). D) Counts of central myelinated axons intact spinal cord. ANOVA reveals significant differences between treatment groups (F = 4.69, p = 0.008), but post-hoc analyses by Tukey’s multiple comparison test revealed that only significant difference was between Schwann cells only (p < 0.05) and DMEM and rolipram group. E) Peripheral Myelinated axons intact spinal cord. There were no significant differences between treatment groups (ANOVA; F = 0.87, p = 0.46).
Central myelinated axons and total myelinated axons were highest in the group that received Schwann cells only (Fig. 18). The other groups had generally similar numbers of central myelinated axons and total axons. ANOVA revealed no significant differences between groups, however, for either measure (F = 2.48, p = 0.07 for central myelinated axons and F = 2.21, p = 0.10 for total axons).
As above, we also analyzed the sub-set of rats in which the “error” parameter reported by the NYU device was less than 10%. Again, the group that received the combined treatment had the largest number peripheral myelinated axons in the lesion and the group that received Schwann cells only had the smallest number. Other groups had intermediate numbers. One way ANOVA revealed that there was a significant difference between groups (F = 5.30, p = 0.004), and post-hoc analyses by Tukey’s multiple comparison test revealed that the values in the combined treatment group were significantly higher than the group that received Schwann cells only and also the control group that received empty pumps and medium injections (p < 0.05).
As for the counts from all rats, central myelinated axons and total myelinated axons were highest in the group that received Schwann cells only, but one way ANOVA revealed no significant differences between groups, however for either measure (F = 2.38, p = 0.09, F = 2.08, p = 0.12) for the rats with errors less than 10%.
Assessment of retrogradely labeled neurons in the reticular formation and raphe nuclei
Fig. 19 illustrates examples of retrograde labeling seen in the brainstem of the different groups, and counts of retrogradely-labeled neurons in the brainstem including both reticular formation and Raphe nuclei (Fig. 19A), and the numbers in the reticular formation and Raphe nuclei respectively (Figs. 19B and C respectively). The total number of neurons was calculated from both sides. The absolute numbers in the injury only control group were less than the values reported by Pearse et al. (an average of approximately 1500 neurons in the reticular formation in our counts vs. approximately 3000 neurons in Pearse et al. and approximately 400 neurons in the Raphe nuclei in our counts vs. approximately 3000 in Pearse et al.). These differences may be due to the retrograde tracer used (True Blue in Pearse et al. vs. fluorogold here). The treated groups did not show higher numbers of retrogradely labeled neurons in either area than the un-treated controls. The group that received Schwann cells only had fewer labeled neurons in either area, but the differences were not statistically significant (F = 0.50, p = 0.68 for Raphe nuclei, F = 0.72, p = 0.55 for reticular formation, and F = 0.53, p = 0.66 for total counts).
Fig. 19.

A) Examples of retrogradely labeled neurons in the brainstem in different groups. The graphs illustrate counts of the total number of retrogradely-labeled neurons in the brainstem. B) Total in both reticular formation and Raphe nuclei; C) counts in the reticular formation; D) counts in the Raphe nuclei. There were no statistically significant differences between groups (F = 0.50, p = 0.68 for Raphe nuclei, F = 0.72, p = 0.55 for reticular formation, and F = 0.53, p = 0.66 for total counts).
Discussion
The present results fail to replicate a report that a combinatorial treatment of transplants of Schwann cells, systemic delivery Rolipram to enhance cyclic AMP levels, and intra-spinal injections of dibutyryl cyclic AMP enhanced locomotor recovery in rats after contusion injuries at the thoracic level. We have focused especially on the functional outcome measures. The reason is that the report of enhanced functional recovery is what distinguished the Pearse et al. paper from previous studies that demonstrated that Schwann cells can enhance axon growth into a spinal cord lesion site (Bunge, 2002). We made every effort to carry out the experiments in the same way as Pearse et al. The same strain of rat was used, Schwann cells were obtained from the original authors and the same analyses and testing procedures were used. There were, however, some differences, as discussed further below. In what follows, we discuss some of the possible variables that may have impacted on the failure to replicate.
Differences in experimental procedures
One noteworthy difference between the present study and Pearse’s is that their experiments were carried out over the course of several years, whereas we ran two large groups of animals. The former practice increases the chance of group differences based on unrecognized variables. The impact, however, depends on exactly how the groups were run. For example, if each iteration of the experiment involved small numbers of animals from all the different experimental groups, the overall variability might increase by doing things at different times whereas the effect of this variability on group differences would be minimal. Alternatively, if each iteration involved a different experimental group or subset of groups, unrecognized experimental differences are much more likely. Pearse et al. do not explain the grouping strategy, and indeed do not even note that it occurred in the Methods although it is clear that the experiment could not have been done in any other way because of the large number of groups and animals involved. Discussions with the original authors revealed that many of the iterations of the original experiment did involve different groups, although not all groups. Given the importance of such details, we would recommend that this information be provided in all SCI studies regardless of where the results are published.
Another potentially important issue is that we formed groups on the basis of BBB scores prior to transplantation surgery 7 days post-injury; this was to assure comparability of group means prior to transplantation. Pearse et al. do not explain how groups were comprised, and do not show locomotor function scores for the groups prior to transplantation. Their first data point is 7 days post-transplant, at which time locomotor function scores already differ across groups, although the differences are apparently not statistically significant.
We used ketamine xylazine for anesthesia where as Pearse et al. used gas anesthesia. Our assumption was that this would not be important for the purpose of the study, but it is possible that lesion severity, especially due to hemorrhage, differs depending on the anesthetic.
For BBB testing, we used a metal stock tank whereas Pearse et al. used a plastic wading pool. Perhaps more importantly, we tested animals once a week on all the tasks whereas Pearse et al. tested BBB weekly and other functional tests were done once at the end of the study. It is possible that our more extensive testing could lead to fatigue, which could impair performance. An argument against this possibility is that raw scores on most tests were similar between the studies. If the difference in testing procedure does account for our failure to detect a beneficial effect of the combined treatment, this would indicate that treatment-dependent improvements are seen only under very precise testing conditions. In other words, the effect of treatment is not robust.
Differences in the retrograde tracing procedures were noted previously. In addition to the difference in tracer, there were differences in the injection procedures. Injections of Fast Blue were at a depth of 1–2 mm at a total of four sites; fluorogold injections were made at a depth of 0.5 mm at a total of three sites based on our previous experiments that yielded excellent retrograde labeling of neurons that give rise to descending pathways including neurons in the brainstem. Fluorogold injections were made at 11 weeks post-injury whereas injections in Pearse et al. were at 9 weeks. The reason is that the standard survival time for Fast Blue is 2 weeks, whereas for fluorogold, it is two days. Thus, rats were killed at the same post-injury survival time. It is possible that our injections were less effective in labeling the descending brainstem pathways than the injections of Pearse et al., but this would not explain the lack of differences between treatment groups.
Housing conditions differed across studies. Pearse et al. housed rats individually whereas in the present study, rats were housed 4–5 per cage. This practice is preferred by our animal care and use committee in order to allow for social interactions to enhance animal welfare after the spinal cord lesions. Unfortunately, the group housing probably accounted for the fact that some rats had to be euthanized due to damage inflicted at the pump implantation site. Euthanasia because of mutilation at the pump implantation site contributed to the higher attrition in our study vs. Pearse et al.
An interesting point is that animals housed in groups tend to gain less weight over time than animals housed singly, which may be due in part to increased physical activity and exercise due to social play. Either the exercise or the lower weight could have an impact on locomotor function scores, likely improving function. Some types of exercise improve locomotor function after moderate thoracic contusion injuries (Engesser-Cesar et al., 2005; Engesser-Cesar et al., 2007), and social play could have effects beyond those due to increased activity. If locomotor function was generally better across groups in our study, this could obscure differences resulting from treatment. If so, this would again indicate that treatment-dependent improvements are seen only under very precise testing conditions.
Finally, there was a minor difference in the histological preparation of the brain and spinal cord tissue. Pearse et al. sectioned at 30 μm on a freezing microtome; we sectioned at 20 μm on a cryostat. We consider it highly unlikely that these differences accounted for the discrepancy in results.
Lesion variability
There was clearly considerable variability in the lesions we produced using the NYU impactor. Pearse et al. do not document all lesions, so it is not possible to compare either variability in lesion size or absolute lesion size across studies. Although we are highly experienced in the surgical procedures, our Center generally uses the IH Device to create contusion injuries. The fact that we have less experience with the NYU impactor could have contributed to lesion variability, although variability is also seen with labs that are experienced with the NYU impactor. In any case, variability would be expected to be distributed across groups and could affect the probability of detecting a statistically significant effect, but is unlikely to account for the fact that means were very similar on most measures.
Variability in Schwann cell transplants
The histological/immunocytochemical analyses revealed that Schwann cells were present at the lesion epicenter in many cases and in these cases, it was qualitatively obvious that there were higher numbers of myelinated axons embedded in and myelinated by Schwann cells. Nevertheless, it appeared that transplants failed in some rats and most of our transplants did not completely fill the lesion cavities. Pearse et al. report that Schwann cell transplants filled the lesion cavity in their studies, but there was no quantitative assessment of whether all animals exhibited such filling. If Schwann cell survival and engraftment in our experiments was less than in the Pearse et al. study, this could explain the failure to see a positive functional benefit of the combined treatment. Arguing against this possibility is the fact that transplant survival appeared qualitatively similar in the combined treatment and Schwann cell only group, yet it was the latter that showed higher scores on some measures. The fact that our transplants did not fully fill lesion cavities may reflect the fact that we are less experienced with Schwann cell handling and Schwann cell transplants than Dr. Bunge’s group.
It is noteworthy that Schwann cells were also present in the lesion in un-treated rats; this is expected because some Schwann cells do migrate in from damaged peripheral nerves. Untreated rats did not exhibit the clusters of Schwann cells and myelinated axons in the lesion epicenter, however.
One problem was encountered in the anatomical assessment of retrograde labeling of neurons in the brainstem in that there was a technical failure for the first squad (no retrograde labeling in any animal). As noted, further investigation revealed that the compound used was not the same as used by Pearse et al. because Sigma had changed suppliers. After consultation with the Program officer, we switched to fluorogold for the retrograde tracing for Squad 2, and obtained satisfactory labeling in most animals. Nevertheless, the combined treatment groups did not have a higher number of retrogradely labeled neurons.
Significance of a failure to replicate
Regarding the general issue of failure to replicate, a recent study of an animal model of ALS (SOD1 transgenic mice) provides important insights (Scott et al., 2008). This study identified several biological variables that contribute to a “noise floor” in studies of survival of SOD1 mice (the principal outcome measure for testing interventions). Then, in studies that controlled these variables and that were sufficiently powered, 8 compounds that have been reported to enhance motoneuron survival in SOD1 mice were re-tested. For some compounds, the number of animals exceeded the number used in all previous studies combined. Importantly, all tested compounds failed to significantly enhance survival.
Re-assessment of the original reports of positive effects revealed trends in the data, including control groups with shorter life spans than predicted by the model together with treated groups that fell within the predicted control range. A possible explanation was that groups were not run in parallel, but rather were run at different times or places. This is clearly what was done in Pearse et al., where treatment groups included animals run over a period of several years. This problem is typical of spinal cord injury experiments in which it is difficult or impossible to generate a sufficient number of injured animals at the same time because of the time required for the surgery, animal care, and animal testing. Here, we were able to test larger numbers of animals simultaneously because of our team approach, but even with multi-member teams, there are practical limits to the number of animals that can be run at the same time. In any case, we feel that it is critical to fully explain how groups were constructed in Methods sections, which is rarely if ever done.
Another problem noted by Scott et al. is a failure to control experimental variables, for example to ensure a constant repeat number in the SOD1 mice in different experimental groups. For the SOD1 model, this translates into disease severity; for SCI studies, the equivalent variable is injury severity. We actually did that here by forming groups based on BBB scores during the first week post-injury. The approach suggested (matching and balancing experimental groups) is not always possible when the variable itself (injury severity) may be affected by the treatment unless matching can be done before the intervention. This is of course not possible with neuroprotective strategies.
One other important issue raised by Scott et al. pertains to the appropriateness of the statistical methods. Although this is clearly critical, no statistic will detect significant differences when means are identical. Also inadequate statistics cannot explain results where the direction of effect is opposite what was shown in the original study.
Scott et al. (2008) provided practical recommendations for improving preclinical study design using the SOD1 mouse model which are worthy of consideration for SCI studies: 1) each cohort should have at least 24 matched/balanced animals (an impractical number for SCI studies unless groups are run asynchronously); 2) each study should be blinded to both animal technicians and investigators (challenging with SCI studies because investigators come to know individual animals); 3) exclusion of animals that die for reasons other than ALS, AND exclusion of the matched animals from other groups; 4) verifying copy number to assure consistency of disease severity (translates to injury severity in SCI); and 5) appropriate statistics.
All of these considerations are clearly important for any treatment or intervention in which there is modest effect size. Failure to replicate is likely unless effect size is large, and this was not the case for the measures reported by Pearse et al. Thus, a failure to replicate is not surprising. There may be other variables that were not fully controlled in our replication, which could explain the differences in results.
The real question is whether a treatment or intervention that has a modest effect that can only be detected under highly controlled conditions is appropriate for advancement to clinical application. In the absence of a robust treatment effect, the SCI field is faced with the dilemma of either failing to move anything forward (a huge disappointment to our constituents) or trying to move forward with treatments with modest effect that may not be detectable in a clinical setting where variability will be much higher.
Conclusion
Our failure to replicate here is not likely to be due to major procedural differences, but may reflect the high noise level of the measures including less effective engraftment of Schwann cells. In any case, the exact treatment used here does not robustly and reliably enhance functional recovery as measured by the techniques used. Unidentified experimental variables may account for the different outcomes. Identifying these will be the key to making therapeutic strategies using combinatorial treatments more reliable and robust.
Supplementary Material
Acknowledgments
Support by NO1-NS-3-2353 to O.S. is acknowledged. The authors thank Drs. Mary Bunge and Damien Pearse for providing Schwann cells and for extensive discussions regarding the experiments and analyses and to A. Parham, J. Mizufuka, L. Butler, I. Sears-Kraxberger, and S. Burke for the excellent technical assistance.
Footnotes
Supplementary materials related to this article can be found online at doi:10.1016/j.expneurol.2010.12.020.
References
- Basso DM, Beattie MS, Bresnahan JC, 1996. Graded histological and locomotor outcomes after spinal cord contusion using the NYU weight-drop device versus transection. Exp. Neurol. 139, 244–256. [DOI] [PubMed] [Google Scholar]
- Bunge MB, 2002. Bridging the transected or contused adult rat spinal cord with Schwann cell and olfactory ensheathing glia transplants. Prog. Brain Res. 137, 275–282. [DOI] [PubMed] [Google Scholar]
- Engesser-Cesar C, Anderson AJ, Basso DM, Edgerton VR, Cotman CW, 2005. Voluntary wheel running improves recovery from a moderate spinal cord injury. J. Neurotrauma 22, 157–171. [DOI] [PubMed] [Google Scholar]
- Engesser-Cesar C, Ichiyama RM, Nefas AL, Hill MA, Edgerton VR, et al. , 2007. Wheel running following spinal cord injury improves locomotor recovery and stimulates serotonergic fiber growth. Eur. J. Neurosci. 25, 1931–1939. [DOI] [PubMed] [Google Scholar]
- Pearse DD, Pereira FC, Marcillo AE, Bates ML, Berrocal YA, et al. , 2004. cAMP and Schwann cells promote axonal growth and functional recovery after spinal cord injury. Nat. Med. 10, 610–616. [DOI] [PubMed] [Google Scholar]
- Scott S, Kranz JE, Cole J, Lincecum JM, Thompson K, et al. , 2008. Design, power, and interpretation of studies in the standard murine model of ALS. Amyotroph. Lateral Scler. 9, 4–15. [DOI] [PubMed] [Google Scholar]
Associated Data
This section collects any data citations, data availability statements, or supplementary materials included in this article.