

Abstract
The study aimed to assess the human health risk of PM2.5-bound heavy metals from anthropogenic sources in Khon Kaen Province, Thailand between December 2020 and February 2021. According to the findings, the geometric mean concentration of PM2.5 in the university area, residential area, industrial zone, and the agricultural zone was 32.78 μg/m3, 50.25 μg/m3, 44.48 μg/m3, and 29.53 μg/m3, respectively. The results showed that the estimated human health risk assessment, in terms of non-carcinogenic risks among children and adults in an urban area (residential and university), industrial zone, and the agricultural area, was of hazard index (HI) value of >1.0 indicating a greater chance of chronic effects occurring. This study showed that exposure to PM2.5-bound heavy metal may increase the likelihood that lasting effects will result in a very high carcinogenic risk (CR) in children in residential areas, and an industrial zone with total carcinogenic risk (TCR) values of , and , respectively while resulting in a high TCR of and within the university areas and agricultural zone, respectively. In addition, health risk assessments among adults demonstrate high TCR values of (residential area), (industrial zone), and (agricultural zone), thus indicating a potential health risk to adults living in these areas while the university area was very low effects on carcinogenic risk () for adults. Therefore, lowering the risk of exposure to PM2.5 via the respiratory tract, for example, wearing a mask outside is a very effective self-defense strategy for people within and around the study site. This data study strongly supports the implementation of the air pollutant emission source reduction measures control and health surveillance.
Keywords: Air pollution, PM2.5, Heavy metals, Inhalation exposure, Non-carcinogenic risk, Carcinogenic risk, Health risk
Graphical abstract

Air pollution; PM2.5; Heavy metals; Inhalation exposure; Non-carcinogenic risk; Carcinogenic risk; Health risk
1. Introduction
Air pollution is one of the most serious environmental problems to be addressed locally, regionally, and globally. It is endangering human health and life, as well as having a variety of indirect effects on society and the economy, such as weakening a country's economic growth potential by reducing people's working hours and lowering agricultural production (Narita et al., 2019). In 2017, Exposure to PM2.5 resulted in 4.58 million deaths and 142.52 million years of disability worldwide, with ambient PM2.5 accounting for 64.2 percent of fatalities and 58.3 percent of disability-adjusted life years (Bu et al., 2021). Chronic exposure to PM2.5 has been linked to respiratory diseases, heart disease, stroke, brain, and lung cancer (Cao et al., 2011; Du et al., 2015; Fold et al., 2020; Sakunkoo et al., 2022; Pope Iii et al., 2002). PM10 and PM2.5 majority include road traffic, biomass and waste open burning and industrial area (Fang et al., 2013; Li et al., 2021a; Tobler et al., 2020; Wang et al., 2020), construction of buildings and demolition (Yan et al., 2019), crop residue burning (Yang et al., 2008), and informal electric-waste recycling site (Zheng et al., 2016). PM contains a mixture of a chemical component, which can be produced from primary sources or formed by complex atmospheric reactions. (Wang et al., 2020; Zhang et al., 2015). PM2.5 during 2016-2019 in Bangkok, 24-h Thailand Ambient Air Quality Standards (TNAAQs) a dose of 50 μg/m3 was exceeded for about 50 days/years and a maximum daily concentration of more than 100 μg/m3 was observed during the dry season. (November to April) (Fold et al., 2020). Previous conducted study PM episode, Ji County in Tianjin, China by Zhou et al. (2015) has reported health impact with a relative risk (RR) were 1.013 (CI 1.0074–1.019) for all-cause mortality per 10 μg/m3 increase in PM2.5. Therefore, chronic exposure to PM2.5 is known to produce excessive exposure to the alveolar angiotensin-converting enzyme 2 (ACE-2) receptor, which may promote infection or toxicity in those exposed to air pollution (Domingo et al., 2020), especially, as long-term exposure to ambient PM2.5 is linked to increased morbidity and premature death in epidemiological studies (Pope and Dockery, 2006; Tobler et al., 2020; Zhu et al., 2019). Dockery and Pope (1994) reported that the increase in mortality and morbidity in urban areas may be associated with exposure to particulate matter (PM). The potential for adverse health effects from PM varies in particle size, composition, toxicity, and degree of exposure. In addition, the hospitalization rate for chronic obstructive pulmonary disease (COPD) increased by 6.88%, and the total number of hospital, patient, and asthma emergency rooms increased by 0.67%, 0.65%, and 0.49%, respectively of 10 μg/m3 for PM2.5 concentration (Duan et al., 2020; Xie et al., 2019).
Furthermore, the chemical compositions of PM2.5 include organic matter, trace elements, water-soluble inorganic ions, inorganic substance, sulfate, nitrate, and polycyclic aromatic hydrocarbons (PAHs) and others (Chen et al., 2021; Cheng et al., 2015; Fan et al., 2021; Jiang et al., 2018; Sajjadi et al., 2018; Zhang et al., 2021). In particular, a small fraction of particulate matter with aerodynamic equivalent diameter ≤2.5 μm constitutes heavy metals, and is highly toxic even at low concentrations, levels such as Cr, Cd, As, Pb, and Ni (Baensch-Baltruschat et al., 2020; Nirmalkar et al., 2021). A recent study has exhibited that heavy metals attached in PM2.5, such as Pb, Cu, Ni, and Fe collected from high-traffic regions, have been shown in recent study to be capable of triggering a variety of respiratory and cardiovascular illnesses, even a low concentration level of metals in PM2.5 can be harmful to human health (Kastury et al., 2018; Moryani et al., 2020). Metal elements from natural sources such as soils/crustaceans are usually found in coarse particles, while fine particles are associated with anthropogenic sources (Ny and Lee, 2011; Shaltout et al., 2019). Heavy metals can distribute and accumulated in the environmental cycle, for example, surface soil (Han et al., 2021), groundwater (Varol and Tokatlı, 2022) and atmosphere (Li et al., 2021b; Moryani et al., 2020; Pongpiachan et al., 2017; Wu et al., 2019; Xu et al., 2020; Zheng et al., 2016; Zhi et al., 2021). Previous studies shown a linkage between PM2.5 exposure and toxic heavy metal components having negative adverse health effects (Liu et al., 2018; Zhang et al., 2015). Currently, several toxicological studies have pointed out that excessive exposure to heavy metals in PM2.5 could threaten on human health, causing respiratory and inflammation of lung, cardiovascular disease, heart disease, and cancer (Xie et al., 2020; Xu et al., 2020; Zhang et al., 2021), specially, the heavy metals and organic pollutants adsorbed by PM2.5 were risk factors for lung cancer (Duan et al., 2020). Oral ingestion, inhalation, and dermal contact are the main routes of exposure to airborne heavy metals in PM2.5 (Hu et al., 2012; MohseniBandpi et al., 2018; Wang et al., 2020; Zhang et al., 2021), and are they are easily absorbed by the human body's alveolar, blood, cutaneous, and gastrointestinal systems (Cao et al., 2012; Imani, 2021). Undoubtedly, the study results show the possibility that adverse health effects are associated with particulate matter exposure bound to toxic heavy metals. To date, the chemical characterization, human health risk assessment, and source apportionment of PM2.5-bound heavy metals have been widely studied (Chen et al., 2021; Li et al., 2021b; Zhang et al., 2021).
Data from the Pollution Control Department (PCD) air quality monitoring system showed that the provinces with the most frequent detections of air quality exceeding the standard more than 70 days per year such as Saraburi, Lampang, Khon Kaen, Phrae, Phayao, Nan, Chiang Mai, Chiang Rai, Tak and Mae Hong Son (PCD, 2020). Khon Kaen Province is one of the agriculture, urban and industrial areas that have been rapidly growing in Northeast Thailand due to urban development; rapid industrial economy expansion has resulted in the continued increase of many transport systems to meet human needs. This information, is therefore, an important highlight the researcher to choose to study in such areas. While studies on heavy metal concentrations in PM2.5 in Thailand have been conducted in the past, they have been limited due to scarce data, especially on the country's regional aspect. Understanding the levels of particulate matter in the air have important public health consequences considering the increasing trend of air pollution. Hence, this study aims to examine the human health risk assessment of PM2.5-bound heavy metal of anthropogenic sources in Khon Kaen Province of Northeast Thailand. The data of this study will help support policies and future control measures in reducing pollutant emission from anthropogenic activities while also communicating health risks and surveillance to develop a further plan in the short and long-term to minimize adverse effects on human health.
2. Materials and methods
2.1. Study area
Due to the topography of Khon Kaen Province (KKP), most of the plateaus and low mountains; the weather is quite hot in the summer and the weather is quite cold in winter. The average temperature throughout the year is about 26.9 °C and the average annual rainfall 1,246.8 mm. The KKP covers an area of approximately 10,885.9 km2 and is approximately 449 km from Bangkok. Therefore, sampling site is in Khon Kaen Province, one of the largest urban development, agricultural activities, and industries in the north-eastern part. In this study, the following locations for ambient air samples were collected: The study site in Muang Khon Kaen is 16°26′ north latitude and 102°50′ east longitude (166 m above of mean sea level) is represented by urban area (includes university, and residential), and industrial zone and covering an area of 953.4 km2 and agricultural areas in Ban Haet District (BHD) and covering an area of 205.2 km2. The location of BHD is 16°12′ north latitude and 102°45′ east longitude at 189 m above of mean sea level (Fig. 1). The pattern of land use in KKP has shifted drastically over the past few decades. The Thai Meteorological Department (TMD, 2015, 2020) has divided the climate into three seasons: local summer (mid–February to mid–May), the rainy season (mid–May to mid–October), and the winter season (mid–October to mid–February). The KKP is the country's largest urban development region and the industry has accelerated environmental concerns. This is because the region is facing air pollution issue for nowadays; in particular, Khon Kaen is one of the provinces in north-eastern, Thailand faces a high level of seasonal air pollution every year. The community dwellers are exposed to outdoor air pollutants 24 h a day during seasonal smog periods because of their open-air housing style, and agricultural occupational hazards.
Figure 1.

Map of location of sampling site; the boundary line of this study area is Khon Kaen Province of Northeast Thailand.
2.2. Sampling collection and analysis
The PM2.5 samples were collected from ambient 24 h air sample collection during December 2020 and February 2021 period (dry season) using a high-volume air sampler (model ECO-HVS3000, Ecotech, Australia) was used with a flow rate of 67.8 m3/h, at 1.50 m above ground level. After sampling, each glass fiber (GF) filter was used to adjust the filter paper before and after collecting samples by putting it in a desiccator not less than 24 h. Inside the desiccator, silica gel was placed at the bottom. These samples are then stored in the refrigerator at a temperature of −30 °C. During the previous treatment procedures, each load filter was cut and placed in a Teflon vessel, and 5 mL of HNO3, 2 mL of HF, and 1 mL of H2O2 were added; later, the collected PM2.5 was wet and digested by ultrasonic-assisted digested (model TRANSSONIC 700/H). After cooling, these solutions were diluted to 5 mL with 5% HNO3 for use in subsequent metal analysis. In this study, seven trace elements (Pb, Cu, Cd, Fe, Mn, Al, and Zn) were measured by Graphite furnace atomic absorption spectroscopy (GFAAS) (model PinAAcle900Z, Perkin Elmer). PM2.5 sampling and analysis methods, as well as quality assurance and quality control measures, were in line with the PM2.5 component manual established by Chow et al. (1998) and Sugita et al. (2019).
2.3. Statistical analysis and model calculation
2.3.1. Enrichment factor (EF)
Enrichment factor (EF) was used to assess the level of heavy metal contamination in atmospheric particles and method facilitated the separation of heavy metal contribution between natural and anthropogenic origin. The EF by Zhang et al. (2021) where calculation is expressed as follows:
| (1) |
where and denote the concentration levels of i metal and the iron metal in the sample and crust. Fe was selected as the most common reference in this study (Pongpiachan et al., 2017) and the abundance of the elements' concentration of seven metals in the continental crust (in mg/kg) were obtained from (Lide, 2004). EF values are classified into five levels based on the influence of human activities (Yongming et al., 2006), were not influenced by human activities (EF < 2), moderately influenced (EF 2–5), highly influenced (EF 5–20), highly influenced (EF 20–40), and were severely influenced (EF > 40), respectively.
2.3.2. Geo-accumulation index ()
The geo-accumulation index () was used to assess the level of heavy metal contamination by comparing the current concentration with rear levels. The calculation of index was done by Zhang et al. (2021) using Eq. (2)
| (2) |
where and represent the concentrated level of the i metal in the sample and background, respectively. The factor of 1.5 was applied as a background adjustment matrix for evolutionary and anthropogenic effects (Li et al., 2015). In this study the geological heavy metal deposition index. The geo-accumulation index; Igeo was classified into six levels of contamination according to the study guideline of Murari et al. (2020): Level 1: ≤ 0 (Uncontaminated), Level 2: 0–1 (Uncontaminated to Moderately contaminated), Level 3: 1–2 (Moderately contaminated), Level 3: 2–3 (Moderately to strongly contaminated), Level 4: 3–4 (Strongly contaminated), Level 5: 4–5 (Strongly to extremely contaminated), and Level 6: > 5 (Extremely contaminated), respectively.
2.3.3. Human health risk assessment (HHRAs)
The subjects were divided into two groups viz., Children and Adults based on the differences in their respiratory systems and behaviors. (Dahmardeh Behrooz et al., 2021; Hu et al., 2012). Exposure assessment is a measurement process and refers to the time when people are exposed to substances in the environment or future exposure forecast. The values used for all the parameters in health risk assessment (HRA) as illustrated in Table 1.
Table 1.
The values used for all the parameters in health risk assessment (HRA).
| Factors | Notation | Unit | Value |
Reference | |||
|---|---|---|---|---|---|---|---|
| Children | Adults | ||||||
| Ingestion rate | IRing | mg/day | 200 | 100 | (Zhang et al., 2021) | ||
| Exposure frequency | EF | days/years | 365 | 365 | (Asante-Duah, 2017) | ||
| Exposure duration | ED | year | 6 | 24 | (Han et al., 2021; Zhang et al., 2021) | ||
| Unit conversion factor | CF | kg/mg | 1.0 × 10⁻⁶ | 1.0 × 10⁻⁶ | |||
| Inhalation rate | IRinh | m3/day | 5 | 20 | (Du et al., 2013) | ||
| Body weight | BW | kg | 29 | 70 | (Han et al., 2021; Zhang et al., 2021) | ||
| Average lifetime | AT | days | ED×365 (non-carcinogens) | ED×365 (non-carcinogens) | |||
| 70×365 (Carcinogens) | 70×365 (Carcinogens) | ||||||
| Exposure time | ET | h/day | 24 | 24 | (Zhang et al., 2021) | ||
| Average lifetime(n) | Atn | hours | ED×365×24 (non-carcinogens) | ED×365×24 (non-carcinogens) | |||
| 70×365×24 (Carcinogens) | 70×365×24 (Carcinogens) | ||||||
| Skin surface area | SA | cm2 | 2800 | 5700 | (Zhang et al., 2021) | ||
| Skin adherence factor | AF | mg/cm2 | 0.2 | 0.07 | (Zhang et al., 2021) | ||
| Dermal absorption factor | DAF | (Zhang et al., 2021) | |||||
| DAF(Pb) | 0.1 | 0.1 | |||||
| DAF(Cd) | 0.001 | 0.001 | |||||
| DAF(Cu) | 0.01 | 0.01 | |||||
| DAF(Mn) | 0.01 | 0.01 | |||||
| DAF(Zn) | 0.01 | 0.01 | |||||
| DAF(Al) | 0.01 | 0.01 | |||||
| DAF(Other metals) | 0.01 | 0.01 | |||||
| Parameter | Pb | Cd | Cu | Mn | Zn | Al | |
| Tr | 5 | 5 | 1 | (Zhang et al., 2021) | |||
| RfDoral | 0.003500 | 0.000500 | 0.004000 | 0.140000 | 0.300000 | 1.000000 | (Asante-Duah, 2017; Han et al., 2021; Zhang et al., 2021) |
| RfCinh | 0.003520 | 0.000010 | 0.004020 | 0.000050 | 0.301000 | 0.005000 | (Asante-Duah, 2017; Han et al., 2021; Zhang et al., 2021) |
| GIABS | 1 | 1 | 1 | (Zhang et al., 2021) | |||
| SForal | 0.008500 | – | – | (Zhang et al., 2021) | |||
| Inhalation UR (IUR) | 0.000012 | 0.001800 | (Asante-Duah, 2017; Zhang et al., 2021) | ||||
Thus, the daily intake of the chemical through oral ingestion (, mg/kg/day, exposure concentration through inhalation (, μg/m3), and skin absorption dose through dermal contact (, mg/kg/day) by Zhang et al., 2021 and USEPA, 2014 were calculated using the Eqs. (3)–(5) below:
| (3) |
| (4) |
| (5) |
The corresponding hazard quotient (HQ) was calculated as shown in Eqs. (6)–(9) and the carcinogenic risk (CR) of toxic metals through the three ways were further evaluated based on Eqs. (10)–(13).
| (6) |
| (7) |
| (8) |
| (9) |
| (10) |
| (11) |
| (12) |
| (13) |
RfDo, (the oral reference doses (mg/kg/day)), RfCi, (inhalation reference concentration (mg/m3)), ABSGI, (gastrointestinal absorption factor), SFo, (oral slope factor (mg/kg/day)) and IUR (inhalation unit risk (μg/m3). A hazard index (HI), i.e., HQ all added up, is used for assessing the chronic effects of non-carcinogenic risks. When both HQs ≤ 1.0 and HI ≤ 1.0, there is no significant risk of chronic effects. By contrast, HQs > 1 or HI > 1 indicate a possibility of the occurrence of chronic effects (Murari et al., 2020; Zheng et al., 2010). The carcinogen risk (CR) value shows the chance of developing any type of cancer by an individual due to a lifetime exposure to carcinogenic metals, divided into five categories: as very low (CR ≤ 10−6), low (10−6 ≤ CR < 10−4), moderate (10−4 ≤ CR < 10−3), high (10−3 ≤ CR < 10−1), and very high (CR ≥ 10−1) (Roy et al., 2019; Zhang et al., 2021).
3. Results and discussion
3.1. Mass concentration of PM2.5 in the typical anthropogenic sources
In this study, PM2.5 sampling was done during the dry season to analyze the heavy metal composition of PM2.5 in four human activities areas: University area, residential area, industrial zone, and agricultural zone found that in all sampling areas, the concentration of PM2.5 in the atmosphere exceeds the standards set by the World Health Organization (WHO) (WHO, 2006), which must not exceed 25 μg/m3 and Pollution Control Department (PCD) of Thailand 50 μg/m3 for 24 h (PCD, 2020), respectively. The areas with the geometric mean concentration (μg/m3, 95% CI) of PM2.5 were residential area at 50.25 μg/m3 (95%CI 38.97–64.78), followed by industrial zone, university area, and agriculture zone at 44.48 μg/m3 (95%CI 35.06–56.42), 32.78 μg/m3 (95%CI 26.56–40.46), and 29.53 μg/m3 (95%CI 23.62–36.91), respectively, as shown in Table 2. A majority of emissions were from automobiles at traffic sights with 32% and burning of biomass with 26% (Chuersuwan et al., 2008). Biomass burning emerged as the primary source of PM2.5 mass concentrations at residential sites, for example, an issue of cross-border smog due to sampling periods (Chuersuwan et al., 2008). It is in the dry season and is influenced by the northeast monsoon that blows dust from neighboring areas and neighboring countries and meteorological factors. The mean concentration of PM2.5 of all sampling sites that exceeded the WHO (2006), which must not exceed 25 μg/m3. While three of the four sampling sites that mean concentration were below the Pollution Control Department (PCD) of Thailand 50 μg/m3 for 24 h, while PM2.5 concentrations in a residential area are above the PCD standard setting of Thailand.
Table 2.
Detailed of meteorological parameter and mass concentration of PM2.5.
| Sampling site | Meteorological parameter |
Concentration of PM2.5 |
|||
|---|---|---|---|---|---|
| Aver. Temperature (°C) | Aver. Relative humidity (%) | Aver. Wind speed (m/s) | Aver. Pressure (hPa) | Geometric mean (μg/m3, 95% CI) | |
| University area | 22.40 | 40 | 2.02 | 1008.8 | 32.78 (26.56–40.46) |
| Residential area | 24.34 | 50 | 2.73 | 1015.4 | 50.25 (38.97–64.78) |
| Industrial zone | 26.50 | 90 | 4.28 | 1006.1 | 44.48 (35.06–56.42) |
| Agricultural zone | 25.32 | 75 | 3.07 | 1020.3 | 29.53 (23.62–36.91) |
The majority of PM2.5 sources in Southeast Asia come from vehicular emissions, industrial pollution, and secondary aerosols as the dominating sources (Singh et al., 2017). Vehicular activities, industrial by-products, and re-suspension of crustal soil are the major factors contributed by anthropogenic activities of the emission of particulate pollutants within the environment (Hazarika and Srivastava, 2017a; Hazarika et al., 2017b; Tian et al., 2010). Additionally, Northeast Thailand is an important region for sugarcane and rice production. Due to insufficient mechanical support, approximately 60% of the crops have to be burned before harvesting (Dejchanchaiwong et al., 2020). Yunesian et al. (2019) conducted a study in PM2.5 and PM10 in the metropolis of Tehran during 2016-2017, which was reportedly exposed to high levels and the associated health risks. Similarly, a study conducted in Chiang Mai, Northern Thailand has reported that the rate of chronic obstructive pulmonary disease increased by 7.2–8.9%, coronary artery disease by 8.6%, and sepsis specific causes of death were increased by 5.7–6.1%, for 10 μg/m3 increment of PM2.5 (Pothirat et al., 2021).
3.2. Heavy metals concentration in PM2.5
As shown in Table 3, sorted from the areas with the highest concentration of PM2.5 found that an industrial zone with heavy metal concentrations in PM2.5 in descending proportion are as follows: manganese (Mn) < aluminum (Al) < lead (Pb) < copper (Cu) < cadmium (Cd) < iron (Fe) < Zinc (Zn), residential area (Al < Mn < Pb < Cu < Cd < Fe < Zn), university area (Mn < Al < Pb < Cu < Cd < Fe < Zn), and agricultural area (Mn < Al < Cu < Pb < Fe < (Cd = Zn), as shown in Table 3.
Table 3.
Geometric mean concentration (GMC) of trace element in PM2.5 during December 2020 to February 2021 in Khon Kaen Province.
| Sampling site | GMC of trace element (μg/m3, 95% CI) |
||||||
|---|---|---|---|---|---|---|---|
| Pb | Cd | Cu | Mn | Zn | Al | Fe | |
| 0.0754 | 0.0111 | 0.0338 | 0.2847 | 0.0012 | 0.1668 | 0.0047 | |
| University area | (0.0228–0.2498) | (0.0043–0.0284) | (0.0262–0.0436) | (0.2317–0.3500) | (0.0004–0.0036) | (0.1414–0.1967) | (0.0025–0.0085) |
| 0.2099 | 0.0195 | 0.0573 | 0.4279 | 0.0006 | 0.3381 | 0.0059 | |
| Residential area | (0.1345–0.3277) | (0.0150–0.0253) | (0.0220–0.1491) | (0.3497–0.5235) | (0.0004–0.0011) | (0.2107–0.5425) | (0.0038–0.0093) |
| 0.2729 | 0.1011 | 0.1857 | 2.2960 | 0.0044 | 1.7482 | 0.0045 | |
| Industrial zone | (0.2190–0.3410) | (0.0793–0.1290) | (0.1674–0.2061) | (1.9728–2.6721) | (0.0020–0.0095) | (1.4448–2.1154) | (0.0034–0.0060) |
| 0.0239 | 0.0035 | 0.1036 | 0.2477 | 0.0105 | 0.1760 | 0.0040 | |
| Agricultural zone | (0.0089–0.0639) | (0.0020–0.0060) | (0.0357–0.3009) | (0.2149–0.2854) | (0.0029–0.0372) | (0.1387–0.2234) | (0.0022–0.0072) |
Pb, Cd, Mn, and Cu were found to be the most relevant trace metals in the period study and it has been sufficiently recognized that they are traced in traffic emissions (Rodríguez et al., 2020; Zhang et al., 2009); Mn is identified as tracers of dust or soil. The proportion of heavy metals in PM2.5 each human activities as shown in Fig. 2. Rodríguez et al. (2020) described the origin of the measured metals as practical, from human-caused sources such as traffic emissions, fuel oil combustion, or even re-suspended particulate matter and dust storms events (Amarloei et al., 2020). For instance, some major elements connected with PM2.5 measured in this study (Pb, Cd, Cu, or Mn), are found to be emissions from debris of wearing of tyres and old's automobile combustion systems (Adachi and Tainosho, 2004). Additionally, Kayee et al. (2020) has showed that an important source of Pb and other trace metals in the Chiang Rai aerosol in Northern Thailand were metals that were released from burning of biomass and the crustal dust formed from raging fire. Based on these comparisons, it may be decided that the PM2.5 concentrations of metals primarily depend on the topology, meteorological factors such as wind speed, pressure, and the sampling site, which, consecutively, relies on the effects of sources of metal emissions nearby power plant, traffic transportation, and biomass and waste open burning. This study would help improve our understanding of anthropogenic activities over Khon Kaen and the significance of linking such atmospheric studies with meteorological parameters.
Figure 2.
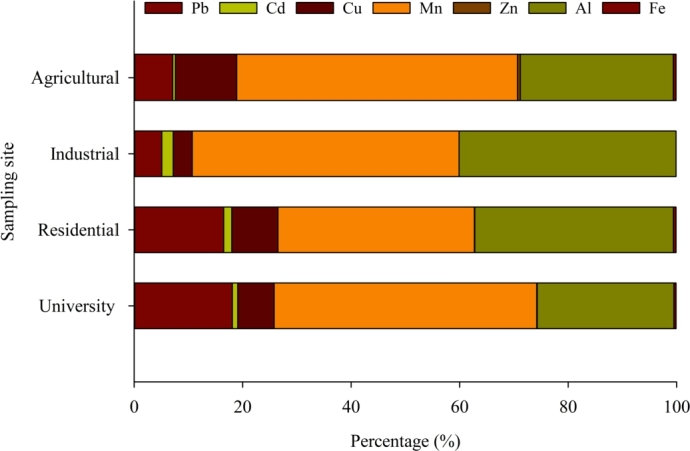
The proportion of PM2.5-bound metal in the human activities' sources during dry season in Khon Kaen Provice, Thailand.
3.3. Environmental risk
Comprehensive anthropogenic metal risk assessments can provide valuable information for risk management at sampling sites, which are less valuable for natural-sourced metals. Fig. 3 shows a Pb, Cd, Cu, and Mn being identified as human-caused metals with an EF greater than 10 (Fig. 3a), while an Igeo greater than 0 was found only with Cd as shown in Fig. 3(b) as shown in Fig. 3.
Figure 3.

Enrichment factors (a) and Geo-accumulation indexes (b) of seven metals in PM2.5.
A study conducted by Wu et al. (2019) found that augmented factors of heavy metals (Cd and Pb) in PM2.5 were mainly from anthropogenic sources. Therefore, the variation of EF source contributions should be influenced by meteorological factors and environmental conditions (Chen et al., 2021). Furthermore, agricultural emissions of Cd and Pb in the ago-ecosystem have been shown to have a source harmful impact and can cause various long-term health issues (Pongpiachan et al., 2017). Thus, the following analysis of the human health risk assessment focuses mainly on the four metals. The findings of this study are based on the comparison of emissions from sources of human activities. However, the most important control measures must be taken into consideration, especially the air quality in which people live in the sampling area or nearby.
3.4. Human health risk assessment of heavy metal's exposure in PM2.5
Heavy metals are considered pollutants to humans as well as the environment. Therefore, this study also focuses on two heavy metals (Cd and Pb) has been proven to be hazardous to human health (Briffa et al., 2020; Tchounwou et al., 2012). Considering that Cd is classified as a Group 1 (carcinogenic), while Pb is classified as a Group 2A (probably carcinogenic). The health risk values are overestimated as the health risk assessment was conducted using total heavy metal concentration. The appropriate heavy metal form to be used is the bioavailability form to be applied in HRA (Praveena et al., 2015; Zheng et al., 2020). Hence, these heavy metal data were used for the carcinogenic risk assessments among humans as shown in detail below
3.4.1. Non-carcinogenic risks
The risk to human health in the urban area (residential and university), industrial zone, and agricultural zone of Khon Kaen Province, Northeast Thailand through various ways of exposure merits investigations and surveillance. Furthermore, Table 4 illustrates the six anthropogenic metals that cause health risks in children and adults. The following order was used: Pb, Cd, Cu, Mn, Zn, and Al, to study contributions in urban areas (university, and residential), and industrial zone and agricultural zone with the total HI value of >1.0 for these four sampling sites which demonstrated the total non-carcinogenic risk exceeded the safe level revealed, the potential health risk is quite high for Cd and Pb that the integrated effects of multi-metal exposure in the urban area (university, and residential), industrial, and agricultural of sampling sites, might result in severe non-carcinogenic risk. The results of this study found that HI was at a level that was at risk for chronic health effects. In line with the findings of Pongpiachan et al. (2017), metal studies in PM2.5 in Bangkok from 17 November to 30 April 2011 found that the HI values of Cu, Zn, Cd, and Pb were at safe levels. Corresponding to the study, PM2.5-bound heavy metal in the urban area of Kitayushu, Japan reported the total of heavy metals with a corresponding HI of 7.8 and mainly comprising ingestion exposure pathways followed by dermal contact, and inhalation for adults and among children, the route of entry into the body is through ingestion, inhalation, and dermal contact (Zhang et al., 2021). As per this study, HIing, HIinh, and HIder, indicated that the primary source of exposure was inhalation, followed by ingestion and contact through skin. In addition, researchers discovered that exposure to urban traffic-related air pollution had genotoxic effects on children in Malaysia's Klang Valley (Hisamuddin et al., 2020). Therefore, it is important to put in place a long-term plan to reduce the levels of Cd and Pb in urban dust, by promoting the use of electric vehicles, cycles and encouraging citizens to use public transportation (Pongpiachan et al., 2017), and conducting further research on the sources of air pollution and steps to control air pollution, such as open burning and waste incineration facilities.
Table 4.
Summary of estimation human health risk for children and adults due to exposure of heavy metals for non-carcinogenic risk.
| Sampling site | Group | Non-carcinogenic risk* |
||||||
|---|---|---|---|---|---|---|---|---|
| CDIing | ECinh | DADder | HQing | HQinh | HQder | HI | ||
| University area | Children | 3.9 × 10⁻⁶ | 2.2 × 10⁻¹ | 2.4 × 10⁻⁷ | 0.00 | 2.61 | 0.00 | 2.61 |
| Adults | 8.2 × 10⁻⁷ | 1.6 × 10⁻¹ | 7.1 × 10⁻⁸ | 0.00 | 1.95 | 0.05 | 2.00 | |
| Residential area | Children | 8.5 × 10⁻⁶ | 4.7 × 10⁻¹ | 5.7 × 10⁻⁷ | 0.00 | 10.73 | 0.00 | 10.73 |
| Adults | 1.7 × 10⁻⁶ | 3.5 × 10⁻¹ | 1.7 × 10⁻⁷ | 0.00 | 8.02 | 0.00 | 8.02 | |
| Industrial zone | Children | 3.2 × 10⁻⁵ | 0.17 × 101 | 1.3 × 10⁻⁶ | 0.00 | 21.51 | 0.00 | 21.51 |
| Adults | 6.6 × 10⁻⁶ | 0.13 × 101 | 1.6 × 10⁻⁶ | 0.00 | 2.92 | 0.00 | 2.92 | |
| Agricultural zone | Children | 2.7 × 10⁻⁶ | 2.1 × 10⁻¹ | 1.1 × 10⁻⁶ | 0.00 | 1.90 | 0.00 | 1.90 |
| Adults | 8.1 × 10⁻⁷ | 1.6 × 10⁻¹ | 3.2 × 10⁻⁷ | 0.00 | 1.53 | 0.00 | 1.53 | |
Total of metal includes Pb, Cd, Cu, Mn, Zn, and Al for exposure and health risk assessment.
3.4.2. Carcinogenic risks
In addition, Pb and Cd were carcinogens among two heavy metals. The CR values of Pb among children in university, residential, industrial, and agricultural were 1.00 × 10⁻⁸, 1.71 × 10⁻⁸, 2.22 × 10⁻⁶, and 1.95 × 10⁻⁷, respectively, and Cd where the CR values were 3.34 × 10⁻², 0.23 × 101, 0.12 × 101, and 4.11 × 10⁻², respectively. In this study, the risk of above the safe level i.e. ≥ 10−1, revealed a high level of carcinogenic risk for children living in the urban area (residential) and industrial zone while the results that high carcinogenic risk (10−3 ≤ CR < 10−1) (Roy et al., 2019; Zhang et al., 2021) for the urban area (university) and agricultural area. As compared with adults, the CR values of Pb among children in university, residential, industrial, and agricultural were 4.00 × 10⁻⁹, 5.00 × 10⁻⁷, 6.48 × 10⁻⁷, and 5.70 × 10⁻⁸, respectively, and Cd where the CR values were 8.10 × 10⁻⁸, 4.40 × 10⁻¹, 2.28 × 10⁻¹, and 7.70 × 10⁻³, respectively. However, the risk level in this study above the safe level 10−3 ≤ CR < 10−1, revealed a higher risk of carcinogenic for adults living in urban areas (residential and industrial), and agricultural zone exempt in university area the results that very low carcinogenic risk (CR ≤ 10−6) (Roy et al., 2019; Zhang et al., 2021). In total, the combined carcinogenic risk for children and adults' (university, residential, industrial, and agricultural) was also above the acceptable limits, it was found that the Cd of carcinogenic risk obtained was high than the ceiling value of 10−6, which is significant based on the USEPA standards; it becomes evident to conclude that Cd increases the lifetime cancer risk; except for adults living in university areas, the levels were very low for carcinogenic risk. In addition, they comprise the majority of exposure dose assessments among children and adults were CRing, CRder, and CRing (Table 5). Based on the results of the health risk assessment, it is evident that in the urban area (such as university, residential), industrial zone, and rural agricultural of Khon Kaen Province, Thailand, exposure to PM2.5 could significantly influence the environmental risks. Furthermore, children's health is at higher non-carcinogenic and carcinogenic risk than adults. Additionally, Pb, Cd, Cu, Mn, Zn, and Al were found to be in abundance. As a result, when PM2.5-bound heavy metals are introduced into the body, particularly through the respiratory system, they encourage and induce health problems.
Table 5.
Summary of estimation human health risk for children and adults due to exposure of heavy metals for carcinogenic risk.
| Sampling site | Group | Metal | Carcinogenic risk |
||||||
|---|---|---|---|---|---|---|---|---|---|
| CDIing | ECinh | DADder | CRing | CRinh | CRder | CR | |||
| University area | Children | Pb | 7.43 × 10⁻⁹ | 4.10 × 10⁻⁴ | 2.08 × 10⁻⁹ | 0.00 | 5.00 × 10⁻⁹ | 2.00 × 10⁻⁹ | 1.00 × 10⁻⁸ |
| Cd | 1.09 × 10⁻⁹ | 6.02 × 10⁻⁵ | 3.05 × 10⁻¹² | 3.34 × 10⁻² | 3.34 × 10⁻² | ||||
| Cu | 3.33 × 10⁻⁹ | 1.84 × 10⁻⁴ | 9.33 × 10⁻¹¹ | ||||||
| Mn | 2.80 × 10⁻⁸ | 1.55 × 10⁻³ | 7.85 × 10⁻¹⁰ | ||||||
| Zn | 8.62 × 10⁻¹¹ | 4.76 × 10⁻⁶ | 2.41 × 10⁻¹² | ||||||
| Al | 1.64 × 10⁻⁸ | 9.07 × 10⁻⁴ | 4.60 × 10⁻¹⁰ | ||||||
| SUM | 1.00 × 10⁻⁷ | 3.11 × 10⁻³ | 3.42 × 10⁻⁹ | 0.00 | 3.34 × 10⁻² | 2.00 × 10⁻⁹ | 3.34 × 10 | ||
| Adults | Pb | 1.54 × 10⁻⁹ | 3.06 × 10⁻⁴ | 6.14 × 10⁻¹⁰ | 0.00 | 4.00 × 10⁻⁹ | 1.00 × 10⁻⁹ | 4.00 × 10⁻⁹ | |
| Cd | 2.26 × 10⁻¹⁰ | 4.50 × 10⁻⁵ | 9.01 × 10⁻¹³ | 8.10 × 10⁻⁸ | 8.10 × 10⁻⁸ | ||||
| Cu | 6.90 × 10⁻¹⁰ | 1.37 × 10⁻⁴ | 2.75 × 10⁻¹¹ | ||||||
| Mn | 5.81 × 10⁻⁹ | 1.16 × 10⁻³ | 2.32 × 10⁻¹⁰ | ||||||
| Zn | 1.78 × 10⁻¹¹ | 3.56 × 10⁻⁶ | 7.12 × 10⁻¹³ | ||||||
| Al | 3.40 × 10⁻⁹ | 6.78 × 10⁻⁴ | 1.36 × 10⁻¹⁰ | ||||||
| SUM | 1.17 × 10⁻⁸ | 2.32 × 10⁻³ | 1.01 × 10⁻⁹ | 0.00 | 8.50 × 10⁻⁸ | 1.00 × 10⁻⁹ | 8.5 × 10 | ||
| Residential area | Children | Pb | 9.99 × 10⁻⁸ | 4.57 × 10⁻³ | 5.79 × 10⁻⁹ | 1.00 × 10⁻⁹ | 5.50 × 10⁻⁸ | 1.65 × 10⁻⁶ | 1.71 × 10⁻⁸ |
| Cd | 9.27 × 10⁻⁸ | 4.23 × 10⁻³ | 5.37 × 10⁻¹¹ | 0.23 × 101 | 0.23 × 101 | ||||
| Cu | 2.73 × 10⁻⁸ | 1.25 × 10⁻³ | 1.58 × 10⁻¹⁰ | ||||||
| Mn | 2.04 × 10⁻⁷ | 9.31 × 10⁻³ | 1.18 × 10⁻⁹ | ||||||
| Zn | 3.02 × 10⁻¹⁰ | 1.38 × 10⁻⁵ | 1.75 × 10⁻¹² | ||||||
| Al | 1.61 × 10⁻⁷ | 7.35 × 10⁻³ | 9.32 × 10⁻¹⁰ | ||||||
| SUM | 5.85 × 10⁻⁷ | 2.67 × 10⁻² | 8.12 × 10⁻⁹ | 1.00 × 10⁻⁹ | 0.23 × 101 | 1.65 × 10⁻⁶ | 0.23 × 101 | ||
| Adults | Pb | 1.71 × 10⁻⁸ | 8.53 × 10⁻⁴ | 1.71 × 10⁻⁹ | 0.00 | 1.00 × 10⁻⁸ | 4.88 × 10⁻⁷ | 5.00 × 10⁻⁷ | |
| Cd | 1.59 × 10⁻⁸ | 7.92 × 10⁻⁴ | 1.59 × 10⁻¹¹ | 4.40 × 10⁻¹ | 4.40 × 10⁻¹ | ||||
| Cu | 4.68 × 10⁻⁹ | 2.33 × 10⁻⁴ | 4.67 × 10⁻¹¹ | ||||||
| Mn | 3.50 × 10⁻⁸ | 1.74 × 10⁻³ | 3.48 × 10⁻¹⁰ | ||||||
| Zn | 5.17 × 10⁻¹¹ | 2.57 × 10⁻⁶ | 5.16 × 10⁻¹³ | ||||||
| Al | 2.76 × 10⁻⁸ | 1.37 × 10⁻³ | 2.75 × 10⁻¹⁰ | ||||||
| SUM | 1.00 × 10⁻⁷ | 5.00 × 10⁻³ | 2.40 × 10⁻⁹ | 0.00 | 4.40 × 10⁻¹ | 4.88 × 10⁻⁷ | 4.40 × 10 | ||
| Industrial zone | Children | Pb | 2.69 × 10⁻⁸ | 5.94 × 10⁻³ | 7.53 × 10⁻⁹ | 0.00 | 7.10 × 10⁻⁸ | 2.15 × 10⁻⁶ | 2.22 × 10⁻⁶ |
| Cd | 9.96 × 10⁻⁹ | 2.20 × 10⁻³ | 2.79 × 10⁻¹¹ | 0.12 × 101 | 0.12 × 101 | ||||
| Cu | 1.83 × 10⁻⁸ | 4.04 × 10⁻³ | 5.12 × 10⁻¹¹ | ||||||
| Mn | 2.26 × 10⁻⁷ | 5.00 × 10⁻² | 6.33 × 10⁻⁹ | ||||||
| Zn | 4.32 × 10⁻¹⁰ | 9.55 × 10⁻⁵ | 1.21 × 10⁻¹¹ | ||||||
| Al | 1.72 × 10⁻⁷ | 3.80 × 10⁻² | 4.82 × 10⁻⁹ | ||||||
| SUM | 4.54 × 10⁻⁷ | 1.00 × 10⁻¹ | 1.88 × 10⁻⁸ | 0.00 | 0.12 × 101 | 2.15 × 10⁻⁶ | 0.12 × 101 | ||
| Adults | Pb | 2.23 × 10⁻⁸ | 1.11 × 10⁻³ | 2.22 × 10⁻⁹ | 0.00 | 1.30 × 10⁻⁸ | 6.35 × 10⁻⁷ | 6.48 × 10⁻⁷ | |
| Cd | 8.25 × 10⁻⁹ | 4.11 × 10⁻³ | 8.23 × 10⁻¹² | 2.28 × 10⁻¹ | 2.28 × 10⁻¹ | ||||
| Cu | 1.52 × 10⁻⁸ | 7.55 × 10⁻⁴ | 1.51 × 10⁻¹⁰ | ||||||
| Mn | 1.87 × 10⁻⁷ | 9.33 × 10⁻³ | 1.87 × 10⁻⁹ | ||||||
| Zn | 3.58 × 10⁻¹⁰ | 1.78 × 10⁻⁵ | 3.57 × 10⁻¹² | ||||||
| Al | 1.43 × 10⁻⁷ | 7.11 × 10⁻³ | 1.42 × 10⁻⁹ | ||||||
| SUM | 3.76 × 10⁻⁷ | 1.87 × 10⁻² | 5.68 × 10⁻⁹ | 0.00 | 2.28 × 10⁻¹ | 6.35 × 10⁻⁷ | 2.28 × 10 | ||
| Agricultural zone | Children | Pb | 2.35 × 10⁻⁹ | 5.20 × 10⁻⁴ | 6.59 × 10⁻¹⁰ | 0.00 | 6.00 × 10⁻⁹ | 1.88 × 10⁻⁷ | 1.95 × 10⁻⁷ |
| Cd | 3.36 × 10⁻¹⁰ | 7.41 × 10⁻⁵ | 9.40 × 10⁻¹³ | 4.11 × 10⁻² | 4.11 × 10⁻² | ||||
| Cu | 1.02 × 10⁻⁸ | 2.25 × 10⁻³ | 2.86 × 10⁻¹⁰ | ||||||
| Mn | 2.44 × 10⁻⁸ | 5.39 × 10⁻³ | 6.83 × 10⁻¹⁰ | ||||||
| Zn | 1.03 × 10⁻⁹ | 2.28 × 10⁻⁴ | 2.89 × 10⁻¹¹ | ||||||
| Al | 1.73 × 10⁻⁸ | 3.83 × 10⁻³ | 4.86 × 10⁻¹⁰ | ||||||
| SUM | 5.57 × 10⁻⁸ | 1.23 × 10⁻² | 2.14 × 10⁻⁹ | 0.00 | 4.11 × 10⁻² | 1.88 × 10⁻⁷ | 4.11 × 10 | ||
| Adults | Pb | 1.95 × 10⁻⁹ | 9.71 × 10⁻⁵ | 1.94 × 10⁻¹⁰ | 0.00 | 1.00 × 10⁻⁹ | 5.60 × 10⁻⁸ | 5.70 × 10⁻⁸ | |
| Cd | 2.78 × 10⁻¹⁰ | 1.38 × 10⁻⁵ | 2.77 × 10⁻¹¹ | 7.70 × 10⁻³ | 7.70 × 10⁻³ | ||||
| Cu | 8.46 × 10⁻⁹ | 4.21 × 10⁻⁴ | 8.43 × 10⁻¹⁰ | ||||||
| Mn | 2.02 × 10⁻⁸ | 1.01 × 10⁻³ | 2.02 × 10⁻⁹ | ||||||
| Zn | 8.54 × 10⁻¹⁰ | 4.25 × 10⁻⁵ | 8.52 × 10⁻¹¹ | ||||||
| Al | 1.44 × 10⁻⁸ | 7.16 × 10⁻⁴ | 1.43 × 10⁻⁹ | ||||||
| SUM | 4.61 × 10⁻⁸ | 2.30 × 10⁻³ | 4.60 × 10⁻⁹ | 0.00 | 7.70 × 10⁻³ | 5.60 × 10⁻⁸ | 7.70 × 10 | ||
4. Conclusions
In this study ambient air was collected between December 2020 and February 2021 (dry season) at a sampling site in the urban area (university and residential), industrial zone, and agricultural zone of Khon Kaen Province, Northeast Thailand. The heavy metals loaded in PM2.5 of 70% found the highest concentration in industrial areas, followed by residential, university, and agricultural areas at 15%, 9%, and 6%, respectively. In all the study areas, the EF values of heavy metals influenced by human activities in PM2.5 were Cd, Pb, Cu, Mn, Zn, Al, and Fe, respectively, while only one of Cd was found in industrial zones (biomass or waste incinerated plant) of four human activity sites at the level of uncontaminated to moderately contaminated. The results of this study found that only six heavy metals in PM2.5 showed severe non-carcinogenic risk; giving the probability of chronic effects among the children and adults. The contributions of the studied metals are in the following order: Pb, Cd, Cu, Mn, Zn, and Al in the university area, residential area and industrial zone, agricultural zone with the total HI value of >1.0. In addition, exposure to a total of heavy metals could cause high to very high carcinogenic risk for children among residential areas, and industrial zones with TCR values of 0.23 × 101, and 0.12 × 101, respectively, which resulted in a high carcinogenic risk in the 3.34 × 10⁻², and 4.11 × 10⁻² of the university and agricultural zone. Adults were found to be exposed to risks that were beyond the safe level 10−3 ≤ CR < 10−1, showing a high carcinogenic risk for adults living in the urban area (residential) and industrial zone, and agricultural zone exempt in university area the results that very low carcinogenic risk (CR ≤ 10−8). The most effective strategy to reduce the exposure risk to the PM2.5 seems to be through the inhalation route in children around and self-protection (considerations mask-wearing outdoors), especially in urban areas, industrial zones, and biomass and waste open burning. Further investigation of appropriate process and long-term monitoring for source identification is much needed.
Declarations
Author contribution statement
Pornpun Sakunkoo: Conceived and designed the experiments; Analyzed and interpreted the data; Contributed reagents, materials, analysis tools or data; Wrote the paper. Theerachai Thonglua: Performed the experiments; Analyzed and interpreted the data. Sarawut Sangkham: Conceived and designed the experiments; Performed the experiments; Analyzed and interpreted the data; Wrote the paper. Chananya Jirapornkul, Yuparat Limmongkon, Jetnapis Rayubkul, Sakesun Thongtip: Contributed reagents, materials, analysis tools or data. Naowarat Maneenin: Contributed reagents, materials, analysis tools or data; Wrote the paper. Sakda Daduang, Thanee Tessiri: Performed the experiments; Contributed reagents, materials, analysis tools or data. Sittichai Pimonsree: Analyzed and interpreted the data; Wrote the paper.
Funding statement
This research was supported by research program funding from Khon Kaen University (RP64007).
Data availability statement
The authors do not have permission to share data.
Declaration of interests statement
The authors declare no conflict of interest.
Additional information
Supplementary content related to this article has been published online at https://doi.org/10.1016/j.heliyon.2022.e09572.
No additional information is available for this paper.
Acknowledgements
We would like to thank the police officers at Muang Khon Kaen Provincial Police Station for facilitating us in collecting data. Express our sincere gratitude to the Faculty of Pharmaceutical Sciences, Khon Kaen University for the sample analysis and supporting research equipment. Finally, we would like to thank the Faculty of Public Health, Khon Kaen University for providing us with supporting tools and the laboratory. In addition, we are thankful to Occupational Health Safety and Environmental Epidemiology Group (OHSEE) for statistical counseling. We are also grateful to Dr. Patipat Vongruang, who is a specialist in geographic information systems (GIS), and provided design maps of the boundaries used in this study. The images and graphical summaries are created with the aid of resources from BioRender.com.
Contributor Information
Sarawut Sangkham, Email: sarawut.sa@up.ac.th.
Naowarat Maneenin, Email: naowtu@kku.ac.th.
Appendix A. Supplementary material
The following is the Supplementary material related to this article.
Estimation of human health risk for children and adults due to exposure of trace elements.
References
- Adachi K., Tainosho Y. Characterization of heavy metal particles embedded in tire dust. Environ. Int. 2004;30:1009–1017. doi: 10.1016/j.envint.2004.04.004. [DOI] [PubMed] [Google Scholar]
- Amarloei A., Fazlzadeh M., Jafari A.J., Zarei A., Mazloomi S. Particulate matters and bioaerosols during Middle East dust storms events in Ilam, Iran. Microchem. J. 2020;152 [Google Scholar]
- Asante-Duah K. Springer Netherlands; Dordrecht: 2017. Public Health Risk Assessment for Human Exposure to Chemicals. [Google Scholar]
- Baensch-Baltruschat B., Kocher B., Stock F., Reifferscheid G. Tyre and road wear particles (TRWP) - a review of generation, properties, emissions, human health risk, ecotoxicity, and fate in the environment. Sci. Total Environ. 2020;733 doi: 10.1016/j.scitotenv.2020.137823. [DOI] [PubMed] [Google Scholar]
- Briffa J., Sinagra E., Blundell R. Heavy metal pollution in the environment and their toxicological effects on humans. Heliyon. 2020;6 doi: 10.1016/j.heliyon.2020.e04691. [DOI] [PMC free article] [PubMed] [Google Scholar]
- Bu X., Xie Z., Liu J., Wei L., Wang X., Chen M., Ren H. Global PM2.5-attributable health burden from 1990 to 2017: estimates from the Global Burden of disease study 2017. Environ. Res. 2021;197 doi: 10.1016/j.envres.2021.111123. [DOI] [PubMed] [Google Scholar]
- Cao J., Yang C., Li J., Chen R., Chen B., Gu D., Kan H. Association between long- term exposure to outdoor air pollution and mortality in China: a cohort study. J. Hazard. Mater. 2011;186:1594–1600. doi: 10.1016/j.jhazmat.2010.12.036. [DOI] [PubMed] [Google Scholar]
- Cao Z.-G., Yu G., Chen Y.-S., Cao Q.-M., Fiedler H., Deng S.-B., Huang J., Wang B. Particle size: a missing factor in risk assessment of human exposure to toxic chemicals in settled indoor dust. Environ. Int. 2012;49:24–30. doi: 10.1016/j.envint.2012.08.010. [DOI] [PubMed] [Google Scholar]
- Chen C.-R., Lai H.-C., Liao M.-I., Hsiao M.-C., Ma H.-W. Health risk assessment of trace elements of ambient PM2.5 under monsoon patterns. Chemosphere. 2021;264 doi: 10.1016/j.chemosphere.2020.128462. [DOI] [PubMed] [Google Scholar]
- Cheng Y., Lee S., Gu Z., Ho K., Zhang Y., Huang Y., Chow J.C., Watson J.G., Cao J., Zhang R. PM2.5 and PM10-2.5 chemical composition and source apportionment near a Hong Kong roadway. Particuology. 2015;18:96–104. [Google Scholar]
- Chow J., Watson J., Frank N., Homolya J. 1998. Guideline on Speciated Particulate Monitoring. [Google Scholar]
- Chuersuwan N., Nimrat S., Lekphet S., Kerdkumrai T. Levels and major sources of PM2.5 and PM10 in Bangkok metropolitan region. Environ. Int. 2008;34:671–677. doi: 10.1016/j.envint.2007.12.018. [DOI] [PubMed] [Google Scholar]
- Dahmardeh Behrooz R., Kaskaoutis D.G., Grivas G., Mihalopoulos N. Human health risk assessment for toxic elements in the extreme ambient dust conditions observed in Sistan, Iran. Chemosphere. 2021;262 doi: 10.1016/j.chemosphere.2020.127835. [DOI] [PubMed] [Google Scholar]
- Dejchanchaiwong R., Tekasakul P., Tekasakul S., Phairuang W., Nim N., Sresawasd C., Thongboon K., Thongyen T., Suwattiga P. Impact of transport of fine and ultrafine particles from open biomass burning on air quality during 2019 Bangkok haze episode. J. Environ. Sci. 2020;97:149–161. doi: 10.1016/j.jes.2020.04.009. [DOI] [PubMed] [Google Scholar]
- Dockery D.W., Pope C.A. Acute respiratory effects of particulate air pollution. Annu. Rev. Public Health. 1994;15:107–132. doi: 10.1146/annurev.pu.15.050194.000543. [DOI] [PubMed] [Google Scholar]
- Domingo J.L., Marquès M., Rovira J. Influence of airborne transmission of SARS-CoV-2 on COVID-19 pandemic. A review. Environ. Res. 2020;188 doi: 10.1016/j.envres.2020.109861. [DOI] [PMC free article] [PubMed] [Google Scholar]
- Du Y., Gao B., Zhou H., Ju X., Hao H., Yin S. Health risk assessment of heavy metals in road dusts in urban parks of Beijing, China. Proc. Environ. Sci. 2013;18:299–309. [Google Scholar]
- Du Y., Xu X., Chu M., Guo Y., Wang J. Air particulate matter and cardiovascular disease: the epidemiological, biomedical and clinical evidence. J. Thorac. Dis. 2015;8:E8–E19. doi: 10.3978/j.issn.2072-1439.2015.11.37. [DOI] [PMC free article] [PubMed] [Google Scholar]
- Duan S., Zhang M., Sun Y., Fang Z., Wang H., Li S., Peng Y., Li J., Li J., Tian J., Yin H., Yao S., Zhang L. Mechanism of PM2.5-induced human bronchial epithelial cell toxicity in central China. J. Hazard. Mater. 2020;396 doi: 10.1016/j.jhazmat.2020.122747. [DOI] [PubMed] [Google Scholar]
- Fan M.-Y., Zhang Y.-L., Lin Y.-C., Cao F., Sun Y., Qiu Y., Xing G., Dao X., Fu P. Specific sources of health risks induced by metallic elements in PM2.5 during the wintertime in Beijing, China. Atmos. Environ. 2021;246 [Google Scholar]
- Fang W., Yang Y., Xu Z. PM10 and PM2.5 and health risk assessment for heavy metals in a typical factory for cathode ray tube television recycling. Environ. Sci. Technol. 2013;47:12469–12476. doi: 10.1021/es4026613. [DOI] [PubMed] [Google Scholar]
- Fold N.R., Allison M.R., Wood B.C., Thao P.T.B., Bonnet S., Garivait S., Kamens R., Pengjan S. An assessment of annual mortality attributable to ambient PM2.5 in Bangkok, Thailand. Int. J. Environ. Res. Public Health. 2020;17 doi: 10.3390/ijerph17197298. [DOI] [PMC free article] [PubMed] [Google Scholar]
- Han J., Lee S., Mammadov Z., Kim M., Mammadov G., Ro H.-M. Source apportionment and human health risk assessment of trace metals and metalloids in surface soils of the Mugan plain, the Republic of Azerbaijan. Environ. Pollut. 2021;290 doi: 10.1016/j.envpol.2021.118058. [DOI] [PubMed] [Google Scholar]
- Hazarika N., Srivastava A. Estimation of risk factor of elements and PAHs in size-differentiated particles in the national capital region of India. Air Qual. Atmos. Health. 2017;10:469–482. [Google Scholar]
- Hazarika N., Srivastava A., Das A. Quantification of particle bound metallic load and PAHs in urban environment of Delhi, India: source and toxicity assessment. Sustain. Cities Soc. 2017;29:58–67. [Google Scholar]
- Hisamuddin N.H., Jalaludin J., Yusof A.N., Tualeka A.R. Genotoxic effects of exposure to urban traffic related air pollutants on children in Klang valley, Malaysia. Aerosol Air Qual. Res. 2020;20:2614–2623. [Google Scholar]
- Hu X., Zhang Y., Ding Z., Wang T., Lian H., Sun Y., Wu J. Bioaccessibility and health risk of arsenic and heavy metals (Cd, Co, Cr, Cu, Ni, Pb, Zn and Mn) in TSP and PM2.5 in Nanjing, China. Atmos. Environ. 2012;57:146–152. [Google Scholar]
- Imani M. Particulate matter (PM2.5 and PM10) generation map using MODIS level-1 satellite images and deep neural network. J. Environ. Manag. 2021;281 doi: 10.1016/j.jenvman.2020.111888. [DOI] [PubMed] [Google Scholar]
- Jiang N., Yin S., Guo Y., Li J., Kang P., Zhang R., Tang X. Characteristics of mass concentration, chemical composition, source apportionment of PM2.5 and PM10 and health risk assessment in the emerging megacity in China. Atmos. Pollut. Res. 2018;9:309–321. [Google Scholar]
- Kastury F., Smith E., Karna R.R., Scheckel K.G., Juhasz A.L. Methodological factors influencing inhalation bioaccessibility of metal(loid)s in PM2.5 using simulated lung fluid. Environ. Pollut. 2018;241:930–937. doi: 10.1016/j.envpol.2018.05.094. [DOI] [PMC free article] [PubMed] [Google Scholar]
- Kayee J., Sompongchaiyakul P., Sanwlani N., Bureekul S., Wang X., Das R. Metal concentrations and source apportionment of PM2.5 in Chiang Rai and Bangkok, Thailand during a biomass burning season. ACS Earth Space Chem. 2020;4:1213–1226. [Google Scholar]
- Li X., Cheng T., Shi S., Guo H., Wu Y., Lei M., Zuo X., Wang W., Han Z. Evaluating the impacts of burning biomass on PM2.5 regional transport under various emission conditions. Sci. Total Environ. 2021;793 doi: 10.1016/j.scitotenv.2021.148481. [DOI] [PubMed] [Google Scholar]
- Li F., Yan J., Wei Y., Zeng J., Wang X., Chen X., Zhang C., Li W., Chen M., Lü G. PM2.5-bound heavy metals from the major cities in China: spatiotemporal distribution, fuzzy exposure assessment and health risk management. J. Clean. Prod. 2021;286 [Google Scholar]
- Lide D.R. CRC Press; 2004. CRC Handbook of Chemistry and Physics (Vol. 85) [Google Scholar]
- Liu K., Shang Q., Wan C., Song P., Ma C., Cao L. Characteristics and sources of heavy metals in PM2.5 during a typical haze episode in rural and urban areas in Taiyuan, China. Atmosphere. 2018;9:2. [Google Scholar]
- MohseniBandpi A., Eslami A., Ghaderpoori M., Shahsavani A., Jeihooni A.K., Ghaderpoury A., Alinejad A. Health risk assessment of heavy metals on PM2.5 in Tehran air, Iran. Data Brief. 2018;17:347–355. doi: 10.1016/j.dib.2018.01.018. [DOI] [PMC free article] [PubMed] [Google Scholar]
- Moryani H.T., Kong S., Du J., Bao J. Health risk assessment of heavy metals accumulated on PM2.5 fractioned road dust from two cities of Pakistan. Int. J. Environ. Res. Public Health. 2020;17:7124. doi: 10.3390/ijerph17197124. [DOI] [PMC free article] [PubMed] [Google Scholar]
- Murari V., Singh N., Ranjan R., Singh R.S., Banerjee T. Source apportionment and health risk assessment of airborne particulates over central Indo-Gangetic Plain. Chemosphere. 2020;257 doi: 10.1016/j.chemosphere.2020.127145. [DOI] [PubMed] [Google Scholar]
- Narita D., Oanh N.T.K., Sato K., Huo M., Permadi D.A., Chi N.N.H., Ratanajaratroj T., Pawarmart I. Pollution characteristics and policy actions on fine particulate matter in a growing Asian economy: the case of Bangkok metropolitan region. Atmosphere. 2019;10:227. [Google Scholar]
- Nirmalkar J., Haswani D., Singh A., Kumar S., Raman R.S. Concentrations, transport characteristics, and health risks of PM2.5-bound trace elements over a national park in central India. J. Environ. Manag. 2021;293 doi: 10.1016/j.jenvman.2021.112904. [DOI] [PubMed] [Google Scholar]
- Ny M.T., Lee B.-K. Size distribution of airborne particulate matter and associated metallic elements in an urban area of an industrial city in Korea. Aerosol Air Qual. Res. 2011;11:643–653. [Google Scholar]
- PCD Air pollution and noise: situation and management. 2020. http://air4thai.pcd.go.th/webV2/download.php Available at.
- Pongpiachan S., Liu S., Huang R., Zhao Z., Palakun J., Kositanont C., Cao J. Variation in day-of-week and seasonal concentrations of atmospheric PM2.5-bound metals and associated health risks in Bangkok, Thailand. Arch. Environ. Contam. Toxicol. 2017;72:364–379. doi: 10.1007/s00244-017-0382-0. [DOI] [PubMed] [Google Scholar]
- Pope C.A., Dockery D.W. Health effects of fine particulate air pollution: lines that connect. J. Air Waste Manage. Assoc. 2006;56:709–742. doi: 10.1080/10473289.2006.10464485. [DOI] [PubMed] [Google Scholar]
- Pope Iii C.A., Burnett R.T., Thun M.J., Calle E.E., Krewski D., Ito K., Thurston G.D. Lung cancer, cardiopulmonary mortality, and long-term exposure to fine particulate air pollution. JAMA. 2002;287:1132–1141. doi: 10.1001/jama.287.9.1132. [DOI] [PMC free article] [PubMed] [Google Scholar]
- Pothirat C., Chaiwong W., Liwsrisakun C., Bumroongkit C., Deesomchok A., Theerakittikul T., Limsukon A., Tajarernmuang P., Phetsuk N. The short-term associations of particular matters on non-accidental mortality and causes of death in Chiang Mai, Thailand: a time series analysis study between 2016-2018. Int. J. Environ. Health Res. 2021;31:538–547. doi: 10.1080/09603123.2019.1673883. [DOI] [PubMed] [Google Scholar]
- Praveena S.M., Yuswir N.S., Aris A.Z., Hashim Z. Contamination assessment and potential human health risks of heavy metals in Klang urban soils: a preliminary study. Environ. Earth Sci. 2015;73:8155–8165. [Google Scholar]
- Rodríguez A., Seseña S., Sánchez E., Rodríguez M., Palop M.L., Rodríguez Martín-Doimeadios R.d.C., Rodríguez Fariñas N. Temporal variability measurements of PM2.5 and its associated metals and microorganisms on a suburban atmosphere in the central Iberian Peninsula. Environ. Res. 2020;191 doi: 10.1016/j.envres.2020.110220. [DOI] [PubMed] [Google Scholar]
- Roy D., Singh G., Seo Y.-C. Carcinogenic and non-carcinogenic risks from PM10- and PM2.5-Bound metals in a critically polluted coal mining area. Atmos. Pollut. Res. 2019;10:1964–1975. [Google Scholar]
- Sajjadi S.A., Atarodi Z., Lotfi A.H., Zarei A. Levels of particulate matters in air of the Gonabad city, Iran. Methods. 2018;5:1534–1539. doi: 10.1016/j.mex.2018.11.001. [DOI] [PMC free article] [PubMed] [Google Scholar]
- Sakunkoo P., Manochai P., Koh D., Sangkham S. Effects of PM2.5 on the incidence of circulatory system diseases in Muang District, Khon Kaen Province of Northeast Thailand. EnvironmentAsia. 2022;15:109–116. [Google Scholar]
- Shaltout A.H., Alomairy S.E., Manousakas M., Karydas A.G., Eleftheriadis K. Correlation between inorganic pollutants in the suspended particulate matter (SPM) and fine particulate matter (PM2.5) collected from industrial and residential areas in Greater Cairo, Egypt. Air Qual. Atmos. Health. 2019;12:241–250. [Google Scholar]
- Singh N., Murari V., Kumar M., Barman S.C., Banerjee T. Fine particulates over South Asia: review and meta-analysis of PM2.5 source apportionment through receptor model. Environ. Pollut. 2017;223:121–136. doi: 10.1016/j.envpol.2016.12.071. [DOI] [PubMed] [Google Scholar]
- Sugita K., Kin Y., Yagishita M., Ikemori F., Kumagai K., Ohara T., Kinoshita M., Nishimura K., Takagi Y., Nakajima D. Evaluation of the genotoxicity of PM2.5 collected by a high-volume air sampler with impactor. Genes Environ. 2019;41:7. doi: 10.1186/s41021-019-0120-0. [DOI] [PMC free article] [PubMed] [Google Scholar]
- Tchounwou P.B., Yedjou C.G., Patlolla A.K., Sutton D.J. vol. 101. 2012. Heavy Metal Toxicity and the Environment; pp. 133–164. (Experientia. Supplementum). [DOI] [PMC free article] [PubMed] [Google Scholar]
- Tian H.Z., Wang Y., Xue Z.G., Cheng K., Qu Y.P., Chai F.H., Hao J.M. Trend and characteristics of atmospheric emissions of Hg, As, and Se from coal combustion in China 1980–2007. Atmos. Chem. Phys. 2010;10:11905–11919. [Google Scholar]
- TMD The climate of Thailand. 2015. https://www.tmd.go.th/en/archive/thailand_climate.pdf Available at.
- TMD Index of /data/province (the climate of Khon Kaen Province) 2020. http://climate.tmd.go.th/data/province/ Available at.
- Tobler A., Bhattu D., Canonaco F., Lalchandani V., Shukla A., Thamban N.M., Mishra S., Srivastava A.K., Bisht D.S., Tiwari S., Singh S., Močnik G., Baltensperger U., Tripathi S.N., Slowik J.G., Prévôt A.S.H. Chemical characterization of PM2.5 and source apportionment of organic aerosol in New Delhi, India. Sci. Total Environ. 2020;745 doi: 10.1016/j.scitotenv.2020.140924. [DOI] [PubMed] [Google Scholar]
- USEPA EPA positive matrix factorization (PMF) 5.0 fundamentals and user guide. 2014. https://www.epa.gov/sites/default/files/2015-02/documents/pmf_5.0_user_guide.pdf Available at.
- Varol M., Tokatlı C. Seasonal variations of toxic metal(loid)s in groundwater collected from an intensive agricultural area in northwestern Turkey and associated health risk assessment. Environ. Res. 2022;204 doi: 10.1016/j.envres.2021.111922. [DOI] [PubMed] [Google Scholar]
- Wang K., Wang W., Li L., Li J., Wei L., Chi W., Hong L., Zhao Q., Jiang J. Seasonal concentration distribution of PM1.0 and PM2.5 and a risk assessment of bound trace metals in Harbin, China: effect of the species distribution of heavy metals and heat supply. Sci. Rep. 2020;10:8160. doi: 10.1038/s41598-020-65187-7. [DOI] [PMC free article] [PubMed] [Google Scholar]
- WHO, 2006. Air quality guidelines. Global update 2005. Particulate matter, ozone, nitrogen dioxide and sulfur dioxide. [PubMed]
- Wu Y., Lu B., Zhu X., Wang A., Yang M., Gu S., Wang X., Leng P., Zierold K.M., Li X., Tang K.K., Fang L., Huang R., Xu G., Chen L. Seasonal variations, source apportionment, and health risk assessment of heavy metals in PM2.5 in Ningbo, China. Aerosol Air Qual. Res. 2019;19:2083–2092. [Google Scholar]
- Xie J., Jin L., Cui J., Luo X., Li J., Zhang G., Li X. Health risk-oriented source apportionment of PM2.5-associated trace metals. Environ. Pollut. 2020;262 doi: 10.1016/j.envpol.2020.114655. [DOI] [PubMed] [Google Scholar]
- Xie Z., Li Y., Qin Y., Rong P. Value assessment of health losses caused by PM2.5 pollution in cities of atmospheric pollution transmission channel in the Beijing–Tianjin–Hebei region, China. Int. J. Environ. Res. Public Health. 2019;16:1012. doi: 10.3390/ijerph16061012. [DOI] [PMC free article] [PubMed] [Google Scholar]
- Xu P., Chen Y., He S., Chen W., Wu L., Xu D., Chen Z., Wang X., Lou X. A follow- up study on the characterization and health risk assessment of heavy metals in ambient air particles emitted from a municipal waste incinerator in Zhejiang, China. Chemosphere. 2020;246 doi: 10.1016/j.chemosphere.2019.125777. [DOI] [PubMed] [Google Scholar]
- Yan H., Ding G., Li H., Wang Y., Zhang L., Shen Q., Feng K. Field evaluation of the dust impacts from construction sites on surrounding areas: a city case study in China. Sustain. 2019;11 [Google Scholar]
- Yang S., He H., Lu S., Chen D., Zhu J. Quantification of crop residue burning in the field and its influence on ambient air quality in Suqian, China. Atmos. Environ. 2008;42:1961–1969. [Google Scholar]
- Yongming H., Peixuan D., Junji C., Posmentier E.S. Multivariate analysis of heavy metal contamination in urban dusts of Xi'an, Central China. Sci. Total Environ. 2006;355:176–186. doi: 10.1016/j.scitotenv.2005.02.026. [DOI] [PubMed] [Google Scholar]
- Yunesian M., Rostami R., Zarei A., Fazlzadeh M., Janjani H. Exposure to high levels of PM2.5 and PM10 in the Metropolis of Tehran and the associated health risks during 2016–2017. Microchem. J. 2019;150 [Google Scholar]
- Zhang N., Han B., He F., Xu J., Niu C., Zhou J., Kong S., Bai Z., Xu H. Characterization, health risk of heavy metals, and source apportionment of atmospheric PM2.5 to children in summer and winter: an exposure panel study in Tianjin, China. Air Qual. Atmos. Health. 2015;8:347–357. [Google Scholar]
- Zhang X., Eto Y., Aikawa M. Risk assessment and management of PM2.5-bound heavy metals in the urban area of Kitakyushu, Japan. Sci. Total Environ. 2021;795 doi: 10.1016/j.scitotenv.2021.148748. [DOI] [PubMed] [Google Scholar]
- Zhang Y., Wang X., Chen H., Yang X., Chen J., Allen J.O. Source apportionment of lead-containing aerosol particles in Shanghai using single particle mass spectrometry. Chemosphere. 2009;74:501–507. doi: 10.1016/j.chemosphere.2008.10.004. [DOI] [PubMed] [Google Scholar]
- Zheng N., Hou S., Wang S., Sun S., An Q., Li P., Li X. Health risk assessment of heavy metals in street dust around a zinc smelting plant in China based on bioavailability and bioaccessibility. Ecotoxicol. Environ. Saf. 2020;197 doi: 10.1016/j.ecoenv.2020.110617. [DOI] [PubMed] [Google Scholar]
- Zheng N., Liu J., Wang Q., Liang Z. Health risk assessment of heavy metal exposure to street dust in the zinc smelting district, Northeast of China. Sci. Total Environ. 2010;408:726–733. doi: 10.1016/j.scitotenv.2009.10.075. [DOI] [PubMed] [Google Scholar]
- Zheng X., Xu X., Yekeen T.A., Zhang Y., Chen A., Kim S.S., Dietrich K.N., Ho S.-M., Lee S.-A., Reponen T., Huo X. Ambient air heavy metals in PM2.5 and potential human health risk assessment in an informal electronic-waste recycling site of China. Aerosol Air Qual. Res. 2016;16:388–397. [Google Scholar]
- Zhi M., Zhang X., Zhang K., Ussher S.J., Lv W., Li J., Gao J., Luo Y., Meng F. The characteristics of atmospheric particles and metal elements during winter in Beijing: size distribution, source analysis, and environmental risk assessment. Ecotoxicol. Environ. Saf. 2021;211 doi: 10.1016/j.ecoenv.2021.111937. [DOI] [PubMed] [Google Scholar]
- Zhou M., He G., Fan M., Wang Z., Liu Y., Ma J., Ma Z., Liu J., Liu Y., Wang L., Liu Y. Smog episodes, fine particulate pollution and mortality in China. Environ. Res. 2015;136:396–404. doi: 10.1016/j.envres.2014.09.038. [DOI] [PubMed] [Google Scholar]
- Zhu G., Hu W., Liu Y., Cao J., Ma Z., Deng Y., Sabel C.E., Wang H. Health burdens of ambient PM2.5 pollution across Chinese cities during 2006–2015. J. Environ. Manag. 2019;243:250–256. doi: 10.1016/j.jenvman.2019.04.119. [DOI] [PubMed] [Google Scholar]
Associated Data
This section collects any data citations, data availability statements, or supplementary materials included in this article.
Supplementary Materials
Estimation of human health risk for children and adults due to exposure of trace elements.
Data Availability Statement
The authors do not have permission to share data.