

Abstract
Epithelial wound healing in Drosophila involves the formation of multinucleate cells surrounding the wound. We show that autophagy, a cellular degradation process often deployed in stress responses, is required for the formation of a multinucleated syncytium during wound healing, and that autophagosomes that appear near the wound edge acquire plasma membrane markers. In addition, uncontrolled autophagy in the unwounded epidermis leads to the degradation of endo‐membranes and the lateral plasma membrane, while apical and basal membranes and epithelial barrier function remain intact. Proper functioning of TORC1 is needed to prevent destruction of the larval epidermis by autophagy, in a process that depends on phagophore initiation and expansion but does not require autophagosomes fusion with lysosomes. Autophagy induction can also affect other sub‐cellular membranes, as shown by its suppression of experimentally induced laminopathy‐like nuclear defects. Our findings reveal a function for TORC1‐mediated regulation of autophagy in maintaining membrane integrity and homeostasis in the epidermis and during wound healing.
Keywords: cell junction, gut barrier, myosin, nuclear morphology, wound healing
Subject Categories: Autophagy & Cell Death; Cell Adhesion, Polarity & Cytoskeleton
Elevated autophagy induces syncytium formation by membrane breakdown in the epidermis and during wound healing in Drosophila.
Introduction
Autophagy is a conserved intracellular degradation process that engulfs cytoplasmic materials in double membrane vesicles, the autophagosomes, and delivers them to lysosomes (Allen & Baehrecke, 2020). Multiple organelles, such as the endoplasmic reticulum (ER), Golgi, mitochondria, nuclear envelope and plasma membrane, can provide membrane to form pre‐autophagosomal structures (PAS) and nucleate phagophores (Ravikumar et al, 2010; Pavel & Rubinsztein, 2017). Autophagy occurs during development, differentiation and tissue remodelling, and it can be activated in response to intracellular or extracellular stresses such as DNA damage, protein aggregates, damaged organelles, starvation, heat shock, oxidative stress infection or wounding (Levine & Kroemer, 2019; Sylakowski & Wells, 2021).
Wounding has been shown in Drosophila, planarians, zebrafish, rat, mouse and plants to induce autophagy (Varga et al, 2014; Kakanj et al, 2016; Kang et al, 2019; Allen & Baehrecke, 2020; Chavez et al, 2020; Kurotani et al, 2020; Qiang et al, 2020; Xu et al, 2020). In plants, rats and mice, autophagy is in turn necessary for efficient wound healing. Plant grafting induces autophagy at the site of the wound and lack of Atg2 or Atg5 reduces the rate of successful grafting (Kurotani et al, 2020). Wounding mouse skin induces the expression of autophagy genes in the epidermis and some of these genes (Atg5 or Atg7) are needed for proper wound closure, infiltration by immune cells, and for the production of cytokine CCL2. Applying recombinant CCL2 can reverse the effect of impaired autophagy indicating that the main role of autophagy in this context is to promote wound healing by inducing the production of CCL2 (Qiang et al, 2020). In rats, elevated autophagy at the wound margin is required for clearance of bacteria. Both autophagy and bacterial clearance are reduced in diabetic rats, but can be ameliorated by inhibiting TOR signalling with rapamycin (Xu et al, 2020). These findings illustrate a role for autophagy in wound healing, but many of the molecular mechanisms involved are unclear. Here, we used Drosophila larvae to investigate the cellular function and physiological role of autophagy in the epidermis and during wound healing.
The epidermis of Drosophila larva is a monolayer of polyploid, postmitotic epithelial cells on a basal lamina, attached on its apical side to the cuticle (Galko & Krasnow, 2004; Gangishetti et al, 2012). Larval wound healing is driven by two parallel and coordinated mechanisms. Actomyosin assembly and contraction at the apical side and lamellipodia on the basal side of the cells surrounding the wound lead to elongation of these cells into the wound to close the gap (Galko & Krasnow, 2004; Kakanj et al, 2016). Autophagy occurs in cells surrounding the wound as they close the wound (Kakanj et al, 2016). Another late event in wound healing in larvae, pupa and adult flies is the formation of a multinucleate syncytium (Galko & Krasnow, 2004; Losick et al, 2013; Wang et al, 2015).
One of the pathways activated during wound healing is the JNK pathway. Hyperactivation of JNK leads to disassembly of focal adhesion complexes and induces syncytium formation in unwounded epidermis (Galko & Krasnow, 2004; Wang et al, 2015). However, the natural syncytium formation in cells surrounding wounds does not depend on JNK signalling (Wang et al, 2015). This suggests that parallel to JNK other signals are involved in syncytium formation after wounding.
In the adult fly, syncytium formation during would healing involves polyploidization and cell fusion, both dependent on Hippo/Yorkie signalling (Losick et al, 2013; Besen‐McNally et al, 2021). While no connection with autophagy was shown in this system, it is worth noting that Yorkie can activate TORC1, a direct suppressor of autophagy, and that TORC1 is activated during larval wound healing, where it supports wound closure partly through S6K, one of its downstream effectors (Kakanj et al, 2016; Wang et al, 2020).
Whether autophagy and syncytium formation are causally connected is not known. However, during ageing a progressive elevation of autophagy drives epidermal remodelling, morphological deterioration and formation of large multinuclear cells (Scherfer et al, 2013). Global reduction in autophagy is associated with reduced plasma membrane degradation and ageing of the epidermis (Scherfer et al, 2013).
Here, we directly tested the connection between autophagy and syncytium formation during wound healing and in the unwounded epidermis. We show that in Drosophila larvae elevated autophagy induces syncytium formation by membrane breakdown both in the epidermis and during epidermal wound healing.
Results
Autophagy and syncytium formation during wound healing
To analyse the function of autophagy for wound healing, we co‐expressed a marker for autophagosomes (GFP‐Atg8a) with RNA interference (RNAi) constructs against autophagy components in the epidermis and created epidermal wounds in early third larval instars. Atg8a is homologous to human MAP1 LC3 and localizes to all autophagic vesicles from the phagophore to the autolysosome (Klionsky et al, 2021). In unwounded control epidermis, GFP‐Atg8a is diffusely distributed in the cytoplasm and nucleus and is additionally seen in a few puncta in the cytosol (Fig 1A). After wounding, new autophagosomes appear in the cells surrounding the wound (Kakanj et al, 2016), increasing in number until completion of wound closure and starting to drop again to 50–60 min after wound closure (Fig 1A–C, Appendix Fig S1 and Movies EV1 and EV2).
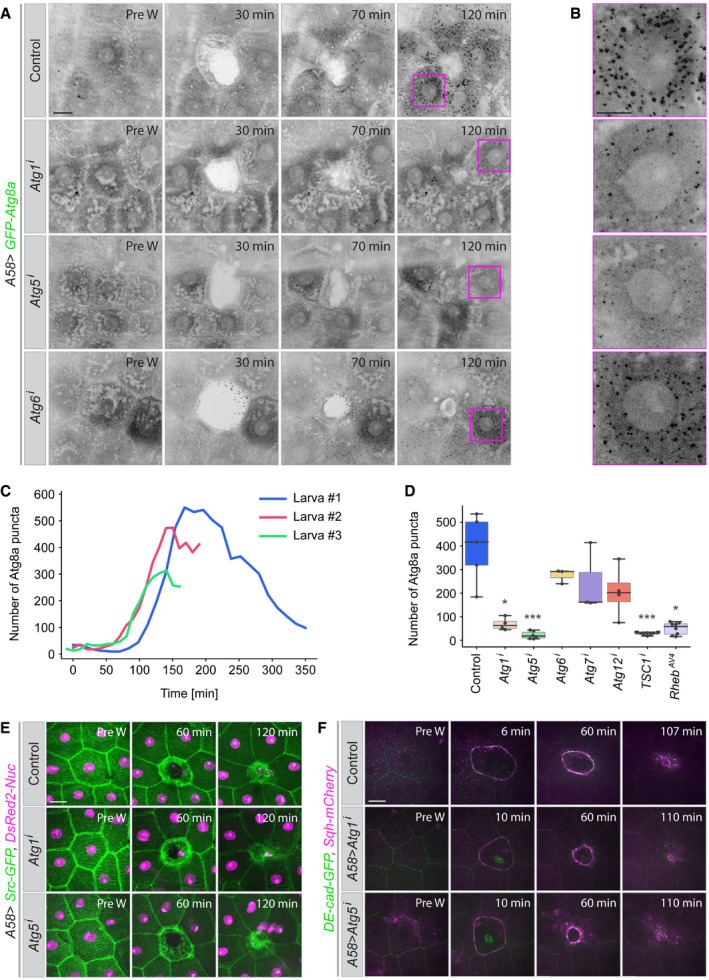
Figure 1. Autophagy during epidermal wound healing.
-
A–DAppearance of autophagic structures (marked with GFP‐Atg8a) during wound closure in the epidermis of control third instar larvae and after epidermal knockdown of the autophagy pathway components Atg1, Atg5, Atg6, Atg7 or Atg12. All constructs are expressed in the epidermis under the control of the A58‐Gal4 driver. (A) Time points from movies of wounded epidermis. The wounds have closed by 2 h in all cases. (B) Higher magnification of the areas marked by magenta boxes at t = 120 min. (C) Quantification of the appearance of GFP‐Atg8a puncta in the imaged area (10,000 µm2) 3 control larvae, shown for each individual larva. (D) Quantification of number of GFP‐Atg8a puncta in different genetic conditions measured in an area of 10,000 µm2 at the time of wound closure; n = 4–10 larvae each genotype, for the detail see Data analysis. We assumed unequal sample size and unequal variances and calculations were performed. Values are presented as box plots. Box plot elements are: centre line, median; box limits, upper and lower quartiles; whiskers, 1.5× interquartile range; points, outliers. For statistical hypothesis testing, independent and non‐parametric (Kruskal–Wallis) t‐tests were performed for the mean number of spots in control and experimental conditions. P‐values are indicated as follows: *P < 0.04; ***P < 0.0002 and lack of an asterisk means non‐significant (P > 0.123).
-
E, FEffect of suppressing autophagy on wound healing and actin cable formation. Time‐lapse series of single‐cell wound healing in larvae expressing (E) Src‐GFP (green) and DsRed2‐Nuc (magenta) to mark cell membrane and nuclei and (F) endogenously GFP‐tagged E‐cadherin (DE‐cad‐GFP; green) and mCherry‐marked myosin regulatory light chain (Sqh‐mCherry; magenta) to visualize adherens junctions and actomyosin cables.
Data information: (A, B, E, F) Z–projections of time‐lapse series in early L3 larvae, n = 9–15 larvae each genotype. Scale bars, A, E, F, 20 μm and B, 10 μm. Pre W: pre‐wounding. Images from Movies [Link], [Link], [Link], [Link], [Link]. Genotypes of all images are listed in Table 2.
Source data are available online for this figure.
When autophagy was suppressed by knockdown of Atg1 (the key component for autophagy initiation) or Atg5 (a component for phagophore elongation) in the epidermis, the number of Atg8a vesicles in the cells around the wound was significantly reduced (Fig 1A, B and D, Movie EV1). Knockdown of Atg6 (phagophore nucleation factor), Atg7 or Atg12 (phagophore elongation factors) also resulted in a decrease in autophagosomes, but the effect was much less pronounced (Fig 1A, B and D, Movie EV1). Our data for Atg7 and Atg12 knockdown are consistent with previous findings that these components are accessory but not necessarily essential for the completion of autophagy (Schwenzfeier, 1991; Scott et al, 2004; Chang et al, 2013; Scherfer et al, 2013; Xu et al, 2015). However, the mild effect of Atg6 knockdown might be the result of a less effective RNAi construct, since Atg6 has been shown to be essential for autophagy. (Shravage et al, 2013; Xu et al, 2015).
We analysed the effect of suppressing autophagy (using RNAi against Atg1, Atg5, Atg6, Atg7 or Atg12) on the quality and rate of wound healing in larvae in which the plasma membranes were marked with Src‐GFP or the adherens junctions with DE‐Cadherin‐GFP and the myosin regulatory light chain (MRLC) with Sqh‐mCherry (a tagged form of Drosophila MRLC). Epidermal reduction of autophagy caused no morphological or developmental abnormalities in the epidermis and it did not affect the quality or rate of wound healing: lamellipodia, cell crawling, the assembly and contraction of the actomyosin cable, and the rate of wound closure were all normal and similar to controls (Fig 1E and F, Movies EV3 and EV4).
In the larva, the cells surrounding a wound form a large syncytium (Galko & Krasnow, 2004; Wang et al, 2015). To visualize syncytium formation in our experimental system, we created wounds in larvae with epidermal mosaics of cells expressing free cytosolic GFP (Fig 2A and B). When we ablated an unmarked cell that was surrounded by both GFP‐marked and unmarked cells, GFP gradually appeared in initially GFP‐free cells around the time of wound closure (Fig 2B and Movie EV5). By the time the wound was fully closed, all cells surrounding the wound were GFP positive, with an overall homogeneous GFP level. This behaviour was independent of the initial number of GFP‐positive cells.
Figure 2. Syncytium formation during wound healing.
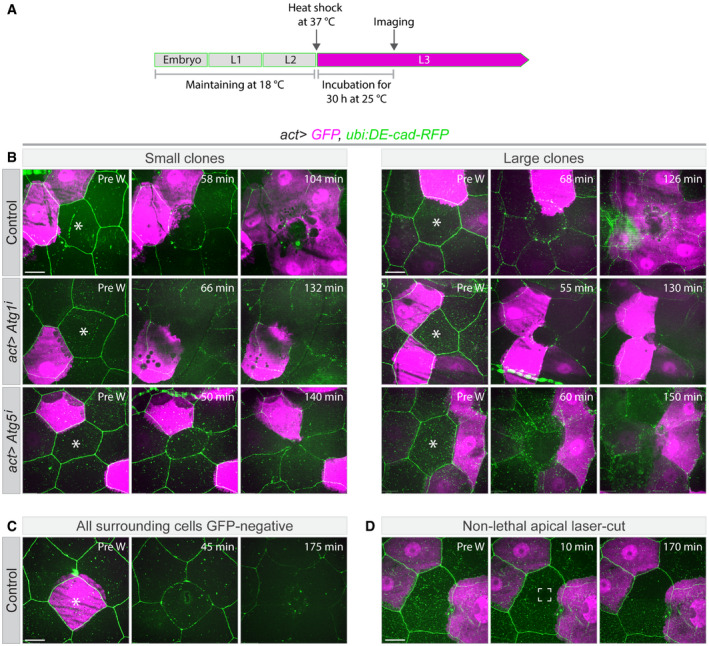
- Schematic for timing of transgene expression and start of live imaging. Gene expression was induced at the end of the second larval instar, laser ablation and imaging started 30 h later.
- Wound healing in epithelia with clonally expressed cytoplasmic GFP (magenta) under the actin5c‐Gal4 driver in control larvae (act>GFP) or larvae expressing RNAi constructs specific for Atg1 or Atg5. Laser‐ablated cells are marked with white asterisks. To visualize cell borders DE‐cad‐RFP (green) was expressed in all tested genotypes. By the end of wound closure, GFP from the clonal cells has spread to all cells around the wound in the control, but not if autophagy is suppressed, regardless of the number of cells initially expressing GFP.
- Control larva in which a GFP‐expressing cell was wounded. No GFP is induced in or taken up by the surrounding cells.
- Control experiment in which the central cell was damaged but not killed (white marked area). No wound response occurs and no GFP leakage between neighbouring cells is seen.
Data information: (A–D) n = 6–9 larvae each genotype. The control pre‐wounding small clone in b (top left panel) is from Kakanj et al, 2016. B, C, D, z‐projections of time‐lapse series. B–D, Scale bars, 20μm. Pre W: pre‐wounding. Images from Movies [Link], [Link], [Link], [Link], [Link].
We confirmed that the appearance of GFP in the initially GFP‐negative cells was not due to de novo synthesis in response to wounding. When we ablated a cell that was surrounded by cells without GFP we observed no GFP expression during an imaging time of ~3 h (Fig 2C and Movie EV6A). When we only damaged the apical membrane of a cell without fatally wounding it, the GFP‐negative cells surrounding the damaged cell remained GFP negative (Fig 2D and Movie EV6B). This indicates that our experimental manipulations do not induce de novo GFP expression in GFP‐negative cells around the wound. Instead, we conclude that the GFP is redistributed from GFP‐expressing to GFP‐negative cells, and that the wound‐healing response includes a process by which the cells around the wound gradually share their cytoplasm.
One possible explanation for the observations so far is that the redistribution of cytoplasm and the induction of autophagy observed during wound healing are causally related. We tested this by ablating cells in epithelia in which Atg1 or Atg5 were knocked down and GFP was expressed in single or multiple clonal cells. We saw no intercellular redistribution of GFP in these experiments (Fig 2B and Movies EV7 and EV8). Thus, a clonal cell that is Atg1 or Atg5 deficient in a wild‐type background does not share its content with the neighbouring cells. This shows that cytoplasmic mixing and the formation of a syncytium depend on autophagy and that autophagy is required in a cell‐autonomous manner for a cell to become part of the syncytium.
Effect of Autophagy on epidermal morphology
We also analysed the effect of autophagy induction in the unwounded epidermis. The basal level of autophagy is low and only few Atg8a‐positive vesicles are detected in the epidermis of control larvae (Fig 3A and B). We activated autophagy artificially with two different overexpression constructs for Atg1, Atg1GS and Atg16B (Table 1 and Scott et al, 2007). Atg1GS and Atg16B were originally called “weak” and “strong,” respectively (Bjedov et al, 2020), but we found that in the larval epidermis their effects are practically indistinguishable. Both Atg1GS and Atg16B led to an increase in the number of Atg8a vesicles (Fig 3A–E). We also observed an increase in vesicles marked with LAMP1‐GFP, an endo‐lysosomal marker, indicating that the entire autophagic pathway was active (Appendix Fig S2A and B).
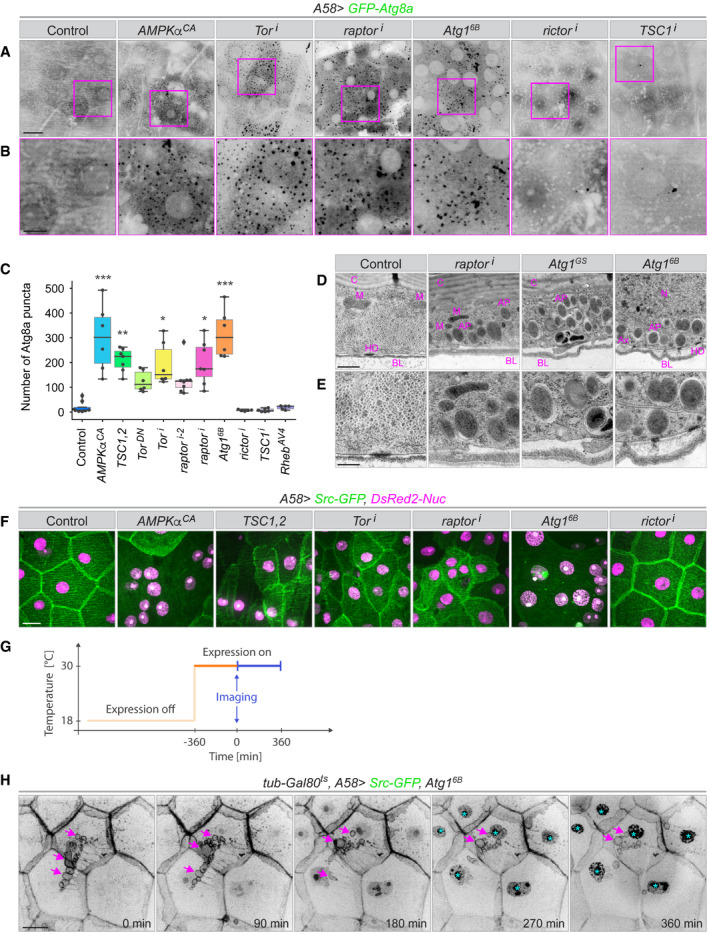
Figure 3. Autophagy in unwounded epidermis.
-
A–EControl of epidermal autophagy by TOR signalling. (A) Epidermis of third instar larvae expressing the autophagosome marker GFP‐Atg8a together with constructs for up‐ or downregulating the autophagy pathway in the epidermis. Healthy epidermis contains few autophagosomes, but artificially activating autophagy through overexpression of Atg1 or blocking TOR signalling leads to accumulation of autophagosomes. (B) Higher magnification of the areas marked by magenta boxes in (A). (C) Quantification of Atg8a puncta in an area of 10,000 µm2, n = 6–8 larvae each genotype. We assumed unequal sample size and unequal variances and calculations were performed. Values are presented as box plots. Box plot elements are: centre line, median; box limits, upper and lower quartiles; whiskers, 1.5× interquartile range; points, outliers. For statistical hypothesis testing, independent and non‐parametric (Kruskal–Wallis) t‐tests were performed for the mean number of spots in control and experimental conditions. P‐values are indicated as follows: *P < 0.04; **P < 0.003; ***P < 0.0002 and lack of an asterisk means non‐significant (P > 0.123). (D, E) Transmission electron micrographs of sections through the epidermis of larvae with elevated autophagy at two different magnifications. AP: autophagosome; Ax: cross‐section of an axon; BL: basal lamina; C: cuticle; HD: hemidesmosome; M: mitochondrion; N: nucleus.
- F
-
GSchematic for temporally controlled transgene expression and imaging in (H). Gene expression is induced at the end of the second larval instar, live imaging started 6 h later and continued for an additional 6 h.
-
HExample of membrane dynamics after time‐controlled Atg16B expression. Src‐GFP containing material appears to be taken out of and eventually detached from lateral cell membranes (arrows). Over the period of observation, abnormal accumulation of GFP is seen in the nuclei (cyan asterisks). t = 0 is 6 h after A58‐Gal4 activation. Image from Movie EV9.
Data information: A, B, F, H, z‐projections; n = 20–50 larvae each genotype. Scale bars: A, F, H, 20 μm, B, 10 μm, D, 1 μm and E, 500 nm.
Source data are available online for this figure.
Table 1.
Fly stocks used in experiments.
| Transgenes | Stock ID | Source | Reference |
|---|---|---|---|
| A58‐Gal4/TM6B | Michael J. Galko | Galko and Krasnow (2004) | |
| A58‐Gal4, UAS‐DsRed2‐Nuc/TM6B | Michael J. Galko | Galko and Krasnow (2004) | |
| A58‐Gal4, UAS‐Src‐GFP, UAS‐DsRed2‐Nuc/TM6B | Michael J. Galko | Galko and Krasnow (2004) | |
| NP1‐Gal4 | Michael Boutros | Jiang et al (2009), Nehme et al (2007) | |
| endo:DE‐cad‐GFP | Yang Hong | Huang et al (2009) | |
| endo:Sqh‐mCherry | Eric F. Wieschaus | Martin et al (2009), Royou et al (2002) | |
| endo:DE‐cad‐GFP, endo:Sqh‐mCherry | Thomas Lecuit | Huang et al (2009), Martin et al (2009) | |
| ubi:DE‐cad‐RFP/TM3 | Hiroki Oda | Oda and Tsukita (2001) | |
| FasIII‐GFP (GFP‐trap) (FasIII‐GFP[G00258]) | BL # 50841 | Michael J. Galko | Morin et al (2001) |
| Nrg‐GFP (GFP‐trap) (Nrg‐GFP[G00305]) | BL # 6844 | Michael J. Galko | Morin et al (2001) |
| Klaroid‐GFP (GFP‐exon‐Trap) (koi‐GFP[CB04483]) | BL # 51525 | Allan C. Spradling | Buszczak et al (2007) |
| endo:GFP‐Kuk | Jörg Großhans | Polychronidou et al (2010) | |
| UAS‐GFP‐Kuk (UAS‐GFP‐KukEY07696(w + ) ) | Jörg Großhans | Polychronidou et al (2010) | |
| UAS‐RFP‐LamB (UASp‐mRFP‐LaminDm019(w + )) | Jörg Großhans | Polychronidou et al (2010) | |
| endo:His2AV‐mRFP1 | Stefan Heidmann | Schuh et al (2007) | |
| UASp‐GalT‐GFP | BL # 31422 | Jennifer Lippincott‐Schwartz | Cole et al (1996) |
| UASp‐KDEL.RFP | BL # 30910 | Jennifer Lippincott‐Schwartz | Cole et al (1996) |
| UAS‐GFP (UAS‐EGFP) | BL # 5431 | Eric Spana | FBrf0217672 |
| UAS‐mito‐GFP | BL # 8442 | Allan C. Spradling | Cox and Spradling (2003) |
| UAS‐mCD8‐GFP | BL # 5137 | Liqun Luo | Lee and Luo (1999) |
| UAS‐GFP‐Atg8a | Thomas P. Neufeld | Arsham and Neufeld (2009) | |
| UAS‐mCherry‐Atg8a | BL # 37750 | Ioannis Nezis | FBrf0111645 |
| UAS‐LAMP1‐GFP | Gábor Juhász | Takats et al (2013) | |
| UASt‐GFP‐Baz | Daniel St Johnston | Benton and St Johnston (2003) | |
| UAS‐GFP‐Dlg (UAS‐EGFP‐Dlg‐S97) | Ulrich Thomas | Bachmann et al (2004) | |
| UAS‐Atg1i (UAS‐Atg1RNAi ) | V # 16133 (GD7149) | Barry J. Dickson | Dietzl et al (2007) |
| UAS‐Atg5i (UAS‐Atg5RNAi ) | V # 104461 (KK108904) | Barry J. Dickson | Dietzl et al (2007) |
| UAS‐Atg6i (UAS‐Atg6RNAi ) | V # 110197 (KK102460) | Barry J. Dickson | (Dietzl et al, 2007) |
| UAS‐Atg7i (UAS‐Atg7RNAi ) | V # 45558 (GD11671) | Barry J. Dickson | Dietzl et al (2007) |
| UAS‐Atg12i (UAS‐Atg12RNAi ) | V # 29791 (GD15230) | Barry J. Dickson | Dietzl et al (2007) |
| UAS‐TSC1,2 (UAS‐TSC1, AUS‐TSC2) | Iswar K. Hariharan | Tapon et al (2001) | |
| UAS‐TSC1i (UAS‐TSC1RNAi ) | V # 22252 (GD11836) | Barry J. Dickson | Dietzl et al (2007) |
| UAS‐TSC1i‐2 (UAS‐TSC1RNAi ) | BL # 54043 | Nobert Perrimon | Perkins et al (2015) |
| UAS‐Tori (UAS‐TorRNAi) | BL # 33951 | Nobert Perrimon | Perkins et al (2015) |
| UAS‐TORDN (UAS‐TORTED) | BL # 7013 | Thomas P. Neufeld | Hennig and Neufeld (2002) |
| UAS‐raptori (UAS‐raptorRNAi ) | BL # 34814 | Nobert Perrimon | Perkins et al (2015) |
| UAS‐raptori‐2 (UAS‐raptorRNAi ) | BL # 41912 | Nobert Perrimon | Perkins et al (2015) |
| UAS‐rictori (UAS‐rictorRNAi ) | BL # 36699 | Nobert Perrimon | Perkins et al (2015) |
| UAS‐Atg16B (UAS‐Atg16B ) | Thomas P. Neufeld | Scott et al (2007) | |
| UAS‐Atg1GS, UAS‐GFP (UAS‐Atg1GS10797 ) In this line, UAS regulatory sequence have been inserted upstream of the endogenous Atg1 gene | Thomas P. Neufeld | Scott et al (2007) | |
| UAS‐ AMPKαCA (UAS‐ AMPKα T184D ) | BL # 32110 | Jay Brenman | FBrf0211859 |
| UAS‐S6Ki (UAS‐S6KRNAi ) | BL # 41895 | Nobert Perrimon | Perkins et al (2015) |
| UAS‐S6KCA (UAS‐S6KSTDETE ) | BL # 6914 | Mary Stewart | Barcelo and Stewart (2002) |
| UAS‐SqaKA (UAS‐SqaT279A/CyO) | Guang‐Chao Chen | Tang et al (2011) | |
| UAS‐RhoAi (UAS‐RhoARNAi ) | V # 12734 (GD4726) | Barry J. Dickson | Dietzl et al (2007) |
| UAS‐Roki (UAS‐RokRNAi ) | V # 104675 (KK107802) | Barry J. Dickson | Dietzl et al (2007) |
| UAS‐RhebAV4 | Fuyuhiko Tamanoi | Patel et al (2003) | |
| UAS‐Syx17i (UAS‐Syx17RNAi ) | V # 36595 (GD14850) | Barry J. Dickson | Dietzl et al (2007) |
| UAS‐Vamp7i (UAS‐Vamp7RNAi ) | BL # 38300 | Nobert Perrimon | Perkins et al (2015) |
| UAS‐Snap29i (UAS‐Snap29RNAi ) | V # 18172 (GD7222) | Barry J. Dickson | Dietzl et al (2007) |
| UAS‐Snap29i (UAS‐Snap29RNAi ) | V # 107947 (KK108034) | Barry J. Dickson | Dietzl et al (2007) |
| tubP‐GAL80ts | BL # 7019 | Roland Davis | McGuire et al (2003) FBrf0159874 |
| hsFLP; act5c> y + >GAL4, UAS‐GFP/CyO | Konrad Basler | Struhl and Basler (1993) |
BL: Bloomington stock centre (https://bdsc.indiana.edu/); V: VDRC stock centre (https://stockcenter.vdrc.at/control/main).
Autophagy is normally kept inactive via TORC1 signalling, and we tested the effect of both disruption and activation of TORC1 on autophagy. Experimental activation of TORC1, either through overexpression of an upstream activator, RhebAV4 or knockdown of the TORC1 inhibitor, TSC1 (TSC1i ), had little effect on the number of Atg8a‐positive vesicles in the tissue (Fig 3A–C). In contrast, expression of the TORC1 antagonists, AMPKαCA , TSC1, TSC2 or a dominant‐negative version of Tor (TorDN ), or downregulation of Tor or raptor by RNAi increased the number of Atg8a‐positive and LAMP1‐positive vesicles (Fig 3A–C and Appendix Fig S2A and B). Epidermal knockdown of rictor, a component of TORC2, did not induce autophagy (Fig 3A–C and Appendix Fig S2A and B). Thus, the suppression of autophagy in the larval epidermis depends specifically on TORC1.
Transmission electron microscopy (TEM) images showed large numbers of autophagosomes and autolysosomes after TORC1 reduction or Atg1 overexpression while very few were present in control epidermis confirming that the increase in Atg8a‐ and LAMP1 puncta corresponded to an increase in autophagosomes and autolysosomes (Fig 3D and E).
The increase in Atg8a‐positive vesicles caused by overexpression of Atg1 was always similar in quality but stronger in extent than that resulting from reducing TORC1 activity directly or through its upstream regulators.
In the experiments above we noticed that cells often appeared morphologically abnormal. We then used the plasma membrane marker Src‐GFP to analyse this effect. Reduction in TORC1 activity or expression of Atg1 led to distortions of epidermal morphology, with effects on the shape and orientation of cells, localization of the nuclei, and size heterogeneity in cells and nuclei (Fig 3F). Most strikingly, cell outlines often appeared to be interrupted or missing altogether (Fig 3F). Time‐controlled transgene activation using the temperature‐sensitive Gal80ts system showed that defects were visible within 6 h of TORC1 depletion or activation of Atg1 (the earliest possible time point for analysis, since the marker constructs were not detectable sooner). These defects became exacerbated over the following 18 h, with a progressive change in organization of lateral membranes, accompanied by the formation of large vesicles that moved towards the centre of the cell and then disappeared (Fig 3G and H, Appendix Fig S2C and Movie EV9). Together, these results indicate that disruption of TORC1 signalling causes exacerbated autophagy and altered epidermal morphology.
Autophagy and the formation of epithelial syncytia
The results so far could mean that the missing cell outlines were due to a change in membrane properties, so that Src‐GFP could no longer be recruited, or there could be gaps or defects within the membranes. To distinguish between these possibilities, we first examined other membrane markers. The main components of the apical cell polarity complex Par3 (Bazooka) and aPKC, normally located in the apical domain of the lateral plasma membrane, and the septate junction proteins, Fasciclin III (FasIII) and Neuroglian (Nrg), all showed abnormal distributions or were absent over large areas in TORC1‐depleted and Atg1‐expressing epithelia (Fig 4A–C and Appendix Fig S3A–D). Both live imaging with GFP constructs and immunofluorescence of fixed material gave the same results, showing that mislocalization of GFP or the absence of determinants was neither due to breakdown of GFP nor due to fixation problems.
Figure 4. Effect of uncontrolled autophagy on plasma membrane‐associated proteins.
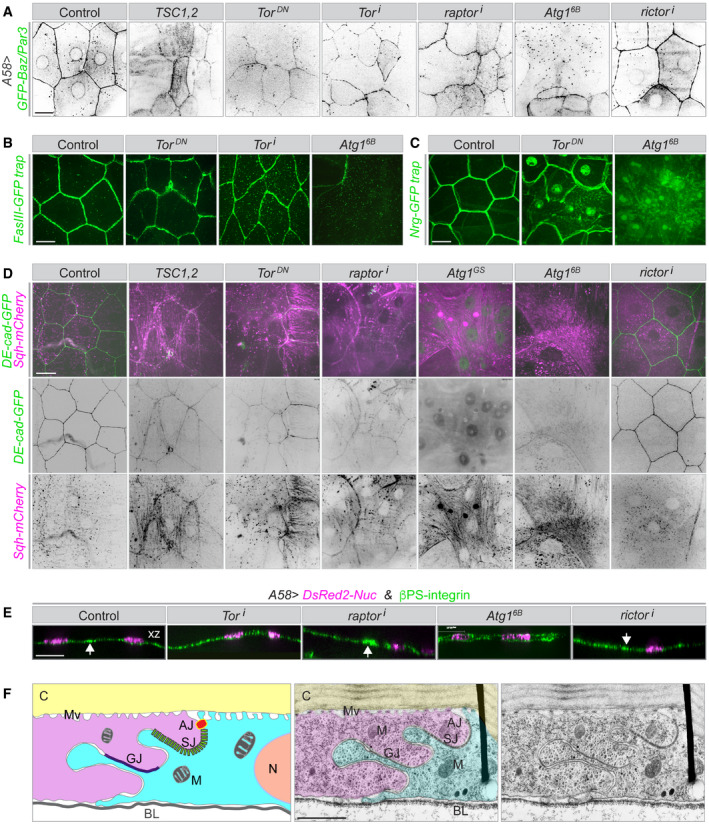
-
A–ESurface views (A–D) and z‐sections (E) of third instar larval epidermis expressing the indicated fluorescent markers and RNAi or overexpression constructs. (A) Bazooka/Par3, normally seen at the apical adherens junction and in a perinuclear position, is lost or reduced in large areas under uncontrolled autophagy as are lateral membrane markers, (B) Fasciclin‐III (FasIII), (C) neuroglian (Nrg) and (D) adherens junctions (DE‐cad), whereas large bundles decorated with MRLC appear. (E) The baso‐lateral transmembrane protein β‐integrin is not lost; in extreme conditions, it is seen in both the apical and basal membranes (overexpression of Atg16B). Arrows in the z‐sections point to high accumulation of integrin along the folded lateral membranes.
-
FElectron micrograph of a section through the larval epidermis to show the highly folded lateral junction between two epidermal cells (magenta and cyan). Left, cartoon; middle, false colouring; right, original image. C: cuticle; M: mitochondrion; BL: basal lamina; AJ: adherens junction; SJ: septate junction; GJ: gap junction, N: nucleus, Mv: apical microvilli connecting the cuticle to the cell.
Data information: A–E, n = 15–40 larvae each genotype. Scale bars: A–E, 20 μm and F, 2 μm. Images from Movies EV10 and EV11.
To assess the extent of cell abnormality, we also imaged other molecules involved in cell shape and polarity. We found that adherens junctions (visualized with DE‐Cadherin‐GFP) were reduced or absent, while myosin (MyoII, visualized with the mCherry‐tagged non‐muscle type II myosin regulatory light chain, Sqh‐mCherry) had formed strong cortical and cytosolic filaments (Fig 4D). Experimental activation of TORC1 had the opposite effect: it reduced myosin level similar to knockdown of RhoA or Rok (Appendix Fig S3E).
TORC2 is involved in the regulation of plasma membrane and actin cytoskeleton homeostasis both in yeast and mammalian cells (Riggi et al, 2018, 2020), but reduction of TORC2 activity had no effect in any of the assays we used for autophagy or cell morphology (Figs 3A–C and F, and 4A and D, Appendix Fig S2A and B).
Z‐sections of cells expressing Src‐GFP or the transmembrane marker mCD8‐GFP showed that the basal and apical membranes appeared intact (Appendix Fig S4A and B). We stained also for the basal marker β‐integrin, which is normally localized at the basal and basolateral plasma membrane up to the border of the septate junctions (Fig 4E and Appendix Fig S4C). Because the lateral membrane is highly folded (Fig 4F), the outlines of cells are seen as a fuzzy band of increased integrin staining. The epithelium is very thin and the nuclei extremely flattened, but in spite of the low‐resolution, z‐sections show the integrin signal in a thin line below the nuclei in control epidermis. This separation is less clear in the absence of TORC1 signalling, and strongly disturbed when Atg1 is overexpressed. In this case, integrin is seen both below and above the nuclei, suggesting that it is also present in the apical compartment (Fig 4E).
The basal membrane is not only present, but is also intact as shown by the fact that we see no significant loss of cytosolic GFP from the epidermis, either in untreated or in wounded epithelia (see below). This may also explain why these larvae can survive throughout larval development.
Finally, despite defects in the lateral plasma membranes, the abnormal epithelia resulting from uncontrolled autophagy were able to form an actomyosin cable around wounds. While the wounds healed more slowly, they eventually closed completely, and most of the larvae (~75%) survived to the pupal stage (Appendix Fig S5A and B and Movies [Link], [Link], [Link]). Thus, the defects in morphology are not simply a sign of the epithelium disintegrating or dying, but the epithelium is viable and physiologically active.
The results so far indicate that activation of autophagy results in the disappearance of lateral membrane markers. If this is due to the loss of lateral membrane then cytosolic proteins should be able to diffuse between cells. We tested this with fluorescence loss in photobleaching (FLIP) to monitor the intercellular movement of GFP. In control experiments, we bleached the GFP in an area of 179 µm2 within a cell for 3 min, resulting in the removal of GFP not only from the bleached area but also from the entire cell (Fig 5A–C and Movie EV13A). The GFP in neighbouring cells was not affected, and no GFP re‐appeared in the bleached cell over the next 20 min. In contrast, a 3‐min illumination of an area of 179 µm2 in larvae expressing Atg1 in the epidermis was insufficient to remove GFP from the marked area (Fig 5A–C and Movie EV13B). Photobleaching of a larger area (1,098 µm2; 1–4 nuclei) led to the removal of GFP from this area, but the area remained dark only for a few seconds, after which the fluorescence signal re‐equilibrated to the same level as the surrounding area, which we interpret as diffusion of GFP into the bleached region from neighbouring areas (Fig 5A–C and Movie EV13C). Z‐sections of movies showed clear diffusion of GFP laterally within the epithelium, and never any basal or apical leakage (Movie EV14). This also indicates that the barrier function of the epidermis is not compromised.
Figure 5. Loss of lateral membrane integrity.
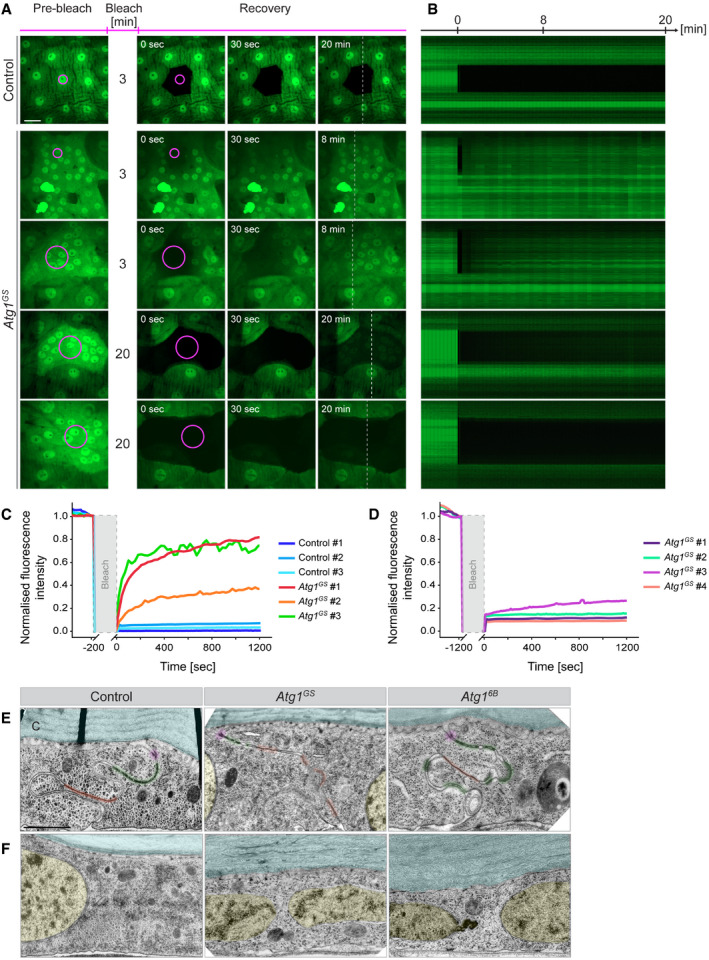
-
A–DFluorescence loss in photobleaching (FLIP) to test free cytoplasmic GFP motility within the epidermis. A small area (magenta circle; 179 or 1,098 µm2) was laser‐illuminated for the indicated times (3 or 20 min) in control or Atg1‐expressing epidermis also expressing free GFP. (A) Snapshots before bleaching and at 3 points of recovery. (B) Kymographs along the broken line in (A) during recovery. (C, D) Quantification of fluorescence recovery after bleaching, shown separately for 3 and 20 min bleaching protocols.
-
E, FElectron micrographs showing morphological defects or absence of lateral cell membranes in epithelia with upregulated autophagy. (E) Membrane domains with tight apposition between neighbouring cells are marked in magenta (adherens junctions), green (septate junction) and orange (gap junctions). (F) Nuclei (yellow) and lateral membranes in healthy epidermal cells cannot be shown in one image because they are too far apart, whereas when autophagy is upregulated, nuclei are often found close together and not separated by plasma membranes. C: cuticle (blue).
Data information: A–D n = 5–9 larvae for each FLIP protocol. Scale bars: A, 20 μm and E, F, 2 μm. Images from Movies [Link], [Link], [Link].
Source data are available online for this figure.
To assess the extent of the region connected to the bleached area, we increased the time of photobleaching to 20 min (Fig 5A, B and D, Movie EV15). This led to an ~85% reduction of the GFP signal in a much larger area (7,000–15,000 µm2, with 10–24 Nuclei), showing that the epidermal cells in this patch had formed an extended syncytium from which GFP entered the area being bleached. In most cases the fluorescence signal did not recover over the next 20 min, showing the syncytium had been exhausted of GFP and was separated from other parts of the epidermis. Thus, activation of autophagy induces the formation of syncytial patches in the unwounded epidermis.
Furthermore, transmission electron micrographs showed that lateral membranes were missing in many places (as judged by adjacent nuclei not being separated by a membrane), but the basal membrane was intact (Fig 5E and F). The epithelium also showed a range of other defects, from an abnormal basal lamina and apical cuticle to deformed nuclei (Appendix Figs S6A and B and S8B and C).
The effect of uncontrolled autophagy on cell morphology was not unique to the epidermis. The ectodermal driver (A58‐Gal4) also directs expression in the tracheal system, and the tracheal trunk and branches were severely distorted (Appendix Fig S6C). Similarly, in experiments where autophagy was induced in enterocytes of the gut and secretory cells of salivary glands (using NP1‐Gal4), these epithelia also lost lateral membrane markers and had abnormal shapes (Fig 6A and Appendix Fig S6D and E). Yet, as in the epidermis, the epithelial barrier function was not compromised, as confirmed by a Smurf barrier assay (Fig 6B).
Figure 6. Effect of uncontrolled autophagy on gut enterocytes and barrier function.
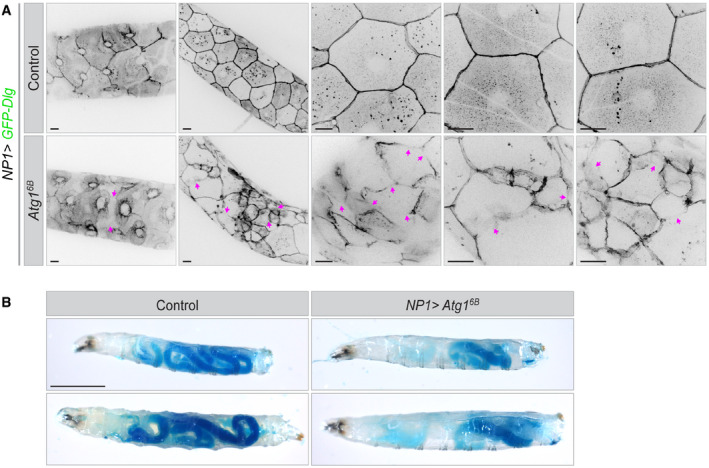
- Larval gut epithelia in which enterocytes express a marker for polarity and septate junctions, GFP‐Dlg using the NP1‐Gal4 driver together with or without Atg16B. Expression of Atg16B leads to disruption of lateral plasma membrane (magenta arrows). n = 32–44 larvae each genotype.
- Smurf gut barrier assay in anaesthetized, live larvae. Left, control larvae, right, larvae overexpressing Atg16B in the gut enterocytes under control of the NP1‐Gal4 driver. While the distribution of food in the gut of Atg16B‐expressing larvae was different from controls, there was no leakage of dye from the gut in any of the animals in three independent experiments (each with n = 30 larvae for each genotype).
Data information: Scale bars: A, 20 μm; B, 1,000 µm.
Together, these experiments indicate that activation of autophagy affects the lateral membrane of the epidermal cells leading to the formation of syncytia in the unwounded epidermis, which appears reminiscent of the syncytium observed during wound healing. Both loss of TORC1 and hyperactivity of Atg1 disrupt cell integrity in a specific manner: lateral membranes are lost, but basal and apical membranes remain intact but adopt inappropriate identities. As a consequence, autophagy must be kept repressed in epithelia for cell integrity and polarity to be retained, and this repression requires TORC1 activity.
TORC1–dependent autophagy alleviates nuclear defects in models of laminopathy
To investigate whether other membranes were affected by uncontrolled autophagy, we used fluorescent markers for the mitochondria (mito‐GFP), ER (KDEL‐RFP), Golgi (GalT‐GFP) and nuclear envelope (endogenously GFP‐tagged Kugelkern (Kuk), a Drosophila nuclear lamina protein). Reduction of TORC1 or expression of Atg1 had no apparent effect on the number or distribution of the mitochondria (Appendix Fig S7A). This fits with TEM images, which show a normal density and morphology of mitochondria. However, the number of KDEL‐ and GalT‐positive puncta was reduced, suggesting that they were also being depleted by autophagy (Appendix Fig S7B–E).
Nuclei marked with GFP‐Kuk in control cells appear round with a homogeneous GFP signal at the lamina (Fig 7A). Loss of TORC1 or Atg1 hyperactivation caused abnormalities in nuclear morphology and shape, disruption of the nuclear membrane with irregular GFP distribution and vesicular structures inside and outside of the nucleus (Fig 7A and Appendix Fig S8A). Other markers associated with the nuclear lamina were also abnormal. Bazooka/Par3, normally localized at the nuclear envelope, was not detectable when autophagy was activated in epidermal cells (Fig 4A and Appendix Fig S3A). TEM imaging supported these observations, in addition showing autophagosomes within the nucleus (Appendix Fig S8B and C). The defects were not restricted to nuclear morphology but extended to chromatin organization: an RFP‐tagged version of His2Av (endo:His2Av‐mRFP1) revealed abnormal chromatin condensation in cells with upregulated autophagy (Appendix Fig S8D and Movie EV16).
Figure 7. Effect of uncontrolled autophagy on nuclear morphology.
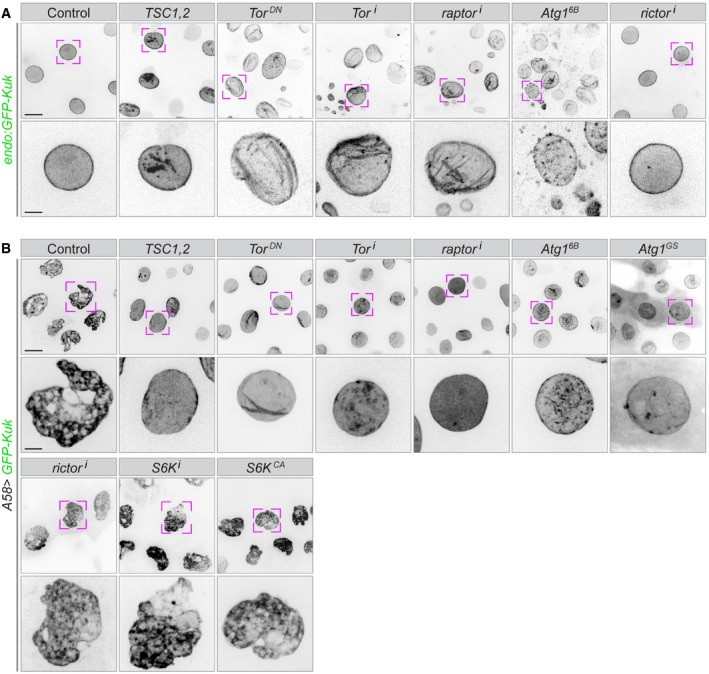
- The nuclear lamina is visualized using a GFP‐tag inserted into the endogenous locus of the Kugelkern (Kuk) gene in animals expressing the indicated overexpression or RNAi constructs in the epidermis.
- A GFP‐tagged transgenic construct of Kugelkern is co‐expressed with the indicated overexpression or RNAi constructs. High levels of Kuk induce lobulation and other nuclear defects, which are ameliorated if TOR is downregulated or autophagy upregulated, but not if other branches of the TOR signalling pathways (S6K or rictor) are modified.
Data information: The lower rows show higher magnification of the nuclei marked above. n = 20–30 larvae each genotype. Scale bars: A, B, upper rows, 20 μm; lower rows, 5 μm.
Defects in the nuclear lamina are associated with a spectrum of diseases known as laminopathies (Worman & Courvalin, 2005; Brandt et al, 2006; Scaffidi & Misteli, 2006; Polychronidou & Grobhans, 2011). In a Drosophila model for nuclear laminopathy, overexpression of Kuk or Lamin B (LamB) leads to the lobulation and increased folding of the nuclear envelope in the muscle and a reduced lifespan (Brandt et al, 2008; Polychronidou et al, 2010; Polychronidou & Grobhans, 2011; Petrovsky et al, 2018). Overexpression of GFP‐Kuk or RFP‐LamB in the epidermis also caused an abnormal morphology of nuclei but the larvae developed to fertile adult flies, without visible defects (Fig 7B and Appendix Fig S8E). Induction of autophagy by TORC1 reduction or Atg1 overexpression largely reduced the nuclear defects caused by elevated levels of Kuk or LamB (Fig 7B and Appendix Fig S8E), pointing to the possibility of the autophagy machinery competing for the membrane needed to increase the nuclear envelope. Conversely, this shows that elevated autophagy likely also depletes the nuclear envelope, possible via the ER. Thus, autophagy can counteract the nuclear defects seen in this laminopathy model.
Relevance of autophagy for plasma membrane integrity
We have seen that reduction of TORC1 induces autophagy and causes similar defects in epidermal cells as the more direct activation of autophagy by Atg1 does. Next, we tested whether TORC1 acts exclusively through inducing autophagy, and if so, whether the entire autophagic process has to be completed for the membrane defects to occur. Apart from repressing Atg1 activity, TORC1 also activates S6K. Constitutive activation of S6K (S6KCA ) did not improve any aspect of cellular defects caused by the TORC1 block, indicating that loss of S6K activity is not responsible for the defects caused by loss of TORC1 (Appendix Fig S9A). TORC2 reduction also did not improve any of the cellular defects derived by TORC1 reduction (Appendix Fig S9A).
To assay the different steps of the autophagic pathway, we first tested the efficiency of RNAi constructs in suppressing autophagy in the epidermis. As during wound healing, knockdown of Atg1 or Atg5 both reduced the number of Atg8a‐positive vesicles in TORC1‐depleted epidermis to control levels (Appendix Fig S9B and C). In contrast, knockdown of Atg6 or Atg7 reduced the number of Atg8a‐positive vesicles only slightly, similar to their limited effect on autophagosomes during wound healing (Appendix Fig S9B and C and Fig 1D). These two were, therefore, not suitable as tools to block later stages of autophagy in this system.
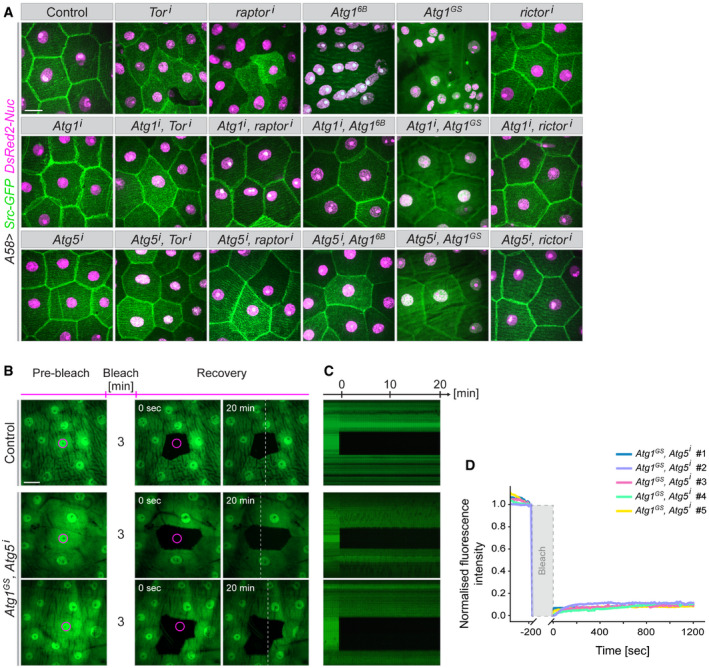
To test whether the effects of TORC1 on cell membrane were caused exclusively through the release of Atg1 activity and the autophagy pathway, we downregulated Atg1 or Atg5 together with TOR or raptor. In these larvae, the membrane defects caused by uncontrolled autophagy were largely abolished, except in a few cells at segment borders (Fig 8A and Appendix Fig S10A). The suppression of the effects of TORC1 knockdown is not due to titration of Gal4 activity because other constructs such as UAS‐rictori or UAS‐S6KCA did not have this effect (Appendix Fig S9A). This shows that Atg1 is needed to mediate the effects of TORC1 on lateral membranes. Similarly, downregulation of Atg5 suppressed the effects of both TORC1 reduction and Atg1 hyperactivity (Fig 8A and Appendix Fig S10A). We also confirmed with the FLIP assay that syncytium formation was reduced in Atg1GS, Atg5i larvae. GFP was no longer able to move into bleached areas from large surrounding regions; instead, only one cell was bleached, as in controls, or at most one neighbouring cell also lost fluorescence (Fig 8B–D and Movie EV17). Blocking autophagy also re‐established the proper distribution of DE‐cadherin, integrin and MyoII (Fig 9A and B, Appendix Fig S10B). The converse epistatic experiment (upregulating TORC1 signalling while also overexpressing Atg1) also partially suppressed the defects (Appendix Fig S11).
Figure 8. Epistasis of TOR and autophagy.
-
AThe indicated overexpression and RNAi constructs were co‐expressed with markers for the plasma membrane (Src‐GFP, green) and nuclei (DsRed2‐Nuc, magenta) in the larval epidermis. The effects of upregulating autophagy (top row) are suppressed when autophagy is blocked by simultaneously downregulating Atg1 or Atg5. n = 20–40 larvae each genotype.
- B–D
Data information: Scale bars: A, B, 20 μm. Images from Movie EV17.
Source data are available online for this figure.
Figure 9. Dependence of cellular defects on functional autophagy.
-
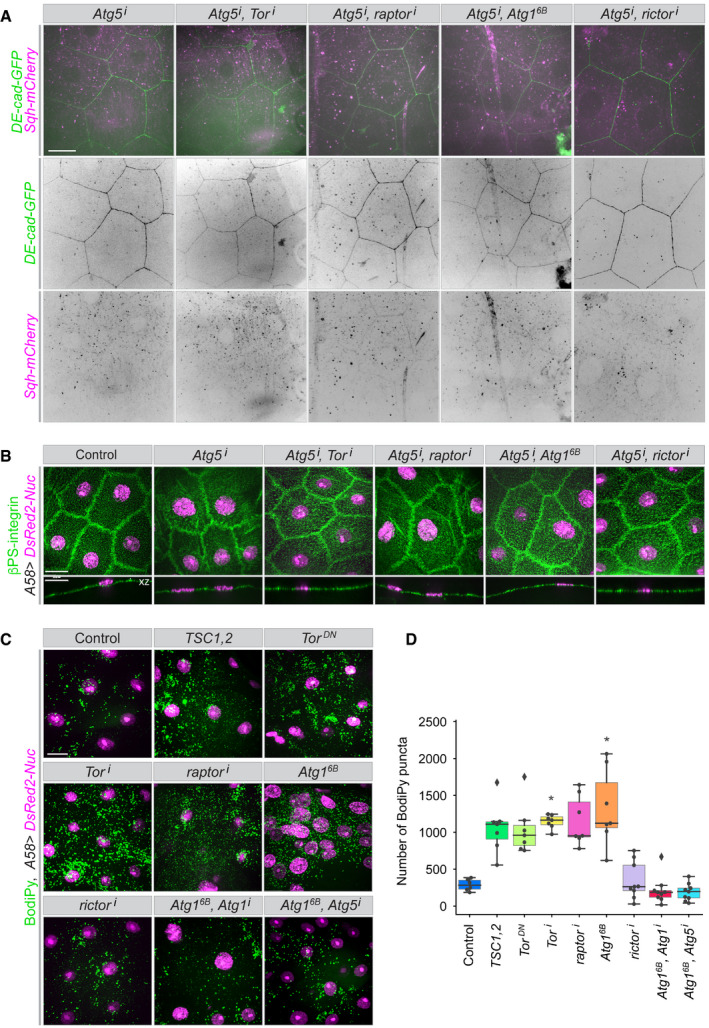
A, BBlocking autophagy by downregulating Atg5 suppresses the cellular defects caused by downregulation of TOR signalling: (A) loss of lateral membranes, formation of actin bundles; (B) integrin mislocalization (compare to Fig 4D and E and Appendix Fig S3E and S4C).
-
C, DAccumulation of neutral lipid in the cytoplasm under conditions of uncontrolled autophagy. (C) Fixed epidermis from larvae expressing the indicated constructs was stained with BodiPy 493/503 to mark lipid accumulations. (D) Quantification of the number of lipid puncta in an epidermal area of 10,000 µm2 in the indicated conditions. A–D, n = 7–20 larvae each genotype. We assumed unequal sample size and unequal variances and calculations were performed. Values are presented as box plots. Box plot elements are: centre line, median; box limits, upper and lower quartiles; whiskers, 1.5× interquartile range; points, outliers. For statistical hypothesis testing, independent and non‐parametric (Kruskal–Wallis) t‐tests were performed for the mean number of spots in control and experimental conditions. P‐values are indicated as follows: *P < 0.04 and lack of an asterisk means non‐significant (P > 0.123).
Data information: Scale bars: 20 μm. Images from Movie EV22.
Source data are available online for this figure.
In contrast, a chloroquine block of the last step of autophagy, that is, the fusion of the autophagosomes with lysosomes, resulted in the expected accumulation of Atg8a‐puncta but did not suppress the removal of lateral membrane resulting from TORC1 depletion or Atg1 activation (Appendix Fig S12A–C; compare to Fig 3A–C). Blocking the fusion step by genetic means, that is, by RNAi against Syx17, Vamp7 or Snap29 also did not supress the defects (Appendix Fig S12D). This shows that the removal of lateral membrane requires the formation of autophagosomes but not the completion of autophagy, that is, the final degradation of material engulfed by autophagosomes. It also suggests that the lateral plasma membrane material is incorporated into autophagosomes. Staining with the lipophilic dye BODIPY 493/503 confirmed the strong accumulation of lipids in cytoplasmic vesicles in TORC1‐depleted epithelia and other conditions where the lateral membranes were disrupted (Fig 9C and D).
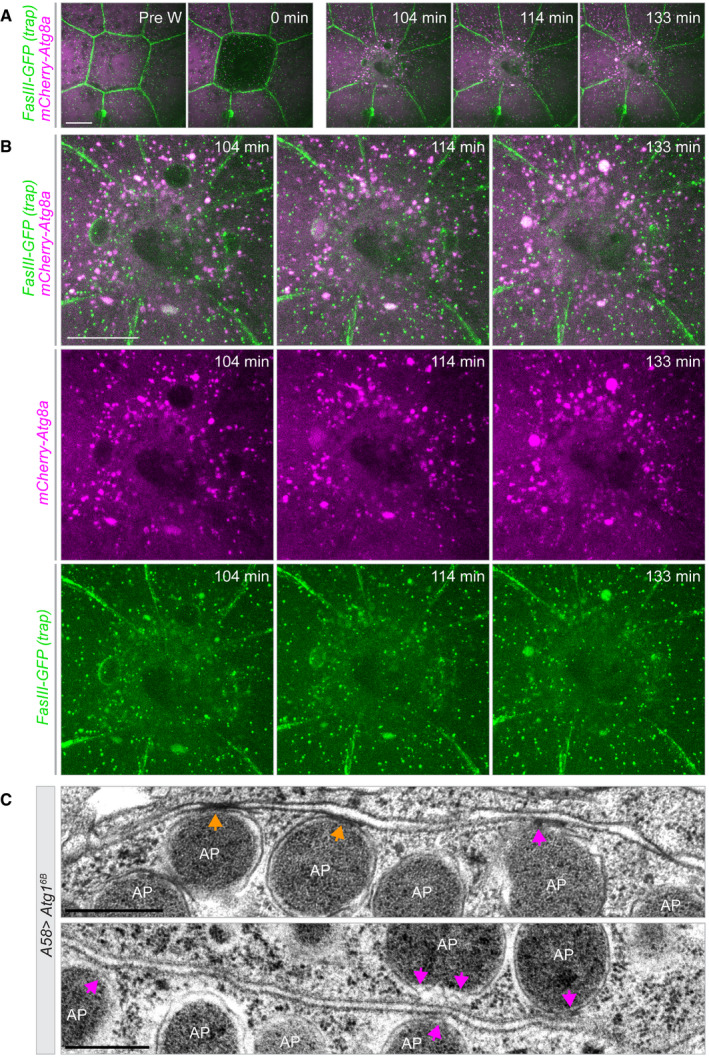
The notion that plasma membrane becomes associated with autophagosomes—whether as cargo or as part of the phagophore membrane—is further supported by wound‐healing experiments where we co‐expressed the trans‐membrane markers FasIII‐GFP or mCD8‐GFP with Atg8a‐mCherry. As wound healing progresses and autophagosomes appear, the markers become increasingly colocalized (Fig 10A and B, Appendix Fig S13A–C and Movies [Link], [Link], [Link]).
Figure 10. Colocalization of Atg8a and septate junction component FasIII during epidermal wound healing.
-
A, BTime‐lapse series of single‐cell wound healing in a larva expressing mCherry‐Atg8a (magenta) (A58>mCherry‐Atg8a) and endogenously tagged FasIII (GFP gene trap; green), a transmembrane component of septate junctions. (B) Higher magnification of the post‐wounding time points in (A). Images from Movie EV18; see also Movies EV19 and EV20. Each frame is a merge of 68 planes spaced 0.28 μm apart. A, n = 11 larvae
-
CTransmission electron microscopy of larval epidermis overexpressing Atg16B shows autophagosomes in direct contact with plasma membrane (magenta arrows) and at the sites of cell–cell junctions (orange arrows). The lower panel shows a higher magnification of Atg16B image in Fig 3D.
Data information: Scale bars: A, B 20 μm; C 500 nm.
Finally, further evidence for an association of autophagosomes with lateral plasma membrane comes from electron microscopy. Autophagosomes are seen in direct contact the plasma membrane, including at sites of cell–cell junctions (Fig 10C).
Activation of autophagy also affected the distribution of actomyosin. We tested whether this was an independent, parallel effect, or part of the mechanism to remodel the plasma membrane. To examine this, we interfered with MyoII activation with a dominant negative version of the MyoII, activator SqaT279A (“SqaKA“) or RNAi against Rok. These treatments led to the disappearance of the abnormal actomyosin fibres(Tang et al, 2011), but did not suppress the membrane defects (Appendix Figs S14A and B and S2E). Thus, abnormal MyoII activation is not responsible for the autophagy‐induced membrane defects.
The fact that elevated Atg1 activity was sufficient to induce the abnormalities suggests that they do not depend on other TORC1‐dependent signalling events. We directly tested whether these defects depended on autophagy by reducing Atg1 or Atg5 levels in the background of TORC1 reduction or Atg1 overactivation. This significantly restored wound healing (Appendix Figs S15A and B, Movies EV21 and EV22). In larvae with reduced TORC1 function and lowered Atg1 or Atg5 levels, the actin cables took 16–30 min instead of 40–60 min to form (normal epidermis: 10–12 min) and they were less thick. The total time to complete wound closure was similar as in normal epithelia (120 ± 20 min, depends on wound size). We had seen above that knockdown of Atg1 is not sufficient to completely suppress the effects of Atg1 overexpression on epithelial cell integrity. Therefore, here too, the remaining defects can probably be ascribed to a remaining slightly elevated level of Atg1 activity, both after TORC1 knockdown and Atg1 upregulation. Atg1 has been observed to affect phosphorylation of the activator, Sqa, and could thereby potentially directly modulate actomyosin in our experiments (Tang et al, 2011). However, the finding that knockdown of Atg5 suppresses the effects on the actomyosin and wound healing shows that the defects do not result from a direct action of Atg1 on myosin but again require the autophagic pathway to occur. They, therefore, seem to be an indirect effect of membrane being sequestered in autophagosomes.
Discussion
Our findings identify: (i) a novel role for the TORC1/autophagy pathway in controlling plasma membrane integrity and homeostasis, (ii) autophagy as a necessary and sufficient inducer of syncytium formation in the epithelium and during wound healing, (iii) wounding as a trigger for autophagy, and (iv) the plasma membrane as potential source for autophagosome formation. On the basis of our observations, we discuss the role of autophagy for syncytium formation, epithelial barrier function, phagocytosis, actomyosin organization and homeostasis of endomembranes.
Multinucleated cells form during development and ageing or under stress conditions in diverse tissues and organisms by different mechanisms such as cytokinesis failure, entosis, cell–cell fusion or by lateral membrane breaching (Pandit et al, 2013; Moein et al, 2020). We will concentrate only on the latter here, and, in particular, on the connection to autophagy.
A number of studies indicate a correlation between autophagy and syncytium formation. The best studied cases are the fusion of myoblasts during muscle fibre formation and of trophoblast cells during placenta formation (Kim et al, 2015; Fortini et al, 2016). In adult mouse, the stem cells of skeletal muscles (myosatellite cells) are quiescent until external stimuli, such as exercise or injury, trigger their re‐entry into the cell cycle and their differentiation to muscle progenitor cells (myoblasts). Myoblasts which have differentiated from adult muscle stem cells after external stimuli, such as exercise or injury, differentiate and fuse to form new multinucleated myofibers. TORC1‐dependent autophagy is induced during myogenesis in physiological and pathological conditions such as fasting, atrophy, exercise or injury (Fortini et al, 2016; Fujita et al, 2017). Similar to our observations in the epidermis, inhibition of autophagy in myoblasts in vitro interferes with fusion [but not myoblast differentiation], but the mechanism of action for this has not been determined (Fortini et al, 2016).
Trophoblast differentiation represents another example for a potential correlation between autophagy and syncytium formation. The outer trophoblast cells in early mammalian embryos fuse with each other and form a multinucleated syncytiotrophoblast, which later establishes direct contact with the maternal blood that reaches the placental surface. Apart from enabling the exchange of nutrients, the syncytiotrophoblast also provides a barrier against maternal‐fetal transmission of pathogens. Autophagy induces in both trophoblast layers, but the highest level of autophagy has been documented in the syncytiotrophoblast during cell fusion (Saito & Nakashima, 2013; Redman et al, 2020). Reduction of autophagy by Atg16L1 knockdown [even after rapamycin treatment] in both human and mouse placenta increases bacterial colonialization, but again it is not clear by what mechanism (Saito & Nakashima, 2013; Cao et al, 2016). Extrapolating from our own results, it is possible that also in this system, autophagy and syncytium formation are connected, in that autophagy leads to syncytilization and thereby establishes the barrier function of the syncytiotrophoblast.
This leads us to speculate that perhaps in the Drosophila epidermis too, syncytium formation during wound healing may serve a protective function. We have seen that autophagy and syncytium formation are not necessary for wound closure as such, but that autophagy induces events indicative of enhanced barrier formation such as elevated levels of integrin in the apical compartment, a thicker basal lamina and a thicker outer cuticular region (Dong et al, 2019). This may reinforce the freshly closed wound and protect it better against the external pathogens, especially in cases where the cuticle was compromised.
Another function of autophagy in the cells surrounding the wound may be to clear up debris. This is also seen in other instances. Autophagy is induced during Planarian regeneration in healthy cells adjacent to the wound and dead cells are phagocytosed by them (Gonzalez‐Estevez et al, 2007; Kang et al, 2019). The cells surrounding the wounds in our experiments, also engulfed the wound debris (Galko & Krasnow, 2004; Kakanj et al, 2016). Whether multinucleated cells phagocytose and digest debris more efficiently (Milde et al, 2015) remains to be seen.
Atg1/Ulk can activate myosin and drive autophagosome trafficking both in Drosophila and in mammalian cell lines (Tang et al, 2011). This may explain the appearance of large cortical and cytosolic actomyosin filaments when autophagy was deregulated. It was perhaps counterintuitive that when the syncytium was wounded, the rate of the formation of the actin cable around the wound and subsequent wound closure were reduced. However, if both autophagy and wound closure need myosin activation, it is conceivable that autophagy might compete for regulators of actin assembly or contractility and thereby slow down actomyosin cable formation and wound closure. We saw that activation of actomyosin is not the cause but the consequence of the lateral membrane disassembly so that plasma membrane defects and wound‐healing delay are completely improved when autophagy reduced.
It is becoming clear that besides organelles, such as ER, Golgi or mitochondria, also the plasma membrane can supply the lipids or membrane required for autophagosome formation (Ravikumar et al, 2010; Pavel & Rubinsztein, 2017). While we see the large reservoir of lateral membrane being depleted in the epidermis, we do not know whether the material that is removed gives rise to autophagosomal membrane or reaches this compartment as cargo. Some of the components acting in the early steps of autophagosome assembly such as Atg16 and Atg9 are localized at the plasma membrane under normal conditions, where they directly interact with junctional components such as connexin (component of gap junction) and Patj (component of the apical cell polarity complex); they act in the delivery of plasma membrane or lipids to autophagosomes and in a polarized cell could contribute to the identification of the membrane domain to be used for autophagosome assembly (Ravikumar et al, 2010; Bejarano et al, 2014; Iyyathurai et al, 2016; Wen et al, 2017; Kiss et al, 2020). In the Drosophila ovaries, Atg9 is localized on the lateral plasma membrane in nurse cells, and loss of it leads to syncytium formation (Kiss et al, 2020). Why mitochondria are spared in the epidermis, whereas all other organelle membranes are depleted, is not clear.
Finally, in a Drosophila pathophysiological model for nuclear laminopathies, the amount of nuclear membrane and its folding are increased (Brandt et al, 2006, 2008; Polychronidou et al, 2010; Polychronidou & Grobhans, 2011; Petrovsky et al, 2018). Overactivation of autophagy improves the morphology and integrity of the nuclear envelope caused by Lamin B or Kugelkern overexpression. In summary, fine tuning of autophagy activity during development and tissue homeostasis is important for plasma membrane integrity.
Materials and Methods
Fly stocks
Fly stocks and crosses were maintained at 25°C under a 12:12 h light/dark cycle at constant 65% humidity on standard fly food. All stocks were in a white genetic background. We used the A58‐Gal4 driver line to express UAS‐constructs in the epidermis (Galko & Krasnow, 2004) from the end of the first instar onward. Fly stocks are listed in Table 1, fly genotypes in Table 2.
Table 2.
List of genotypes used in experiments.
| Figure no. or Movie no. | Fly stock/cross |
|---|---|
| 1 A, B, C, D | w1118 ; UAS‐GFP‐Atg8a/+; A58‐Gal4/+ (Control) |
| 1 A, B, D | w1118 ; UAS‐GFP‐Atg8a/UAS‐Atg1i ; A58‐Gal4/+ |
| 1 A, B, D | w1118 ; UAS‐GFP‐Atg8a/UAS‐Atg5i ; A58‐Gal4/+ |
| 1 A, B, D | w1118 ; UAS‐GFP‐Atg8a/UAS‐Atg6i ; A58‐Gal4/+ |
| 1 D | w1118 ; UAS‐GFP‐Atg8a/+; A58‐Gal4/UAS‐Atg7i |
| 1 D | w1118 ; UAS‐GFP‐Atg8a/+; A58‐Gal4/UAS‐Atg12i |
| 1 D | w1118 ; UAS‐GFP‐Atg8a/+; A58‐Gal4/UAS‐TSC1i |
| 1 D | w1118 ; UAS‐GFP‐Atg8a/UAS‐RhebAV4 ; A58‐Gal4/+ |
| 1 E | w1118 ; +; A58‐Gal4, UAS‐Src‐GFP, UAS‐DsRed2‐Nuc/+ (Control) |
| 1 E | w1118 ; UAS‐Atg1i/+; A58‐Gal4, UAS‐Src‐GFP, UAS‐DsRed2‐Nuc/+ |
| 1 E | w1118 ; UAS‐Atg5i/+; A58‐Gal4, UAS‐Src‐GFP, UAS‐DsRed2‐Nuc/+ |
| 1 F | w1118 ; endo:DE‐Cad‐GFP, endo:Sqh‐mCherry/+; A58‐Gal4/+ (Control) |
| 1 F | w1118 ; endo:DE‐Cad‐GFP, endo:Sqh‐mCherry/UAS‐Atg1i ; A58‐Gal4/+ |
| 1 F | w1118 ; endo:DE‐Cad‐GFP, endo:Sqh‐mCherry/UAS‐Atg5i ; A58‐Gal4/+ |
| 2 B, C, D | w1118, hsflp/+; act5c> y + >Gal4, UAS‐GFP/+; ubi:DE‐cad‐RFP/+ (Control) |
| 2 B | w1118, hsflp/+; act5c > y + >Gal4, UAS‐GFP/UAS‐Atg1i ; ubi:DE‐cad‐RFP/+ |
| 2 B | w1118, hsflp/+; act5c > y + >Gal4, UAS‐GFP/UAS‐Atg5i ; ubi:DE‐cad‐RFP/+ |
| 3 A, B, C | w1118 ; UAS‐GFP‐Atg8a/+; A58‐Gal4/+ (Control) |
| 3 A, B, C | w1118 ; UAS‐GFP‐Atg8a/UAS‐AMPKαCA ; A58‐Gal4/+ |
| 3 A, B, C | w1118 ; UAS‐GFP‐Atg8a/+; A58‐Gal4/UAS‐Tori |
| 3 A, B, C | w1118 ; UAS‐GFP‐Atg8a/+; A58‐Gal4/UAS‐raptori |
| 3 A, B, C | w1118 ; UAS‐GFP‐Atg8a/+; A58‐Gal4/UAS‐Atg16B |
| 3 A, B, C | w1118 ; UAS‐GFP‐Atg8a/+; A58‐Gal4/UAS‐rictori |
| 3 A, B, C | w1118 ; UAS‐GFP‐Atg8a/+; A58‐Gal4/UAS‐TSC1i |
| 3 C | w1118 ; UAS‐GFP‐Atg8a/UAS‐TSC1, UAS‐TSC2; A58‐Gal4/+ |
| 3 C | w1118 ; UAS‐GFP‐Atg8a/UAS‐TorDN ; A58‐Gal4/+ |
| 3 C | w1118 ; UAS‐GFP‐Atg8a/UAS‐raptori‐2 ; A58‐Gal4/+ |
| 3 C | w1118 ; UAS‐GFP‐Atg8a/UAS‐RhebAV4 ; A58‐Gal4/+ |
| 3 D, E, F | w1118 ; +; A58‐Gal4, UAS‐Src‐GFP, UAS‐DsRed2‐Nuc/+ (Control) |
| 3 D, E, F | w1118 ; +; A58‐Gal4, UAS‐Src‐GFP, UAS‐DsRed2‐Nuc/UAS‐raptori |
| 3 D, E | w1118 ; +; A58‐Gal4, UAS‐Src‐GFP, UAS‐DsRed2‐Nuc/UAS‐Atg1GS, UAS‐GFP |
| 3 D, E, F | w1118 ; +; A58‐Gal4, UAS‐Src‐GFP, UAS‐DsRed2‐Nuc/UAS‐Atg16B |
| 3 F | w1118 ; UAS‐AMPKαCA/+; A58‐Gal4, UAS‐Src‐GFP, UAS‐DsRed2‐Nuc/+ |
| 3 F | w1118 ; UAS‐TSC1, UAS‐TSC2/+; A58‐Gal4, UAS‐Src‐GFP, UAS‐DsRed2‐Nuc/+ |
| 3 F | w1118 ; +; A58‐Gal4, UAS‐Src‐GFP, UAS‐DsRed2‐Nuc/UAS‐Tori |
| 3 F | w1118 ; +; A58‐Gal4, UAS‐Src‐GFP, UAS‐DsRed2‐Nuc/UAS‐rictori |
| 3 H | w1118 ; tub:Gal80ts/+; A58‐Gal4, UAS‐Src‐GFP, UAS‐DsRed2‐Nuc/UAS‐Atg16B |
| 4 A | w1118 ; UAS‐GFP‐Baz/+; A58‐Gal4/+ (Control) |
| 4 A | w1118 ; UAS‐GFP‐Baz/UAS‐TSC1, UAS‐TSC2; A58‐Gal4/+ |
| 4 A | w1118 ; UAS‐GFP‐Baz/UAS‐TorDN ; A58‐Gal4/+ |
| 4 A | w1118 ; UAS‐GFP‐Baz/+; A58‐Gal4/UAS‐Tori |
| 4 A | w1118 ; UAS‐GFP‐Baz/+; A58‐Gal4/UAS‐raptori |
| 4 A | w1118 ; UAS‐GFP‐Baz/+; A58‐Gal4/UAS‐Atg16B |
| 4 A | w1118 ; UAS‐GFP‐Baz/+; A58‐Gal4/UAS‐rictori |
| 4 B | w1118 ; endo:FasIII‐GFP/+; A58‐Gal4/+ (Control) |
| 4 B | w1118 ; endo: FasIII‐GFP/UAS‐TorDN ; A58‐Gal4/+ |
| 4 B | w1118 ; endo: FasIII‐GFP/+; A58‐Gal4/UAS‐Tori |
| 4 B | w1118 ; endo: FasIII‐GFP/+; A58‐Gal4/UAS‐Atg16B |
| 4 C | w1118, endo:Nrg‐GFP; +; A58‐Gal4/+ (Control) |
| 4 C | w1118, endo:Nrg‐GFP; UAS‐TorDN/+; A58‐Gal4/+ |
| 4 C | w1118, endo:Nrg‐GFP; +; A58‐Gal4/UAS‐Atg16B |
| 4 D | w1118 ; endo:DE‐cad‐GFP, endo:Sqh‐mCherry/+; A58‐Gal4/+ (Control) |
| 4 D | w1118 ; endo:DE‐cad‐GFP, endo:Sqh‐mCherry/UAS‐TSC1, UASTSC2; A58‐Gal4/+ |
| 4 D | w1118 ; endo:DE‐cad‐GFP, endo:Sqh‐mCherry/UAS‐TorDN ; A58‐Gal4/+ |
| 4 D | w1118 ; endo:DE‐cad‐GFP, endo:Sqh‐mCherry/+; A58‐Gal4/UAS‐raptori |
| 4 D | w1118 ; endo:DE‐cad‐GFP, endo:Sqh‐mCherry/+; A58‐Gal4/UAS‐Atg1GS, UAS‐GFP |
| 4 D | w1118 ; endo:DE‐cad‐GFP, endo:Sqh‐mCherry/+; A58‐Gal4/UAS‐Atg16B |
| 4 D | w1118 ; endo:DE‐cad‐GFP, endo:Sqh‐mCherry/+; A58‐Gal4/UAS‐rictori |
| 4 E | w1118 ; +; A58‐Gal4, UAS‐DsRed2‐Nuc/+ (Control) |
| 4 E | w1118 ; +; A58‐Gal4, UAS‐DsRed2‐Nuc/UAS‐Tori |
| 4 E | w1118 ; +; A58‐Gal4, UAS‐DsRed2‐Nuc/UAS‐raptori |
| 4 E | w1118 ; +; A58‐Gal4, UAS‐DsRed2‐Nuc/UAS‐Atg16B |
| 4 E | w1118 ; +; A58‐Gal4, UAS‐DsRed2‐Nuc/UAS‐rictori |
| 4 F | w1118 ; +; A58‐Gal4, UAS‐Src‐GFP, UAS‐DsRed2‐Nuc/+ (Control) |
| 5 A, B, C | w1118 ; UAS‐GFP/+; A58‐Gal4/+ (Control) |
| 5 A, B, C, D | w1118 ; +; A58‐Gal4/UAS‐Atg1GS, UAS‐GFP |
| 5 E, F | w1118 ; +; A58‐Gal4, UAS‐Src‐GFP, UAS‐DsRed2‐Nuc/+ (Control) |
| 5 E, F | w1118 ; +; A58‐Gal4, UAS‐Src‐GFP, UAS‐DsRed2‐Nuc/UAS‐Atg1GS, UAS‐GFP |
| 5 E, F | w1118 ; +; A58‐Gal4, UAS‐Src‐GFP, UAS‐DsRed2‐Nuc/UAS‐Atg16B |
| 6 A | w1118 ; NP1‐Gal4/+; UAS‐GFP‐Dlg/+ |
| 6 A | w1118 ; NP1‐Gal4/+; UAS‐GFP‐Dlg/UAS‐Atg16B |
| 6 B | w1118 ; NP1‐Gal4/+; + |
| 6 B | w1118 ; NP1‐Gal4/+; UAS‐Atg16B/+ |
| 7 A | w1118 ; endo:GFP‐Kuk/+; A58‐Gal4/+ (Control) |
| 7 A | w1118 ; endo:GFP‐Kuk/UAS‐TSC1, UAS‐TSC2; A58‐Gal4/+ |
| 7 A | w1118 ; endo:GFP‐Kuk/UAS‐TorDN ; A58‐Gal4/+ |
| 7 A | w1118 ; endo:GFP‐Kuk/+; A58‐Gal4/UAS‐Tori |
| 7 A | w1118 ; endo:GFP‐Kuk/+; A58‐Gal4/UAS‐raptori |
| 7 A | w1118 ; endo:GFP‐Kuk/+; A58‐Gal4/UAS‐Atg16B |
| 7 A | w1118 ; endo:GFP‐Kuk/+; A58‐Gal4/UAS‐rictori |
| 7 B | w1118 ; UAS‐GFP‐Kuk/+; A58‐Gal4/+ (Control) |
| 7 B | w1118 ; UAS‐GFP‐Kuk/UAS‐TSC1, UASTSC2; A58‐Gal4/+ |
| 7 B | w1118 ; UAS‐GFP‐Kuk/UAS‐TorDN ; A58‐Gal4/+ |
| 7 B | w1118 ; UAS‐GFP‐Kuk/+; A58‐Gal4/UAS‐Tori |
| 7 B | w1118 ; UAS‐GFP‐Kuk/+; A58‐Gal4/UAS‐raptori |
| 7 B | w1118 ; UAS‐GFP‐Kuk/+; A58‐Gal4/UAS‐Atg1GS, UAS‐GFP |
| 7 B | w1118 ; UAS‐GFP‐Kuk/+; A58‐Gal4/UAS‐Atg16B |
| 7 B | w1118 ; UAS‐GFP‐Kuk/+; A58‐Gal4/UAS‐rictori |
| 7 B | w1118 ; UAS‐GFP‐Kuk/+; A58‐Gal4/UAS‐S6Ki |
| 7 B | w1118 ; UAS‐GFP‐Kuk/+; A58‐Gal4/UAS‐S6KCA |
| 8 A | w1118 ; +; A58‐Gal4, UAS‐Src‐GFP, UAS‐DsRed2‐Nuc/+ (Control) |
| 8 A | w1118 ; +; A58‐Gal4, UAS‐Src‐GFP, UAS‐DsRed2‐Nuc/UAS‐Tori |
| 8 A | w1118 ; +; A58‐Gal4, UAS‐Src‐GFP, UAS‐DsRed2‐Nuc/UAS‐raptori |
| 8 A | w1118 ; +; A58‐Gal4, UAS‐Src‐GFP, UAS‐DsRed2‐Nuc/UAS‐Atg16B |
| 8 A | w1118 ; +; A58‐Gal4, UAS‐Src‐GFP, UAS‐DsRed2‐Nuc/UAS‐rictori |
| 8 A | w1118 ; UAS‐Atg1i/+; A58‐Gal4, UAS‐Src‐GFP, UAS‐DsRed2‐Nuc/+ |
| 8 A | w1118 ; UAS‐Atg1i/+; A58‐Gal4, UAS‐Src‐GFP, UAS‐DsRed2‐Nuc/UAS‐Tori |
| 8 A | w1118 ; UAS‐Atg1i/+; A58‐Gal4, UAS‐Src‐GFP, UAS‐DsRed2‐Nuc/UAS‐raptori |
| 8 A | w1118 ; UAS‐Atg1i/+; A58‐Gal4, UAS‐Src‐GFP, UAS‐DsRed2‐Nuc/UAS‐Atg16B |
| 8 A | w1118 ; UAS‐At1i/+; A58‐Gal4, UAS‐Src‐GFP, UAS‐DsRed2‐Nuc/ UAS‐Atg1GS, UAS‐GFP |
| 8 A | w1118 ; UAS‐Atg1i/+; A58‐Gal4, UAS‐Src‐GFP, UAS‐DsRed2‐Nuc/UAS‐rictori |
| 8 A | w1118 ; UAS‐Atg5i/+; A58‐Gal4, UAS‐Src‐GFP, UAS‐DsRed2‐Nuc/+ |
| 8 A | w1118 ; UAS‐Atg5i/+; A58‐Gal4, UAS‐Src‐GFP, UAS‐DsRed2‐Nuc/UAS‐Tori |
| 8 A | w1118 ; UAS‐Atg5i/+; A58‐Gal4, UAS‐Src‐GFP, UAS‐DsRed2‐Nuc/UAS‐raptori |
| 8 A | w1118 ; UAS‐Atg5i/+; A58‐Gal4, UAS‐Src‐GFP, UAS‐DsRed2‐Nuc/UAS‐Atg16B |
| 8 A | w1118 ; UAS‐Atg5i/+; A58‐Gal4, UAS‐Src‐GFP, UAS‐DsRed2‐Nuc/ UAS‐Atg1GS, UAS‐GFP |
| 8 A | w1118 ; UAS‐Atg5i/+; A58‐Gal4, UAS‐Src‐GFP, UAS‐DsRed2‐Nuc/UAS‐rictori |
| 8 B, C, D | w1118 ; UAS‐GFP/+; A58‐Gal4/+ (Control) |
| 8 B, C, D | w1118 ; UAS‐Atg5i/+; A58‐Gal4/UAS‐Atg1GS, UAS‐GFP |
| 9 A | w1118 ; endo:DE‐cad‐GFP, endo:Sqh‐mCherry/UAS‐Atg5i ; A58‐Gal4/+ |
| 9 A | w1118 ; endo:DE‐cad‐GFP, endo:Sqh‐mCherry/UAS‐Atg5i ; A58‐Gal4/ UAS‐Tori |
| 9 A | w1118 ; endo:DE‐cad‐GFP, endo:Sqh‐mCherry/UAS‐Atg5i ; A58‐Gal4/UAS‐raptori |
| 9 A | w1118 ; endo:DE‐cad‐GFP, endo:Sqh‐mCherry/UAS‐Atg5i ; A58‐Gal4/UAS‐Atg16B |
| 9 A | w1118 ; endo:DE‐cad‐GFP, endo:Sqh‐mCherry/UAS‐Atg5i ; A58‐Gal4/UAS‐rictori |
| 9 B | w1118 ; +; A58‐Gal4, UAS‐DsRed2‐Nuc/+ (Control) |
| 9 B | w1118 ; UAS‐Atg5i/+; A58‐Gal4, UAS‐DsRed2‐Nuc/+ |
| 9 B | w1118 ; UAS‐Atg5i/+; A58‐Gal4, UAS‐DsRed2‐Nuc/UAS‐Tori |
| 9 B | w1118 ; UAS‐Atg5i/+; A58‐Gal4, UAS‐DsRed2‐Nuc/UAS‐raptori |
| 9 B | w1118 ; UAS‐Atg5i/+; A58‐Gal4, UAS‐DsRed2‐Nuc/UAS‐Atg16B |
| 9 B | w1118 ; UAS‐Atg5i/+; A58‐Gal4, UAS‐DsRed2‐Nuc/UAS‐rictori |
| 9 C, D | w1118 ; +; A58‐Gal4, UAS‐DsRed2‐Nuc/+ (Control) |
| 9 C, D | w1118 ; UAS‐TSC1, UAS‐TSC2/+; A58‐Gal4, UAS‐DsRed2‐Nuc/+ |
| 9 C, D | w1118 ; UAS‐TorDN/+; A58‐Gal4, UAS‐DsRed2‐Nuc/+ |
| 9 C, D | w1118 ; +; A58‐Gal4, UAS‐DsRed2‐Nuc/UAS‐Tori |
| 9 C, D | w1118 ; +; A58‐Gal4, UAS‐DsRed2‐Nuc/UAS‐raptori |
| 9 C, D | w1118 ; +; A58‐Gal4, UAS‐DsRed2‐Nuc/UAS‐Atg16B |
| 9 C, D | w1118 ; +; A58‐Gal4, UAS‐DsRed2‐Nuc/UAS‐rictori |
| 9 C, D | w1118 ; UAS‐Atg1i/+; A58‐Gal4, UAS‐DsRed2‐Nuc/UAS‐Atg16B |
| 9 C, D | w1118 ; UAS‐Atg5i/+; A58‐Gal4, UAS‐DsRed2‐Nuc/UAS‐Atg16B |
| 10 A, B | w1118 ; endo:FasIII‐GFP/UAS‐mCherry‐Ag8a; A58‐Gal4/+ (Control) |
| 10 C | w1118 ; +; A58‐Gal4, UAS‐Src‐GFP, UAS‐DsRed2‐Nuc/UAS‐Atg16B |
| S1 | w1118 ; UAS‐mCherry‐Ag8a/+; A58‐Gal4/+ |
| S2 A, B | w1118 ; UAS‐LAMP1‐GFP/+; A58‐Gal4, UAS‐DsRed2‐Nuc/+ (Control) |
| S2 A, B | w1118 ; UAS‐LAMP1‐GFP/UAS‐TSC1, UAS‐TSC2/+; A58‐Gal4, UAS‐DsRed2‐Nuc/+ |
| S2 A, B | w1118 ; UAS‐LAMP1‐GFP/UAS‐TorDN ; A58‐Gal4, UAS‐DsRed2‐Nuc/+ |
| S2 A, B | w1118 ; UAS‐LAMP1‐GFP/+; A58‐Gal4, UAS‐DsRed2‐Nuc/UAS‐Tori |
| S2 A, B | w1118 ; UAS‐LAMP1‐GFP/+; A58‐Gal4, UAS‐DsRed2‐Nuc/UAS‐raptori |
| S2 A, B | w1118 ; UAS‐LAMP1‐GFP/+; A58‐Gal4, UAS‐DsRed2‐Nuc/UAS‐Atg16B |
| S2 A, B | w1118 ; UAS‐LAMP1‐GFP/+; A58‐Gal4, UAS‐DsRed2‐Nuc/UAS‐rictori |
| S2 C, | w1118 ; tub:Gal80ts/+; A58‐Gal4, UAS‐Src‐GFP, UAS‐DsRed2‐Nuc/+ (Control) |
| S2 C, | w1118 ; tub:Gal80ts/+; A58‐Gal4, UAS‐Src‐GFP, UAS‐DsRed2‐Nuc/UAS‐Tori |
| S2 C, | w1118 ; tub:Gal80ts/+; A58‐Gal4, UAS‐Src‐GFP, UAS‐DsRed2‐Nuc/UAS‐raptori |
| S2 C, | w1118 ; tub:Gal80ts/+; A58‐Gal4, UAS‐Src‐GFP, UAS‐DsRed2‐Nuc/UAS‐Atg16B |
| S3 A, B | w1118 ; +; A58‐Gal4, UAS‐DsRed2‐Nuc/+ (Control) |
| S3 A, B | w1118 ; UAS‐TorDN/+; A58‐Gal4, UAS‐DsRed2‐Nuc/+ |
| S3 C | w1118 ; +; A58‐Gal4/+ (Control) |
| S3 C | w1118 ; +; A58‐Gal4/ UAS‐Atg16B |
| S3 D | w1118, endo:Nrg‐GFP; +; A58‐Gal4/+ (Control) |
| S3 D | w1118, endo:Nrg‐GFP; +; A58‐Gal4/UAS‐Atg16B |
| S3 E | w1118 ; endo:DE‐cad‐GFP, endo:Sqh‐mCherry/+; A58‐Gal4/+ (Control) |
| S3 E | w1118 ; endo:DE‐cad‐GFP, endo:Sqh‐mCherry/+; A58‐Gal4/UAS‐Tori |
| S3 E | w1118 ; endo:DE‐cad‐GFP, endo:Sqh‐mCherry/+; A58‐Gal4/UAS‐TSC1i |
| S3 E | w1118 ; endo:DE‐cad‐GFP, endo:Sqh‐mCherry/UAS‐RhoAi ; A58‐Gal4/+ |
| S3 E | w1118 ; endo:DE‐cad‐GFP, endo:Sqh‐mCherry/UAS‐Roki ; A58‐Gal4/+ |
| S3 E | w1118 ; endo:DE‐cad‐GFP, endo:Sqh‐mCherry/+; A58‐Gal4/UAS‐S6KCA |
| S4 A | w1118 ; +; A58‐Gal4, UAS‐Src‐GFP, UAS‐DsRed2‐Nuc/+ (Control) |
| S4 A | w1118 ; +; A58‐Gal4, UAS‐Src‐GFP, UAS‐DsRed2‐Nuc/UAS‐Atg16B |
| S4 B | w1118 ; +; A58‐Gal4, UAS‐mCD8‐GFP/+ (Control) |
| S4 B | w1118 ; +; A58‐Gal4, UAS‐mCD8‐GFP/UAS‐Atg16B |
| S4 C | w1118 ; +; A58‐Gal4, UAS‐DsRed2‐Nuc/+ (Control) |
| S4 C | w1118 ; +; A58‐Gal4, UAS‐DsRed2‐Nuc/UAS‐Tori |
| S4 C | w1118 ; +; A58‐Gal4, UAS‐DsRed2‐Nuc/UAS‐raptori |
| S4 C | w1118 ; +; A58‐Gal4, UAS‐DsRed2‐Nuc/UAS‐Atg16B |
| S4 C | w1118 ; +; A58‐Gal4, UAS‐DsRed2‐Nuc/UAS‐rictori |
| S5 A | w1118 ; endo:DE‐cad‐GFP, endo:Sqh‐mCherry/+; A58‐Gal4/+ (Control) |
| S5 A | w1118 ; endo:DE‐cad‐GFP, endo:Sqh‐mCherry/+; A58‐Gal4/UAS‐Tori |
| S5 A | w1118 ; endo:DE‐cad‐GFP, endo:Sqh‐mCherry/+; A58‐Gal4/UAS‐raptori |
| S5 A | w1118 ; endo:DE‐cad‐GFP, endo:Sqh‐mCherry/+; A58‐Gal4/UAS‐Atg1GS, UAS‐GFP |
| S5 A | w1118 ; endo:DE‐cad‐GFP, endo:Sqh‐mCherry/+; A58‐Gal4/UAS‐Atg16B |
| S5 B | w1118 ; +; A58‐Gal4, UAS‐Src‐GFP, UAS‐DsRed2‐Nuc/+ (Control) |
| S5 B | w1118 ; +; A58‐Gal4, UAS‐Src‐GFP, UAS‐DsRed2‐Nuc/UAS‐Atg16B |
| S5 B | w1118 ; +; A58‐Gal4, UAS‐Src‐GFP, UAS‐DsRed2‐Nuc/UAS‐rictori |
| S6 A, B | w1118 ; +; A58‐Gal4, UAS‐Src‐GFP, UAS‐DsRed2‐Nuc/+ (Control) |
| S6 A, B | w1118 ; UAS‐TorDN/+; A58‐Gal4, UAS‐Src‐GFP, UAS‐DsRed2‐Nuc/+ |
| S6 A, B | w1118 ; +; A58‐Gal4, UAS‐Src‐GFP, UAS‐DsRed2‐Nuc/UAS‐raptori |
| S6 A, B | w1118 ; +; A58‐Gal4, UAS‐Src‐GFP, UAS‐DsRed2‐Nuc/UAS‐Atg1GS, UAS‐GFP |
| S6 A, B | w1118 ; +; A58‐Gal4, UAS‐Src‐GFP, UAS‐DsRed2‐Nuc/UAS‐Atg16B |
| S6 C | w1118 ; UAS‐GFP/+; A58‐Gal4/+ (Control) |
| S6 C | w1118 ; +; A58‐Gal4/UAS‐Atg1GS, UAS‐GFP |
| S6 D, E | w1118 ; NP1‐Gal4/UAS‐GFP‐Baz; + (Control) |
| S6 D, E | w1118 ; NP1‐Gal4/UAS‐GFP‐Baz; +/UAS‐raptori |
| S6 D, E | w1118 ; NP1‐Gal4/UAS‐GFP‐Baz; UAS‐Atg16B /+ |
| S6 E | w1118 ; NP1‐Gal4/UAS‐TSC1, UAS‐TSC2; UAS‐GFP‐Baz/+ |
| S7 A | w1118 ; UAS‐mito‐GFP/+; A58‐Gal4, UAS‐DsRed2‐Nuc/+ (Control) |
| S7 A | w1118 ; UAS‐mito‐GFP/UAS‐TorDN ; A58‐Gal4, UAS‐DsRed2‐Nuc/+ |
| S7 A | w1118 ; UAS‐mito‐GFP/+; A58‐Gal4, UAS‐DsRed2‐Nuc/UAS‐raptori |
| S7 A | w1118 ; UAS‐mito‐GFP/+; A58‐Gal4, UAS‐DsRed2‐Nuc/UAS‐Atg16B |
| S7 B, C | w1118 ; UAS‐RFP‐KDEL/+; A58‐Gal4/+ (Control) |
| S7 B, C | w1118 ; UAS‐RFP‐KDEL/UAS‐TSC1, UAS‐TSC2; A58‐Gal4/+ |
| S7 B, C | w1118 ; UAS‐RFP‐KDEL/UAS‐TorDN ; A58‐Gal4/+ |
| S7 B, C | w1118 ; UAS‐RFP‐KDEL/+; A58‐Gal4/UAS‐Tori |
| S7 B, C | w1118 ; UAS‐RFP‐KDEL/+; A58‐Gal4/UAS‐raptori |
| S7 B, C | w1118 ; UAS‐RFP‐KDEL/+; A58‐Gal4/UAS‐Atg16B |
| S7 B, C | w1118 ; UAS‐RFP‐KDEL/+; A58‐Gal4/UAS‐rictori |
| S7 D, E | w1118 ; UAS‐GFP‐Golgi/+; A58‐Gal4/+ (Control) |
| S7 D, E | w1118 ; UAS‐GFP‐Golgi/UAS‐TSC1, UAS‐TSC2; A58‐Gal4/+ |
| S7 D, E | w1118 ; UAS‐GFP‐Golgi/UAS‐TorDN ; A58‐Gal4/+ |
| S7 D, E | w1118 ; UAS‐GFP‐Golgi/+; A58‐Gal4/UAS‐Tori |
| S7 D, E | w1118 ; UAS‐GFP‐Golgi/+; A58‐Gal4/UAS‐raptori |
| S7 D, E | w1118 ; UAS‐GFP‐Golgi/+; A58‐Gal4/UAS‐Atg16B |
| S8 A | w1118 ; endo:Klaroid‐GFP/+; A58‐Gal4, UAS‐DsRed2‐Nuc/+ (Control) |
| S8 A | w1118 ; endo:Klaroid‐GFP/+; A58‐Gal4, UAS‐DsRed2‐Nuc/UAS‐Atg16B |
| S8 B, C | w1118 ; +; A58‐Gal4, UAS‐Src‐GFP, UAS‐DsRed2‐Nuc/+ (Control) |
| S8 B, C | w1118 ; +; A58‐Gal4, UAS‐Src‐GFP, UAS‐DsRed2‐Nuc/UAS‐raptori |
| S8 B, C | w1118 ; +; A58‐Gal4, UAS‐Src‐GFP, UAS‐DsRed2‐Nuc/UAS‐Atg1GS, UAS‐GFP |
| S8 B, C | w1118 ; +; A58‐Gal4, UAS‐Src‐GFP, UAS‐DsRed2‐Nuc/UAS‐Atg16B |
| S8 D | w1118 ; endo:His2Av‐RFP/+; A58‐Gal4/+ |
| S8 D | w1118 ; endo:His2Av‐RFP/ UAS‐TorDN ; A58‐Gal4/+ (Control) |
| S8 D | w1118 ; endo:His2Av‐RFP/+; A58‐Gal4/UAS‐Atg1GS, UAS‐GFP |
| S8 D | w1118 ; endo:His2Av‐RFP/+; A58‐Gal4/ UAS‐Atg16B |
| S8 D | w1118 ; endo:His2Av‐RFP/+; A58‐Gal4/UAS‐rictori |
| S8 E | w1118 ; UAS‐RFP‐LamB/+; A58‐Gal4/+ (Control) |
| S8 E | w1118 ; UAS‐RFP‐LamB/+; A58‐Gal4/UAS‐Atg16B |
| S8 E | w1118 ; UAS‐RFP‐LamB/+; A58‐Gal4/ UAS‐Atg1GS, UAS‐GFP |
| S9 A | w1118 ; +; A58‐Gal4, UAS‐Src‐GFP, UAS‐DsRed2‐Nuc/+ (Control) |
| S9 A | w1118 ; UAS‐TorDN/+; A58‐Gal4, UAS‐Src‐GFP, UAS‐DsRed2‐Nuc/+ |
| S9 A | w1118 ; UAS‐raptori‐2/+; A58‐Gal4, UAS‐Src‐GFP, UAS‐DsRed2‐Nuc/+ |
| S9 A | w1118 ; +; A58‐Gal4, UAS‐Src‐GFP, UAS‐DsRed2‐Nuc/UAS‐S6KCA |
| S9 A | w1118 ; UAS‐TorDN/+; A58‐Gal4, UAS‐Src‐GFP, UAS‐DsRed2‐Nuc/UAS‐S6KCA |
| S9 A | w1118 ; UAS‐raptori‐2/+; A58‐Gal4, UAS‐Src‐GFP, UAS‐DsRed2‐Nuc/UAS‐S6KCA |
| S9 A | w1118 ; +; A58‐Gal4, UAS‐Src‐GFP, UAS‐DsRed2‐Nuc/UAS‐rictori |
| S9 A | w1118 ; UAS‐TorDN/+; A58‐Gal4, UAS‐Src‐GFP, UAS‐DsRed2‐Nuc/UAS‐rictori |
| S9 A | w1118 ; UAS‐raptori‐2/+; A58‐Gal4, UAS‐Src‐GFP, UAS‐DsRed2‐Nuc/UAS‐rictori |
| S9 A | w1118 ; +; A58‐Gal4, UAS‐Src‐GFP, UAS‐DsRed2‐Nuc/UAS‐Atg12i |
| S9 A | w1118 ; UAS‐TorDN/+; A58‐Gal4, UAS‐Src‐GFP, UAS‐DsRed2‐Nuc/UAS‐Atg12i |
| S9 A | w1118 ; UAS‐raptori‐2/+; A58‐Gal4, UAS‐Src‐GFP, UAS‐DsRed2‐Nuc/UAS‐Atg12i |
| S9 A | w1118 ; +; A58‐Gal4, UAS‐Src‐GFP, UAS‐DsRed2‐Nuc/UAS‐Atg7i |
| S9 A | w1118 ; UAS‐TorDN/+; A58‐Gal4, UAS‐Src‐GFP, UAS‐DsRed2‐Nuc/UAS‐Atg7i |
| S9 A | w1118 ; UAS‐raptori‐2/+; A58‐Gal4, UAS‐Src‐GFP, UAS‐DsRed2‐Nuc/UAS‐Atg7i |
| S9 A | w1118 ; UAS‐Atg6i/+; A58‐Gal4, UAS‐Src‐GFP, UAS‐DsRed2‐Nuc/+ |
| S9 A | w1118 ; UAS‐Atg6i/+; A58‐Gal4, UAS‐Src‐GFP, UAS‐DsRed2‐Nuc/UAS‐Tori |
| S9 A | w1118 ; UAS‐Atg6i/+; A58‐Gal4, UAS‐Src‐GFP, UAS‐DsRed2‐Nuc/UAS‐raptori |
| S9 A | w1118 ; UAS‐Atg6i/+; A58‐Gal4, UAS‐Src‐GFP, UAS‐DsRed2‐Nuc/UAS‐Atg16B |
| S9 B, C | w1118 ; UAS‐GFP‐Atg8a/+; A58‐Gal4/+ (Control) |
| S9 B | w1118 ; UAS‐GFP‐Atg8a/+; A58‐Gal4/UAS‐Tori |
| S9 B | w1118 ; UAS‐GFP‐Atg8a/+; A58‐Gal4/UAS‐raptori |
| S9 B | w1118 ; UAS‐GFP‐Atg8a/+; A58‐Gal4/UAS‐Atg16B |
| S9 B, C | w1118 ; UAS‐GFP‐Atg8a/UAS‐Atg1i ; A58‐Gal4/+ |
| S9 B, C | w1118 ; UAS‐GFP‐Atg8a/UAS‐Atg1i ; A58‐Gal4/UAS‐Tori |
| S9 B, C | w1118 ; UAS‐GFP‐Atg8a/UAS‐Atg1i ; A58‐Gal4/UAS‐raptori |
| S9 B, C | w1118 ; UAS‐GFP‐Atg8a/UAS‐Atg1i ; A58‐Gal4/UAS‐Atg16B |
| S9 B, C | w1118 ; UAS‐GFP‐Atg8a/UAS‐Atg5i ; A58‐Gal4/+ |
| S9 B, C | w1118 ; UAS‐GFP‐Atg8a/UAS‐Atg5i ; A58‐Gal4/UAS‐Tori |
| S9 B, C | w1118 ; UAS‐GFP‐Atg8a/UAS‐Atg5i ; A58‐Gal4/UAS‐raptori |
| S9 B, C | w1118 ; UAS‐GFP‐Atg8a/UAS‐Atg5i ; A58‐Gal4/UAS‐Atg16B |
| S9 B, C | w1118 ; UAS‐GFP‐Atg8a/UAS‐Atg6i ; A58‐Gal4/+ |
| S9 B, C | w1118 ; UAS‐GFP‐Atg8a/UAS‐Atg6i ; A58‐Gal4/UAS‐Tori |
| S9 B, C | w1118 ; UAS‐GFP‐Atg8a/UAS‐Atg6i ; A58‐Gal4/UAS‐raptori |
| S9 B, C | w1118 ; UAS‐GFP‐Atg8a/UAS‐Atg6i ; A58‐Gal4/UAS‐Atg16B |
| S9 B | w1118 ; UAS‐GFP‐Atg8a/UAS‐TorDN ; A58‐Gal4/+ |
| S9 B, C | w1118 ; UAS‐GFP‐Atg8a/+; A58‐Gal4/UAS‐Atg7i |
| S9 B, C | w1118 ; UAS‐GFP‐Atg8a/UAS‐TorDN ; A58‐Gal4/UAS‐Atg7i |
| S9 B, C | w1118 ; UAS‐GFP‐Atg8a/UAS‐raptori‐2 ; A58‐Gal4/UAS‐Atg7i |
| S10 A | w1118 ; +; A58‐Gal4, UAS‐Src‐GFP, UAS‐DsRed2‐Nuc/+ (Control) |
| S10 A | w1118 ; +; A58‐Gal4, UAS‐Src‐GFP, UAS‐DsRed2‐Nuc/UAS‐Tori |
| S10 A | w1118 ; +; A58‐Gal4, UAS‐Src‐GFP, UAS‐DsRed2‐Nuc/UAS‐raptori |
| S10 A | w1118 ; +; A58‐Gal4, UAS‐Src‐GFP, UAS‐DsRed2‐Nuc/UAS‐Atg16B |
| S10 A | w1118 ; +; A58‐Gal4, UAS‐Src‐GFP, UAS‐DsRed2‐Nuc/UAS‐rictori |
| S10 A | w1118 ; UAS‐Atg1i/+; A58‐Gal4, UAS‐Src‐GFP, UAS‐DsRed2‐Nuc/+ |
| S10 A | w1118 ; UAS‐Atg1i/+; A58‐Gal4, UAS‐Src‐GFP, UAS‐DsRed2‐Nuc/UAS‐Tori |
| S10 A | w1118 ; UAS‐Atg1i/+; A58‐Gal4, UAS‐Src‐GFP, UAS‐DsRed2‐Nuc/UAS‐raptori |
| S10 A | w1118 ; UAS‐Atg1i/+; A58‐Gal4, UAS‐Src‐GFP, UAS‐DsRed2‐Nuc/UAS‐Atg16B |
| S10 A | w1118 ; UAS‐Atg1i/+; A58‐Gal4, UAS‐Src‐GFP, UAS‐DsRed2‐Nuc/UAS‐rictori |
| S10 A | w1118 ; UAS‐Atg5i/+; A58‐Gal4, UAS‐Src‐GFP, UAS‐DsRed2‐Nuc/+ |
| S10 A | w1118 ; UAS‐Atg5i/+; A58‐Gal4, UAS‐Src‐GFP, UAS‐DsRed2‐Nuc/UAS‐Tori |
| S10 A | w1118 ; UAS‐Atg5i/+; A58‐Gal4, UAS‐Src‐GFP, UAS‐DsRed2‐Nuc/UAS‐raptori |
| S10 A | w1118 ; UAS‐Atg5i/+; A58‐Gal4, UAS‐Src‐GFP, UAS‐DsRed2‐Nuc/UAS‐Atg16B |
| S10 A | w1118 ; UAS‐Atg5i/+; A58‐Gal4, UAS‐Src‐GFP, UAS‐DsRed2‐Nuc/UAS‐rictori |
| S10 B | w1118 ; endo:DE‐cad‐GFP, endo:Sqh‐mCherry/UAS‐Atg1i ; A58‐Gal4/+ |
| S10 B | w1118 ; endo:DE‐cad‐GFP, endo:Sqh‐mCherry/UAS‐Atg1i ; A58‐Gal4/ UAS‐Tori |
| S10 B | w1118 ; endo:DE‐cad‐GFP, endo:Sqh‐mCherry/UAS‐Atg1i ; A58‐Gal4/UAS‐raptori |
| S10 B | w1118 ; endo:DE‐cad‐GFP, endo:Sqh‐mCherry/UAS‐Atg1i ; A58‐Gal4/UAS‐Atg16B |
| S10 B | w1118 ; endo:DE‐cad‐GFP, endo:Sqh‐mCherry/UAS‐Atg1i ; A58‐Gal4/UAS‐rictori |
| S11 | w1118 ; +; A58‐Gal4, UAS‐Src‐GFP, UAS‐DsRed2‐Nuc/+ (Control) |
| S11 | w1118 ; UAS‐RhebAV4/+; A58‐Gal4, UAS‐Src‐GFP, UAS‐DsRed2‐Nuc/+ |
| S11 | w1118 ; UAS‐TSC1i‐2/+; A58‐Gal4, UAS‐Src‐GFP, UAS‐DsRed2‐Nuc/+ |
| S11 | w1118 ; +; A58‐Gal4, UAS‐Src‐GFP, UAS‐DsRed2‐Nuc/ UAS‐TSC1i |
| S11 | w1118 ; +; A58‐Gal4, UAS‐Src‐GFP, UAS‐DsRed2‐Nuc/UAS‐Atg16B |
| S11 | w1118 ; UAS‐RhebAV4/+; A58‐Gal4, UAS‐Src‐GFP, UAS‐DsRed2‐Nuc/UAS‐Atg16B |
| S11 | w1118 ; UAS‐TSC1i‐2/+; A58‐Gal4, UAS‐Src‐GFP, UAS‐DsRed2‐Nuc/UAS‐Atg16B |
| S12 A, B | w1118 ; UAS‐GFP‐Atg8a/+; A58‐Gal4/+ (Control) |
| S12 A, B | w1118 ; UAS‐GFP‐Atg8a/UAS‐TorDN ; A58‐Gal4/+ |
| S12 A, B | w1118 ; UAS‐GFP‐Atg8a/+; A58‐Gal4/UAS‐Tori |
| S12 A, B | w1118 ; UAS‐GFP‐Atg8a/+; A58‐Gal4/UAS‐raptori |
| S12 A, B | w1118 ; UAS‐GFP‐Atg8a/+; A58‐Gal4/UAS‐Atg16B |
| S12 A, B | w1118 ; UAS‐GFP‐Atg8a/+; A58‐Gal4/UAS‐rictori |
| S12 C | w1118 ; +; A58‐Gal4, UAS‐Src‐GFP, UAS‐DsRed2‐Nuc/+ (Control) |
| S12 C | w1118 ; UAS‐TSC1, UAS‐TSC2/+; A58‐Gal4, UAS‐Src‐GFP, UAS‐DsRed2‐Nuc/+ |
| S12 C | w1118 ; +; A58‐Gal4, UAS‐Src‐GFP, UAS‐DsRed2‐Nuc/UAS‐Tori |
| S12 C | w1118 ; +; A58‐Gal4, UAS‐Src‐GFP, UAS‐DsRed2‐Nuc/UAS‐raptori |
| S12 C | w1118 ; +; A58‐Gal4, UAS‐Src‐GFP, UAS‐DsRed2‐Nuc/UAS‐Atg16B |
| S12 D | w1118 ; +; A58‐Gal4, UAS‐Src‐GFP, UAS‐DsRed2‐Nuc/+ (Control) |
| S12 D | w1118 ; UAS‐Syx17i/+; A58‐Gal4, UAS‐Src‐GFP, UAS‐DsRed2‐Nuc/+ |
| S12 D | w1118 ; UAS‐Vamp7i/+; A58‐Gal4, UAS‐Src‐GFP, UAS‐DsRed2‐Nuc/+ |
| S12 D | w1118 ; UAS‐Snap29i/+; A58‐Gal4, UAS‐Src‐GFP, UAS‐DsRed2‐Nuc/+ |
| S12 D | w1118 ; UAS‐Snap29i‐2/+; A58‐Gal4, UAS‐Src‐GFP, UAS‐DsRed2‐Nuc/+ |
| S12 D | w1118 ; +; A58‐Gal4, UAS‐Src‐GFP, UAS‐DsRed2‐Nuc/UAS‐Atg16B |
| S12 D | w1118 ; UAS‐Syx17i/+; A58‐Gal4, UAS‐Src‐GFP, UAS‐DsRed2‐Nuc/UAS‐Atg16B |
| S12 D | w1118 ; UAS‐Vamp7i/+; A58‐Gal4, UAS‐Src‐GFP, UAS‐DsRed2‐Nuc/UAS‐Atg16B |
| S12 D | w1118 ; UAS‐Snap29i/+; A58‐Gal4, UAS‐Src‐GFP, UAS‐DsRed2‐Nuc/UAS‐Atg16B |
| S12 D | w1118 ; UAS‐Snap29i‐2/+; A58‐Gal4, UAS‐Src‐GFP, UAS‐DsRed2‐Nuc/UAS‐Atg16B |
| S13 A | w1118 ; endo:FasIII‐GFP/UAS‐mCherry‐Ag8a; A58‐Gal4/+ |
| S13 B, C | w1118 ; UAS‐mCherry‐Ag8a/+; A58‐Gal4, UAS‐mCD8‐GFP/+ |
| S14 A | w1118 ; endo:DE‐cad‐GFP, endo:Sqh‐mCherry/+; A58‐Gal4/UAS‐Atg1GS, UAS‐GFP |
| S14 A | w1118 ; endo:DE‐cad‐GFP, endo:Sqh‐mCherry/UAS‐SqaKA ; A58‐Gal4/UAS‐Atg1GS, UAS‐GFP |
| S14 B | w1118 ; UAS‐SqaKA/+; A58‐Gal4, UAS‐Src‐GFP, UAS‐DsRed2‐Nuc/+ |
| S14 B | w1118 ; UAS‐SqaKA/+; A58‐Gal4, UAS‐Src‐GFP, UAS‐DsRed2‐Nuc/UAS‐Tori |
| S14 B | w1118 ; UAS‐SqaKA/+; A58‐Gal4, UAS‐Src‐GFP, UAS‐DsRed2‐Nuc/UAS‐raptori |
| S14 B | w1118 ; UAS‐SqaKA/+; A58‐Gal4, UAS‐Src‐GFP, UAS‐DsRed2‐Nuc/UAS‐Atg16B |
| S14 B | w1118 ; UAS‐Roki/+; A58‐Gal4, UAS‐Src‐GFP, UAS‐DsRed2‐Nuc/+ |
| S14 B | w1118 ; UAS‐Roki/+; A58‐Gal4, UAS‐Src‐GFP, UAS‐DsRed2‐Nuc/UAS‐Tori |
| S14 B | w1118 ; UAS‐Roki/+; A58‐Gal4, UAS‐Src‐GFP, UAS‐DsRed2‐Nuc/UAS‐raptori |
| S14 B | w1118 ; UAS‐Roki/+; A58‐Gal4, UAS‐Src‐GFP, UAS‐DsRed2‐Nuc/UAS‐Atg16B |
| S15 A | w1118 ; endo:DE‐cad‐GFP, endo:Sqh‐mCherry/UAS‐Atg1i ; A58‐Gal4/+ |
| S15 A | w1118 ; endo:DE‐cad‐GFP, endo:Sqh‐mCherry/UAS‐Atg1i ; A58‐Gal4/ UAS‐Tori |
| S15 A | w1118 ; endo:DE‐cad‐GFP, endo:Sqh‐mCherry/UAS‐Atg1i ; A58‐Gal4/UAS‐raptori |
| S15 A | w1118 ; endo:DE‐cad‐GFP, endo:Sqh‐mCherry/UAS‐Atg1i ; A58‐Gal4/UAS‐Atg16B |
| S15 B | w1118 ; endo:DE‐cad‐GFP, endo:Sqh‐mCherry/UAS‐Atg5i ; A58‐Gal4/+ |
| S15 B | w1118 ; endo:DE‐cad‐GFP, endo:Sqh‐mCherry/UAS‐Atg5i ; A58‐Gal4/ UAS‐Tori |
| S15 B | w1118 ; endo:DE‐cad‐GFP, endo:Sqh‐mCherry/UAS‐Atg5i ; A58‐Gal4/UAS‐raptori |
| S15 B | w1118 ; endo:DE‐cad‐GFP, endo:Sqh‐mCherry/UAS‐Atg5i ; A58‐Gal4/UAS‐Atg16B |
| Movie EV1 | w1118 ; UAS‐GFP‐Atg8a/+; A58‐Gal4/+ (Control) |
| Movie EV1 | w1118 ; UAS‐GFP‐Atg8a/UAS‐Atg1i ; A58‐Gal4/+ |
| Movie EV1 | w1118 ; UAS‐GFP‐Atg8a/UAS‐Atg5i ; A58‐Gal4/+ |
| Movie EV1 | w1118 ; UAS‐GFP‐Atg8a/UAS‐Atg6i ; A58‐Gal4/+ |
| Movie EV2 | w1118 ; UAS‐mCherry‐Ag8a/+; A58‐Gal4/+ |
| Movie EV3 | w1118 ; +; A58‐Gal4, UAS‐Src‐GFP, UAS‐DsRed2‐Nuc/+ (Control) |
| Movie EV3 | w1118 ; UAS‐Atg1i/+; A58‐Gal4, UAS‐Src‐GFP, UAS‐DsRed2‐Nuc/+ |
| Movie EV3 | w1118 ; UAS‐Atg5i/+; A58‐Gal4, UAS‐Src‐GFP, UAS‐DsRed2‐Nuc/+ |
| Movie EV3 | w1118 ; UAS‐Atg6i/+; A58‐Gal4, UAS‐Src‐GFP, UAS‐DsRed2‐Nuc/+ |
| Movie EV4 | w1118 ; endo:DE‐Cad‐GFP, endo:Sqh‐mCherry/+; A58‐Gal4/+ (Control) |
| Movie EV4 | w1118 ; endo:DE‐Cad‐GFP, endo:Sqh‐mCherry/UAS‐Atg1i ; A58‐Gal4/+ |
| Movie EV4 | w1118 ; endo:DE‐Cad‐GFP, endo:Sqh‐mCherry/UAS‐Atg5i ; A58‐Gal4/+ |
| Movie EV5, EV6 | w1118, hsflp/+; act5c> y + >Gal4, UAS‐GFP/+; ubi:DE‐cad‐RFP/+ (Control) |
| Movie EV7 | w1118, hsflp/+; act5c > y + >Gal4, UAS‐GFP/UAS‐Atg1i ; ubi:DE‐cad‐RFP/+ |
| Movie EV8 | w1118, hsflp/+; act5c > y + >Gal4, UAS‐GFP/UAS‐Atg5i ; ubi:DE‐cad‐RFP/+ |
| Movie EV9 | w1118 ; tub:Gal80ts/+; A58‐Gal4, UAS‐Src‐GFP, UAS‐DsRed2‐Nuc/UAS‐Atg16B |
| Movie EV10 | w1118 ; endo:DE‐cad‐GFP, endo:Sqh‐mCherry/+; A58‐Gal4/+ (Control) |
| Movie EV10 | w1118 ; endo:DE‐cad‐GFP, endo:Sqh‐mCherry/+; A58‐Gal4/UAS‐Atg1GS, UAS‐GFP |
| Movie EV11 | w1118 ; endo:DE‐cad‐GFP, endo:Sqh‐mCherry/+; A58‐Gal4/UAS‐Tori |
| Movie EV11 | w1118 ; endo:DE‐cad‐GFP, endo:Sqh‐mCherry/+; A58‐Gal4/UAS‐Atg16B |
| Movie EV12 | w1118 ; +; A58‐Gal4, UAS‐Src‐GFP, UAS‐DsRed2‐Nuc/+ (Control) |
| Movie EV12 | w1118 ; +; A58‐Gal4, UAS‐Src‐GFP, UAS‐DsRed2‐Nuc/UAS‐Atg16B |
| Movie EV13, EV14 | w1118 ; UAS‐GFP/+; A58‐Gal4/+ (Control) |
| Movie EV13, EV14, EV15 | w1118 ; +; A58‐Gal4/UAS‐Atg1GS, UAS‐GFP |
| Movie EV16 | w1118 ; +; A58‐Gal4, UAS‐DsRed2‐Nuc/UAS‐Atg16B |
| Movie EV17 | w1118 ; UAS‐Atg5i/+; A58‐Gal4/UAS‐Atg1GS, UAS‐GFP |
| Movie EV18, EV19 | w1118 ; endo:FasIII‐GFP/UAS‐mCherry‐Ag8a; A58‐Gal4/+ |
| Movie EV20 | w1118 ; UAS‐mCherry‐Ag8a/+; A58‐Gal4, UAS‐mCD8‐GFP/+ |
| Movie EV21 | w1118 ; endo:DE‐cad‐GFP, endo:Sqh‐mCherry/UAS‐Atg1i ; A58‐Gal4/+ |
| Movie EV21 | w1118 ; endo:DE‐cad‐GFP, endo:Sqh‐mCherry/UAS‐Atg1i ; A58‐Gal4/UAS‐raptori |
| Movie EV21 | w1118 ; endo:DE‐cad‐GFP, endo:Sqh‐mCherry/UAS‐Atg1i ; A58‐Gal4/UAS‐Atg16B |
| Movie EV22 | w1118 ; endo:DE‐cad‐GFP, endo:Sqh‐mCherry/UAS‐Atg5i ; A58‐Gal4/+ |
| Movie EV22 | w1118 ; endo:DE‐cad‐GFP, endo:Sqh‐mCherry/UAS‐Atg5i ; A58‐Gal4/ UAS‐Tori |
| Movie EV22 | w1118 ; endo:DE‐cad‐GFP, endo:Sqh‐mCherry/UAS‐Atg5i ; A58‐Gal4/UAS‐Atg16B |
Flip‐out experiments
Atg1i or Atg5i clones in the epidermis were generated with a flip‐out system (Pignoni & Zipursky, 1997; Sun & Tower, 1999). Female flies with the genotype w1118, hsflp; act> y + >Gal4, UAS‐GFP/CyO; + were crossed with w1118 ; UAS‐Atg1i ; ubi:DE‐cad‐RFP/TM6B or w1118 ; UAS‐Atg5i ; ubi:DE‐cad‐RFP/TM6B males or in control experiments with w1118 ; +; ubi:DE‐cad‐RFP/TM3 males. Clones were identified by GFP expression under the act5C promoter. Mating was carried out at 18°C and at this condition no GFP was detected. The flip‐out was induced in mid‐stage L2 larvae by heat shock (15 or 30 min in a 37°C water bath). The larvae were incubated for 30 h at 25°C followed by wounding and imaging.
Gal80ts experiment
The temperature‐sensitive Gal80 system (Gal80ts) was used for time‐controlled induction of UAS‐constructs (McGuire et al, 2003). w1118 ; tub:Gal80ts ; A58‐Gal4, UAS‐Src‐GFP, UAS‐DsRed2‐Nuc/TM6B females were crossed to males carrying the target UAS constructs at 18°C; at this temperature, no Src‐GFP was detected. For inactivation of Gal80ts, larvae were heat shocked in a 30°C water bath for 6, 18 or 24 h. Less than 5 h of heat shock was not sufficient to induce the Src‐GFP marker in the epidermis. Live imagining of larvae with Gal80ts was carried out at 30°C.
Chloroquine treatment
Mid‐L2 Larvae were transferred to fresh medium containing 3 mg/ml chloroquine (Sigma‐Aldrich Cat. # C6628) and 0.3% Erioglaucine disodium (Sigma‐Aldrich Cat. # 861146; food colouring to monitor food uptake) for 14 h before imaging.
Smurf gut barrier assay
Female flies with the genotype w1118 ; NP1‐Gal4; + were crossed with w1118 ;+; UAS‐Atg16B males or, in control experiments (Rera et al, 2012), with w1118 ; +; + males. The progeny was raised on standard fly food containing 0.3% Erioglaucine disodium (Sigma‐Aldrich Cat. # 861146) at 25°C. For the Smurf assay, L3 larvae were anaesthetized with ether (Kakanj et al, 2020) and analysed and recorded on an AxioZoom.V16 microscope (Zeiss).
Immunostaining
For immunofluorescent staining, L3 larvae were dissected in phosphate‐buffered saline (PBS), fixed in 4% formaldehyde or 4% paraformaldehyde for 30 min at room temperature (RT) and blocked in 1% BSA and 0.3% Triton‐X for 2 h at RT. Primary and secondary antibodies were incubated for 2 h at RT. The tissues were mounted with Fluoromount‐G for confocal imaging. Antiserum dilutions and sources: Bazooka (1:500, from A. Wodarz), a‐PKC (1:500, Santa Cruze, ID‐Nr #406), FasIII (1:2,000, DSHB, #7G10), βPS‐integrin (1:200, DSHB #CF.6G11), anti‐rabbit or anti‐mouse immunoglobulin‐G labelled with Alexa 488 (1:200; Invitrogen). BodiPy 493/503 (ThermoFisher Cat. #D3922) was used at 1: 500. To image the gut (Fig 6A), male flies with the genotype w1118 ; NP1‐Gal4/+; UAS‐GFP‐Dlg/+ were crossed with w1118 ;+; UAS‐Atg16B females or, in control experiments, with w1118 ; +; + females. The guts were isolated from unstarved larvae, fixed and mounted in 4% paraformaldehyde and directly imaged.
FLIP procedures
A modified FLIP procedure (DeLotto et al, 2007) was applied to the dorsal larval epidermis in the abdominal segments A3–A5 of L3 instar larvae on an inverted spinning disk microscope equipped with FRAPPA and a 40×/1.3 oil objective lens (see section Microscope setup). 7–19 frames were acquired before bleaching. 16‐bit depth images were taken at a magnification of 0.163 μm/pixel acquiring a z‐stack of 2.1 μm. Photobleaching (one bleaching event per cell, mid‐cytosolic plane) was performed using 100% laser power over 3 or 20 min.
Immobilizing larvae
Early L3 larvae were anaesthetized with diethyl ether (Kakanj et al, 2020).
Laser ablation
All laser ablations and wounding experiments were performed exactly as described previously (Kakanj et al, 2020). For single‐cell wounds, the nucleus was targeted with 1 pulse/μm UV laser power of ~0.30 μJ energy (measured on the objective lens). For laser cuts at the plane of the apical plasma membrane without inducing a wound‐healing response, the UV laser was set to 1 pulse/μm of ~0.25 μJ energy.
Microscope setup and live imaging
We used an inverted spinning disk confocal microscope (Nikon TiE model with Yokogawa, model no. CSU‐X1 system) with a nano‐positioning Piezo Z stage control system (NanoScan, model no. OP400, Prior Scientific), Plan‐Fluor 40×/1.3 numerical aperture (NA) oil‐immersion differential interference contrast (DIC) objective or Plan‐Apochromat 60×/1.2 NA water‐immersion objective; EMCCD camera (CamLink, model no. C9100‐50; 1,000 × 1,000 pixels) controlled by Volocity v.6.3.57, with 488‐nm and 561‐nm channels. z‐stacks were taken with a step size of 0.28 μm with 60×/1.2 and 0.24 μm with 40×/1.3 (45–95 z‐stacks, covering a 10–30‐μm depth) both for live and fixed specimens (Kakanj et al, 2020). All figures and videos show merged z‐stacks. After live imaging, larvae were returned individually into food vials and monitored for survival. We evaluated data only from larvae that survived at least 2 days post imaging. Live imaging used for all images shown in this paper, except electron micrographs and images in Figs 4E, 6A and 9B and C, Appendix Figs S3A–C and S4C, which are from fixed specimens.
Image processing
For image processing we used Volocity v.6.3.57 (PerkinElmer) or Fiji (National Institutes of Health).
Image analysis
To quantify vesicles or puncta, the images were cropped to a uniform size and converted to 8‐bit TIF files. Ilastik pixel‐classifiers were trained separately using 6–15 images covering all genotypes for all markers. Separate classifiers were necessary since the nature of different “spots” is different. The Batch Processing function in Ilastik was used to process all the images and Simple Segmentation results were exported. Custom Python script was then used to identify the “spots” and to measure the number of spots in an area of 10,000 µm2. The codes are available at https://github.com/sourabh‐bhide/Analyze_Vesicles.
In the FLIP experiment, image intensities were measured in the bleached area and the sum of intensities in the area plotted over the time. All measurements were normalized to the pre‐bleached value in the ROI.
Data analysis
The plots were generated using the Python 3.7 library Seaborn (https://seaborn.pydata.org/generated/seaborn.boxplot.html). For statistical hypothesis testing, independent and non‐parametric (Kruskal–Wallis) t‐tests were performed for the mean number of spots in control and experimental conditions in the graphs in Figs 1D, 3C and 9D, Appendix Figs S2B and S9C. We assumed unequal sample size and unequal variances and calculations were performed using the Scipy library from Python 3.7 and GraphPad Prism version 8.1. For all other graphs (Appendix Figs S7D and G, and S12B) ordinary one‐way ANOVA statistical tests were performed after we confirmed normality using the Shapiro–Wilk test (alpha = 0.05). Values in this paper are presented as box plots. Box plot elements are: centre line, median; box limits, upper and lower quartiles; whiskers, 1.5× interquartile range; points, outliers. P‐values are indicated as follows: *P < 0.04; **P < 0.003; ***P < 0.0002; ****P < 0.0001 and lack of an asterisk or ns means non‐significant (P > 0.123).
Transmission electron microscopy
For transmission electron microscopy, early L3 Drosophila larvae were fixed and cryo‐immobilized by high‐pressure freezing as previously described (Moussian & Schwarz, 2010).
Author contributions
Parisa Kakanj: Conceptualization; Data curation; Formal analysis; Validation; Investigation; Visualization; Methodology; Writing—original draft; Writing—review & editing. Sourabh Bhide: Software; Formal analysis. Bernard Moussian: Formal analysis; Methodology. Maria Leptin: Supervision; Funding acquisition; Writing—review & editing.
In addition to the CRediT author contributions listed above, the contributions in detail are:
PK conceived the project, designed the experiments, performed all experiments, and prepared the figures and tables. PK and BM performed TEM analysis and SB performed all image quantifications. PK and ML analysed and discussed the data and drafted the manuscript.
Disclosure and competing interests statement
The authors declare that they have no conflict of interest. Maria Leptin is the former director of EMBO and a co‐founder of Review Commons. The EMBO Journal is editorially independent of EMBO.
Supporting information
Appendix
Movie EV1
Movie EV2
Movie EV3
Movie EV4
Movie EV5
Movie EV6
Movie EV7
Movie EV8
Movie EV9
Movie EV10
Movie EV11
Movie EV12
Movie EV13
Movie EV14
Movie EV15
Movie EV16
Movie EV17
Movie EV18
Movie EV19
Movie EV20
Movie EV21
Movie EV22
Source Data for Appendix
Source Data for Figure 1
Source Data for Figure 3
Source Data for Figure 5
Source Data for Figure 8
Source Data for Figure 9
Acknowledgements
We are grateful to A.J. Garcia‐Saéz, F. Papagiannouli, M. Rembold, M. Graef, N.L. Kononenko, S. Eming, P. Ronchi, Y. Schwab and S. Roth for critical reading of the manuscript, comments and helpful discussions. We thank A. Wodarz, M.J. Galko, L. Partridge, M. Uhlirova, I. Bjedov, J. Großhans, G. Juhász, M. Peschmann and U. Thomas for antibodies, reagents and fly lines. We thank M. Kakanj for her photographic and graphical support, A. Schauss, F. Babatz, P. Zentis and C. Jüngst from the CECAD imaging facility in Cologne (University of Cologne, Cluster of Excellence in Ageing Research) for technical support and the Bloomington, VDRC and DGGR stock centres for fly strains. This work was funded by CMMC (Projekt‐Nr. 16‐RP, Fond 2635/8025/01) and CECAD through a grant by the Deutsche Forschungsgemeinschaft (DFG, German Research Foundation) under Germany´s Excellence Strategy – EXC 2030 – 390661388, Gefördert durch die Deutsche Forschungsgemeinschaft (DFG) im Rahmen der Exzellenzstrategie des Bundes und der Länder ‐ EXC 2030 – 390661388 to M.L. Open Access funding enabled and organized by Projekt DEAL.
The EMBO Journal (2022) 41: e109992
See also: R Khezri & TE Rusten (June 2022)
Contributor Information
Parisa Kakanj, Email: pkakanj@uni-koeln.de.
Maria Leptin, Email: mleptin@uni-koeln.de.
Data availability
This study includes no data deposited in external repositories.
References
- Allen EA, Baehrecke EH (2020) Autophagy in animal development. Cell Death Differ 27: 903–918 [DOI] [PMC free article] [PubMed] [Google Scholar]
- Arsham AM, Neufeld TP (2009) A genetic screen in Drosophila reveals novel cytoprotective functions of the autophagy‐lysosome pathway. PLoS One 4: e6068 [DOI] [PMC free article] [PubMed] [Google Scholar]
- Bachmann A, Timmer M, Sierralta J, Pietrini G, Gundelfinger ED, Knust E, Thomas U (2004) Cell type‐specific recruitment of Drosophila Lin‐7 to distinct MAGUK‐based protein complexes defines novel roles for Sdt and Dlg‐S97. J Cell Sci 117: 1899–1909 [DOI] [PubMed] [Google Scholar]
- Barcelo H, Stewart MJ (2002) Altering Drosophila S6 kinase activity is consistent with a role for S6 kinase in growth. Genesis 34: 83–85 [DOI] [PubMed] [Google Scholar]
- Bejarano E, Yuste A, Patel B, Stout RF Jr, Spray DC, Cuervo AM (2014) Connexins modulate autophagosome biogenesis. Nat Cell Biol 16: 401–414 [DOI] [PMC free article] [PubMed] [Google Scholar]
- Benton R, St Johnston D (2003) A conserved oligomerization domain in Drosophila Bazooka/PAR‐3 is important for apical localization and epithelial polarity. Curr Biol 13: 1330–1334 [DOI] [PubMed] [Google Scholar]
- Besen‐McNally R, Gjelsvik KJ, Losick VP (2021) Wound‐induced polyploidization is dependent on Integrin‐Yki signaling. Biol Open 10: bio055996 [DOI] [PMC free article] [PubMed] [Google Scholar]
- Bjedov I, Cochemé HM, Foley A, Wieser D, Woodling NS, Castillo‐Quan JI, Norvaisas P, Lujan C, Regan JC, Toivonen JM et al (2020) Fine‐tuning autophagy maximises lifespan and is associated with changes in mitochondrial gene expression in Drosophila . PLoS Genet 16: e1009083 [DOI] [PMC free article] [PubMed] [Google Scholar]
- Brandt A, Krohne G, Grosshans J (2008) The farnesylated nuclear proteins KUGELKERN and LAMIN B promote aging‐like phenotypes in Drosophila flies. Aging Cell 7: 541–551 [DOI] [PubMed] [Google Scholar]
- Brandt A, Papagiannouli F, Wagner N, Wilsch‐Bräuninger M, Braun M, Furlong EE, Loserth S, Wenzl C, Pilot F, Vogt N et al (2006) Developmental control of nuclear size and shape by Kugelkern and Kurzkern. Curr Biol 16: 543–552 [DOI] [PubMed] [Google Scholar]
- Buszczak M, Paterno S, Lighthouse D, Bachman J, Planck J, Owen S, Skora AD, Nystul TG, Ohlstein B, Allen A et al (2007) The carnegie protein trap library: a versatile tool for Drosophila developmental studies. Genetics 175: 1505–1531 [DOI] [PMC free article] [PubMed] [Google Scholar]
- Cao B, Macones C, Mysorekar IU (2016) ATG16L1 governs placental infection risk and preterm birth in mice and women. JCI Insight 1: e86654 [DOI] [PMC free article] [PubMed] [Google Scholar]
- Chang TK, Shravage BV, Hayes SD, Powers CM, Simin RT, Wade Harper J, Baehrecke EH (2013) Uba1 functions in Atg7‐ and Atg3‐independent autophagy. Nat Cell Biol 15: 1067–1078 [DOI] [PMC free article] [PubMed] [Google Scholar]
- Chavez MN, Morales RA, Lopez‐Crisosto C, Roa JC, Allende ML, Lavandero S (2020) Autophagy activation in zebrafish heart regeneration. Sci Rep 10: 2191 [DOI] [PMC free article] [PubMed] [Google Scholar]
- Cole NB, Smith CL, Sciaky N, Terasaki M, Edidin M, Lippincott‐Schwartz J (1996) Diffusional mobility of Golgi proteins in membranes of living cells. Science 273: 797–801 [DOI] [PubMed] [Google Scholar]
- Cox RT, Spradling AC (2003) A Balbiani body and the fusome mediate mitochondrial inheritance during Drosophila oogenesis. Development 130: 1579–1590 [DOI] [PubMed] [Google Scholar]
- DeLotto R, DeLotto Y, Steward R, Lippincott‐Schwartz J (2007) Nucleocytoplasmic shuttling mediates the dynamic maintenance of nuclear dorsal levels during Drosophila embryogenesis. Development 134: 4233–4241 [DOI] [PubMed] [Google Scholar]
- Dietzl G, Chen D, Schnorrer F, Su K‐C, Barinova Y, Fellner M, Gasser B, Kinsey K, Oppel S, Scheiblauer S et al (2007) A genome‐wide transgenic RNAi library for conditional gene inactivation in Drosophila . Nature 448: 151–156 [DOI] [PubMed] [Google Scholar]
- Dong W, Dobler R, Dowling DK, Moussian B (2019) The cuticle inward barrier in Drosophila melanogaster is shaped by mitochondrial and nuclear genotypes and a sex‐specific effect of diet. PeerJ 7: e7802 [DOI] [PMC free article] [PubMed] [Google Scholar]
- Fortini P, Ferretti C, Iorio E, Cagnin M, Garribba L, Pietraforte D, Falchi M, Pascucci B, Baccarini S, Morani F et al (2016) The fine tuning of metabolism, autophagy and differentiation during in vitro myogenesis. Cell Death Dis 7: e2168 [DOI] [PMC free article] [PubMed] [Google Scholar]
- Fujita N, Huang W, Lin T‐H, Groulx J‐F, Jean S, Nguyen J, Kuchitsu Y, Koyama‐Honda I, Mizushima N, Fukuda M et al (2017) Genetic screen in Drosophila muscle identifies autophagy‐mediated T‐tubule remodeling and a Rab2 role in autophagy. Elife 6: e23367 [DOI] [PMC free article] [PubMed] [Google Scholar]
- Galko MJ, Krasnow MA (2004) Cellular and genetic analysis of wound healing in Drosophila larvae. PLoS Biol 2: E239 [DOI] [PMC free article] [PubMed] [Google Scholar]
- Gangishetti U, Veerkamp J, Bezdan D, Schwarz H, Lohmann I, Moussian B (2012) The transcription factor Grainy head and the steroid hormone ecdysone cooperate during differentiation of the skin of Drosophila melanogaster . Insect Mol Biol 21: 283–295 [DOI] [PubMed] [Google Scholar]
- Gonzalez‐Estevez C, Felix DA, Aboobaker AA, Salo E (2007) Gtdap‐1 promotes autophagy and is required for planarian remodeling during regeneration and starvation. Proc Natl Acad Sci USA 104: 13373–13378 [DOI] [PMC free article] [PubMed] [Google Scholar]
- Hennig KM, Neufeld TP (2002) Inhibition of cellular growth and proliferation by dTOR overexpression in Drosophila . Genesis 34: 107–110 [DOI] [PubMed] [Google Scholar]
- Huang J, Zhou W, Dong W, Watson AM, Hong Y (2009) From the cover: directed, efficient, and versatile modifications of the Drosophila genome by genomic engineering. Proc Natl Acad Sci USA 106: 8284–8289 [DOI] [PMC free article] [PubMed] [Google Scholar]
- Iyyathurai J, Decuypere JP, Leybaert L, D'Hondt C, Bultynck G (2016) Connexins: substrates and regulators of autophagy. BMC Cell Biol 17(Suppl 1): 20 [DOI] [PMC free article] [PubMed] [Google Scholar]
- Jiang H, Patel PH, Kohlmaier A, Grenley MO, McEwen DG, Edgar BA (2009) Cytokine/Jak/Stat signaling mediates regeneration and homeostasis in the Drosophila midgut. Cell 137: 1343–1355 [DOI] [PMC free article] [PubMed] [Google Scholar]
- Kakanj P, Eming SA, Partridge L, Leptin M (2020) Long‐term in vivo imaging of Drosophila larvae. Nat Protoc 15: 1158–1187 [DOI] [PubMed] [Google Scholar]
- Kakanj P, Moussian B, Gronke S, Bustos V, Eming SA, Partridge L, Leptin M (2016) Insulin and TOR signal in parallel through FOXO and S6K to promote epithelial wound healing. Nat Commun 7: 12972 [DOI] [PMC free article] [PubMed] [Google Scholar]
- Kang J, Dong Z, Wang J, Chen G, Liu D (2019) Autophagy‐related Djatg8 is required for remodeling in planarian Dugesia japonica . Biol Open 8: bio045013 [DOI] [PMC free article] [PubMed] [Google Scholar]
- Kim JH, Jin P, Duan R, Chen EH (2015) Mechanisms of myoblast fusion during muscle development. Curr Opin Genet Dev 32: 162–170 [DOI] [PMC free article] [PubMed] [Google Scholar]
- Kiss V, Jipa A, Varga K, Takáts S, Maruzs T, Lőrincz P, Simon‐Vecsei Z, Szikora S, Földi I, Bajusz C et al (2020) Drosophila Atg9 regulates the actin cytoskeleton via interactions with profilin and Ena. Cell Death Differ 27: 1677–1692 [DOI] [PMC free article] [PubMed] [Google Scholar]
- Klionsky DJ, Abdel‐Aziz AK, Abdelfatah S, Abdellatif M, Abdoli A, Abel S, Abeliovich H, Abildgaard MH, Abudu YP, Acevedo‐Arozena A et al (2021) Guidelines for the use and interpretation of assays for monitoring autophagy (4th edition)(1). Autophagy 17: 1–382 [DOI] [PMC free article] [PubMed] [Google Scholar]
- Kurotani K‐I, Tabata R, Kawakatsu Y, Sugita R, Okayasu K, Tanoi K & Notaguchi M (2020) Autophagy is induced during plant grafting for wound healing. bioRxiv 10.1101/2020.02.14.949453 [PREPRINT] [DOI]
- Lee T, Luo L (1999) Mosaic analysis with a repressible cell marker for studies of gene function in neuronal morphogenesis. Neuron 22: 451–461 [DOI] [PubMed] [Google Scholar]
- Levine B, Kroemer G (2019) Biological functions of autophagy genes: a disease perspective. Cell 176: 11–42 [DOI] [PMC free article] [PubMed] [Google Scholar]
- Losick VP, Fox DT, Spradling AC (2013) Polyploidization and cell fusion contribute to wound healing in the adult Drosophila epithelium. Curr Biol 23: 2224–2232 [DOI] [PMC free article] [PubMed] [Google Scholar]
- Martin AC, Kaschube M, Wieschaus EF (2009) Pulsed contractions of an actin‐myosin network drive apical constriction. Nature 457: 495–499 [DOI] [PMC free article] [PubMed] [Google Scholar]
- McGuire SE, Le PT, Osborn AJ, Matsumoto K, Davis RL (2003) Spatiotemporal rescue of memory dysfunction in Drosophila . Science 302: 1765–1768 [DOI] [PubMed] [Google Scholar]
- Milde R, Ritter J, Tennent GA, Loesch A, Martinez FO, Gordon S, Pepys MB, Verschoor A, Helming L (2015) Multinucleated giant cells are specialized for complement‐mediated phagocytosis and large target destruction. Cell Rep 13: 1937–1948 [DOI] [PMC free article] [PubMed] [Google Scholar]
- Moein S, Adibi R, da Silva ML, Nardi NB, Gheisari Y (2020) Cancer regeneration: polyploid cells are the key drivers of tumor progression. Biochim Biophys Acta Rev Cancer 1874: 188408 [DOI] [PubMed] [Google Scholar]
- Morin X, Daneman R, Zavortink M, Chia W (2001) A protein trap strategy to detect GFP‐tagged proteins expressed from their endogenous loci in Drosophila . Proc Natl Acad Sci USA 98: 15050–15055 [DOI] [PMC free article] [PubMed] [Google Scholar]
- Moussian B, Schwarz H (2010) Preservation of plasma membrane ultrastructure in Drosophila embryos and larvae prepared by high‐pressure freezing and freeze‐substitution. Dros Inf Serv 93: 215 [Google Scholar]
- Nehme NT, Liegeois S, Kele B, Giammarinaro P, Pradel E, Hoffmann JA, Ewbank JJ, Ferrandon D (2007) A model of bacterial intestinal infections in Drosophila melanogaster. PLoS Pathog 3: e173 [DOI] [PMC free article] [PubMed] [Google Scholar]
- Oda H, Tsukita S (2001) Real‐time imaging of cell‐cell adherens junctions reveals that Drosophila mesoderm invagination begins with two phases of apical constriction of cells. J Cell Sci 114: 493–501 [DOI] [PubMed] [Google Scholar]
- Pandit SK, Westendorp B, de Bruin A (2013) Physiological significance of polyploidization in mammalian cells. Trends Cell Biol 23: 556–566 [DOI] [PubMed] [Google Scholar]
- Patel PH, Thapar N, Guo L, Martinez M, Maris J, Gau CL, Lengyel JA, Tamanoi F (2003) Drosophila Rheb GTPase is required for cell cycle progression and cell growth. J Cell Sci 116: 3601–3610 [DOI] [PubMed] [Google Scholar]
- Pavel M, Rubinsztein DC (2017) Mammalian autophagy and the plasma membrane. FEBS J 284: 672–679 [DOI] [PubMed] [Google Scholar]
- Perkins LA, Holderbaum L, Tao R, Hu Y, Sopko R, McCall K, Yang‐Zhou D, Flockhart I, Binari R, Shim H‐S et al (2015) The transgenic RNAi project at harvard medical school: resources and validation. Genetics 201: 843–852 [DOI] [PMC free article] [PubMed] [Google Scholar]
- Petrovsky R, Krohne G, Grosshans J (2018) Overexpression of the lamina proteins Lamin and Kugelkern induces specific ultrastructural alterations in the morphology of the nuclear envelope of intestinal stem cells and enterocytes. Eur J Cell Biol 97: 102–113 [DOI] [PubMed] [Google Scholar]
- Pignoni F, Zipursky SL (1997) Induction of Drosophila eye development by decapentaplegic. Development 124: 271–278 [DOI] [PubMed] [Google Scholar]
- Polychronidou M, Grobhans J (2011) Determining nuclear shape: the role of farnesylated nuclear membrane proteins. Nucleus 2: 17–23 [DOI] [PMC free article] [PubMed] [Google Scholar]
- Polychronidou M, Hellwig A, Grosshans J (2010) Farnesylated nuclear proteins Kugelkern and lamin Dm0 affect nuclear morphology by directly interacting with the nuclear membrane. Mol Biol Cell 21: 3409–3420 [DOI] [PMC free article] [PubMed] [Google Scholar]
- Qiang L, Yang S, Cui YH, He YY (2020) Keratinocyte autophagy enables the activation of keratinocytes and fibroblasts and facilitates wound healing. Autophagy 17: 2128–2143 [DOI] [PMC free article] [PubMed] [Google Scholar]
- Ravikumar B, Moreau K, Jahreiss L, Puri C, Rubinsztein DC (2010) Plasma membrane contributes to the formation of pre‐autophagosomal structures. Nat Cell Biol 12: 747–757 [DOI] [PMC free article] [PubMed] [Google Scholar]
- Redman CWG, Staff AC, Roberts JM (2020) Syncytiotrophoblast stress in preeclampsia: the convergence point for multiple pathways. Am J Obstet Gynecol 226: S907–S927 [DOI] [PubMed] [Google Scholar]
- Rera M, Clark RI, Walker DW (2012) Intestinal barrier dysfunction links metabolic and inflammatory markers of aging to death in Drosophila . Proc Natl Acad Sci USA 109: 21528–21533 [DOI] [PMC free article] [PubMed] [Google Scholar]
- Riggi M, Kusmider B, Loewith R (2020) The flipside of the TOR coin ‐ TORC2 and plasma membrane homeostasis at a glance. J Cell Sci 133: jcs242040 [DOI] [PubMed] [Google Scholar]
- Riggi M, Niewola‐Staszkowska K, Chiaruttini N, Colom A, Kusmider B, Mercier V, Soleimanpour S, Stahl M, Matile S, Roux A et al (2018) Decrease in plasma membrane tension triggers PtdIns(4,5)P2 phase separation to inactivate TORC2. Nat Cell Biol 20: 1043–1051 [DOI] [PMC free article] [PubMed] [Google Scholar]
- Royou A, Sullivan W, Karess R (2002) Cortical recruitment of nonmuscle myosin II in early syncytial Drosophila embryos: its role in nuclear axial expansion and its regulation by Cdc2 activity. J Cell Biol 158: 127–137 [DOI] [PMC free article] [PubMed] [Google Scholar]
- Saito S, Nakashima A (2013) Review: the role of autophagy in extravillous trophoblast function under hypoxia. Placenta 34(Suppl): S79–84 [DOI] [PubMed] [Google Scholar]
- Scaffidi P, Misteli T (2006) Lamin A‐dependent nuclear defects in human aging. Science 312: 1059–1063 [DOI] [PMC free article] [PubMed] [Google Scholar]
- Scherfer C, Han VC, Wang Y, Anderson AE, Galko MJ (2013) Autophagy drives epidermal deterioration in a Drosophila model of tissue aging. Aging 5: 276–287 [DOI] [PMC free article] [PubMed] [Google Scholar]
- Schuh M, Lehner CF, Heidmann S (2007) Incorporation of Drosophila CID/CENP‐A and CENP‐C into centromeres during early embryonic anaphase. Curr Biol 17: 237–243 [DOI] [PubMed] [Google Scholar]
- Schwenzfeier CW (1991) Recurrent facial paralysis associated with bouts of otitis media. Am J Otol 12: 466–467 [PubMed] [Google Scholar]
- Scott RC, Juhasz G, Neufeld TP (2007) Direct induction of autophagy by Atg1 inhibits cell growth and induces apoptotic cell death. Curr Biol 17: 1–11 [DOI] [PMC free article] [PubMed] [Google Scholar]
- Scott RC, Schuldiner O, Neufeld TP (2004) Role and regulation of starvation‐induced autophagy in the Drosophila fat body. Dev Cell 7: 167–178 [DOI] [PubMed] [Google Scholar]
- Shravage BV, Hill JH, Powers CM, Wu L, Baehrecke EH (2013) Atg6 is required for multiple vesicle trafficking pathways and hematopoiesis in Drosophila . Development 140: 1321–1329 [DOI] [PMC free article] [PubMed] [Google Scholar]
- Struhl G, Basler K (1993) Organizing activity of wingless protein in Drosophila . Cell 72: 527–540 [DOI] [PubMed] [Google Scholar]
- Sun J, Tower J (1999) FLP recombinase‐mediated induction of Cu/Zn‐superoxide dismutase transgene expression can extend the life span of adult Drosophila melanogaster flies. Mol Cell Biol 19: 216–228 [DOI] [PMC free article] [PubMed] [Google Scholar]
- Sylakowski K, Wells A (2021) ECM‐regulation of autophagy: the yin and the yang of autophagy during wound healing. Matrix Biol 100‐101: 197–206 [DOI] [PMC free article] [PubMed] [Google Scholar]
- Takats S, Nagy P, Varga A, Pircs K, Karpati M, Varga K, Kovacs AL, Hegedus K, Juhasz G (2013) Autophagosomal Syntaxin17‐dependent lysosomal degradation maintains neuronal function in Drosophila . J Cell Biol 201: 531–539 [DOI] [PMC free article] [PubMed] [Google Scholar]
- Tang HW, Wang YB, Wang SL, Wu MH, Lin SY, Chen GC (2011) Atg1‐mediated myosin II activation regulates autophagosome formation during starvation‐induced autophagy. EMBO J 30: 636–651 [DOI] [PMC free article] [PubMed] [Google Scholar]
- Tapon N, Ito N, Dickson BJ, Treisman JE, Hariharan IK (2001) The Drosophila tuberous sclerosis complex gene homologs restrict cell growth and cell proliferation. Cell 105: 345–355 [DOI] [PubMed] [Google Scholar]
- Varga M, Sass M, Papp D, Takacs‐Vellai K, Kobolak J, Dinnyes A, Klionsky DJ, Vellai T (2014) Autophagy is required for zebrafish caudal fin regeneration. Cell Death Differ 21: 547–556 [DOI] [PMC free article] [PubMed] [Google Scholar]
- Wang D, He J, Huang B, Liu S, Zhu H, Xu T (2020) Emerging role of the Hippo pathway in autophagy. Cell Death Dis 11: 880 [DOI] [PMC free article] [PubMed] [Google Scholar]
- Wang Y, Antunes M, Anderson AE, Kadrmas JL, Jacinto A, Galko MJ (2015) Integrin adhesions suppress syncytium formation in the Drosophila larval epidermis. Curr Biol 25: 2215–2227 [DOI] [PMC free article] [PubMed] [Google Scholar]
- Wen JK, Wang YT, Chan CC, Hsieh CW, Liao HM, Hung CC, Chen GC (2017) Atg9 antagonizes TOR signaling to regulate intestinal cell growth and epithelial homeostasis in Drosophila . Elife 6: e29338 [DOI] [PMC free article] [PubMed] [Google Scholar]
- Worman HJ, Courvalin JC (2005) Nuclear envelope, nuclear lamina, and inherited disease. Int Rev Cytol 246: 231–279 [DOI] [PubMed] [Google Scholar]
- Xu J, Ma Y, Zhu X, Zhang J, Cheng Z, Wu W, Wang P (2020) Enhanced autophagy promotes the clearance of Pseudomonas aeruginosa in diabetic rats with wounds. Ann Transl Med 8: 1362 [DOI] [PMC free article] [PubMed] [Google Scholar]
- Xu T, Nicolson S, Denton D, Kumar S (2015) Distinct requirements of Autophagy‐related genes in programmed cell death. Cell Death Differ 22: 1792–1802 [DOI] [PMC free article] [PubMed] [Google Scholar]