

Abstract
Topoisomerase II (TOP2) unlinks chromosomes during vertebrate DNA replication. TOP2 “poisons” are widely used chemotherapeutics that stabilize TOP2 complexes on DNA, leading to cytotoxic DNA breaks. However, it is unclear how these drugs affect DNA replication, which is a major target of TOP2 poisons. Using Xenopus egg extracts, we show that the TOP2 poisons etoposide and doxorubicin both inhibit DNA replication through different mechanisms. Etoposide induces TOP2‐dependent DNA breaks and TOP2‐dependent fork stalling by trapping TOP2 behind replication forks. In contrast, doxorubicin does not lead to appreciable break formation and instead intercalates into parental DNA to stall replication forks independently of TOP2. In human cells, etoposide stalls forks in a TOP2‐dependent manner, while doxorubicin stalls forks independently of TOP2. However, both drugs exhibit TOP2‐dependent cytotoxicity. Thus, etoposide and doxorubicin inhibit DNA replication through distinct mechanisms despite shared genetic requirements for cytotoxicity.
Keywords: cancer, chemotherapy, DNA Damage, DNA replication, topoisomerase
Subject Categories: Cancer; DNA Replication, Recombination & Repair
While the chemotherapeutic etoposide behaves as a canonical TOP2 poison causing topological stress, doxorubicin intercalates into unreplicated DNA and blocks its unwinding.

Introduction
Topoisomerases play essential roles during chromosome metabolism in all organisms (Keszthelyi et al, 2016; Pommier et al, 2016; Vann et al, 2021). Topoisomerases ordinarily unlink DNA by creating transient DNA breaks that are rapidly re‐ligated. Topoisomerase “poisons” are widely used chemotherapeutics that prevent re‐ligation of topoisomerase‐induced breaks and trap topoisomerases on DNA, leading to cytotoxicity (Nitiss, 2009; Pommier et al, 2016; Vann et al, 2021). Although the toxicity of topoisomerase poisons is largely due to their target topoisomerase, some topoisomerase poisons exert additional effects that may also contribute to their cytotoxicity (Doroshow et al, 2001; Koster et al, 2007; Coldwell et al, 2008; Pang et al, 2013; Yang et al, 2013). Additionally, the breaks induced by topoisomerase poisons appear to target specific aspects of chromosome metabolism (Markovits et al, 1987; Holm et al, 1989; Hsiang et al, 1989; Canela et al, 2017, 2019).
The most widely used topoisomerase poisons target topoisomerase II (TOP2). This enzyme resolves supercoils, DNA intertwines between sister chromatids (“catenanes” and “pre‐catenanes”), and DNA loops by creating double‐strand DNA breaks through which another DNA strand is passed (Keszthelyi et al, 2016; Pommier et al, 2016; Vann et al, 2021). Break formation by type II topoisomerases involves formation of a covalent bond between catalytic tyrosine residues on the enzyme and the newly generated DNA ends to create a specialized DNA‐protein crosslink called a “cleavage complex”. Although double‐strand DNA breaks are thought to be the major cause of cytotoxicity by TOP2 poisons, these drugs also inhibit TOP2 activity by preventing turnover (Robinson & Osheroff, 1991). Additionally, most TOP2 complexes trapped by TOP2 poisons do not generate double‐strand breaks (Long et al, 1985; Muslimović et al, 2009; Canela et al, 2019). Thus, a major effect of TOP2 poisons is interference with TOP2 activity, rather than formation of double‐strand DNA breaks.
Vertebrates contain two isoforms of TOP2, denoted α and β (Austin et al, 2018). TOP2α is essential for DNA replication and mitosis, where its essential role is to unlink newly replicated chromosomes (Grue et al, 1998; Linka et al, 2007). TOP2β cannot carry out this function and instead is involved in transcription and has been associated with genome folding (Linka et al, 2007; Uusküla‐Reimand et al, 2016; Canela et al, 2017). Importantly TOP2α is essential for cell viability while TOP2β is not, indicating that the essential functions of TOP2β can also be fulfilled by TOP2α (Grue et al, 1998; Linka et al, 2007; Uusküla‐Reimand et al, 2016; Canela et al, 2017). Both isoforms of TOP2 are targeted by chemotherapeutics such as etoposide and doxorubicin, which are widely used treatments for lung, breast, and ovarian cancers (Murai, 2017; Waqar & Morgensztern, 2017) as well as leukemias and lymphomas (Vann et al, 2021). Importantly, the cytotoxic effect of TOP2 poisons involve targeting TOP2α during DNA replication (Markovits et al, 1987; Burgess et al, 2008; Fan et al, 2008; Tammaro et al, 2013; Pommier et al, 2016). In vertebrates, TOP2α resolves pre‐catenanes throughout replication to carry out the majority of sister chromatid unlinking (Heintzman et al, 2019). Resolution of pre‐catenanes by TOP2α is also important to prevent accumulation of topological stress that would otherwise stall replication forks during the final stages of DNA synthesis (Heintzman et al, 2019). After completion of DNA synthesis, any catenanes not protected by cohesin are also removed by TOP2α (Sumara et al, 2002; Farcas et al, 2011). Since TOP2α works throughout DNA replication, all stages of DNA replication are potentially susceptible to TOP2 poisons.
TOP2 poisons are potent inhibitors of DNA synthesis (Zellweger et al, 2015; Pommier et al, 2016). One model to explain this inhibition is that TOP2 poisons trap TOP2 ahead of replication forks on DNA supercoils, creating a cytotoxic lesion when the replisome collides with the trapped topoisomerase (Fig EV1Aii), similar to how topoisomerase I poisons function (Strumberg et al, 2000; Yan et al, 2016). However, this model has not been directly tested and TOP2α primarily acts behind forks during vertebrate replication (Lucas et al, 2001; Heintzman et al, 2019), suggesting that replication inhibition must occur through another mechanism. Etoposide was reported to indirectly inhibit DNA replication by inducing breaks that lead to activation of the ATR kinase and subsequent inhibition of replication initiation (Fig EV1Aiii) (Costanzo et al, 2003). However, this cannot explain inhibition of fork progression (Zellweger et al, 2015), which occurs after initiation has taken place. Doxorubicin was also reported to indirectly inhibit replication initiation by preventing nuclear envelope formation (Krasinska & Fisher, 2009). However, this activity also cannot explain inhibition of fork progression (Zellweger et al, 2015) and likely reflects intercalative properties of doxorubicin (Yang et al, 2015). Thus, although TOP2 poisons inhibit replication fork progression it is unclear how this occurs. This is important to address because DNA synthesis is a major chemotherapeutic target and its inhibition by TOP2 poisons may contribute to the cytotoxicity of these drugs (Berti et al, 2020).
Figure EV1. Effects of topoisomerase poisons on DNA synthesis.

- Models for how TOP2 poisons impact DNA replication. (i) During normal DNA replication, two replisomes activate and begin unwinding the DNA, moving in opposite directions (“Initiation”). As DNA is replicated (“Elongation”), pre‐catenanes form behind the replication fork on newly synthesized DNA, which is recognized and resolved by TOP2. Supercoils are infrequent during vertebrate DNA replication (Lucas et al, 2001; Heintzman et al, 2019) so catenanes are likely to be the main substrate for TOP2 during DNA synthesis. (ii) TOP2 poisons have been proposed to trap TOP2 ahead of the fork on supercoils, leading to DNA breaks. If the replication fork encounters a DNA break, the fork will collapse and replisome proteins will passively dissociate from DNA (Vrtis et al, 2021). Although a double‐strand break (DSB) is depicted, replisome dissociation should also be triggered at a single‐strand break (SSB) (Vrtis et al, 2021) and etoposide causes both types of breaks. (iii) TOP2 poisons can induce DNA breaks which are processed to generated single‐stranded DNA, which in turn activates the ATR checkpoint to inhibit replication initiation (Costanzo et al, 2003).
- Plasmid DNA was replicated using Xenopus egg extracts in the presence of [α‐32P]dATP to label newly synthesized DNA strands. Extracts were treated with either DMSO (Control), 2 mM etoposide, 500 μM etoposide, 125 μM etoposide, 31.25 μM etoposide or 7.8 μM etoposide at the onset of DNA replication. Samples were separated on a native agarose gel and visualized by autoradiography.
- Quantification of total DNA synthesis from (B). Total lane signal (AU) was normalized to the maximum recorded signal within each individual experiment. A representative experiment of two independent repeats is shown.
- Quantification of supercoiled circular monomers (“scCMs”) from (B). Abundance of scCMs was calculated as a percentage of total lane signal (% of total). A representative experiment of two independent repeats is shown.
- Plasmid DNA was replicated using Xenopus egg extracts in the presence of [α‐32P]dATP to label newly synthesized DNA strands. Extracts were treated with either DMSO (Control), 1.4 μM doxorubicin, 700 nM doxorubicin, 350 nM doxorubicin, 175 nM doxorubicin or 87.5 nM doxorubicin at the onset of DNA replication. Samples were separated on a native agarose gel and visualized by autoradiography.
- Quantification of total DNA synthesis from (E). Total lane signal (AU) was normalized to the maximum recorded signal within each individual experiment. A representative experiment of two independent repeats is shown.
- Quantification of scCMs from (E). Abundance of scCMs was calculated as a percentage of total lane signal (% of total). A representative experiment of two independent repeats is shown.
In this study, we determined the effects of the TOP2 poisons etoposide and doxorubicin during vertebrate DNA replication using Xenopus egg extracts. These compounds were chosen because they are widely used chemotherapeutics and are the best characterized TOP2 poisons in each of the two major chemical classes (Vann et al, 2021). We found that both etoposide and doxorubicin directly inhibit DNA synthesis, but etoposide behaves as a canonical TOP2 poison during DNA replication while surprisingly doxorubicin does not. We show that etoposide traps TOP2 behind forks to inhibit replication fork progression, suggesting that it stalls replication forks by interfering with resolution of topological stress. Strikingly, doxorubicin inhibits DNA replication independently of TOP2 by acting as a DNA intercalator. We corroborated our results by analyzing DNA replication in mammalian cells, which showed that etoposide inhibits replication in a TOP2‐dependent manner, while doxorubicin inhibits replication forks independent of TOP2, as observed using Xenopus egg extracts. Thus, our data show that etoposide and doxorubicin directly inhibit replication fork progression through distinct TOP2‐dependent and TOP2‐independent mechanisms even though cytotoxicity is TOP2‐dependent for both drugs.
Results
Differential effects of topoisomerase II poisons on DNA replication
We first tested how etoposide and doxorubicin impact DNA replication in the completely soluble Xenopus egg extract system (Walter et al, 1998). In this system, replication typically initiates from a single origin per plasmid and DNA synthesis is monitored by the incorporation of radioactive nucleotides (Fig 1A). Importantly, plasmid DNA is rapidly chromatinized upon addition to the extract (Laskey et al, 1977; Walter & Newport, 2000) so replication takes place within chromatinized DNA, as in cells. We performed a titration series of each drug and found that a wide range of concentrations inhibited DNA replication in a dose‐dependent manner (Figs 1B–D and EV1B–G). Surprisingly, inhibition of replication by etoposide was not dependent on ATR signaling and thus was distinct from the previously described mechanism in Xenopus egg extracts (Costanzo et al, 2003) (Fig EV2A–E). Furthermore, replication in this extract system (Walter et al, 1998) does not involve a nuclear envelope, so inhibition of replication by doxorubicin could not be due to impaired nuclear envelope assembly, as previously described in Xenopus egg extracts (Krasinska & Fisher, 2009). Thus, inhibition of DNA replication by etoposide and doxorubicin can occur by different mechanisms to those previously described.
Figure 1. TOP2 poisons exert different effects on DNA replication.

- Plasmid DNA was replicated using Xenopus egg extracts in the presence of [α‐32P]dATP to label newly synthesized DNA strands. Extracts were treated with either DMSO (Control), 125 μM etoposide, 500 μM etoposide, 350 nM doxorubicin, or 700 nM doxorubicin at the onset of DNA replication. The final products of replication are supercoiled Circular Monomers (scCMs) that arise from compensatory negative supercoiling of the template DNA when the reaction is stopped and the chromatinized DNA template is deproteinized.
- Samples from (A) were separated on a native agarose gel and visualized by autoradiography (See also Fig EV1B and E). Aberrant Replication Products (ARPs) are also indicated, as are the different species of catenated dimers: nicked‐nicked catenanes, “n‐nCats”; nicked‐supercoiled catenanes, “n‐scCats”; supercoiled‐supercoiled catenanes “sc‐scCats”.
- Quantification of total DNA synthesis from (B) lanes 1–15. Mean ± SD, n = 3 independent experiments. Total lane signal (AU) was normalized to the maximum recorded signal within each individual experiment.
- Quantification of total DNA synthesis from (B) lanes 1–5, 16–25. Mean ± SD, n = 3 independent experiments. Total lane signal (AU) was normalized to the maximum recorded signal within each individual experiment.
- Quantification of supercoiled circular monomers (“scCMs”) from (B) lanes 1–15. Mean ± SD, n = 3 independent experiments.
- Quantification of scCMs from (B) lanes 1–5, 16–25. Mean ± SD, n = 3 independent experiments.
- Quantification of linears (“Lins”) from (B) lanes 1–15. Mean ± SD, n = 3 independent experiments.
- Quantification of Lins from (B) lanes 1–5, 16–25. Mean ± SD, n = 3 independent experiments.
Data information: For (E)–(H), abundance of the indicated species was calculated as a percentage of total lane signal (% of total).
Figure EV2. Etoposide inhibits replication independent of ATR activation.

- To test whether the effects of etoposide on DNA replication are due to ATR signaling, as previously described (Costanzo et al, 2003), plasmid DNA was replicated in the presence or absence of etoposide (“ETO”) and caffeine (“Caff”).
- Samples from (A) were separated on a native agarose gel and visualized by autoradiography.
- Quantification of total DNA synthesis from (B) lanes 1–15. Mean ± SD, n = 3 independent experiments. Etoposide led to a dose‐dependent inhibition of DNA synthesis, as in Fig 1. Total lane signal (AU) was normalized to the maximum recorded signal within each individual experiment.
- Quantification of total DNA synthesis from (B) lanes 16–30. Mean ± SD, n = 3 independent experiments. Etoposide led to a dose‐dependent inhibition of DNA synthesis, as in (C), even though caffeine should block ATR activation. Total lane signal (AU) was normalized to the maximum recorded signal within each individual experiment.
- To confirm that the ATR checkpoint was activated in (B) and that this was blocked by caffeine, DNA was replicated as in (A) in the presence or absence of ATR inhibitor (VE‐821, “ATR‐”"). Western blotting was performed to measure the abundance of phosphorylated Chk1 (“pChk1”) as a read‐out for ATR activation. MCM7 was detected as a loading control. Etoposide induced a strong pChk1 signal that was diminished by ATRi, indicating that ATR was activated in response to etoposide, as previously described (Costanzo et al, 2003). Importantly, caffeine completed blocked pChk1 signal indicating that caffeine blocked ATR activation. Thus, ATR signaling was not responsible for the replication stalling in (B), (C). A representative experiment of two independent repeats is shown.
- To further characterize the putative linear species observed in Fig 1B, we analyzed their migration on a native gel without an intercalating agent (Lanes 1–5) and in the presence of ethidium bromide (lanes 6–10) compared to a 1 kilobase pair (kb) DNA ladder. The putative linear species migrated just above the 3.0 kb band, as expected for the linear product of a 3,148 base pair plasmid. Additionally, migration was unaffected by ethidium bromide, indicating that the product was not covalently closed. Both observations support the assignment of this species as a linear molecule of double‐stranded DNA.
- Overexposure of indicated conditions from Fig 1B.
Intriguingly, the DNA structures formed by etoposide and doxorubicin treatment were very different. In the presence of etoposide, we observed linear molecules (Fig 1B, lanes 6–15, Lins, defined in Fig EV2F) and aberrant replication products (Fig 1B, lanes 6–15, ARPs, previously defined in Deng et al, 2019), consistent with formation of DNA double‐strand breaks (DSBs). In contrast, doxorubicin treatment still led to formation of the most abundant replication intermediates (Fig 1B, lanes 16–25, θs, nCMs and scCMs, previously defined in Dewar et al, 2015), albeit at lower levels. Doxorubicin treatment resulted in slight persistence of the catenated species (Fig 1B, lanes 16–25, n‐nCats, n‐scCats, sc‐scCats, previously defined in Dewar et al, 2015) that are normally formed during DNA replication (Dewar et al, 2015), suggesting decatenation was impaired, as previously reported (Atwal et al, 2019). To quantify the difference between etoposide and doxorubicin we compared 125 μM and 500 μM etoposide and 350 nM and 700 nM doxorubicin, which led to sub‐maximal inhibition of DNA replication by each drug (Figs 1C and D and Fig EV1B–G). Using these concentrations, we measured supercoiled circular monomers (Fig 1A, scCMs), which are the final replication product in this system. We found that even though 125 μM etoposide was low enough that the final amount of DNA synthesis was largely unaffected (Fig 1C) the formation of scCMs was essentially blocked (Fig 1B, lanes 6–10, 1E, ETO 125 μM). In contrast, although 350 nM doxorubicin inhibited DNA synthesis to a similar extent (Fig 1D), this still resulted in the formation of scCMs by most molecules (Fig 1B, lanes 16–20, 1F). Higher concentrations of etoposide and doxorubicin also showed that even though 700 nM doxorubicin exhibited stronger inhibition of DNA synthesis than 500 μM etoposide (Fig 1C and D), it did not inhibit scCM formation as strongly as etoposide (Figs 1B, lanes 11–15 and 21–25, E and F, and EV2G). Thus, at comparable levels of replication inhibition etoposide inhibits scCM formation more effectively than doxorubicin. Linear molecules were also much more abundant in the presence of etoposide than doxorubicin (Fig 1G and H), which suggested that the more potent inhibition of scCM formation by etoposide could be explained by an increased ability to induce DNA breaks. Overall, we conclude that etoposide and doxorubicin have different effects on vertebrate DNA replication and may result in different frequencies of DNA break formation.
Etoposide, but not doxorubicin, acts as a canonical TOP2α poison during DNA replication
Topoisomerase II (TOP2) poisons stabilize TOP2 cleavage complexes, which results in accumulation of DNA‐protein cross‐links (DPCs) as well as DNA DSBs (Capranico et al, 1990a; Willmore et al, 1998; Pommier et al, 2016; Vann et al, 2021). Given the apparent lack of DSBs following doxorubicin treatment (Fig 1B, G and H) we wanted to directly examine the ability of etoposide and doxorubicin to induce DSBs and DPCs during DNA replication. To this end, we performed replication reactions in the presence of etoposide and doxorubicin, purified replication intermediates, and separated singly restriction digested products on a native agarose gel (Fig 2A and B). Under these conditions, fully replicated intact molecules should produce linear molecules the size of the full‐length plasmid (Fig 2A, Lins, 3,148 bp) and DSBs should form smaller fragments (Fig 2A, Breaks, < 3,148 bp). In the vehicle control we did not readily detect breaks (Fig 2B, lanes 1–5, 2C). Following etoposide treatment, breaks were readily detected, as expected (Fig 2B, lanes 6–10, 2C). Strikingly, breaks were not readily detected in the doxorubicin condition (Fig 2B, lanes 11–15) and the level was indistinguishable from background (Fig 2C). The concentrations of etoposide and doxorubicin used in these experiments inhibited formation of fully replicated linear molecules to a similar extent (Fig 2D) indicating comparable levels of replication inhibition. Although it is well established that doxorubicin induces DSBs (Capranico et al, 1990a; Nitiss, 2009; Vann et al, 2021) previous studies did not directly examine DNA replication, which likely accounts for the difference (see Discussion). We conclude that etoposide readily induces DSBs during DNA replication, while doxorubicin does not.
Figure 2. Etoposide, but not doxorubicin, creates breaks and DNA‐protein crosslinks during DNA replication.

- Plasmid DNA was replicated in the presence of [α‐32P]dATP and vehicle control, etoposide, or doxorubicin. Purified DNA intermediates were digested with XmnI, which cuts the plasmid template once, to allow for identification of DNA breaks.
- Samples from (A) were separated on a native agarose gel and visualized by autoradiography.
- Quantification of DNA breaks from (B). Mean ± SD, n = 3 independent experiments. Abundance of breaks was calculated as a percentage of total lane signal (% of total).
- Quantification of linears (“Lins”) from (B). Mean ± SD, n = 3 independent experiments. Abundance of linears (AU) was normalized to the maximum recorded signal within each individual experiment.
- Plasmid DNA was replicated as in (A). Samples were split and either treated with (“+Prot K”) or without (“−Prot K”) proteinase K.
- Samples from (E) were separated on native agarose gels and visualized by autoradiography.
- Quantification of DPC‐containing molecules from (F). Mean ± SD, n = 3 independent experiments. Abundance of the DPC‐containing molecules was calculated as a percentage of total lane signal (% of total).
- Quantification of the amount of supercoiled circular monomers (“scCMs”) from “+ProK” samples from (F). Mean ± SD, n = 3 independent experiments. Abundance of supercoiled monomers (AU) was normalized to the maximum recorded signal within each individual experiment.
Next, we wanted to determine the ability of etoposide and doxorubicin to induce DPCs during DNA replication. We replicated DNA in the presence of etoposide or doxorubicin and either added or omitted proteinase K to detect DPCs, as previously described (Duxin et al, 2014) (Fig 2E). In the vehicle control, proteinase K had essentially no effect on migration of replication intermediates (Fig 2F, lanes 1–5, ‐ProK and +ProK) indicating that DPCs were not formed. Following etoposide treatment, DPC‐containing molecules ran as high molecular weight smears on native agarose gels in the absence of proteinase K (Fig 2F, ‐ProK) and these were largely resolved by proteinase K treatment (Fig 2F, +ProK) indicating that DPCs were formed. In contrast, the DNA structures formed by doxorubicin treatment were essentially unaffected by proteinase K (Fig 2F, lanes 11–15) indicating few or no DPCs. Quantification of DPCs showed that etoposide dramatically induced DPC formation while the level of DPC induction by doxorubicin was indistinguishable from background (Fig 2G). Quantification of scCMs revealed that doxorubicin still impacted DNA replication, even though DPCs were not readily detected (Fig 2H). Thus, during DNA replication, etoposide readily induces DPCs while doxorubicin does not, as observed for DSBs (Fig 1B, G and H).
Our experiments show that etoposide and doxorubicin exhibit different effects on DNA replication. Because both drugs induce cell killing in a TOP2‐dependent manner, we wanted to know whether the different effects they exerted on replication depended on TOP2. To address this, we immunodepleted the main isoform of TOP2, TOP2α (Gaggioli et al, 2013; Heintzman et al, 2019), from extracts and monitored replication inhibition after etoposide and doxorubicin treatment (Fig 3A). Following mock immunodepletion, the final replication products were scCMs (Fig 3B, lanes 1–5,) and formation of these species was inhibited by etoposide and doxorubicin (Fig 3B, lanes 6–15, 3C) as previously observed (Fig 1). Following depletion of TOP2α, the final replication products were highly catenated dimers (Fig 3B, lanes 17–30, Cats, Fig EV3A and B), which demonstrated that TOP2α was functionally depleted. These species (Fig EV3A and B) were previously defined (Heintzman et al, 2019) and arose because there was no TOP2α to carry out unlinking. Accumulation of these species was unaffected by etoposide (Fig 3B, lanes 16–25, 3D), consistent with the effects of etoposide being dependent upon TOP2. In contrast, doxorubicin still inhibited formation of catenanes in TOP2α‐depleted extracts (Fig 3B, lanes 16–20 and 26–30, 3D). Moreover, the doxorubicin‐induced delay in catenane formation (Fig 3D) was not shorter than the doxorubicin‐induced delay in supercoiled circular monomer formation following mock immunodepletion (Fig 3C), suggesting the effect of doxorubicin was largely independent of TOP2. When Xenopus TOP2α was replaced with human TOP2A (Fig EV3C–I), etoposide caused breaks and TOP2A‐dependent replication inhibition, while doxorubicin did not. Thus, the lack of TOP2‐dependent breaks or TOP2‐dependent replication inhibition by doxorubicin did not reflect altered properties of Xenopus TOP2α compared to human TOP2A. We conclude that etoposide inhibits replication in a TOP2‐dependent manner while doxorubicin does not.
Figure 3. Etoposide and doxorubicin inhibit DNA replication through different mechanisms.
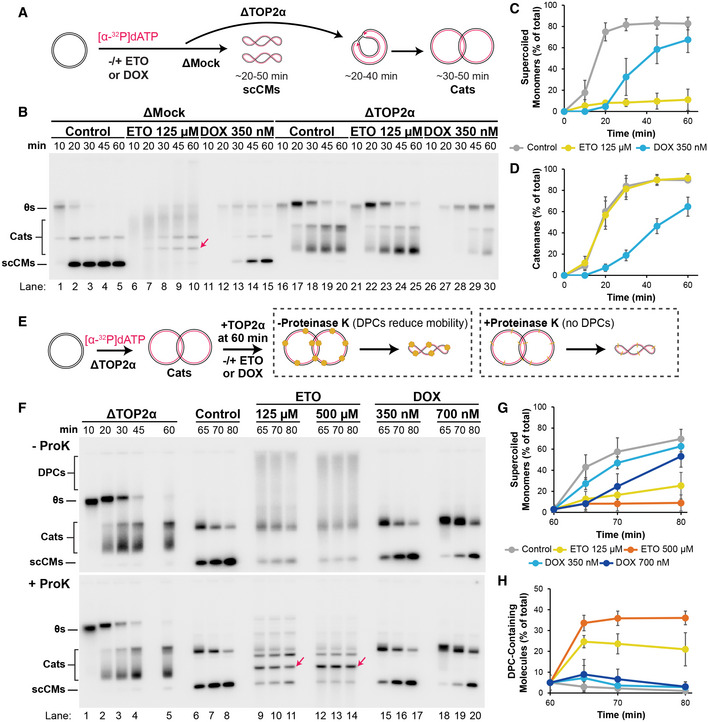
- Plasmid DNA was replicated in Mock‐ or TOP2α‐immunodepleted extracts in the presence or absence of vehicle control, etoposide, or doxorubicin. In mock‐depleted extracts (ΔMock), the final replication product are supercoiled circular monomers (“scCMs”). In TOP2α‐depleted extracts (ΔTOP2α), the final replication product are catenanes (“Cats”) because TOP2α is required for DNA unlinking.
- Samples from (A) were separated on a native agarose gel and visualized by autoradiography. Linear molecules, arising from DNA breaks, are indicated with a red arrow migrate at a similar molecular weight to a subset of catenanes. See also Fig EV3A and B for explanation of the individual species of catenanes.
- Quantification of scCMs from (B) lanes 1–15. Mean ± SD, n = 3 independent experiments. Abundance of supercoiled monomers was calculated as a percentage of total lane signal (% of total).
- Quantification of Cats from (B) lanes 16–30. Mean ± SD, n = 3 independent experiments. Abundance of catenanes was calculated as a percentage of total lane signal (% of total).
- Plasmid DNA was replicated in Mock‐ or TOP2α‐immunodepleted extracts. At 60 min, undepleted extract was added back to add to supply TOP2α and trigger decatenation. Vehicle, etoposide, or doxorubicin were also added at 60 min. Samples were treated either with or without Proteinase K (as in Fig 2E).
- Samples from (E) were separated on native agarose gels and visualized by autoradiography. Linear molecules are indicated with a red arrow.
- Quantification of scCMs from + ProK gel in (F) lanes 6–20. Mean ± SD, n = 3 independent experiments. Abundance of supercoiled monomers was calculated as a percentage of total lane signal (% of total).
- Quantification of DPC Containing Molecules from (F) lanes 6–20. Mean ± SD, n = 3 independent experiments. Abundance of DPC‐containing molecules was calculated as a percentage of total lane signal (% of total).
Figure EV3. Doxorubicin does not act as a topoisomerase poison against human TOP2A during DNA replication.

- Cartoon depicting the different catenated DNA species formed following replication in Xenopus egg extracts. Cats+ are highly catenated species that form initially and are gradually decatenated to less catenated Cats− species by a low level of residual TOP2 activity (Heintzman et al, 2019).
- Lanes 16–20 of Fig 3B are reproduced and the different catenated species are indicated.
- To test whether doxorubicin acted as a topoisomerase poison against human TOP2A (hTOP2A) the endogenous TOP2α was depleted from extracts, which were then used to replicate DNA in the presence of either buffer control or hTOP2A. Vehicle control, etoposide, or doxorubicin were also added, as indicated. In the buffer control (ΔTOP2α) the final replication products should be catenanes (“Cats”) due to the lack of TOP2 activity. In the hTOP2A condition (ΔTOP2α + hTOP2A) and the final replication products should be supercoiled circular monomers (“scCMs”) as hTOP2A rescues the depletion (Heintzman et al, 2019).
- Samples from (C) were separated on a native agarose gel and visualized by autoradiography.
- Quantification of catenanes in ΔTOP2α conditions from (D) lanes 1–4, 9–12, and 17–20. Doxorubicin, but not etoposide, inhibits catenane formation as in Fig 3D. A representative experiment of two independent repeats is shown.
- Quantification of scCMs in ΔTOP2α + hTOP2A conditions from (D) lanes 6–8, 13–16, and 21–24. Both etoposide and doxorubicin slow replication, indicating that etoposide, but not doxorubicin, inhibits replication in a hTOP2A‐dependent manner. A representative experiment of two independent repeats is shown.
- To test the ability of etoposide and doxorubicin to induce breaks by hTOP2A, samples from (C) were digested by XmnI, separated on a native agarose gel, and visualized by autoradiography.
- Quantification of breaks in ΔTOP2α conditions from (G) lanes 1–4, 9–12, and 17–20. In the absence of TOP2α breaks are not readily detected. Abundance of breaks was calculated as a percentage of total lane signal (% of total). A representative experiment of two independent repeats is shown.
- Quantification of breaks in ΔTOP2α + hTOP2A conditions from (G) lanes 6–8, 13–16, and 21–24. In the presence of hTOP2A etoposide induces breaks, but doxorubicin does not, as observed in Fig 2C. Overall, etoposide behaves as a TOP2 poison in the presence of hTOP2A but doxorubicin does not, as observed for Xenopus TOP2α in undepleted extracts (Figs 2 and 3). Abundance of breaks was calculated as a percentage of total lane signal (% of total). A representative experiment of two independent repeats is shown.
Data information: For (E) and (F), the signal of the indicated species (AU) was normalized to the maximum recorded signal within each individual experiment.
We reasoned that the inhibition of DNA replication by doxorubicin might prevent formation of catenanes, which are the substrate for TOP2α during replication in Xenopus egg extracts (Heintzman et al, 2019) and thus prevent formation of breaks and DPCs by depriving TOP2α of its substrate. To test this possibility, we developed a scheme to test the ability of etoposide and doxorubicin to induce DPCs under conditions where a fixed number of catenanes were present at the start (Fig 3E). TOP2α was immunodepleted from extracts and DNA was replicated for 60 min to produce primarily catenated dimers (Fig 3E and F, lanes 1–5, Cats). A small quantity of undepleted extract was then added back to provide TOP2α activity in the absence or presence of etoposide or doxorubicin (Fig 3E) and DPCs were then detected (as above). In the vehicle control, catenated dimers were rapidly resolved to scCMs and DPCs were not detected (Fig 3F, lanes 6–8, 3G and H). In contrast, etoposide treatment strongly inhibited formation of supercoiled circular monomers and DPCs were readily detected (Fig 3F, lanes 9–14, 3G and H), as observed previously (Fig 2E–H). As expected, there was no appreciable effect on total signal or formation of replication intermediates (Fig 3F, lanes 9–14), in contrast to our previous data (Fig 1B, lanes 6–15), because etoposide was added after DNA replication was complete. Importantly, doxorubicin still did not appreciably produce DPCs (Fig 3F, lanes 15–20, 3G and H), as observed previously (Fig 2E–H). These data show that the lack of DPCs formed in response to doxorubicin treatment cannot be attributed lack of catenane formation. Thus, doxorubicin does not induce TOP2 cleavage complexes (DPCs) during DNA replication, even though it can do so in other contexts (Willmore et al, 1998).
Doxorubicin was previously reported to have two modes of action that are concentration dependent (Capranico et al, 1990b; Atwal et al, 2019); at low concentrations, it acts as a TOP2 poison, while at high concentrations it inhibits TOP2. Thus, the lack of breaks and DPCs in our assays could, in principle, be a consequence of high concentrations of doxorubicin in our assays. However, several lines of evidence show that this is not the case. First, we tested several doxorubicin concentrations that ranged from high enough to completely block replication (Fig EV1E, lanes 6–10) and low enough to exhibit no effect (Fig EV1E, lanes 26–30). However, we saw no evidence for DNA breaks at any concentration (Fig EV1B, Lins, compared to Fig EV1E). Second, the 350 nM and 700 nM concentrations of doxorubicin we used (Figs 1, 2, 3) were similar to the ~500 nM–1 µM concentration range previously reported to induce breaks by TOP2 (Capranico et al, 1990b). Third, the extent of scCM formation following 350 nM doxorubicin treatment was almost indistinguishable from the vehicle control (Fig 3G), which indicated negligible inhibition of TOP2 despite lack of DPC induction (Fig 3H). Thus, the lack of DPC formation and breaks following doxorubicin treatment could not be attributed to inhibition of TOP2 activity by high doxorubicin concentrations. Taken together, our data show that etoposide behaves as a canonical TOP2α poison during DNA replication while doxorubicin does not (see also Discussion, below).
Etoposide stalls forks by trapping TOP2 on newly replicated DNA
TOP2 poisons are thought to inhibit replication by creating breaks ahead of replication forks, leading to fork collapse (Fig EV1ii), or by creating breaks that activate the ATR checkpoint and inhibit DNA synthesis (Fig EV1iii). Inhibition of replication by etoposide did not require the ATR checkpoint (Fig EV2A–E) suggesting that the inhibition of replication might instead be due to fork collapse. It was previously reported that TOP2α acts behind forks during vertebrate DNA replication (Lucas et al, 2001; Heintzman et al, 2019). However, one report left open the possibility that etoposide might infrequently trap TOP2α ahead of forks (Lucas et al, 2001), which could account for inhibition of DNA replication by etoposide.
To test whether etoposide caused replication fork collapse, we monitored binding of replication proteins to DNA. DNA was replicated in the absence or presence of etoposide, then chromatin‐bound proteins were recovered and analyzed by Western blotting (Fig 4A). As expected, etoposide treatment led to accumulation of chromatin‐bound TOP2α (Fig 4B, lanes 5–8 and 13–16, 4C). TOP2α signal included higher molecular weight species (Fig 4B, “Modified TOP2α”), which we speculate arise from sumoylation or ubiquitylation of TOP2 cleavage complexes (Sun et al, 2020). If etoposide caused fork collapse, we would expect to see replisome components dissociate prematurely due to translocation off the DNA template when a break was encountered (Fig EV1Aii). However, in contrast to this prediction, we observed that the core replicative helicase component CDC45 persisted on DNA (Fig 4B, lanes 1–8, 4E). Thus, instead of causing replisomes to dissociate, as would be expected for fork collapse, etoposide caused replisomes to persist longer on DNA. These data suggest that replication forks are stalled by etoposide and do not undergo premature disassembly.
Figure 4. Etoposide stalls replication forks by trapping TOP2α behind forks.

- Plasmid DNA was replicated in the presence or absence of etoposide and p97‐i, which inhibits removal of replisomes (green) from DNA. At different timepoints chromatin‐bound proteins were recovered via plasmid pulldowns.
- Proteins from (A) were recovered and analyzed via Western blotting. Input corresponds to 1% of total reaction. Modified TOP2α species are also indicated.
- Quantification of TOP2α (both modified and unmodified species) from (B) lanes 1–8.
- Quantification of TOP2α (both modified and unmodified species) from (B) lanes 9–16.
- Quantification of CDC45 from (B) lanes 1–8.
- Quantification of CDC45 from (B) lanes 9–16.
- Plasmid DNA was replicated in the presence or absence of etoposide and aphidicolin (Aph), which prevents DNA synthesis but still permits unwinding by replisomes. At different timepoints chromatin‐bound proteins were recovered via plasmid pulldowns.
- Proteins from (G) were recovered and analyzed via Western blotting. Input corresponds to 1% of total reaction.
- Quantification of RPA30 from (H) lanes 9–16.
- Quantification of RPA30 from (H) lanes 1–8.
- Quantification of TOP2α (both modified and unmodified species) from (H) lanes 1–4 and 9–12.
- Quantification of TOP2α (both modified and unmodified species) from (H) lanes 5–8 and 13–16.
Data information: (C–F, I–L) Mean ± SD, n = 3 independent experiments. Protein abundance (AU) was normalized to the maximum recorded signal within each individual experiment. See also Fig EV4B–F.
CDC45 ultimately did dissociate from DNA in the presence of etoposide (Fig 4B). We wanted to know whether this reflected passive unloading following encounter with a DNA break (Fig EV1Aii) or the replisome unloading pathways that operate following completion of DNA synthesis (Dewar et al, 2017; Sonneville et al, 2017; Deng et al, 2019; Priego Moreno et al, 2019; Wu et al, 2019). To test this, we also monitored protein binding in the absence or presence of etoposide but included a small molecule inhibitor of p97 (p97‐i), which inhibits all known replisome unloading pathways in Xenopus egg extracts (Dewar et al, 2017; Deng et al, 2019) but does not block replisome dissociation when a break in the translocating strand is encountered (Vrtis et al, 2021). Etoposide still led to enrichment of TOP2α on DNA in the presence of p97‐i (Fig 4B, lanes 1–8 and 9–16, 4D). However, p97‐i strongly inhibited dissociation of CDC45 and this was essentially unaffected by etoposide (Fig 4B, lanes 9–16, 4F). Thus, the replisome unloading observed in the presence of etoposide is due to replisome unloading at the end of DNA replication rather than passive unloading caused by encounter with a break (Vrtis et al, 2021). Overall, these data support a model where etoposide slows replication fork progression but does not cause replication fork collapse.
The lack of replisome unloading in response to etoposide is consistent with etoposide trapping TOP2α behind forks during vertebrate DNA replication. To further test this, we monitored binding of TOP2α to DNA in the presence or absence of the DNA polymerase inhibitor aphidicolin (Fig 4G), which blocks DNA synthesis but not unwinding (Walter & Newport, 2000) and thus prevents formation of catenanes but not supercoils (Fig EV4A). Aphidicolin treatment also caused MCM6 and CDC45 to persist on chromatin, consistent with incomplete DNA synthesis, and this was also true in the presence of etoposide (Fig EV4B–F). However, the single‐stranded DNA binding protein RPA also accumulated on DNA, indicating that extensive unwinding by the replicative helicase took place (Fig 4H lanes 1–4 and 9–12, 4I and J). Importantly, etoposide treatment did not affect RPA accumulation (Fig 4H lanes 9–16, 4I), consistent with TOP2α acting behind forks (Lucas et al, 2001; Heintzman et al, 2019). Aphidicolin also dramatically inhibited TOP2α binding (Fig 4H lanes 9–12, 4K) as previously described (Heintzman et al, 2019), consistent with TOP2α acting behind forks. If etoposide trapped TOP2α ahead of the forks, then etoposide should lead to a substantial increase in TOP2α binding event in the presence of aphidicolin. Instead, we found that aphidicolin essentially blocked TOP2α binding, even in the presence of etoposide (Fig 4H, lanes 9–16, 44K and 4L). These data indicate that etoposide traps TOP2α behind forks, presumably on catenanes.
Figure EV4. Etoposide inhibits DNA replication by trapping TOP2 on newly replicated DNA.

- Cartoon depicting the DNA structures formed by DNA replication in the presence of aphidicolin or a vehicle control. In the vehicle control both supercoils and catenanes can form. However, upon aphidicolin treatment, DNA synthesis is blocked so only hemicatenanes, and not catenanes, can be formed behind the fork. Note that in the presence of aphidicolin extensive DNA unwinding and supercoil generation takes place (Walter & Newport, 2000).
- Samples from Fig 4G were analyzed by Western blotting to detect MCM6 and CDC45.
- Quantification of MCM6 from (B) lanes 1–4 and 9–12. Mean ± SD, n = 3 independent experiments.
- Quantification of MCM6 from (B) lanes 5–8 and 13–16. Mean ± SD, n = 3 independent experiments.
- Quantification of CDC45 from (B) lanes 1–4 and 9–12. Mean ± SD, n = 3 independent experiments.
- Quantification of CDC45 from (B) lanes 5–8 and 13–16. Mean ± SD, n = 3 independent experiments. Protein abundance (AU) was normalized to the maximum recorded signal within each individual experiment for (C)–(F).
- (i) Loss of TOP2α leads to the accumulation of catenanes that stalls forks and inhibits fork merger (Heintzman et al, 2019). (ii) 10% of endogenous TOP2α is sufficient to resolve catenanes and prevent fork stalling during termination. (iii) We sought to test whether etoposide could inhibit fork merger when TOP2α was reduced to 10% of endogenous levels, which we expected to result in less breaks and allow for visualization of replication intermediates.
- To test whether etoposide could also cause termination defects, as observed following loss of TOP2 (Heintzman et al, 2019), replication was performed with reduced amounts of TOP2 in the absence or presence of etoposide. Plasmid DNA was replicated in extracts where TOP2α was reduced 10‐fold by mixing mock‐ and TOP2α‐immunodepleted extracts, which was sufficient to prevent fork stalling (Heintzman et al, 2019). Purified DNA was then digested with XmnI so that replication forks (double‐Ys) and replicated molecules (linears) could be identified and fork merger could be measured.
- Samples from (H) were separated on a native agarose gel and visualized by autoradiography.
- Quantification of fork merger from (I). Note that breaks (broken molecules) were excluded from the analysis as these would cause the rate of fork merger to be under‐estimated. Mean ± SD, n = 3 independent experiments. Fork merger was calculated as a percentage of total lane signal (% of total).
- Quantification of total DNA synthesis from (I). Mean ± SD, n = 3 independent experiments. Total lane signal (AU) was normalized to the maximum recorded signal within each individual experiment.
We previously found that loss or inhibition of TOP2α caused replication forks to stall during termination (Heintzman et al, 2019) (Fig EV4Gi). To test whether etoposide could also stall forks by interfering with TOP2 activity, we tested whether etoposide also led to the termination‐specific fork stalling that we previously observed (Heintzman et al, 2019). The DNA breaks formed by etoposide prevented analysis of replication intermediates under normal conditions (Fig 1). Although lowering the concentration of etoposide largely eliminated break formation there was no fork stalling effect (Fig EV1B lanes 26–30 and 1–5), presumably because there was ample TOP2 to resolve catenanes and the low level of etoposide did not affect this. As an alternative approach, TOP2 concentration was reduced ten‐fold (Fig EV4H–K). Under these conditions, fork merger readily took place (Fig EV4Gii, H, I, lanes 1–5) and replication intermediates could be distinguished even in the presence of etoposide (Fig EV4H and I lanes 6–10, DYs). To test whether a termination defect took place (Fig EV4Giii) we monitored fork merger, which represents unwinding of the final stretch of DNA duplex (Fig EV4H). Etoposide treatment inhibited fork merger (Fig EV4I lanes 6–10, EV4J) but had no effect on total DNA synthesis (Fig EV4K). Thus, under these conditions, etoposide could reproduce termination‐specific fork stalling, suggesting that etoposide can inhibit TOP2 function during DNA replication. Overall, our data show that etoposide stalls replication fork progression by trapping TOP2α behind forks and this can be explained by inhibition of TOP2 activity.
Doxorubicin inhibits replication by intercalating unreplicated DNA
Doxorubicin has two well‐defined activities – it induces TOP2‐dependent DNA breaks and functions as a DNA intercalator (Yang et al, 2014). Since doxorubicin did not create DNA breaks in our assays (Figs 2 and 3) we wanted to test whether its DNA intercalator activity was sufficient to explain the replication inhibition we observed (Fig 1). To address this point, we compared the effects of doxorubicin to aclarubicin, a similar anthracycline drug that intercalates DNA but does not create TOP2‐dependent DNA breaks (Pang et al, 2013; Yang et al, 2014). We first identified concentrations of each drug that inhibited total DNA synthesis to the same extent (Fig EV5A) and found that 2 and 4 µM aclarubicin inhibited replication to the same extent as 350 and 700 nM doxorubicin, respectively. The requirement for higher concentrations of aclarubicin is consistent with aclarubicin being less potent than doxorubicin (Pang et al, 2013). We then monitored the effect of the formation and resolution of the different DNA species that arise during DNA replication (Fig 5A, θs, Cats, nCMs, scCMs). The pattern of DNA species in the presence of 2 µM aclarubicin was indistinguishable from 350 nM doxorubicin (Fig 5B, lanes 6–10 and 16–20). Likewise, the pattern of DNA species in the presence of 4 µM aclarubicin was indistinguishable from 700 nM doxorubicin (Fig 5B, lanes 11–15 and 21–25). Formation of scCMs, which are the final products of replication, occurred the same rate for equivalent concentrations of doxorubicin and aclarubicin (Fig 2, 5, 2 nM Aclarubicin and 350 nM Doxorubicin, 4 µM Aclarubicin and 700 nM Doxorubicin). Similar effects were observed following treatment with ethidium bromide, which also acts as a DNA intercalator (Fig EV5B). Thus, the DNA intercalation activity of doxorubicin is sufficient to explain its inhibition of DNA replication. Additionally, inhibition of replication by doxorubicin involved stable binding to DNA (Appendix Fig S1A–C), as expected for a DNA intercalator. Furthermore, the effects of doxorubicin could be partially rescued by co‐addition of non‐template double‐stranded DNA but not single‐stranded DNA (Appendix Fig S1D–G) as expected for intercalators, which preferentially bind double‐stranded DNA. Although the effects of double‐stranded DNA addition were modest, we were limited in the amount of non‐template DNA we could add without stimulating its replication (Appendix Fig S1D–H) or causing inhibition of DNA replication (Appendix Fig S1G). Overall, these data show that doxorubicin exerts similar effects to other, extensively studied, intercalators and these effects involve stable binding to double‐stranded DNA, as expected for a DNA intercalator.
Figure EV5. Doxorubicin inhibits replication through intercalation of unreplicated DNA.

- Quantification of total DNA synthesis from Fig 5B. Mean ± SD, n = 3 independent experiments. Total lane signal (AU) was normalized to the maximum recorded signal within each individual experiment.
- To test whether the effects of doxorubicin and aclarubicin were a general property of intercalating agents, we analyzed the effect of ethidium bromide (EtBr) on DNA replication. A representative experiment of two independent repeats is shown. Increasing concentrations of ethidium bromide progressively decreased formation of final products (scCMs in lanes 16–30) and total DNA replication (overall signal is reduced in lanes 21–30). Additionally, 5.6 µM ethidium bromide (lanes 26–30) recapitulated the effects of 700 nM doxorubicin (Fig 5B, lanes 21–25) and 2.8 µM ethidium bromide (lanes 21–25) resulted in very similar effects to 350 nM doxorubicin (Fig 5B, lanes 16–20). Overall these data indicate that the effects observed for doxorubicin and aclarubicin are a general property of DNA intercalators.
- Plasmid DNA harboring a LacR array was replicated for 19 min to localize replication forks each side of the barrier. Increasing concentrations of doxorubicin were added one minute before IPTG was added to release the barrier and restart replication. Purified replication intermediates were digested with XmnI so that replication fork structures (double‐Ys) and fully replicated molecules (linears) could be identified.
- Samples from (C) were separated on a native agarose gel and visualized by autoradiography.
- Quantification of fork merger from (D). Mean ± SD, n = 3 independent experiments. Fork merger was calculated as a percentage of total lane signal (% of total).
- Replication was performed as in (C) but with a lacOx24 (~750 bp) and lacOx48 (~1,500 bp) LacR array and a single concentration of doxorubicin (1.4 µM).
- lacOx24 array samples from (F) were separated on a native agarose gel and visualized by autoradiography.
- lacOx48 array samples from (F) were separated on a native agarose gel and visualized by autoradiography.
- Quantification of fork merger from (G). Mean ± SD, n = 3 independent experiments. The number in parenthesis for each condition is the time when 25% of forks had merged, calculated by linear interpolation. Fork merger was calculated as a percentage of total lane signal (% of total).
- Quantification of fork merger from (H). Mean ± SD, n = 3 independent experiments. The number in parenthesis for each condition is the time when 25% of forks had merged, calculated by linear interpolation. Fork merger was calculated as a percentage of total lane signal (% of total).
Figure 5. Doxorubicin behaves as an intercalator during DNA replication.

- Plasmid DNA was replicated in the presence of [α‐32P]dATP and vehicle control, aclarubicin, or doxorubicin.
- Samples from (A) were separated on a native agarose gel and visualized by autoradiography.
- Quantification of supercoiled circular monomers from (B). Mean ± SD, n = 3 independent experiments. Abundance of supercoiled monomers was calculated as a percentage of total lane signal (% of total). See also Fig EV5A.
- Plasmid DNA was replicated in the presence of vehicle control or doxorubicin. In parallel, plasmid DNA was incubated with LacR, which bound to a lacO array within the plasmid. After 20 min, when forks were localized either side of the LacR array, vehicle control or doxorubicin were added, along with IPTG to restart DNA replication. Plasmids were purified and digested with XmnI, which cuts the plasmid once and allows replication fork structures (“DYs”) and fully replicated molecules (“Lins”) to be identified.
- Samples from (D) were separated on a native agarose gel and visualized by autoradiography.
- Quantification of fork merger from (E) lanes 1–8. Mean ± SD, n = 3 independent experiments.
- Quantification of fork merger from (E) lanes 9–17. Mean ± SD, n = 3 independent experiments. Fork merger was calculated as a percentage of total lane signal (% of total) for (F), (G).
Intercalators bind double‐stranded DNA, but DNA synthesis takes place at single‐stranded DNA unwound by the replicative helicase (Bell & Labib, 2016). Thus, an intercalator would need to act upon the unreplicated DNA ahead of the fork in order to inhibit DNA synthesis. The major prediction of this model is that inhibition should be proportional to the amount of unreplicated DNA. To test this, we administered doxorubicin at the onset of replication, when all DNA is unreplicated, or just prior to completion of DNA synthesis, when only a small amount of DNA is unreplicated. To this end, we added doxorubicin either at the onset of DNA replication or after localizing replication forks to a LacR‐bound array of lacO sequences (Fig 5D), which functions as an efficient replication barrier (Dewar et al, 2015). In both cases we measured fork merger, which represents the point at which the final stretch of DNA is unwound, as a read‐out for replication fork progression (Fig 5D). Addition of doxorubicin at the onset of replication completely blocked DNA replication (Fig 5E, lanes 5–8) evidenced by the complete lack of radioactive signal compared to the control (Fig 5E, lanes 1–4). Accordingly, fork merger was readily detected in the control but not following doxorubicin addition (Fig 5F). Surprisingly, the same concentration of doxorubicin that completely blocked replication when added early had no discernable effect when added later (Fig 5E, lanes 10–17, 5G). Thus, doxorubicin preferentially inhibits earlier stages of DNA replication, as expected for inhibition of DNA replication by a DNA intercalator. Moreover, the lack of any effect when doxorubicin was added late (Fig 5E, lanes 10–17, 5G) shows that the effect of doxorubicin is entirely dependent on the amount of unreplicated DNA, also as expected for a DNA intercalator.
To directly test whether doxorubicin can inhibit replication fork progression we measured fork merger in the presence of increasing concentrations of doxorubicin (Fig EV5C). When the concentration of doxorubicin was increased 2‐fold, to 1.4 µM, fork merger was strongly inhibited (Fig EV5D, lanes 10–13, EV5E), while 4‐fold higher completely blocked fork merger (Fig EV5D, lanes 14–17, EV5E). These results could be explained by inhibition of either replication fork progression or replication termination. To distinguish between these possibilities, we tested the ability of doxorubicin to inhibit fork merger within a ~750 base pair lacO array compared to a ~1,500 base pair lacO array (Fig EV5F–J). Inhibition of termination should not be affected by the amount of DNA synthesized in the presence of the doxorubicin. Conversely, inhibition of fork progression should be approximately doubled if twice the amount of DNA synthesis occurred in the presence of the drug. Doxorubicin delayed fork merger within the ~750 base pair array by ~4 min (Fig EV5G and I, ~2 min vs. ~6 min) and for the ~1,500 bp array this increased to ~11 min (Fig EV5H and J, ~7 min vs. ~18 min). These data show that fork progression is preferentially inhibited compared to termination. Thus, doxorubicin can inhibit replication fork progression.
In summary, multiple lines of evidence indicate that doxorubicin acts as a DNA intercalator during DNA replication. Doxorubicin exerts the same effects as other well‐established intercalators (Figs 5A–C and EV5B), and its inhibition of DNA replication involves stable binding (Appendix Fig S1A–C) to double‐stranded DNA (Appendix Fig S1D–G). These data show that replication inhibition by doxorubicin is consistent with it acting as a DNA intercalator. Initiation of DNA replication, when essentially the entire DNA template is unreplicated, can be blocked by relatively low concentrations of doxorubicin that have no effect on fork progression at later stages of DNA synthesis (Fig 5D–G). Thus, inhibition of replication is entirely dependent on the amount of unreplicated DNA. Finally, replication fork elongation (fork progression) occurs at higher concentrations of doxorubicin (Fig EV5C–E) and inhibition is greater when the amount of unreplicated DNA is increased (Fig EV5F–J). These data show that inhibition of DNA replication by doxorubicin is proportional to the amount of unreplicated DNA, which is the major prediction of replication inhibition by an intercalator. We conclude that doxorubicin inhibits DNA replication by intercalating into unreplicated DNA.
Etoposide and doxorubicin inhibit replication fork progression through different mechanisms in mammalian cells
Doxorubicin toxicity is largely dependent on TOP2A, which is thought to primarily act during DNA replication (Burgess et al, 2008; Olivieri et al, 2020). We were therefore surprised by the strong TOP2A‐independent inhibition of replication by doxorubicin (Fig 3). To test whether our drug stocks reproduced the previously reported cell killing effects we examined the viability of U2OS cells exposed to etoposide and doxorubicin in the presence or absence of TOP2A. Cells were treated with control or TOP2A siRNA, then etoposide or doxorubicin for 24 h, before the drug was washed out to allow for colony formation (Fig 6A). The concentrations of etoposide and doxorubicin we used resulted in near‐complete loss of viability for cells treated with control siRNA (Fig 6B). Importantly, siRNA knockdown of TOP2A restored most of the loss of viability in both cases (Fig 6B). Although viability was not fully rescued by knockdown of TOP2A this is likely due to the presence of TOP2B, which contributes to lethality following treatment with either etoposide or doxorubicin (Olivieri et al, 2020) and is unaltered by knockdown of TOP2A (Appendix Fig S2). Overall, our data show that cell killing by the exact same drug stocks we used in our experiments (Figs 1, 2, 3, 4, 5) is largely TOP2A‐dependent, as previously reported.
Figure 6. Etoposide and doxorubicin inhibit mammalian DNA replication through distinct mechanisms.

- U2OS cells were treated with siRNA targeting TOP2α (“siTOP2α”) or control siRNA (“siCtrl”), then treated with etoposide or doxorubicin for 24 h. Drugs were washed out and cells were allowed to form colonies for 10 days before being counted.
- Quantification of cell viability from (A). Mean ± SD, n = 3 independent experiments. Viability was measured relative to the control condition (% of Control).
- HCT116 cells were treated with siRNA targeting TOP2α (“siTOP2α”) or control siRNA (“siCtrl”). Cells were then labeled with CldU and IdU and treated with etoposide or doxorubicin for the indicated times prior to DNA combing.
- Track length of individual CldU‐positive fibers from (C). Median is indicated. p‐Values were derived from an ANOVA with Dunn’s multiple comparisons post‐test. A representative experiment of n = 2 biological replicates is shown. See also Appendix Fig S2.
- Etoposide traps TOP2α on newly replicated DNA behind replication forks, preventing catenane resolution. This leads to an accumulation of topological stress that stalls the replication fork.
- Doxorubicin intercalates parental DNA ahead of the fork, inhibiting replication fork progression. Earlier stages of replication are inhibited more than later stages of replication due to the amount of DNA available in front of the fork.
Finally, we tested whether the effects of etoposide and doxorubicin that we observed in Xenopus egg extracts also took place in a different model system. We took advantage of the fact that replication fork progression is inhibited by both etoposide (Fig 4) and doxorubicin (Fig EV5C–E) and this depends on TOP2A for etoposide but not for doxorubicin (Fig 3A–D). To test whether this is also true in mammalian cells, we treated HCT116 cells with either control or TOP2A siRNA, then performed DNA combing to monitor the effects of etoposide and doxorubicin on replication fork progression (Fig 6C). We found that both etoposide and doxorubicin inhibited fork progression in cells treated with control siRNA (Fig 6D) as previously reported (Zellweger et al, 2015). When TOP2A was silenced, there was no significant impact on fork progression (Fig 6D), consistent with our previous observation that loss of TOP2A has little impact on total DNA synthesis (Heintzman et al, 2019). Importantly, etoposide did not stall replication in TOP2A siRNA‐treated cells (Fig 6D), which indicated that replication slowing by etoposide was dependent on TOP2A, as we observed in Xenopus egg extracts (Fig 3A–D). However, doxorubicin stalled replication to a similar extent in both control and TOP2A siRNA‐treated cells (Fig 6D). Importantly, in the presence of doxorubicin, there was no significant difference between fork progression in TOP2A siRNA‐treated cells compared to control (Fig 6D), indicating that doxorubicin slowed replication independent of TOP2A, as we observed in Xenopus egg extracts (Fig 3A–D). We conclude that etoposide inhibits fork progression in a TOP2‐dependent manner while doxorubicin inhibits DNA replication in a TOP2‐independent manner, both in Xenopus egg extracts (Fig 3A–D) and mammalian cells (Fig 6).
Discussion
We have identified new mechanisms of replication inhibition by topoisomerase II (TOP2) poisons, which can be explained by the following models. Etoposide traps TOP2α behind replication forks, which leads to fork stalling due to accumulation of topological stress (Fig 6E). Doxorubicin acts as a DNA intercalator and inhibits all stages of replication by inhibiting unwinding of the replicative helicase (Fig 6F). These points are discussed further below.
Replication inhibition by etoposide
In our model (Fig 6E), etoposide traps TOP2α behind forks, which prevents catenanes from being resolved and stalls replication forks. This model is consistent with the ability of TOP2 poisons to inhibit TOP2 activity (Robinson & Osheroff, 1991). Interestingly, etoposide interferes with fork progression at all stages of DNA synthesis, while our previous work showed that loss of TOP2α stalls forks specifically during termination (Heintzman et al, 2019). Depletion of TOP2α essentially blocks catenane resolution and does not inhibit DNA replication until termination (Heintzman et al, 2019), so it is not clear why preventing catenane resolution by etoposide would inhibit replication at earlier stages. One possibility is that etoposide traps catenanes close behind replication forks, which exacerbates the deleterious effects of catenanes. Accordingly, partial depletion of TOP2α reduced the impact of etoposide and resulted in fork stalling only during termination (Fig EV4G–K). Additionally, replacement of TOP2α with a catalytic dead allele, which would also be expected to trap catenanes behind forks, also led to fork stalling prior to termination (Heintzman et al, 2019). It will be important to definitively determine whether catenane trapping by etoposide causes replication fork stalling. If so, proteins that limit diffusion of topological stress, such as cohesin (Minchell et al, 2020), might regulate the response to etoposide. Additionally, targeting cell cycle regulatory mechanisms (Morafraile et al, 2019) and replication proteins (Schalbetter et al, 2015) that normally limit catenane generation may enhance the cytotoxicity of etoposide.
TOP2β is present in cells and can readily relax DNA supercoils (Austin et al, 2018). If supercoils are formed during vertebrate DNA replication TOP2β should still be trapped on them by etoposide, even following TOP2α inactivation, and this would be expected to inhibit replication. It is therefore surprising that inactivation of TOP2α is sufficient to eliminate replication stalling by etoposide in cells (Fig 6C and D). This may suggest that DNA supercoil formation is rare during vertebrate DNA replication. Infrequent supercoil generation would be consistent with previous observations in Xenopus egg extracts that TOP2α, which can act on both supercoils and catenanes, primarily acts behind replication forks (Lucas et al, 2001; Heintzman et al, 2019). However, recent work has shown that formation of supercoils is strongly favored over catenanes in chromatinized DNA (Le et al, 2019). Our data can be reconciled with these observations if most catenane resolution occurs at the replication fork where chromatin has been disrupted by the replicative helicase (Gruszka et al, 2020). Alternatively, supercoil generation may predominate, as suggested (Le et al, 2019), and efficient activity of topoisomerase I (Keszthelyi et al, 2016; Pommier et al, 2016; Vann et al, 2021) may obviate the need for TOP2α or TOP2β to resolve supercoils. In the future, it will be important to determine how the frequency of supercoils compared to catenanes is determined during vertebrate DNA replication and the relative contribution of different topoisomerases.
Replication inhibition by doxorubicin
Our model proposes that doxorubicin inhibits DNA synthesis by intercalating into the parental DNA (Fig 6F). The simplest explanation is that intercalation stabilizes duplex DNA and forms a barrier to unwinding by the replicative helicase. In support of this model, doxorubicin preferentially inhibits earlier stages of DNA synthesis, consistent with its activity being dependent on unreplicated DNA. This model is also consistent with the ability of doxorubicin to inhibit DNA unwinding by purified large T‐antigen (Bachur et al, 1992), which is the SV40 virus replicative helicase. Although doxorubicin has been reported to induce oxidative DNA damage and DNA cross‐links (Doroshow et al, 2001; Coldwell et al, 2008) we did not observe any broken DNA structures, suggesting that significant DNA damage did not take place during DNA synthesis. Doxorubicin induces histone eviction within minutes (Pang et al, 2013; Qiao et al, 2020; though see also Yang et al, 2013) but this is unlikely to cause replication stalling because histones constrain, rather than promote, fork progression (Kurat et al, 2017).
We did not detect DNA breaks or TOP2 cleavage complexes (DPCs in Fig 2) following doxorubicin treatment during DNA replication (Figs 2 and 3). This cannot be explained by the ability of doxorubicin to act as a TOP2 poison at low concentrations and a TOP2 inhibitor at high concentrations (Capranico et al, 1990b; Atwal et al, 2019) because we did not detect breaks or DPCs even at low concentrations of doxorubicin (Fig 2) that did not inhibit TOP2 activity (Fig 3E–H). Additionally, these observations cannot be attributed to different topoisomerases in Xenopus egg extracts because although TOP2α is the major isoform in Xenopus egg extracts (Gaggioli et al, 2013; Heintzman et al, 2019), TOP2β is also present (Wühr et al, 2014). Furthermore, the effects of doxorubicin were the same with endogenous TOP2α (Fig 3A–D) and the human protein TOP2A (Fig EV3C–I), which is responsible for most of the doxorubicin‐induced DNA damage in cells (Burgess et al, 2008). Collectively, these data show that formation of DNA breaks or DPCs is not a major effect of doxorubicin during DNA replication, in contrast to etoposide.
Implications for cell killing
Our data show that doxorubicin inhibits DNA replication in a TOP2‐independent manner in both Xenopus egg extracts (Fig 3A–D) and human cells (Fig 6C and D). These data, from two different model systems, indicate that inhibition of DNA replication by doxorubicin is unlikely to make a major contribution to its cytotoxicity because inhibition of DNA replication is independent of TOP2 (Figs 3A–D and 6C and D), while the cytotoxicity of doxorubicin largely depends on TOP2 (Fig 6A and B), as previously reported (Burgess et al, 2008). Doxorubicin‐induced fork stalling may be relatively well tolerated because fork progression is not completely blocked (Figs EV5F–J and 6D) so DNA synthesis can ultimately be completed. Alternatively, it may reflect the generally high proficiency of cells to restart replication after even prolonged replication fork stalling (Petermann et al, 2010). Regardless of the explanation, our results clearly decouple the cytotoxicity of doxorubicin from its effects on DNA replication.
In contrast to doxorubicin, our data show that etoposide inhibits replication fork progression in a TOP2‐dependent manner. Given that DNA replication promotes cell killing by etoposide (Fan et al, 2008) and many replication inhibitors exhibit cytotoxicity (Berti et al, 2020), it is likely that inhibition of replication by etoposide contributes to cell killing. It will therefore be important to determine whether replication fork progression can be modulated to further enhance the cytotoxicity of etoposide. It will also be important to determine the roles of other topoisomerases during vertebrate DNA replication and whether inhibiting other topoisomerases can enhance the cytotoxicity of etoposide.
Both etoposide and doxorubicin cause TOP2‐dependent cytotoxicity but only etoposide causes breaks during DNA replication. TOP2α functions during multiple cellular processes (Pommier et al, 2016; Vann et al, 2021) so etoposide may broadly target TOP2 activity, while doxorubicin might preferentially target other aspects of chromosome metabolism. Accordingly, G‐quadruplex stabilizing agents CX‐5461 and pyridostatin both act as TOP2 poisons at sites of transcription by stabilizing G‐quadruplex structures (Olivieri et al, 2020; Bossaert et al, 2021). Furthermore, acquired resistance to CX‐5461 confers resistance to doxorubicin (Bruno et al, 2020). G‐quadruplex structures can also be stabilized by doxorubicin (Scaglioni et al, 2016). Together with our data, these observations raise the possibility that doxorubicin acts as a TOP2 poison during transcription but not DNA replication. In the future, it will be important to test whether TOP2 poisons induce cell killing by targeting different aspects of chromosome metabolism and, if so, how this is determined.
Materials and Methods
Xenopus egg extracts
Xenopus egg extracts were prepared from Xenopus laevis wild‐type male and female frogs (Nasco) as previously described (Lebofsky et al, 2009). Animal care protocols (M1700102‐01) were approved by the Vanderbilt Division of Animal Care (DAC) and Institutional Animal Care and Use Committee (IACUC) and comply with ethical regulations.
Plasmid construction and preparation
The construction of pJD85(p[lacOx8]), pJD88(p[lacOx16]), pJD100(p[lacOx48]) and pJD152(p[lacOx16]) was described previously (Dewar et al, 2015). To create pJD90(p[lacOx24]), the BsrGI/BsiWI DNA fragment from pJD85(p[lacOx8]) was cloned into pJD88(p[lacOx16]) after it had been digested by BsrGI/BsiWI. pJD90(p[lacOx24]) and pJD100(p[lacOx48]) were used in Fig EV5F–J. All other experiments used JD152(p[lacOx16]) as a template for replication.
DNA Replication in Xenopus egg extracts
DNA replication was performed as previously described (Dewar et al, 2015). High Speed Supernatant (“HSS”) was incubated with nocodazole (3 ng/μl) and ATP regenerating system (“ARS”, 20 mM phosphocreatine, 2 mM ATP and 5 ng/μl phosphokinase) for five minutes at room temperature. When indicated, LacR protein was bound to lacO repeats on plasmid DNA for one hour at room temperature before licensing DNA. To license plasmid DNA, one volume of “licensing mix” was prepared by incubating plasmid DNA with HSS (final concentration: 6.75–13.5 ng/μl DNA) at room temperature for 30 min. NucleoPlasmic Extract (“NPE”) was supplemented with ARS, DTT (final concentration: 2 mM), NPE. To initiate replication, 2 volumes of NPE mix were added to 1 volume of licensing mix. If applicable, replication forks that were stalled at a LacR‐bound lacO array were released by IPTG addition as described previously (Dewar et al, 2015). Samples were withdrawn into Replication Stop Solution (8 mM EDTA, 0.13% phosphoric acid, 10% ficoll, 5% SDS, 0.2% bromophenol blue, 80 mM Tris, pH 8) then vigorously mixed, and treated with Proteinase K (929 ng/μl). Etoposide and Doxorubicin were dissolved in DMSO and used at the concentrations. p97 inhibitor (NMS‐873, p97‐i) was dissolved in DMSO and used at a final concentration of 200 µM. Etoposide, doxorubicin, and p97‐i were used with a final concentration of 4% (v/v) DMSO in the reaction. Caffeine was dissolved in water and used at a final concentration of 5 mM. ATR inhibitor (VE‐821, ATRi) was dissolved in water and used at a final concentration of 10 μM. M13 double‐stranded and single‐stranded DNA (NEB) was buffer exchanged into 2.5 mM MgCl2, 50 mM KCl, 10 mM HEPES (pH 7.7) and added to NPE to yield the indicated final concentrations.
Analysis of replication intermediates
Replication intermediates were separated by native agarose gel electrophoresis and detected by autoradiography. Quantification was performed using ImageJ (NIH). To quantify total DNA synthesis, total lane signal was measured and normalized to the maximum signal across all time points and conditions (AU). The abundance of supercoiled monomers, linears, and other indicated species are expressed as a percentage of total lane signal (%). For Fig 2D and H, and EV3E and F signal (AU) was normalized to the maximum signal from the control condition. For Fig 5F and G, the linear signal was expressed as a percentage of total lane signal (%).
Breaks assay
To measure DNA double‐strand breaks, samples were withdrawn into Extraction Stop Solution (0.5% SDS, 25 mM EDTA, 50 mM Tris–HCl, pH 7.5), then treated with RNase A (334 ng/μl) for 30 min at 37°C, followed by Proteinase K (769 ng/μl) for 1 h at 37°C. Samples were then purified by phenol‐chloroform extraction and digested with XmnI restriction enzyme (New England BioLabs) as previously described (Dewar et al, 2015). To identify DNA fragment sizes, 100 bp and 1 kb DNA ladders from New England BioLabs were radiolabeled with T4 PNK then separated alongside XmnI‐digested samples. Breaks were quantified by measuring radioactive signal between 500 and ~1,500 bp for the ~3,100 bp plasmid template. Broken molecules larger than 1,517 bp were excluded from quantification to avoid signal from the highly abundant ~3,100 bp linear product.
DNA‐Protein crosslink detection assay
DNA‐Protein Crosslinks (DPCs) were detected as previously described (Duxin et al, 2014). Briefly, replication assay samples were withdrawn into Replication Stop solution, then split into two. One half of the sample was treated with Proteinase K (889 ng/μl) as described above and the other half was treated with vehicle control. DNA molecules were visualized via native agarose gel electrophoresis. To quantify DPCs, the percentage of radioactive signal above the θ in the +ProK condition was subtracted from the percentage of radioactive signal above the θ in the −ProK condition.
Column isolation assay
For column isolation experiments (Appendix Fig S1A–C) 12.5 ng/μl plasmid DNA was licensed and replicated in Xenopus egg extracts, as described above. Preparation of template DNA for each condition is described below.
For mock‐treated reactions: 25 ng/ul plasmid DNA in 10 mM Tris–HCl, pH 8.0 was combined 1:1 with 8% DMSO (v/v) in water. The combined mixture was used for DNA replication.
For DOX‐treated reactions: 25 ng/μl plasmid DNA in 10 mM Tris–HCl, pH 8.0 was combined 1:1 with 2.1 μM doxorubicin 8% DMSO (v/v) in water. The combined mixture was used for DNA replication.
For column isolated reactions: a Micro Bio‐Spin 6 column (Bio‐Rad) was buffer‐exchanged into 4% DMSO (v/v) in 5 mM Tris–HCl, pH 8.0. 25 ng/μl plasmid DNA was then mixed 1:1 with 2.1 μM doxorubicin and incubated for 30 min. Free doxorubicin was then removed by buffer exchange using the Micro Bio‐Spin 6 column, as per the manufacturer’s instructions. The eluate was then used for DNA replication.
For column control reactions: a Micro Bio‐Spin 6 columns (Bio‐Rad) was buffer‐exchanged into 8% DMSO (v/v) in water. 2.1 μM doxorubicin in water was then subjected to buffer exchange using the Micro Bio‐Spin 6 column, as per the manufacturer’s instructions. The elute was then combined 1:1 with 25 ng/ul plasmid DNA in 10 mM Tris–HCl, pH 8.0 for DNA replication.
Protein purification
Biotinylated LacR protein was expressed in Escherichia coli bacteria cells and purified as described previously (Dewar et al, 2015).
Antibodies
Antibodies targeting Xenopus CDC45, MCM6 and TOP2α were the same as those previously described (Heintzman et al, 2019). The following antibodies were used to detect human proteins: TOP2α (Bethyl, Cat# A300‐054A), TOP2β (Topogen, Cat# tg2010‐3).
Immunodepletions
TOP2α was immunodepleted from extract as previously described (Heintzman et al, 2019). Depleted extracts were collected and used for DNA replication (as above). For rescue experiments (Fig EV3), human recombinant TOP2α was purified as previously described (Heintzman et al, 2019) and was added at a final concentration of 20.78 μg/ml. For the experiments in Fig 3E–H, plasmid DNA was first allowed to replicate in TOP2α depleted extract to allow for catenanes to form. Undepleted extract was then diluted with two volumes 1X ELB to make 33% undepleted NPE. Then at 60 min, the extract was split into equal volumes and treated with drug as indicated. After 30 s of drug incubation with the immunodepleted extract, 1/16th volume of 33% undepleted NPE was added to add back Xenopus TOP2α protein to ~6% of undepleted levels.
Analysis of chromatin‐bound proteins and Western blotting
Plasmid pull downs and Western blotting in Xenopus egg extracts were performed as previously described (Dewar et al, 2017). Western blotting of mammalian cell lysates was also performed as previously described (Mehta et al, 2020). Quantification was performed using ImageJ (NIH).
siRNA
The following siRNAs were used: AllStars Negative Control siRNA (Qiagen, Cat#1027281) and TOP2A (Dharmacon, Cat# J‐004239‐06‐0002, J‐004239‐07‐0002, J‐004239‐08‐0002, and J‐004239‐09‐0002).
Cell viability assay
U2OS cells were transfected with 40 pmol siRNA for 24 h and plated 24 h later (300 cells/60 mm dish). Cells were then treated with drug (Etoposide final concentration: 1 μM; doxorubicin final concentration: 16 nM) 24 h later for a total incubation of 24 h. Drugs were washed out and cells were then allowed to recover in fresh media for 10 days. Colonies were then stained with methylene blue (48% methanol, 2% methylene blue, 50% water) and counted.
DNA molecular combing
Cells were labeled with 20 mM CldU (Sigma, C6891) followed by 100 mM IdU (Sigma, l7125), for the times indicated, with or without 20 µM Etoposide or 10 µM Doxorubicin added with the second nucleoside analog treatment. Approximately 600,000 cells were embedded in 1.5% low‐melting agarose plugs in PBS and were digested overnight in 0.1% Sarkosyl, 2 mg/ml proteinase K, and 50 mM EDTA, pH 8.0 at 50°C. Plugs were washed in TE pH 8.0, transferred to 100 mM MES pH5.7, melted at 68°C and digested with 1.5 units b‐Agarase overnight at 42°C. DNA was combed onto silanized coverslips (Microsurfaces, Inc., Custom) using a Genomic Vision combing apparatus. The DNA was stained with antibodies that recognize IdU and CldU (Abcam Cat#ab6326, BD Cat#347580) for 1 h, washed in PBS, and probed with secondary antibodies for 30 min. Images were obtained using a 40× oil objective (Nikon Eclipse Ti). Analysis of fiber lengths performed using Nikon Elements software.
Experimental study design and statistics
For DNA molecular combing, ANOVA with Dunn’s multiple comparisons post‐test was performed using GraphPad Prism 9. All samples were blinded during the analysis and the data meet the assumptions of the test. For all other experiments, no statistical methods were used to estimate sample size and no blinding was performed.
Author contributions
Sabrina X Van Ravenstein: Data curation; Formal analysis; Validation; Investigation; Visualization; Methodology; Writing—original draft; Writing—review and editing; contributed to design of the project and performed all Xenopus egg extract experiments; also co‐wrote the manuscript. Kavi P Mehta: Formal analysis; Validation; Investigation; Visualization; provided input on project design, oversaw cell viability assays and performed DNA combing. Tamar Kavlashvili: Resources; provided biotinylated LacR for experiments in Xenopus egg extracts. Jo Ann W Byl: Resources; purified human TOP2A. Runxiang Zhao: Investigation; performed Western blotting of human cell lysates. Neil Osheroff: Supervision; oversaw purification of human TOP2A by JAWB. David Cortez: Supervision; provided input on project design and supervised JM and RZ. James M Dewar: Conceptualization; Resources; Supervision; Funding acquisition; Validation; Investigation; Visualization; Methodology; Writing—original draft; Project administration; Writing—review and editing; designed and oversaw the project and wrote the manuscript. Also performed cell viability assays.
Disclosure and competing interests statement
The authors declare that they have no conflict of interest.
Supporting information
Appendix
Expanded View Figures PDF
Acknowledgements
JMD was supported by NIH grant R35GM128696. NO was supported by R01GM126363. DC was supported by R01CA239161. KPM was supported by F32GM136096. We thank Stedman Stephens for experimental assistance and Stephanie Medina for sharing unpublished observations.
The EMBO Journal (2022) 41: e110632
Data availability
No deposited datasets are included.
References
- Atwal M, Swan RL, Rowe C, Lee KC, Lee DC, Armstrong L, Cowell IG, Austin CA (2019) Intercalating TOP2 poisons attenuate topoisomerase action at higher concentrations. Mol Pharmacol 96: 475–484 [DOI] [PMC free article] [PubMed] [Google Scholar]
- Austin CA, Lee KC, Swan RL, Khazeem MM, Manville CM, Cridland P, Treumann A, Porter A, Morris NJ, Cowell IG (2018) TOP2B: the first thirty years. Int J Mol Sci 19: 2765 [DOI] [PMC free article] [PubMed] [Google Scholar]
- Bachur NR, Yu F, Johnson R, Hickey R, Wu Y, Malkas L (1992) Helicase inhibition by anthracycline anticancer agents. Mol Pharmacol 41: 993–998 [PubMed] [Google Scholar]
- Bell SP, Labib K (2016) Chromosome duplication in Saccharomyces cerevisiae . Genetics 203: 1027–1067 [DOI] [PMC free article] [PubMed] [Google Scholar]
- Berti M, Cortez D, Lopes M (2020) The plasticity of DNA replication forks in response to clinically relevant genotoxic stress. Nat Rev Mol Cell Biol 21: 633–651 [DOI] [PubMed] [Google Scholar]
- Bossaert M, Pipier A, Riou J‐F, Noirot C, Nguyên L‐T, Serre R‐F, Bouchez O, Defrancq E, Calsou P, Britton S et al (2021) Transcription‐associated topoisomerase 2α (TOP2A) activity is a major effector of cytotoxicity induced by G‐quadruplex ligands. eLife 10: e65184 [DOI] [PMC free article] [PubMed] [Google Scholar]
- Bruno PM, Lu M, Dennis KA, Inam H, Moore CJ, Sheehe J, Elledge SJ, Hemann MT, Pritchard JR (2020) The primary mechanism of cytotoxicity of the chemotherapeutic agent CX‐5461 is topoisomerase II poisoning. Proc Natl Acad Sci USA 117: 4053–4060 [DOI] [PMC free article] [PubMed] [Google Scholar]
- Burgess DJ, Doles J, Zender L, Xue W, Ma B, McCombie WR, Hannon GJ, Lowe SW, Hemann MT (2008) Topoisomerase levels determine chemotherapy response in vitro and in vivo . Proc Natl Acad Sci USA 105: 9053–9058 [DOI] [PMC free article] [PubMed] [Google Scholar]
- Canela A, Maman Y, Jung S, Wong N, Callen E, Day A, Kieffer‐Kwon K‐R, Pekowska A, Zhang H, Rao SSP et al (2017) Genome organization drives chromosome fragility. Cell 170: 507–521 [DOI] [PMC free article] [PubMed] [Google Scholar]
- Canela A, Maman Y, Huang S‐Y, Wutz G, Tang W, Zagnoli‐Vieira G, Callen E, Wong N, Day A, Peters J‐M et al (2019) Topoisomerase II‐induced chromosome breakage and translocation is determined by chromosome architecture and transcriptional activity. Mol Cell 75: 252–266 [DOI] [PMC free article] [PubMed] [Google Scholar]
- Capranico G, Kohn KW, Pommier Y (1990a) Local sequence requirements for DNA cleavage by mammalian topoisomerase II in the presence of doxorubicin. Nucleic Acids Res 18: 6611–6619 [DOI] [PMC free article] [PubMed] [Google Scholar]
- Capranico G, Zunino F, Kohn KW, Pommier Y (1990b) Sequence‐selective topoisomerase II inhibition by anthracycline derivatives in SV40 DNA: relationship with DNA binding affinity and cytotoxicity. Biochemistry 29: 562–569 [DOI] [PubMed] [Google Scholar]
- Coldwell KE, Cutts SM, Ognibene TJ, Henderson PT, Phillips DR (2008) Detection of Adriamycin‐DNA adducts by accelerator mass spectrometry at clinically relevant Adriamycin concentrations. Nucleic Acids Res 36: e100 [DOI] [PMC free article] [PubMed] [Google Scholar]
- Costanzo V, Shechter D, Lupardus PJ, Cimprich KA, Gottesman M, Gautier J (2003) An ATR‐ and Cdc7‐Dependent DNA damage checkpoint that inhibits initiation of DNA replication. Mol Cell 11: 203–213 [DOI] [PubMed] [Google Scholar]
- Deng L, Wu RA, Sonneville R, Kochenova OV, Labib K, Pellman D, Walter JC (2019) Mitotic CDK promotes replisome disassembly, fork breakage, and complex DNA rearrangements. Mol Cell 73: 915–929 [DOI] [PMC free article] [PubMed] [Google Scholar]
- Dewar JM, Budzowska M, Walter JC (2015) The mechanism of DNA replication termination in vertebrates. Nature 525: 345–350 [DOI] [PMC free article] [PubMed] [Google Scholar]
- Dewar JM, Low E, Mann M, Räschle M, Walter JC (2017) CRL2(Lrr1) promotes unloading of the vertebrate replisome from chromatin during replication termination. Genes Dev 31: 275–290 [DOI] [PMC free article] [PubMed] [Google Scholar]
- Doroshow JH, Synold TW, Somlo G, Akman SA, Gajewski E (2001) Oxidative DNA base modifications in peripheral blood mononuclear cells of patients treated with high‐dose infusional doxorubicin. Blood 97: 2839–2845 [DOI] [PubMed] [Google Scholar]
- Duxin JP, Dewar JM, Yardimci H, Walter JC (2014) Repair of a DNA‐protein crosslink by replication‐coupled proteolysis. Cell 159: 346–357 [DOI] [PMC free article] [PubMed] [Google Scholar]
- Fan JR, Peng AL, Chen HC, Lo SC, Huang TH, Li TK (2008) Cellular processing pathways contribute to the activation of etoposide‐induced DNA damage responses. DNA Repair 7: 452–463 [DOI] [PubMed] [Google Scholar]
- Farcas AM, Uluocak P, Helmhart W, Nasmyth K (2011) Cohesin's concatenation of sister DNAs maintains their intertwining. Mol Cell 44: 97–107 [DOI] [PMC free article] [PubMed] [Google Scholar]
- Gaggioli V, Le Viet B, Germe T, Hyrien O (2013) DNA topoisomerase IIα controls replication origin cluster licensing and firing time in Xenopus egg extracts. Nucleic Acids Res 41: 7313–7331 [DOI] [PMC free article] [PubMed] [Google Scholar]
- Grue P, Grässer A, Sehested M, Jensen PB, Uhse A, Straub T, Ness W, Boege F (1998) Essential mitotic functions of DNA topoisomerase IIalpha are not adopted by topoisomerase IIbeta in human H69 cells. J Biol Chem 273: 33660–33666 [DOI] [PubMed] [Google Scholar]
- Gruszka DT, Xie S, Kimura H, Yardimci H (2020) Single‐molecule imaging reveals control of parental histone recycling by free histones during DNA replication. Sci Adv 6: eabc0330 [DOI] [PMC free article] [PubMed] [Google Scholar]
- Heintzman DR, Campos LV, Byl JAW, Osheroff N, Dewar JM (2019) Topoisomerase II is crucial for fork convergence during vertebrate replication termination. Cell Rep 29: 422–436 [DOI] [PMC free article] [PubMed] [Google Scholar]
- Holm C, Covey JM, Kerrigan D, Pommier Y (1989) Differential requirement of DNA replication for the cytotoxicity of DNA topoisomerase I and II inhibitors in Chinese hamster DC3F cells. Can Res 49: 6365 [PubMed] [Google Scholar]
- Hsiang YH, Lihou MG, Liu LF (1989) Arrest of replication forks by drug‐stabilized topoisomerase I‐DNA cleavable complexes as a mechanism of cell killing by camptothecin. Cancer Res 49: 5077–5082 [PubMed] [Google Scholar]
- Keszthelyi A, Minchell NE, Baxter J (2016) The causes and consequences of topological stress during DNA replication. Genes 7: 134 [DOI] [PMC free article] [PubMed] [Google Scholar]
- Koster DA, Palle K, Bot ES, Bjornsti MA, Dekker NH (2007) Antitumour drugs impede DNA uncoiling by topoisomerase I. Nature 448: 213–217 [DOI] [PubMed] [Google Scholar]
- Krasinska L, Fisher D (2009) Replication initiation complex formation in the absence of nuclear function in Xenopus . Nucleic Acids Res 37: 2238–2248 [DOI] [PMC free article] [PubMed] [Google Scholar]
- Kurat CF, Yeeles JTP, Patel H, Early A, Diffley JFX (2017) Chromatin controls DNA replication origin selection, lagging‐strand synthesis, and replication fork rates. Mol Cell 65: 117–130 [DOI] [PMC free article] [PubMed] [Google Scholar]
- Laskey RA, Mills AD, Morris NR (1977) Assembly of SV40 chromatin in a cell‐free system from Xenopus eggs. Cell 10: 237–243 [DOI] [PubMed] [Google Scholar]
- Le TT, Gao X, Park SH, Lee J, Inman JT, Lee JH, Killian JL, Badman RP, Berger JM, Wang MD (2019) Synergistic coordination of chromatin torsional mechanics and topoisomerase activity. Cell 179: 619–631 [DOI] [PMC free article] [PubMed] [Google Scholar]
- Lebofsky R, Takahashi T, Walter JC (2009) DNA replication in nucleus‐free Xenopus egg extracts. In DNA Replication, Vol. 521, pp 229–252. Methods in Molecular Biology. New York, NY: Humana Press; [DOI] [PubMed] [Google Scholar]
- Linka RM, Porter AC, Volkov A, Mielke C, Boege F, Christensen MO (2007) C‐terminal regions of topoisomerase IIalpha and IIbeta determine isoform‐specific functioning of the enzymes in vivo . Nucleic Acids Res 35: 3810–3822 [DOI] [PMC free article] [PubMed] [Google Scholar]
- Long BH, Musial ST, Brattain MG (1985) Single‐ and double‐strand DNA breakage and repair in human lung adenocarcinoma cells exposed to etoposide and teniposide. Cancer Res 45: 3106–3112 [PubMed] [Google Scholar]
- Lucas I, Germe T, Chevrier‐Miller M, Hyrien O (2001) Topoisomerase II can unlink replicating DNA by precatenane removal. EMBO J 20: 6509–6519 [DOI] [PMC free article] [PubMed] [Google Scholar]
- Markovits J, Pommier Y, Kerrigan D, Covey JM, Tilchen EJ, Kohn KW (1987) Topoisomerase II‐mediated DNA breaks and cytotoxicity in relation to cell proliferation and the cell cycle in NIH 3T3 fibroblasts and L1210 leukemia cells. Cancer Res 47: 2050–2055 [PubMed] [Google Scholar]
- Mehta KPM, Lovejoy CA, Zhao R, Heintzman DR, Cortez D (2020) HMCES maintains replication fork progression and prevents double‐strand breaks in response to APOBEC deamination and abasic site formation. Cell Rep 31: 107705 [DOI] [PMC free article] [PubMed] [Google Scholar]
- Minchell NE, Keszthelyi A, Baxter J (2020) Cohesin causes replicative DNA damage by trapping DNA topological stress. Mol Cell 78: 739–751 [DOI] [PMC free article] [PubMed] [Google Scholar]
- Morafraile EC, Hänni C, Allen G, Zeisner T, Clarke C, Johnson MC, Santos MM, Carroll L, Minchell NE, Baxter J et al (2019) Checkpoint inhibition of origin firing prevents DNA topological stress. Genes Dev 33: 1539–1554 [DOI] [PMC free article] [PubMed] [Google Scholar]
- Murai J (2017) Targeting DNA repair and replication stress in the treatment of ovarian cancer. Int J Clin Oncol 22: 619–628 [DOI] [PubMed] [Google Scholar]
- Muslimović A, Nyström S, Gao Y, Hammarsten O (2009) Numerical analysis of etoposide induced DNA breaks. PLoS One 4: e5859 [DOI] [PMC free article] [PubMed] [Google Scholar]
- Nitiss JL (2009) Targeting DNA topoisomerase II in cancer chemotherapy. Nat Rev Cancer 9: 338–350 [DOI] [PMC free article] [PubMed] [Google Scholar]
- Olivieri M, Cho T, Álvarez‐Quilón A, Li K, Schellenberg MJ, Zimmermann M, Hustedt N, Rossi SE, Adam S, Melo H et al (2020) A Genetic map of the response to DNA damage in human cells. Cell 182: 481–496 [DOI] [PMC free article] [PubMed] [Google Scholar]
- Pang B, Qiao X, Janssen L, Velds A, Groothuis T, Kerkhoven R, Nieuwland M, Ovaa H, Rottenberg S, van Tellingen O et al (2013) Drug‐induced histone eviction from open chromatin contributes to the chemotherapeutic effects of doxorubicin. Nat Commun 4: 1908 [DOI] [PMC free article] [PubMed] [Google Scholar]
- Petermann E, Orta ML, Issaeva N, Schultz N, Helleday T (2010) Hydroxyurea‐stalled replication forks become progressively inactivated and require two different RAD51‐mediated pathways for restart and repair. Mol Cell 37: 492–502 [DOI] [PMC free article] [PubMed] [Google Scholar]
- Pommier Y, Sun Y, Huang S‐YN, Nitiss JL (2016) Roles of eukaryotic topoisomerases in transcription, replication and genomic stability. Nat Rev Mol Cell Biol 17: 703–721 [DOI] [PMC free article] [PubMed] [Google Scholar]
- Priego Moreno S, Jones RM, Poovathumkadavil D, Scaramuzza S, Gambus A (2019) Mitotic replisome disassembly depends on TRAIP ubiquitin ligase activity. Life Sci Alliance 2: e201900390 [DOI] [PMC free article] [PubMed] [Google Scholar]
- Qiao X, van der Zanden SY, Wander DPA, Borràs DM, Song J‐Y, Li X, van Duikeren S, van Gils N, Rutten A, van Herwaarden T et al (2020) Uncoupling DNA damage from chromatin damage to detoxify doxorubicin. Proc Natl Acad Sci USA 117: 15182–15192 [DOI] [PMC free article] [PubMed] [Google Scholar]
- Robinson MJ, Osheroff N (1991) Effects of antineoplastic drugs on the post‐strand‐passage DNA cleavage/religation equilibrium of topoisomerase II. Biochemistry 30: 1807–1813 [DOI] [PubMed] [Google Scholar]
- Scaglioni L, Mondelli R, Artali R, Sirtori FR, Mazzini S (2016) Nemorubicin and doxorubicin bind the G‐quadruplex sequences of the human telomeres and of the c‐MYC promoter element Pu22. Biochim Biophys Acta 1860: 1129–1138 [DOI] [PubMed] [Google Scholar]
- Schalbetter SA, Mansoubi S, Chambers AL, Downs JA, Baxter J (2015) Fork rotation and DNA precatenation are restricted during DNA replication to prevent chromosomal instability. Proc Natl Acad Sci USA 112: E4565–4570 [DOI] [PMC free article] [PubMed] [Google Scholar]
- Sonneville R, Moreno SP, Knebel A, Johnson C, Hastie CJ, Gartner A, Gambus A, Labib K (2017) CUL‐2(LRR‐1) and UBXN‐3 drive replisome disassembly during DNA replication termination and mitosis. Nat Cell Biol 19: 468–479 [DOI] [PMC free article] [PubMed] [Google Scholar]
- Strumberg D, Pilon AA, Smith M, Hickey R, Malkas L, Pommier Y (2000) Conversion of topoisomerase I cleavage complexes on the leading strand of ribosomal DNA into 5'‐phosphorylated DNA double‐strand breaks by replication runoff. Mol Cell Biol 20: 3977–3987 [DOI] [PMC free article] [PubMed] [Google Scholar]
- Sumara I, Vorlaufer E, Stukenberg PT, Kelm O, Redemann N, Nigg EA, Peters JM (2002) The dissociation of cohesin from chromosomes in prophase is regulated by Polo‐like kinase. Mol Cell 9: 515–525 [DOI] [PubMed] [Google Scholar]
- Sun Y, Saha LK, Saha S, Jo U, Pommier Y (2020) Debulking of topoisomerase DNA‐protein crosslinks (TOP‐DPC) by the proteasome, non‐proteasomal and non‐proteolytic pathways. DNA Repair 94: 102926 [DOI] [PMC free article] [PubMed] [Google Scholar]
- Tammaro M, Barr P, Ricci B, Yan H (2013) Replication‐dependent and transcription‐dependent mechanisms of DNA double‐strand break induction by the topoisomerase 2‐targeting drug etoposide. PLoS One 8: e79202 [DOI] [PMC free article] [PubMed] [Google Scholar]
- Uusküla‐Reimand L, Hou H, Samavarchi‐Tehrani P, Rudan MV, Liang M, Medina‐Rivera A, Mohammed H, Schmidt D, Schwalie P, Young EJ et al (2016) Topoisomerase II beta interacts with cohesin and CTCF at topological domain borders. Genome Biol 17: 182 [DOI] [PMC free article] [PubMed] [Google Scholar]
- Vann KR, Oviatt AA, Osheroff N (2021) Topoisomerase II poisons: converting essential enzymes into molecular scissors. Biochemistry 60: 1630–1641 [DOI] [PMC free article] [PubMed] [Google Scholar]
- Vrtis KB, Dewar JM, Chistol G, Wu RA, Graham TGW, Walter JC (2021) Single‐strand DNA breaks cause replisome disassembly. Mol Cell 81: 1309–1318 [DOI] [PMC free article] [PubMed] [Google Scholar]
- Walter J, Newport J (2000) Initiation of Eukaryotic DNA Replication. Mol Cell 5: 617–627 [DOI] [PubMed] [Google Scholar]
- Walter J, Sun L, Newport J (1998) Regulated chromosomal DNA replication in the absence of a nucleus. Mol Cell 1: 519–529 [DOI] [PubMed] [Google Scholar]
- Waqar SN, Morgensztern D (2017) Treatment advances in small cell lung cancer (SCLC). Pharmacol Ther 180: 16–23 [DOI] [PubMed] [Google Scholar]
- Willmore E, Frank AJ, Padget K, Tilby MJ, Austin CA (1998) Etoposide targets topoisomerase IIalpha and IIbeta in leukemic cells: isoform‐specific cleavable complexes visualized and quantified in situ by a novel immunofluorescence technique. Mol Pharmacol 54: 78–85 [DOI] [PubMed] [Google Scholar]
- Wu RA, Semlow DR, Kamimae‐Lanning AN, Kochenova OV, Chistol G, Hodskinson MR, Amunugama R, Sparks JL, Wang M, Deng L et al (2019) TRAIP is a master regulator of DNA interstrand crosslink repair. Nature 567: 267–272 [DOI] [PMC free article] [PubMed] [Google Scholar]
- Wühr M, Freeman RM Jr, Presler M, Horb ME, Peshkin L, Gygi S, Kirschner MW (2014) Deep proteomics of the Xenopus laevis egg using an mRNA‐derived reference database. Curr Biol 24: 1467–1475 [DOI] [PMC free article] [PubMed] [Google Scholar]
- Yan H, Tammaro M, Liao S (2016) Collision of trapped topoisomerase 2 with transcription and replication: generation and repair of DNA double‐strand breaks with 5' adducts. Genes 7: 32 [DOI] [PMC free article] [PubMed] [Google Scholar]
- Yang F, Kemp CJ, Henikoff S (2013) Doxorubicin enhances nucleosome turnover around promoters. Curr Biol 23: 782–787 [DOI] [PMC free article] [PubMed] [Google Scholar]
- Yang F, Kemp CJ, Henikoff S (2015) Anthracyclines induce double‐strand DNA breaks at active gene promoters. Mutat Res 773: 9–15 [DOI] [PMC free article] [PubMed] [Google Scholar]
- Yang F, Teves SS, Kemp CJ, Henikoff S (2014) Doxorubicin, DNA torsion, and chromatin dynamics. Biochim Biophys Acta 1845: 84–89 [DOI] [PMC free article] [PubMed] [Google Scholar]
- Zellweger R, Dalcher D, Mutreja K, Berti M, Schmid JA, Herrador R, Vindigni A, Lopes M (2015) Rad51‐mediated replication fork reversal is a global response to genotoxic treatments in human cells. J Cell Biol 208: 563–579 [DOI] [PMC free article] [PubMed] [Google Scholar]