Abstract
We have developed new software, Re-track, that will quantify the rates of retraction and protrusion of structures emanating from the central core of a cell, such as neurites or filopodia. Re-Track, uses time-lapse images of cells in TIFF format and calculates the velocity of retraction or protrusion of a selected structure. The software uses a flexible moving boundary and has the ability to correct this boundary throughout analysis. Re-Track is fast, platform independent, and user friendly, and it can be used to follow biological events such as changes in neuronal connections, tip-growing cells such as moss, adaptive migration of cells, and similar behavior in non-biological systems.
Keywords: Software, Retraction, Protrusion growth, Neurites, Tip-growing cells
1. Introduction
Many biological events involve the formation of processes and protrusions that emerge from a central structure, such as the cell body. Some of these structures allow for cell movement whereas others allow for the attachment of cells onto surfaces for adhesion, which are critical for events such as immune responses and tissue development [1]. Filopodia associated with migration play a critical role in the spread of cancer [2]. Additionally, many cells naturally grow and retract structures that sample the environment and probe for presence of neighboring cells or nutrients [3]. Retraction and protrusion events also play a major role in the development and restructuring of neuronal networks that are vital for learning and development (e.g. Ref. [4]).
Here, we describe the software, Re-track, that allows us to quantify the velocity of retraction and protrusion of structures independent of their size, using only a high-resolution time-lapse video of any magnification. As detailed below, Re-track fills a void in current software needed to analyze growth and morphology of neurons but is also general enough to be applicable to all natural and synthetic systems. The information gleaned from Re-track can help delineate environmental and cellular factors that contribute to the rates of these events.
2. Material and methods
Demonstration of the software can be found in the linked videos.
Supplementary video related to this article can be found at https://doi.org/10.1016/j.ab.2020.113626
2.1. Description of software
Re-track was developed to track tip growth/contraction in Java 1.7 or higher in the following operating systems: Windows (7), Mac OS X (10.9 or newer), or Linux (Ubuntu 10.04, RHEL 5.4 or newer).
The general procedure is the initial input of time-lapse images into the software in TIFF format that contains continuous frames of a captured video, as detailed below. After opening the file, the user can see the video in the viewport. Changes in the length of a specific structure with time are calculated by selecting the structure of interest. A smaller viewport on the right side shows the output of the algorithm based on the input parameters. After finding the optimal parameters for a frame, it can be used for the whole movie. It is also possible to use the parameters for other videos with a similar microscopic setup.
The application is opened by double clicking on the JAR file or by using the following command:
cd path/to/separationtracker.
java -jar separationtracker.jar.
2.2. Definitions of buttons and settings
Understanding how a software works is critical for proper use. Each of the sliders and parameters have distinct uses for analyzing videos in Re-Track and any combination of them could be used to properly analyze a video. The input file is imported into the software using Open Stack. This will open a single TIFF file or multiple images as a stack. The spatial position of the structure of interest can be located by clicking on its base and tip. After doing this, a red-line will appear on top of the main viewport. This line act as a guide to crop and rotate the original image. By re-adjusting this line at the different frames, Re-Track automatically interpolates its length, location, and direction for the intermediate frames. Width is the parameter that refers to the width of the cropped box around the red-line. After determining the line that connects the two manually clicked points, Re-Track will rotate and crop the images based on the line and apply the edge detection algorithm on the cropped image. After locating the structure, the threshold for the detection must be adjusted to optimize edge detection using the Threshold slider. This value may vary from one experiment to another. It is possible that some regions the structure seem to be edgeless or blended with the background of the image due to low contrast imaging or noise or etc. In such cases, Re-Track might consider one structure as two. Depending on the specific video or stack file, Merge Dist can be adjusted to account for the discontinuity. This parameter is important for videos where Breaking will be used. Breaking is utilized (checked) when cell structures (such as a synapse) are joined then snap during the video. If this option is unchecked, the first manually added point should be on the soma of the cell with the line extending past the structure (i.e. Neurite), see video Re-Track breaking. Clear determines the strength of erosion morphology. In the Edge detector viewport the background will be red and the blue pixels represent the structure of interest. For example, if the structure of interest is a neurite, the blue pixels in the Edge detector view should correspond to the same shape and size of the neurite in the file viewport. To reduce the noise of the input image, we apply a moving average with a window size determined by Smooth. This value can adjusted as necessary to account for varying amounts of noise. Jump will be used if the structure (i.e. neurite) makes large movements through the frames and cannot be followed properly. If the speed of a pixel movement is greater than the jump value, it would be consider a jump and be discarded from the output data set. Edge Detection View displays the result of edge detection. The width is determined by Width and the height is the length of the red-line. After obtaining a satisfactory result, From/To adds a time interval of the original file to the output file. Relative refers to the positions and velocities relative to endpoints of the line. Linear interpolation, when checked, dictates the software to linearly interpolate the value for the Y position in the data when there is a discarded frame between two detected frames. When it is unchecked, the “Y” coordinate of any discarded frame is assigned “−1”. This will be helpful, for plotting the position data and/or calculating the velocity of the tip(s). Progress Bar corresponds to the percentage of the frames processed. X cancels the current task. Positions will save the positions of the tip in a text file. The output file consists of five columns (time, x1, y1, x2, y2). The positions are based on the edge detection coordinates. If the application cannot determine the position of a tip, it gives −1,−1 as the x and y coordinate pair.
2.3. Method to detect the position of the tip
Re-track uses a TIFF file of the high resolution video as the input and displays it in the viewport. As retraction/protrusion may happen in a portion of the movie, a time slider is located at the bottom of the viewport to determine the time interval of the process. The spatial region of the structure of interest can be determined by manually clicking the corresponding beginning and end of the structure in a way that the whole structure remains inside the region (box) at all times. To reduce the computational cost, Re-Track uses the initial and endpoint to rotate and crop the image. The height of the cropped images is equal to Euclidean distance between the two points and its width can be adjusted by the Width parameter. There is a secondary viewport on the right side of the main viewport, Edge Detection View, which presents the output of the applied algorithm on the cropped image.
With the cropped image, Re-track applies a moving average on the image to reduce the noise. The size of the filter is determined by the Smooth parameter. Then it applies a Laplace filter to find the edges. The result will turn to a red and blue image by applying a threshold. False detection can be reduced by applying an erosion morphology. The Clear parameters adjust the size of the erosion. Once the edges are properly detected, Re-track follows them from the tip(s) toward the end (s). To find the tip, Re-Track turns the secondary viewport to a h × w matrix of zeros (red pixels) and ones (blue pixel), where h is the height of the image and w is its width. Then it generates the h × w sub-matrixes, Ai, where n is adjusted by Merg Dist each of them is consists of i to i + n, i = 1, …, h-n rows of the main matrix. After generating each submatrix, Re-Track calculates the summation of all of the components. If the result of the summation is equal to zero, that point is considered as the tip of the structure. Noise and moving particles near the tip can induce false detections. These false detections can be discarded using the Jump parameter. This parameter puts a maximum threshold for the tip displacement for every two adjacent frames. If the displacement of the tip passes this value between the ith frame and i + 1, Re-Track discards the (i + 1) frame and compares the displacement of the tip between ith and (i + 2)th frames. It will continue this procedure until it finds a frame where the tip is within the determined range. Re-Track may lose the position of the tip during this procedure. In this case, it is necessary to readjust the parameters for a better result. A flowchart of the procedure is shown in Fig. 1. Upon opening the software, the following window will appear as in Fig. 2.
Fig. 1.
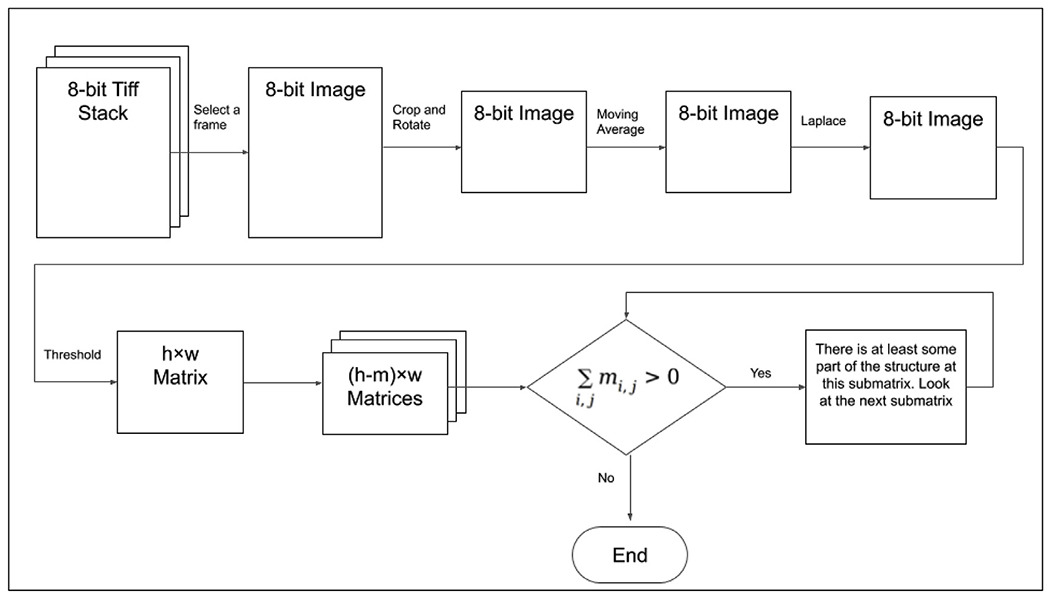
A flowchart of the tip detection algorithm.
Fig. 2.
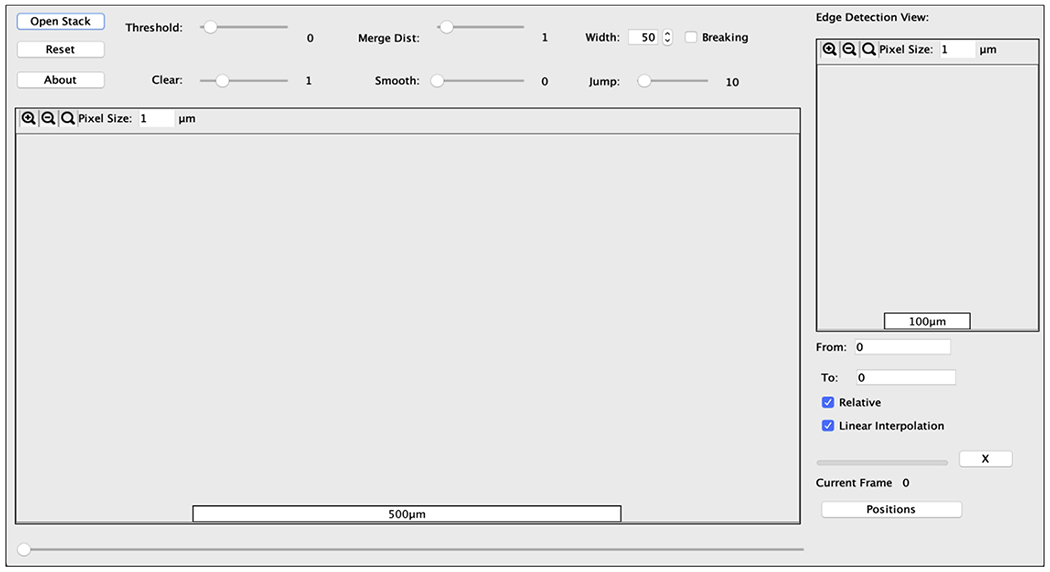
Screenshot of the initial Re-track program window. See video Re-Track_PC12.
Upon opening the software, the stack of images can be imputed using the Open Stack button. The images can be a single TIFF or separate files. It may take a few minutes to load the images depending on their size. After loading the input file, you should see the open images in the main window viewport similar to the one shown in Fig. 3.
Fig. 3.
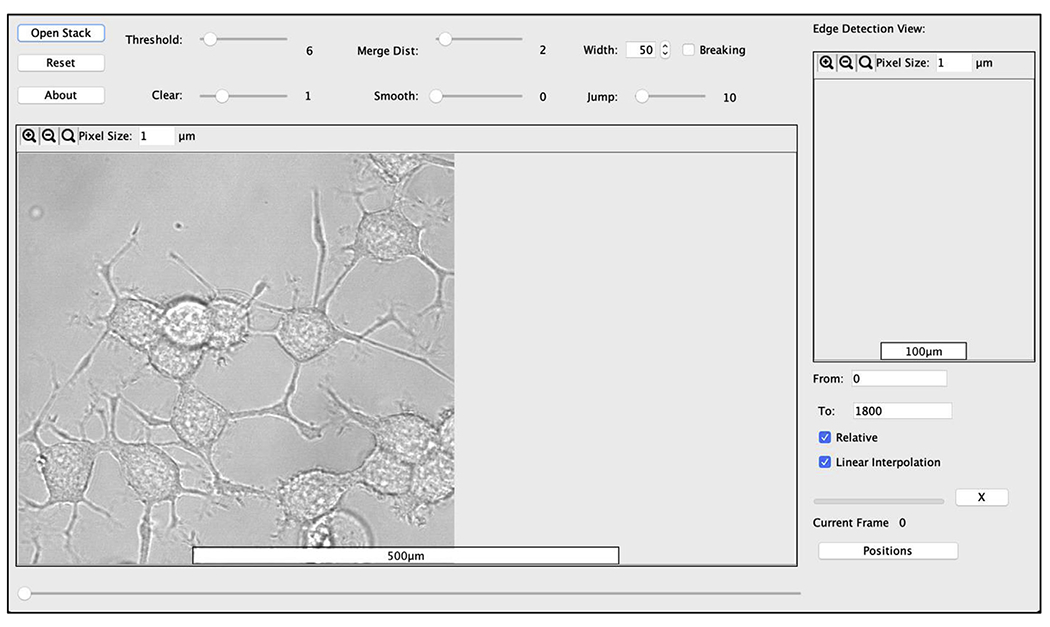
Screenshot of Re-track loaded with a TIFF file of PC12 neuronal cells. From this screen, individual neurites or comparable structures can be selected one at a time and then reset using the Reset button on the top left. See video Re-Track_PC12.
Re-track follows changes in specific structures with time. In some systems, the protrusion structures (i.e. neurites) are linked together but then separate during the retraction event. In these cases, the time parameter can be accessed by the Time slider to get closer to the separation time. For these circumstances, the Breaking checkbox can be checked. You can then determine the line that connects two cells by clicking one base of the structure on the main view. After the first click, the Time slider will be disabled until the user determines the other end point by clicking again.
Following the time period selection, click on the selected structure again. You should see a red line on the screen (see Fig. 4). By doing this, you will have a Key Frame for the line following the neurite. You can change the length of the line by clicking again on the Key Frame. As you go through frames, you can re-draw the red line to more closely fit the neurite, if desired. This procedure allows for intermediate frames (Inbetweens) between two key frames. Re-Track will animate the line using linear interpolation. The line will not appear before the earliest key frame.
Fig. 4.
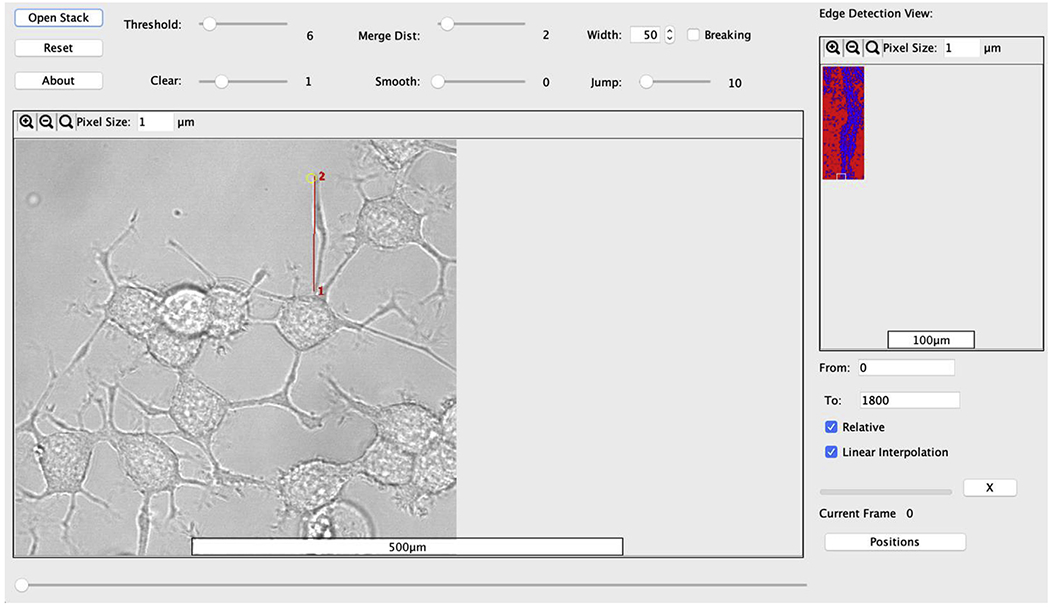
Screenshot of a Re-track window that follows the retraction of a neurite where the red numbers (1 and 2) refer to the start and end points, respectively, and the line connecting them is in red which appears after selecting the time frame. To the right, you will see an edge detection view once the red line is drawn. The blue shows the region that the software identifies as the neurite and the background in red. If this detection view does not match your image, then a new line should be drawn. This neurite does not have two tips so the Breaking box located above Jump is unchecked. (For interpretation of the references to colour in this figure legend, the reader is referred to the Web version of this article.)
The two white boxes in the Edge Detection View determine the position of tips. When you are happy with the result, (i.e. how the line follows the retracting structure over time), you can click the Positions button and save the output as a text file and analyze further using software such as MATLAB or Microsoft Excel.
3. Experimental methods
3.1. Cell culture, transfection and differentiation
PC12 cells, which are derived from rat pheochromocytoma, were cultured in 35 mm poly-d-lysine coated petri dishes using Dulbecco’s Modified Eagle’s Medium (DMEM) with 10% heat-inactivated horse serum, 5% fetal bovine serum, and 1% penicillin/streptomycin. Dishes were maintained in an incubator under 5% CO2 at 37 °C. Cells were transfected using different amounts of plasmid (see details below) based on the concentration. Cells were transfected using Lipofectamine 3000 (Invitrogen, Inc.) following the manufacturer’s protocol. The media used in transfection was the same as culture media with the exception that antibiotics were eliminated to increase transfection efficiency. The media was then returned to culture media in 24 h.
Cells were differentiated using media that contained DMEM, 1% heat-inactivated horse serum and 1% penicillin/streptomycin. Differentiation was then induced by adding a 1 to 1000 ratio of nerve growth factor (NGF). Cells were then incubated for at least 48 h and up to 96 h to achieve full differentiation as seen by neurites whose lengths are greater than three time the diameter of the cell body (see Refs. [5,6]).
3.2. Fluorescence microscopy studies
Fluorescence imaging was done using a Zeiss LSM inverted confocal microscope. Imaging occurred at least 48 h post transfection and differentiation. The cells were imaged in MAT-Tek 8-chamber glass bottom dishes or MAT-Tek 35 mm glass bottom dishes. Single cells expressing the plasmid or fluorophore of interest were first identified visually before switching to the desired wavelength and laser intensity. In the studies described in the Results, time series videos were initiated, stopped after 10 frames (100 frames per second), and treated with carbachol to induce retraction. The time series was then resumed.
3.3. Carbachol preparation
Solid carbachol was obtained from Sigma Aldrich. It was dissolved in water to a final concentration of 1 mM at a volume of 10 mL and aliquoted into 500 μL portions to be used for each experiment. The solutions were kept at −20 °C.
3.4. Cellular fluorescence imaging
Calcium Green (Invitrogen) and enhanced green fluorescent protein (eGFP) studies were imaged using an argon laser at 488 nm. Red fluorescent protein (RFP) and mCherry were imaged using the argon and HeNe lasers at 543 nm. Enhanced yellow fluorescent protein (eYFP) was imaged using argon and HeNe lasers at a wavelength of 545 nm. Multi-track imaging was carried out by combining the individual scanned images.
3.5. Experimental conditions for moss studies
Physcomitrella patens tissue was cultured using standard methods according to Ref. [7]. For imaging, a one week old moss plant was transferred in a 35 mm glass bottom Petri dish (Matsunami) filled with agar. The petri dishes were prepared as follows: a 1 ml pipette tip was placed on the glass bottom of the Petri dish followed by 4 ml of moss medium with agar. Once the agar solidified, the pipette tip was extracted, leaving a well. The well was then filled with 70 μl of the moss medium followed by placement of a plant after solidification. The thin layer of agar in the well allows for visualization of the moss sample on the microscope, while the outer thick layer of agar keeps the chamber moisturized. All imaging of moss was done in a glass bottom dish following the same procedure found above in fluorescent microscopy/stimulation of cells.
4. Results
4.1. Analysis of neurite retraction in PC12 cells using Re-track
We have used Re-track to analyze the retraction of neurites in PC12 cells under different experimental conditions. Use of the software for different samples are presented in the videos (see Supplemental material).
Using Re-track, we determined the retraction velocities of cultured mammalian PC12 cells induced by carbachol stimulation or hyper-osmotic stress [8]. First, we created a graph that shows the average positions of neurite retraction of PC12 cells under different conditions where each point on the specific curve was calculated using the software (Fig. 5). Conditions that induce rapid retraction is easily quantified. For example, cofilin is a protein that binds to actin filaments and assists in depolymerization resulting in a faster rate of depolymerization [9]. We find that PC12 cells over-expressing cofilin show the fastest retraction velocity correlating well with cofilin function [8].
Fig. 5.
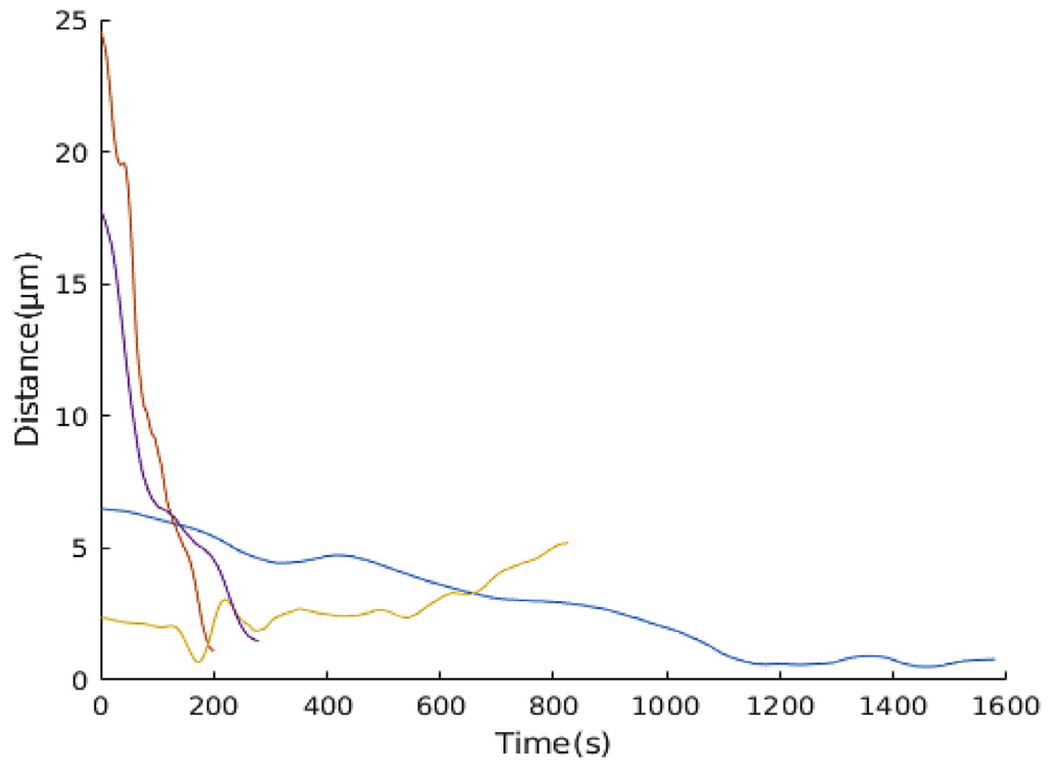
Individual traces of four different conditions of PC12 cells over expressing mCherry-actin and co-transfected with cofilin which promotes disassembly of the cytoskeleton (), or subjecting cells to hyper-osmotic stress (600 mOsm) to promote neurite retraction. No retraction occurs in cells under hypo-osmotic stress (150 mOsm). Using the text file outputted by the Re-track software, the position vs time for each of the different conditions can be visualized by any plotting program. In this plot, individual traces show the wide range of velocities as the neurites retract while still highlighting the behavior for each condition.
Another example is the change in the rate of neurite retraction with osmotic stress. Increasing the osmotic strength of the media increases membrane tension causing neurites to retract into the soma of PC12 cells [8]. This behavior is seen in Fig. 5 when we raise the osmolarity from 300 to 600 mOsm. In contrast, no retraction occurs when cells are subjected to hypo-osmotic stress (i.e. 300 to 150 mOsm) since this condition creates an outward force on the plasma membrane (see Fig. 5).
Re-track analyzes each trace as the Euclidean distance from the tip to the base. The traces analyzed in Fig. 5 used brightfield images. In Fig. 6, we show results from the analysis of fluorescence images as well as brightfield images. This comparison illustrates how Re-track can analyze any type of image since the user has to initiate the location of the original line to inform the software of the type of pixels it will be following. In this case, the software allows us to rapidly view the effect of different agents that impact actin assembly and membrane tension. Quantification of the retraction velocities by Re-Track permits an easy comparison between different experimental conditions during the time of the experiment even though the cell sizes, neurite lengths and other physical parameters may differ between the samples.
Fig. 6.
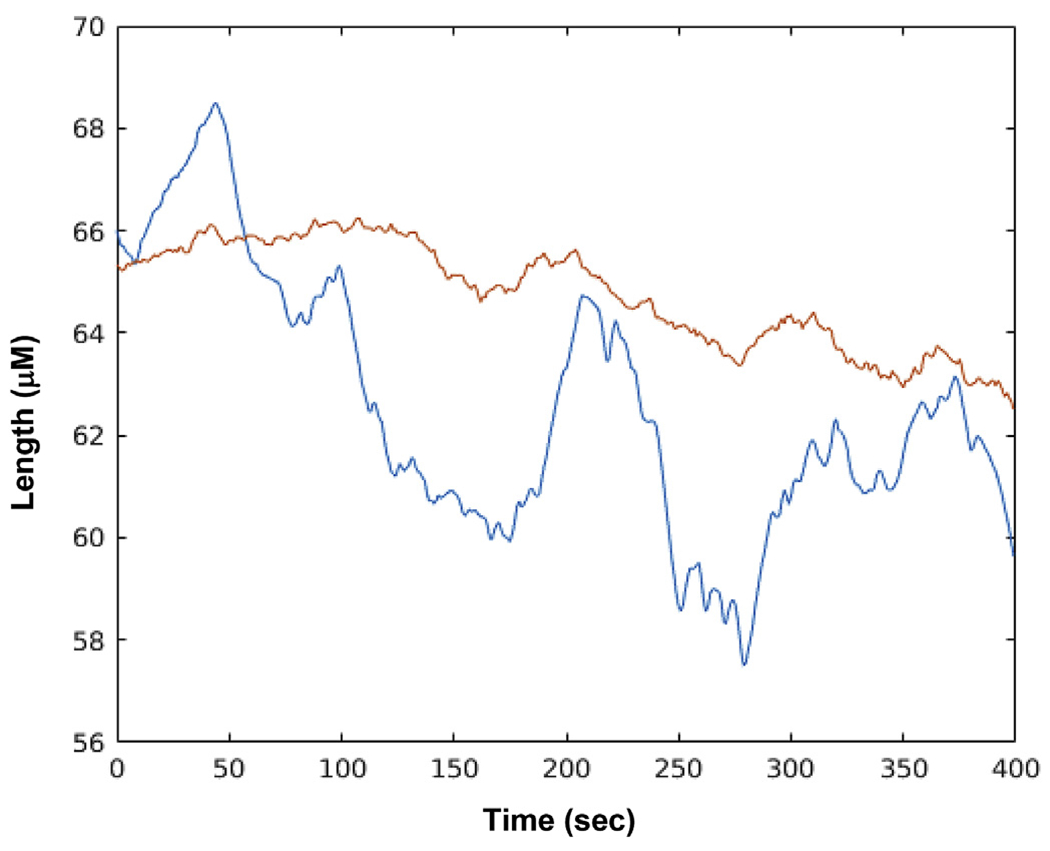
Graph showing different retraction behavior of a neurite in PC12 cells transfected with a fluorescent G protein coupled receptor (bradykinin type 2, B2R) upon the addition of bradykinin. While the membrane surrounding the neurite (orange) moves at a slower rate compared to B2R (blue), the data were at a lower resolution and show a time-averaged behavior. (For interpretation of the references to colour in this figure legend, the reader is referred to the Web version of this article.)
As mentioned above, Fig. 7 follows the retraction of a PC12 neurite in two separate channels, the brightfield and the fluorescence channel which detects the movement of a fluorescent-tagged GPCR (i.e. the bradky kinin receptor type 2 (B2R)). While these channels were monitored at different resolutions, the same analysis is used for both (see Re-Track_fluorescent movie). In Fig. 6, we find that B2R moves from the neurite into the soma before the plasma membrane during retraction. Comparing these two velocities allows for an increased understanding of receptor movement and dynamics within the cell.
Fig. 7.
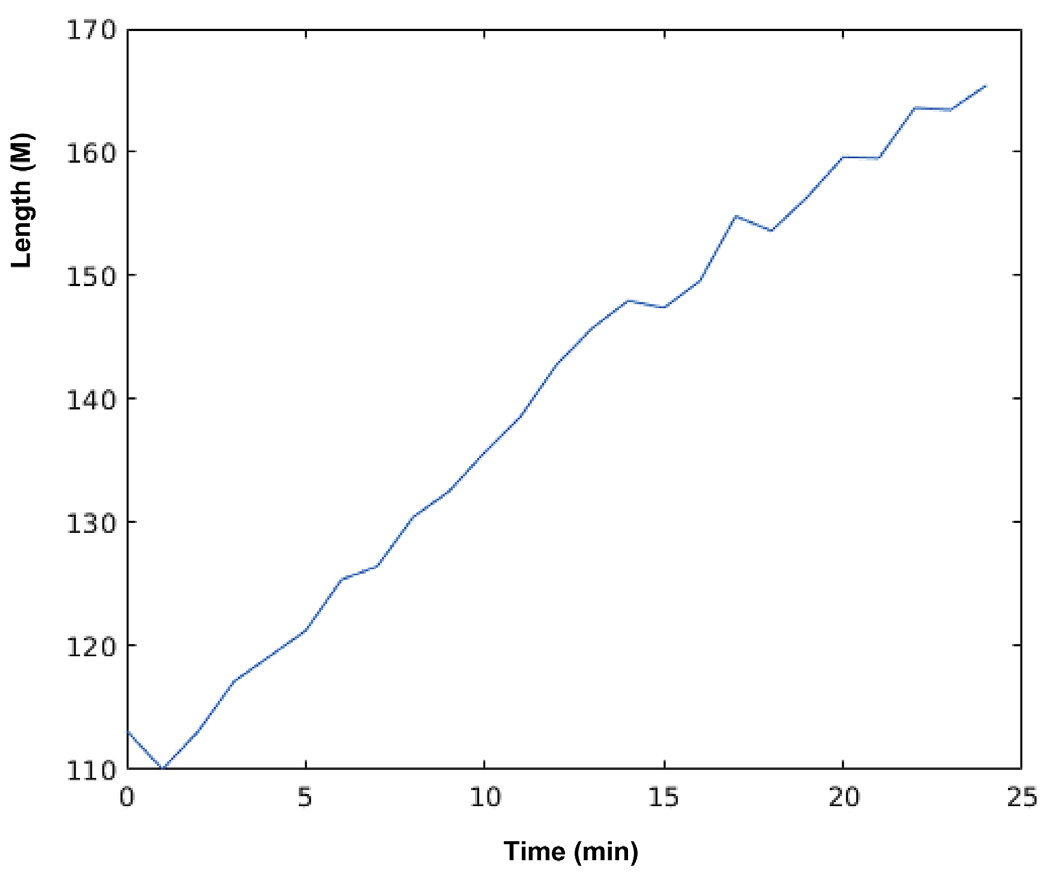
Growth of moss as analyzed by Re-track software.
4.2. Determining the growth of moss protrusions using Re-track
Re-track was used to analyze the growth behavior of a well-characterized system, moss. For this experiment, Physcomitrella patens tissue was imaged over 25 min (see Methods) to visualize the distance from the tip to the base. The resulting video was then analyzed using Re-Track to follow to tip growth over time. While previous work did not quantify the growth rates of the tips [10], we were able accurately follow the tip growth and obtain values in accord of these previous estimates.
5. Discussion
In this study, we describe software that allows the calculation of the retraction velocity for protrusion and retraction of a growth that emanates from a central body. While the examples given here are for biological samples, this software can be applied to non-biological systems such as solar flares, stream flow from lakes, etc. The only requirement is a time series of equal intervals, and images at a resolution that allows protrusion to be identified. It is important to note that a minimum number of 300 frames is required for proper analysis and this requirement will depend on the variation in the retraction/protrusion behavior. The software is optimized for videos of retraction only or protrusion only as the combination of retraction followed by protrusion will lead to the protrusion positions being disregarded by the software.
Re-track fills a void in software presently available and has been designed for use by the general public. Re-track complements presently available software packages that analyze assembly of cytoskeletal proteins in filopodia protrusions, such as Filopodyan [11], the number and lengths of filopodia, such as FiloDetect [12], dynamic changes in cell shape, including protrusions, such as CellGeo [13], changes in the distribution of fluorophores in cells, such as QuimP (see Ref. [14]) and cell migration, such as ADAPT [15]. Re-track is designed to be generally applicable to time series of any type of images that were measured individually or simultaneously in different channels for a given sample in a user friendly-format that, in most cases, can be carried out during the time of the experiment. Re-track can be coupled with other available software to fully view changes in morphology and differentiation of cells. The only comparable software, TrackMate [16] uses simple tracking that defines movements of a particle with time. Trackmate, as well as Simple neurite tracer software, which are both available open source through ImageJ cannot properly follow the dynamic movement of a retracting neurite, and they lack a simple user interface that can be used to easily plot change in position over time and calculate velocities (see Table 1). ImageJ also offers a kymograph feature that can be used to plot each slice of a time series to generate the speed of growth of a line over time as previously used in the same moss system studied here [10]. Our methodology surpasses the ease of quantification and, unlike kymographs, has the ability to analyze multi-directional videos. This function plots speed versus time whereas Re-track plots changes in position with time giving us the flexibility to analyze positional changes in either direction (i.e. growth vs. retraction). It is notable that Re-track gives identical results as those previously derived for moss using this latter procedure.
Table 1.
Comparison of Re-Track to the two other methods of retraction analyses.
| Software | Re-Track | Track-Mate | Simple Neurite Tracer | By Hand |
|---|---|---|---|---|
| Pros of software | Analyzes growth and retraction very rapidly. | Analyzes growth and retraction | Available open source though ImageJ. | Analyzes growth and retraction. |
| Allows for analysis of multiple, simultaneous events. | Follows multiple neurites through slices of TIFF files | |||
| Simple and initiative to use for students and general scientists and engineers. | Could be used in conjunction with other software to both trace and show velocity over time. | |||
| Cons of software | Requires manual location of neurite tip. | Complicated for those without experience in coding or a background in computer science. | Does not properly follow the dynamic movement of neurite retraction. | Time consuming: Requires visual identification of points in each frame of the movie, and subsequent calculations. |
| Seems to work only with growth and not retraction. |
Re-Track gives the user the speed and ease of processing that allows quantification of data for real time adjustments to the specific experiments. The accuracy of Re-track can be seen in a comparison of neurite retraction data analyzed by Re-track versus images analyzed by hand (supplemental). This software has been optimized for fluorescent and brightfield image analysis (see videos, supplemental) but can be used to analyze images from any high-quality video. This range in ability comes from the first step of manually locating the retraction/protrusion tip which allows the software to properly orient within a given video, and gives the software the ability to re-locate the tip during the analysis. These combined features give the software a broad range of applications.
Supplementary Material
Acknowledgements
The authors would like to thank Luis Vidali and Giulia Galotto for their help with the moss experiments. This work was supported by NIH GM116187.
Footnotes
Appendix A.: Supplementary data
Supplementary data to this article can be found online at https://doi.org/10.1016/j.ab.2020.113626.
References
- [1].Schwartz JH, Eric R. Kandel, Thomas M. Jessell Steven Siegelbaum A, Hudspeth AJ, Principles of Neural Science, fifth ed., McGraw Hill Professional, 2012. [Google Scholar]
- [2].Jacquemet G, Hamidi H, Ivaska J, Filopodia in cell adhesion, 3D migration and cancer cell invasion, Curr. Opin. Cell Biol 36 (2015) 23–31. [DOI] [PubMed] [Google Scholar]
- [3].Mattila PK, Lappalainen P, Filopodia: molecular architecture and cellular functions, Nat. Rev. Mol. Cell Biol 9 (2008) 446. [DOI] [PubMed] [Google Scholar]
- [4].Takeuchi T, Duszkiewicz AJ, Morris RGM, The synaptic plasticity and memory hypothesis: encoding, storage and persistence, Philos. Trans. R. Soc. Lond. B Biol. Sci, 369 20130288–20130288. [DOI] [PMC free article] [PubMed] [Google Scholar]
- [5].Garwain O, Scarlata S, Phospholipase Cβ-TRAX association is required for PC12 cell differentiation, J. Biol. Chem 291 (2016) 22970–22976. [DOI] [PMC free article] [PubMed] [Google Scholar]
- [6].Greene LA, Tischler AS, Establishment of a noradrenergic clonal line of rat adrenal pheochromocytoma cells which respond to nerve growth factor, Proc. Natl. Acad. Sci. U. S. A 73 (1976) 2424–2428. [DOI] [PMC free article] [PubMed] [Google Scholar]
- [7].Furt F, Liu YC, Bibeau JP, Tüzel E, Vidali L, Apical myosin XI anticipates F-actin during polarized growth of Physcomitrella patens cells, Plant J. 73 (2013) 417–428. [DOI] [PubMed] [Google Scholar]
- [8].Pearce KM, Bell M, Linthicum WH, Wen Q, Srinivasan J, Rangamani P, Scarlata S, Galphaq-mediated calcium dynamics and membrane tension modulate neurite plasticity, Mol. Biol. Cell (2019) mbcE19090536. [DOI] [PMC free article] [PubMed] [Google Scholar]
- [9].Pavlov D, Muhlrad A, Cooper J, Wear M, Reisler E, Actin filament severing by cofilin, J. Mol. Biol 365 (2007) 1350–1358. [DOI] [PMC free article] [PubMed] [Google Scholar]
- [10].Ding X, Pervere LM, Bascom C Jr., J.P. Bibeau, Khurana S, Butt AM, Orr RG, Flaherty PJ, Bezanilla M, Vidali L, Conditional genetic screen in Physcomitrella patens reveals a novel microtubule depolymerizing-end-tracking protein, PLoS Genet. 14 (2018) e1007221. [DOI] [PMC free article] [PubMed] [Google Scholar]
- [11].Urbančič V, Butler R, Richier B, Peter M, Mason J, Livesey FJ, Holt CE, Gallop JL, Filopodyan, An open-source pipeline for the analysis of filopodia, J. Cell Biol 216 (2017) 3405. [DOI] [PMC free article] [PubMed] [Google Scholar]
- [12].Nilufar S, Morrow AA, Lee JM, Perkins TJ, FiloDetect: automatic detection of filopodia from fluorescence microscopy images, BMC Syst. Biol 7 (2013) 66. [DOI] [PMC free article] [PubMed] [Google Scholar]
- [13].Tsygankov D, Bilancia CG, Vitriol EA, Hahn KM, Peifer M, Elston TC, CellGeo A computational platform for the analysis of shape changes in cells with complex geometries, J. Cell Biol 204 (2014) 443–460. [DOI] [PMC free article] [PubMed] [Google Scholar]
- [14].Bosgraaf L, van Haastert PJ, Bretschneider T, Analysis of cell movement by simultaneous quantification of local membrane displacement and fluorescent intensities using Quimp2, Cell Motil Cytoskeleton 66 (2009) 156–165. [DOI] [PubMed] [Google Scholar]
- [15].Barry D, Durkin C, Abella J, Way M, Open source software for quantification of cell migration, protrusions, and fluorescence intensities, J. Cell Biol (2015) 209. [DOI] [PMC free article] [PubMed] [Google Scholar]
- [16].Tinevez J-Y, Perry N, Schindelin J, Hoopes GM, Reynolds GD, Laplantine E, Bednarek SY, Shorte SL, Eliceiri KW, TrackMate: an open and extensible platform for single-particle tracking, Methods 115 (2017) 80–90. [DOI] [PubMed] [Google Scholar]
Associated Data
This section collects any data citations, data availability statements, or supplementary materials included in this article.


