Abstract
Viral encephalitis is a contagious disease that causes life insecurity and is considered one of the major health concerns worldwide. It causes inflammation of the brain and, if left untreated, can have persistent effects on the central nervous system. Conspicuously, this paper proposes an intelligent cyber-physical healthcare framework based on the IoT–fog–cloud collaborative network, employing soft-computing technology and information fusion. The proposed framework uses IoT-based sensors, electronic medical records, and user devices for data acquisition. The fog layer, composed of numerous nodes, processes the most specific encephalitis symptom-related data to classify possible encephalitis cases in real time to issue an alarm when a significant health emergency occurs. Furthermore, the cloud layer involves a multi-step data processing scheme for in-depth data analysis. First, data obtained across multiple data generation sources are fused to obtain a more consistent, accurate, and reliable feature set. Data preprocessing and feature selection techniques are applied to the fused data for dimensionality reduction over the cloud computing platform. An adaptive neuro-fuzzy inference system is applied in the cloud to determine the risk of a disease and classify the results into one of four categories: no risk, probable risk, low risk, and acute risk. Moreover, the alerts are generated and sent to the stakeholders based on the risk factor. Finally, the computed results are stored in the cloud database for future use. For validation purposes, various experiments are performed using real-time datasets. The analysis results performed on the fog and cloud layers show higher performance than the existing models. Future research will focus on the resource allocation in the cloud layer while considering various security aspects to improve the utility of the proposed work.
Keywords: Internet of things, F-KNN, ANFIS, Information fusion, Singular vector decomposition
Introduction
The progress of Industry 4.0 has introduced a variety of novel technologies, such as artificial intelligence, cyber-physical systems, cloud computing, and the Internet of Things [1]. These technologies have enormous potential to revolutionize various fields such as manufacturing, transportation and agriculture [2]. Due to the growing demand for healthcare, cyber-physical systems (CPS) have received significant attention from researchers and industry experts [3]. CPS firmly integrates the physical world, including sensing, communication, control, and networking, with computing components in cyberspace [4]. The collaboration between CPS and other technologies such as big data analytics and cloud computing offers a wide range of possibilities for developing novel and innovative human-centric applications.
The availability of data from electronic medical records and various sources of IoT-based wireless medical sensors and mobile devices provides a wealth of raw data. Such a vast amount of data is considered big data [5]. The processing and analysis of such data require third-party cloud data centers. However, transferring large amounts of data to cloud servers is time-consuming and requires higher bandwidth due to their far locality from the users’ device [6]. Additionally, this presents a massive opportunity for various attackers to access critical patient health data. Therefore, a new computing paradigm, fog computing, is introduced, which acts as a bridge between cloud servers and data generation sources [7]. In fog computing, several intermediate nodes are located in the users vicinity for processing time-sensitive data with improved accuracy. These fog devices include cellular base stations, intelligent gateways, routers, etc. Therefore, fog computing helps latency-sensitive applications achieve their quality of service. Moreover, with the advent of various machine-learning algorithms [8, 9] and soft-computing technologies [10], it has become viable to offer automated remote healthcare services. In this study, we mainly focus on leveraging various emerging technologies of Industry 4.0 to provide new solutions to the growing problem of viral encephalitis.
Research Field
Encephalitis is an infectious disease that causes inflammation of the brain [11]. Several causes of encephalitis identified in the literature include contaminated food or drink and exposure to viral infection. However, a virus that belongs to a family of enteroviruses is the leading cause of encephalitis. Acute encephalitic syndrome (AES) is a severe case of encephalitis that causes permanent damage to the brain and then death. Encephalitis can be transmitted through respiratory droplets that infected persons secrete. Other primary modes of transmission include the direct transfer of the virus into the bloodstream through the bite of an infected insect (tick or mosquito) [12] or touching an infected person.
Encephalitis is divided into two categories: primary encephalitis and secondary encephalitis. Viable cases of primary encephalitis occur when the virus directly attacks the brain. In addition, the latter infection occurs after encephalitis, and symptoms usually appear 2–3 weeks after the initial infection. Some signs and symptoms of encephalitis include fever (over 39.5C), severe headache, seizures, hallucinations, irritability, etc [13]. However, in some severe cases of encephalitis, symptoms such as coma and paralysis may occur in certain parts of the body. Cases of encephalitis are more common in children under 1 year of age than in adults. Nevertheless, people over 55 years of age with weakened immune systems are very likely to develop encephalitis, sometimes leading to life-threatening complications [14].
According to World Health Statistics, encephalitis infects almost all countries, with more than 100,000 cases per year [15]. In India alone, 47,509 cases of encephalitis and more than 8373 deaths were reported between 2005 and 2018 [16]. Statistics on the increase in Indian encephalitis cases in recent years are presented in a graph, as shown in Fig. 1. The rapid increase in encephalitis cases and mortality highlights the need for early detection and monitoring of the disease to avoid future disease-related complications during the neonatal stage. By analyzing the real-time physiologic parameters of children, the entrancing need for research can be realized.
Fig. 1.
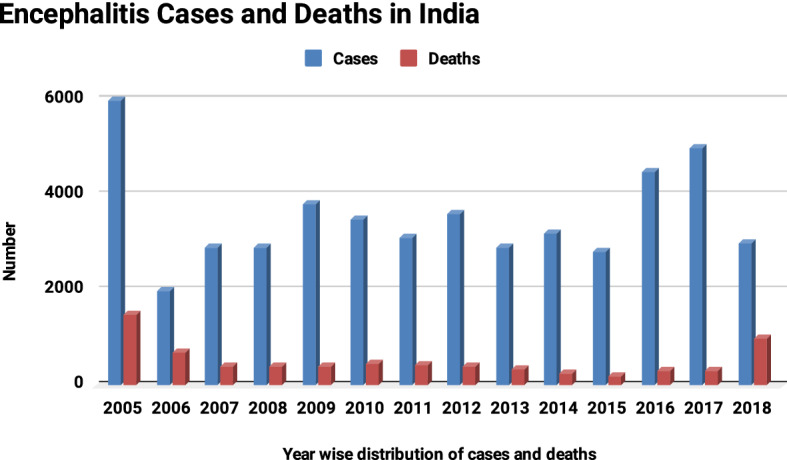
Encephalitis cases and death statistics. Adapted from [16]
Objectives
In the presented work, a CPS-fog improvised diagnostic framework for early detection and monitoring of viral encephalitis has been proposed. Several technologies of Industry 4.0, such as artificial intelligence, fog cloud computing, and new technologies for big data analysis, have been used to implement the framework.
The main contributions of the presented work can be enumerated as follows:
An intelligent cyber-physical framework for predicting viral encephalitis using soft-computing techniques and information fusion in an IoT–fog–cloud environment.
An instant decision-making strategy at the network’s edge using the F-KNN approach.
Information fusion and SVD-based feature selection, followed by ANFIS-based risk factor determination and alert generation at the cloud layer.
Information dissemination for the predicted results to various system stakeholders for effective management and control.
Experimental analysis of the proposed methodology in a simulated environment to determine the various performance metrics.
Paper Outline
The remainder of this article is divided into the following sections. In the next section, the extensive literature on various healthcare systems developed earlier has been carried out. The following section details the proposed methodology, including different constituent components. The subsequent section focuses on the experimental implementation of the proposed work and performance measures. The last section concludes the work with important future research directions.
Related Work
This section reviews the recent contributions of various researchers and academicians worldwide. Warda et al. [17] proposed an innovative solution for the detection of COVID-19 disease. The authors used the potential of preprocessing, feature ranking, and fuzzy inference system with a deep neural network classification-based hybrid diagnose strategy (HDS) for early detection of COVID-19 cases. Compared with other methods, the proposed method achieved better performance in various statistical parameters. Yuxin et al. [18] introduced the Internet of Things and machine learning in the healthcare domain for the diagnosis of Alzheimer’s disease. The proposed framework was primarily focused on assessing recent memory loss in human conversations. The simulations showed that the proposed framework was highly efficient for diagnosing and predicting life-threatening diseases. Fang et al. [19] presented a medical information fusion-based diagnostic framework for the treatment of COVID-19 disease. The proposed methodology could improve classification accuracy more than the traditional methods and help healthcare professionals combat COVID-19. Farman et al. [20] presented a sensor data-based smart health monitoring framework based on IoT and cloud computing. The authors also used various data mining techniques and proposed ontology-based recommendations. However, the proposed framework was unable to analyze data in real time. Alireza et al. [21] addressed the need of tracking students’ behavioral changes and presented a three-layered IoT-cloud framework. Various classification algorithms such as SVM, DT, RF, and MLP were used to classify the results. The simulations showed that the SVM classifier outperformed in comparison to other methods. Moreover, the authors suggested analyzing the data at the edge of the network to improve the overall response time of the system. Gonçalo et al. [22] presented an automated method for detection of COVID-19 using Efficient-net. The authors claimed their method to be effective for detecting the disease in the advanced stage. Based on the experimentation carried out by the authors, the results obtained were quite interesting and useful for implementation in real environment. Ramani et al. [23] presented a modified artificial neural network (ANN) classifier with a Map-Reduce framework for the prediction of diabetes. The framework was capable of dealing with large datasets. Experimental results show that the proposed model has a high level of acceptance and performance measures compared to earlier developed systems.
A detailed comparative analysis of the presented work with the recently available literature is summarized in Table 1. Many essential parameters for comparative analysis include cyber-physical system (CPS), fog computing (FC), cloud computing (CC), internet of things (IoT), information fusion (IF), fuzzy technology (FT), deep learning (DL), predictive analytics (PA), and alert generation (AG).
Table 1.
Comparison of the proposed approach with the state-of-the-art approaches
| Reference | Year | Major contributions | CPS | FC | CC | IoT | IF | FT | DL | PA | AG |
|---|---|---|---|---|---|---|---|---|---|---|---|
| [17] | 2021 | Presented a model for COVID-19 detection | |||||||||
| [18] | 2021 | Presented an IoT- deep learning classification model for the diagnosis of Alzheimer’s disease | |||||||||
| [19] | 2021 | Presented a medical information fusion-based model for COVID-19 diagnosis | |||||||||
| [20] | 2021 | Presented a lightweight data fusion approach using AI and IoT | |||||||||
| [21] | 2020 | Presented an IoT-based student healthcare monitoring system | |||||||||
| [22] | 2021 | Presented a sensor data-based smart healthcare monitoring system | |||||||||
| [24] | 2020 | Presented a model for diabetic chronic disease prediction | |||||||||
| [25] | 2019 | Presented a deep neural network-based smart decision support system for healthcare | |||||||||
| [26] | 2019 | Presented an ensemble of neural networks for lung cancer diagnosis | |||||||||
| [27] | 2019 | Presented a CPS for Parkinson disease prediction | |||||||||
| [28] | 2019 | Presented a smart healthcare system for elderly patient care | |||||||||
| [29] | 2019 | Presented a generalized framework for remote healthcare monitoring of patients | |||||||||
| Proposed | – | An Intelligent Healthcare system for the diagnosis and management of viral encephalitis |
Based on extensive study of the numerous healthcare systems presented in the literature, the following research gaps were discovered:
There are very limited intelligent healthcare frameworks that can effectively collect, process, and analyze healthcare data and provide results in the minimal possible time.
Information fusion from multiple data generation sources along with feature selection techniques have not been considered in the area of predictive healthcare.
In previous studies of the healthcare system, the latent use of advanced fuzzy-based decision-making techniques have been neglected.
Proposed System
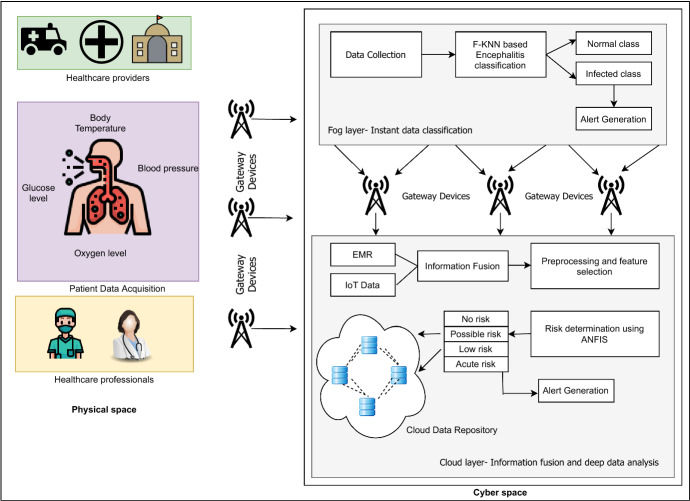
The proposed framework for early diagnosis and monitoring of viral encephalitis has been presented in Fig. 2. The entire model is conceptually formulated using two spaces, namely the physical space and cyberspace. The first space, the physical space, includes various entities responsible for obtaining individual patient, health, and demographic parameters. On the contrary, cyberspace is responsible for the real-time processing and analysis of data to predict the risk of encephalitis. Each space in CPS is composed of different components, each assigned a predefined role necessary to perform a specific task. The two spaces work in collaboration to achieve the overall objectives of the system. The detailed description of these spaces of the cyber-physical system is presented in the respective sections “Physical space” and “Cyber space”.
Fig. 2.
Layered architecture of the proposed framework
Physical Space
The reliability of any healthcare system depends on acquiring accurate information about various influencing factors. Therefore, to accurately predict the risk of viral encephalitis disease, information about various factors that directly or indirectly contribute to encephalitis is needed. To achieve the goal of data acquisition, our proposed model uses multiple sources of information: electronic medical records (EMR), IoT-based wireless sensors deployed in the user’s proximity, and data obtained directly from patients through mobile devices.
Electronic medical records: Electronic medical records contain general information about the patient, treatment, and medical history of the users, who have already been registered with the healthcare system.
Mobile devices: The other data acquisition mode requires users to register with the healthcare system through an OTP-based verification scheme. After successful registration, users are required to enter detailed personal information such as name, age, gender, address, contact information, and family details, through an application program interface (API). The information about family and caretakers is collected to provide real-time health information and alerts in case of the patient’s poor health. The collected information is also stored in electronic medical records for future use.
IoT sensors: The information about the user’s health, environmental, and demographic attributes are acquired with the help IoT-based wireless sensors placed in the user’s proximity. These sensors continuously sense, collect and relay the observed parameters through the local processing unit (LPU) or smart gateway after a fixed time interval. Various devices such as smartphones and routers can act as gateways to achieve data aggregation and enable communication between two independent spaces. Several communication protocols such as cellular, Wi-Fi, and Zigbee, as shown in Table 2, are used by gateway devices for communication with cyberspace. To ensure the security and privacy of data transmission, various security mechanisms, such as elliptic curve cryptography (ECC), transport layer security (TSL), and secure socket layer (SSL), may also be implemented in the physical space. The physical space involves data communication among different stakeholders, namely healthcare professionals, healthcare providers, and patients. Healthcare professionals include nurses, doctors, and paramedic staff who are entrusted with the responsibility of providing treatment to the patients. Likewise, healthcare providers comprise hospitals, health clinics, and government agencies directly related to administering the clinical resources. Healthcare providers may access the information about patient health to provide instant services in the form of arrangement of medical equipment and dispatch of ambulance according to patient’s specific location, etc.
Table 2.
Comparison of different communication protocols for CPS
| Technology | Standard | Power | Data rate | Network | Security | Application |
|---|---|---|---|---|---|---|
| ZigBee | IEEE 802.15 | 30 mA | 250 Kbps | WPAN | AES | Home monitoring and control |
| RFID | RFID | Ultra low power | 4 Mbps | Proximity | RC4 | Access, tracking inventory |
| NFC | IEC-14443 A,B | 50 mA | 424 Kbps | P2P | RSA, AES | Access, payment |
| Cellular | UMTS (3G), LTE (4G) | High power | Upto-1 Gbps | WNAN | RC4 | M2M |
| Z-wave | Z-wave | 2.5 mA | 40 Kbps | Mesh | AES-128 | Home monitoring and control |
| LP-WANS | IEEE 802.15.4 | Low power | 250 Kbps | WPAN | AES | Monitoring and control via. Internet |
IoT-based wireless sensors placed in the users’ proximity, EMR, and mobile devices provide a heterogeneous collection of huge user data. Table 3 provides the description of various features critical to identify the risk of viral encephalitis. The collected information about the user’s health, environment, and other related attributes is transmitted to cyberspace for further processing and analysis.
Table 3.
Description of features obtained using multiple data sources
| Feature label | Feature name | Description | Data type | Data source |
|---|---|---|---|---|
| F1 | UID | Unique id of the user | String | EMR |
| F2 | Name | Name of the user | String | EMR |
| F3 | Age | Age of the user in years | Numeric | EMR |
| F4 | Gender | Male or female | Character | EMR |
| F5 | Mobile | Contact number of the user | Numeric | EMR |
| F6 | Address | Workplace or home address of the user | String | EMR |
| F7 | Caretaker details | Contact number of the nearby relative | String | EMR |
| F8 | Blood pressure | Blood pressure measured in mmHg | Numeric | Medical sensor |
| F9 | Oxygen level | Percentage of body oxygen level | Numeric | Medical sensor |
| F10 | Glucose level | Glucose level in mg/dl | Numeric | Medical sensor |
| F11 | Body temperature | User’s body temperature in degree celsius | Numeric | Medical sensor |
| F12 | Respiratory rate | User’s respiratory rate in breaths per minute | Numeric | Medical sensor |
| F13 | Gps location | Current location of user | Numeric | GPS sensor |
| F14 | Temperature | Temperature of the geographic location | Numeric | Temperature sensor |
| F15 | Fever | Yes/No | Character | Mobile device |
| F16 | Severe headache | Yes /No | Character | Mobile device |
| F17 | Vomiting | Yes/No | Character | Mobile device |
| F18 | Nausea | Yes/No | Character | Mobile device |
| F19 | Confusion | Yes/No | Character | Mobile device |
| F20 | Disorientation | Yes/No | Character | Mobile device |
| F21 | Hallucinations | Yes/No | Character | Mobile device |
| F22 | Coma | Yes/No | Character | Mobile device |
| F23 | Paralysis | Yes/No | Character | Mobile device |
| F24 | Memory loss | Yes/No | Character | Mobile device |
| F25 | Infectious insects | Whether the user lives in infectious insects prone area | Character | Mobile device |
Cyber Space
Cyberspace collects data from multiple data generation sources in the physical space and facilitates various data processing and analytics operations through its two layers: the fog layer and the cloud layer. The fog layer aims at real-time local data analytics using multiple fog nodes in the users’ vicinity. On the contrary, the cloud layer possesses high storage and data analytics capabilities, hence responsible for detailed data analysis. The following sections provide a detailed description of each layer and the different components employed in each layer.
Fog Layer
To provide a better user experience and time-critical information to the stakeholders of the system, a fog layer was introduced between the data generation sources and highly constrained third-party cloud data centers. The fog layer aims at local data analytics by performing real-time data classification and alert generation at the edge of the networks rather than processing at the cloud data centers.
(A) F-KNN-based instant encephalitis classification:
In the proposed framework, the users are broadly classified into two classes based on their health data, i.e., normal class and infected class. A normal class enumerates that the user’s health condition is normal and does not require any supervision. However, the infected class determines the patient’s abnormality and, hence, requires immediate action from caretakers and doctors. Several techniques for decision-making have been realized in the literature that classifies the users based on their health attributes. The proposed framework utilizes the fuzzy k-nearest neighbor algorithm (F-KNN) to serve the purpose. The F-KNN is one of the most efficient supervised learning algorithms that is used for classification and prediction purposes, and the widespread applications of the F-KNN can be realized in the literature [30, 31]. The algorithm incorporates the theory of fuzzy sets into the traditional k-nearest neighbor algorithm to propose a novel version of the algorithm. In the F-KNN approach, the fuzzy memberships of the data instances are computed and assigned to labeled samples rather than individual classes as in the KNN algorithm. Several techniques are available for the computation of fuzzy membership values [32]. However, in our case, all the membership values, for instance, are computed using the Eq. 1 and are assigned to a class with which the highest value is obtained using the Eq. 2.
| 1 |
| 2 |
where and denotes the number of classes and neighbors, respectively. calculates the Euclidean distance between and its nearest neighbor . specifies fuzzy membership degree of the pattern from the training set to the class i. denotes the assigned fuzzy membership of in class i. is the fuzzy strength parameter and measures how significantly the distance is weighted when computing each neighbor’s contribution to the membership value and its value is chosen between 1 and .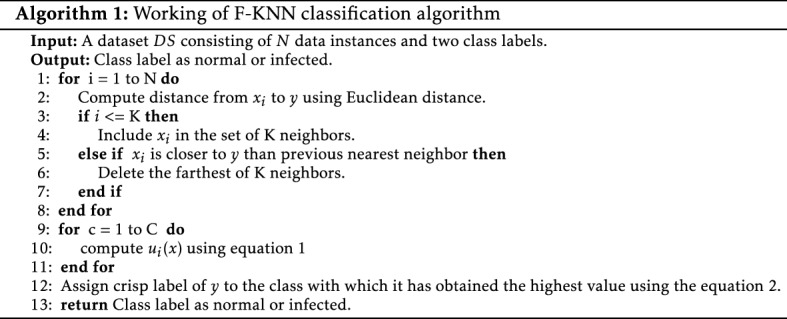
The working of the F-KNN-based classification component is presented in Algorithm 1. If the results of the F-KNN are classified as infected, warning alerts are generated and sent to the system’s stakeholders for immediate action. Moreover, the classification results are further transmitted to the cloud layer for detailed analysis by determining the risk factor and severity of viral encephalitis.
Cloud Layer
Although the fog layer possesses immense processing capabilities using multiple fog nodes in the user’s vicinity, several advanced tasks involving the deep analysis and huge storage requirements cannot be performed at the fog layer. Therefore, the cloud layer is introduced as a countermeasure to perform such tasks. In the presented framework, the cloud layer performs multiple tasks:
information fusion,
data preprocessing,
feature selection,
risk factor determination,
alert generation, and
cloud storage.
(A) Information fusion:
This section discusses the fusion of data obtained from multiple sources such as IoT-based wireless sensors or mobile applications with previously-stored electronic medical records. Data fusion aims to generate a more consistent, accurate, and reliable dataset for classification and prediction purposes. The existence of various fusion strategies involves merging data at the feature level or the decision level [33]. In the feature-level fusion, features from multiple heterogeneous data sources are merged. In contrast, decision-level fusion methods involve fusing decisions based upon individual sensor data [34]. In the presented framework, a feature-level data fusion strategy has been employed as the decision-level fusion provides highly redundant data and is not desirable for real-world health-critical applications.
To achieve the purpose of data fusion in our proposed framework, first data from multiple wireless medical sensors placed in patients’ proximity is collected. These sensors collect information related to viral encephalitis parameters, such as body temperature, blood pressure, glucose level, etc. The collected data is further merged with the previously stored electronic medical records that contain complete information related to the patient’s previous medical history, treatment, etc. Finally, the features obtained through the fusion of EMR and viral encephalitis-sensitive data are stored in a comma-separated value (.csv) file for further processing and analysis. Therefore, a new dataset with the best combination of features is obtained due to data fusion. This dataset is utilized for the training and validation of the proposed model.
(B) Data preprocessing:
Data preprocessing is one of the most crucial steps before performing any data analysis. The raw data collected across multiple heterogeneous sources is highly unstructured and may contain noise and missing values. If directly fed to the machine learning algorithms, such data may affect the predictive accuracy. Therefore, in our proposed framework, several data preprocessing techniques such as data cleaning, missing data filtering, and normalization are applied that improve the quality of raw data and, hence, the accuracy of encephalitis prediction.
The first step in data preprocessing is concerned with removing the redundant data values and replacing the missing values with the values obtained by using various imputation methods, such as mean, median, and mode. An unsupervised filter, namely RemoveUseless filter [22], was employed and removed the high variance values from the dataset. The dataset considered for performing the analysis may contain numerical and categorical attributes. The missing values for numerical attributes are replaced with the mean value calculated for each attribute. Instead, missing values for categorical attributes are replaced with frequently occurring values of the respective attribute in a structured dataset. Moreover, EMR for patients may also be used for dealing with the missing values by replacing missing data values with the current attribute value.
In the next step of data preprocessing, the data is normalized in the range between 0 and 1 using the min–max approach, as given in the Eq. 3. The goal of normalization is to change the values of numeric attributes in the dataset to use a common scale without distorting differences in the ranges of values or losing information. Moreover, this also reduces the complexity and computational cost of machine learning algorithms.
| 3 |
where D is the original dataset. is normalized dataset, containing data values in the range [0–1].
and represent the minimum and maximum data values in the dataset.
and represent the value 0 and 1, respectively.
The data obtained after applying data preprocessing techniques is clean, consistent, free from noise, and is suitable for performing the feature selection.
(C) Feature selection:
The feature fusion from multiple heterogeneous data sources provides the best features for training and prediction. However, this newly formed feature set may contain many redundant and irrelevant features that certainly reduce the quality of training data and increase the model’s complexity and computational cost. Hence, various feature selection techniques are applied prior to using them for modeling. The feature selection aims to obtain an optimal subset of relevant features from the extensive feature set without any difference in the predictive accuracy. This reduces the redundant features in the dataset and reduces the variance, thus avoiding the problem of overfitting.
A singular value decomposition (SVD) technique for feature selection was employed in the proposed framework. SVD is a mathematical approach that is based on matrix factorization [35]. Algorithm 2 illustrates the working of SVD-based feature selection. A data matrix of order is factorized into three sub-matrices, namely left singular matrix , right singular matrix , and diagonal matrix , each of order , and , respectively. The decomposition task is performed to obtain the useful and interesting features of the original data matrix . The output of the SVD-based feature selection technique provides a transformed data matrix, D of order , comprising a fewer number of features.
The transformed data matrix , with a limited and crucial feature set, is fed to the adaptive neuro-fuzzy inference system for further processing and analysis.
(D) ANFIS-based risk factor determination:
It is the most crucial component in the cloud layer and is responsible for identifying possible risks associated with encephalitis cases based on efficacious predictive data analysis. An adaptive neuro-fuzzy inference system (ANFIS) approach was utilized to perform predictive data analysis. ANFIS is a hybrid soft-computing technique that integrates the powerful features of artificial neural networks (ANN) and fuzzy inference systems (FIS). ANFIS is characterized by the knowledge representation and reasoning capabilities of ANN with the quick and efficient learning capabilities of fuzzy systems. In the proposed framework, ANFIS has been trained using the different number of most essential features from different datasets. ANFIS takes the necessary feature set as input and classifies the users into one of four categories, namely
no risk,
low risk,
moderate risk, and
acute risk,
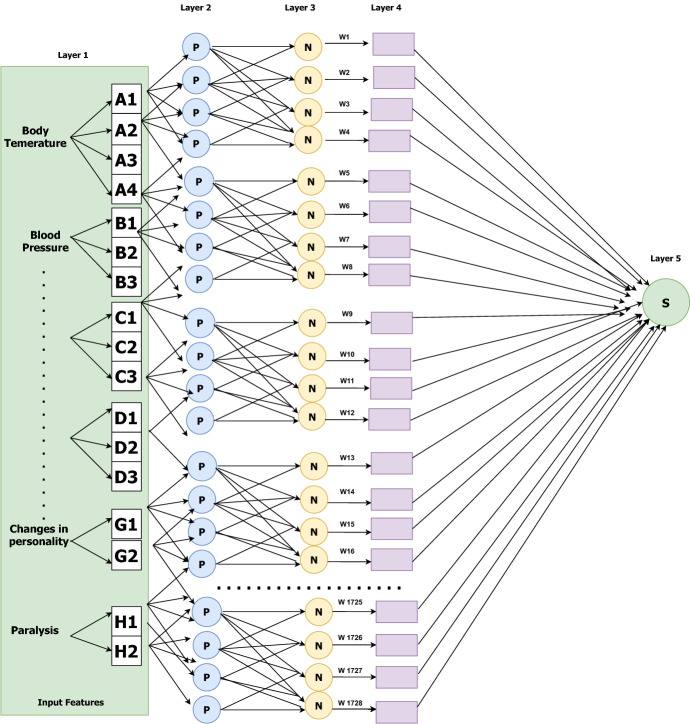
based on the associated risk factor. The structure of ANFIS is presented in Fig. 3. It comprises five layers, each of which performs a specific computational task as
fuzzification,
product,
normalization,
normalized product, and
summation.
Each layer in the ANFIS structure comprises various adaptive nodes and fixed nodes. The circle represents the fixed nodes, and the square depicts the adaptable nodes in the ANFIS architecture. The detailed description of each layer is as follows: Layer 1: This layer consists of input nodes, each of which is associated with a membership function . Table 4 provides the summary of commonly used membership functions. The output of this layer is the fuzzy membership grade of the inputs and is given in Eq. 4.
| 4 |
where denotes the input feature passed to a node , specifies the linguistic labels associated with each node function, denotes the membership function of and represents the degree to which satisfies
Fig. 3.
Structure of ANFIS
Table 4.
Summary of ANFIS membership functions
| Type | Membership function | Curve parameter | Curve shape |
|---|---|---|---|
| Trapezoidal | a, b defines feet and c, d defines curve shoulder | Just like trapezoid | |
| Bell | a determines the width, b is a positive integer and c sets the center of the curve | Bell shaped | |
| Triangular | a, c, and b specifies the feet and tip of the curve | Triangular shape | |
| Gaussian | c specifies the center and determines the width of curve | Smooth curve like bell |
The scenario considered for the determination of risk factor associated with encephalitis cases consists of eight inputs, in the layer 1 that can be fuzzified as:
- Body temperature (BT): Specifies the user’s body temperature(in degree celsius) and is split into four fuzzy sets.
for 1,2,3,4 , ,, and }. - Blood pressure (BP): Specifies the blood pressure of the user (in mmHg) and is split into three fuzzy sets.
for 1,2,3 , , and }. - Oxygen level (OL): Specifies the percentage of oxygen in user’s body and is split into three fuzzy sets.
for 1,2,3 , , and }. - Glucose level (GL): Specifies the glucose level of users (in mg/dl) and is split into three fuzzy sets.
for 1,2,3 , , and }. - Eye redness (ER): Specifies the presence or absence of redness in eyes. This input is split into two fuzzy sets.
for 1,2 , and }. - Confusion (C): Specifies whether the user experiences confusion. This input is split into two fuzzy sets.
for 1,2 , and }. - Exposure to insects (EI): Specifies whether the user are exposed to infectious insects. This input is split into two fuzzy sets.
for 1,2 , and }. - Paralysis (P): Specifies whether the user experiences paralysis in any part of the body. This input is split into two fuzzy sets.
for 1,2 , and }.
Layer 2: This layer is composed of fixed nodes, represented as circles and is responsible for calculating the trigger strength of the rule through the product operation, given as:
| 5 |
Layer 3: This layer is composed of fixed nodes, marked as N, and is responsible for calculating the normalized firing strength of a rule from layer 2. The output of this layer is given as:
| 6 |
where n denotes the total number of rules.
Layer 4: This layer consists of various adaptive nodes where the output of each node is given as a product of the normalized file strength and a first-order polynomial, given as:
| 7 |
where represent the modifiable consequent parameters.
Layer 5: This layer contains only one node, i.e., fixed node, marked as S and provides the final output by computing sum of all the incoming inputs.
| 8 |
An adaptive neuro-fuzzy inference system for the early risk determination uses eight input nodes (body temperature, blood pressure, oxygen level, glucose level, eye redness, confusion, exposure to insects, paralysis) in layer 1. All of these nodes specify the crucial encephalitis symptoms experienced by the users. The fuzzy set for each of these inputs and predicted outputs is presented in Table 5. A triangular membership function is used for conversion of crisp values to fuzzy sets. Adaptive nodes presented in layers 1 and 4 are concerned with adjusting the premises and consequent parameters, and a hybrid learning technique is used for the training purpose. The training continues until the minimum error rate is achieved. Once the model is trained, ANFIS predicts the associated risk of encephalitis and is categorized into one of the four classes: no risk, possible risk, low risk, and acute risk.
Table 5.
Fuzzy sets for input and output
| S. no. | Attributes | Range | Fuzzy sets |
|---|---|---|---|
| Body temperature (degree celsius) | < 35 | Low | |
| 36.5–37.5 | Normal | ||
| 37.6–38.3 | Mild | ||
| > 39.5 | High | ||
| Blood pressure (mmHg) | <80 | Low | |
| 80–120 | Normal | ||
| >120 | High | ||
| Oxygen level | <67 | Risky | |
| 80–95 | Low | ||
| > 95 | Normal | ||
| Glucose level (mg/dl) | 85–100 | Normal | |
| 100–125 | Mild | ||
| >125 | High | ||
| Redness in eyes | 1 | Yes | |
| 0 | No | ||
| Confusion | 1 | Yes | |
| 0 | No | ||
| Changes in personality | 1 | Yes | |
| 0 | No | ||
| Paralysis | 1 | Yes | |
| 0 | No | ||
| Output | |||
| Risk factor | < 0.1 | Normal case/no risk | |
| 0.1–0.4 | Possibility of encephalitis | ||
| 0.5–0.7 | Low risk of encephalitis | ||
| 0.8–1.0 | Acute encephalitis | ||
(E) Alert generation:
The utility of the alert generation component in cyberspace is to inform the caretakers, doctors, and hospitals about the patients’ current state under supervision. Algorithm 3 demonstrates how the alarm generation component works. The risk factor for determining the severity of encephalitis is computed using ANFIS. The four different categories of risks are no risk, possible risk, low risk, and acute risk. An alert message is sent to caregivers, nearby doctors, and hospitals if there is an acute risk. In addition, the patient’s location is also transmitted for the immediate dispatch of the ambulance to the patient’s current location for early pickup. In the event of low or possibly low risk, only caretakers are informed about the patients’ current state. Various medication practices and home remedies may also be suggested for the patients’ quick recovery. However, in the absence of any encephalitis risk, no alert message will be generated to any stakeholder of the system, and the information about the patient is stored in the cloud for future usage.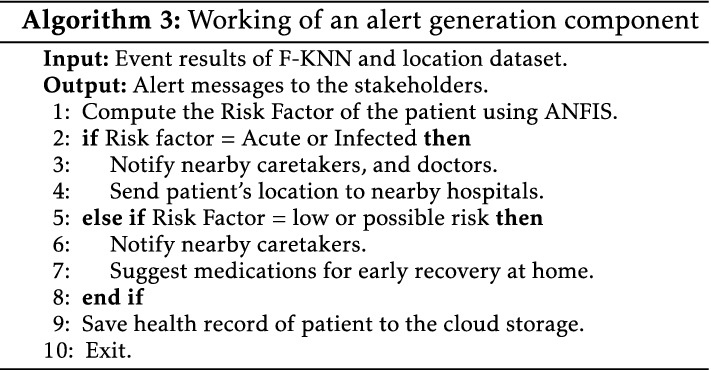
(F) Cloud storage:
Cloud storage is a vital component in cyberspace. This component aims to store information about the patient’s health condition, treatment, and medical records. The information about the number of encephalitis cases, morbidity, and mortality rates is stored in the public cloud for broad access across the globe. The availability of information on the cloud enables policymakers and government agencies to take precautionary measures and control the alarmingly rising encephalitis cases.
Experimental Setup and Performance Analysis
In this section, various experiments were carried out to evaluate the performance of the proposed framework. The experimentation was conducted on a system with the following specifications: Intel(R) Core(TM) i7 processor, a memory capacity of 8 GB, a clock frequency of 2.10 GHz, and a 64-bit Windows-10 operating system. This section is composed of multiple sub-sections, and a description of each sub-section is given ahead.
Data Acquisition and Integration
To evaluate the performance of the proposed framework, a dataset with a large number of instances is required. Despite rigorous search across various data repositories, a multi-dimensional dataset comprising important attributes (physiological, symptoms, environmental, and personal) is not found in a single dataset. Therefore, a dataset consisting of multi-dimensional features is systematically created by integrating various real-time datasets using Algorithm 4. The real dataset consisting of personal and environmental attributes is obtained using [36]. Moreover, the encephalitis symptoms-based dataset and a dataset containing physiological attributes are collected using [37]. Table 3 provides the description of various features considered for dataset formulation. The structured dataset consisting of 4000 instances is utilized for evaluating the performance of the proposed model using various evaluation metrics. The entire dataset is randomly split into training data and test data. Out of the total number of instances available, 80% (3200) instances are used for training, and the rest 20% of the instances are utilized for testing and validation.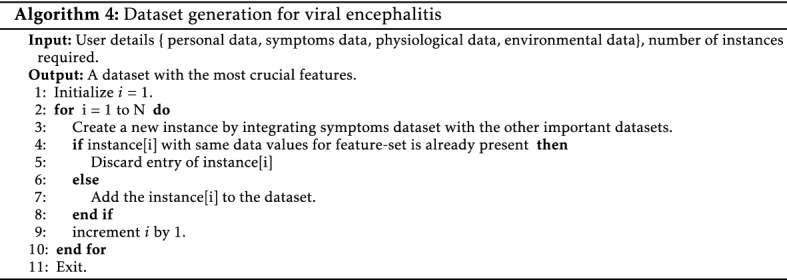
Performance Metrics
The performance of the proposed framework is evaluated based on four essential components of the confusion matrix, namely true positive (TP), true negative (TN), false positive (FP), and false negative (FN). Where TP specifies the number of true instances and classified as true instances. TN specifies the number of instances that are false and classified as false. FP specifies the number of instances that are false and classified as true. FN specifies the number of instances that are true and classified as false. Different evaluation criterion used for the current study is discussed in Table 6.
Table 6.
Performance evaluation metrics
| S. no | Performance measures | Description | Mathematical Expression |
|---|---|---|---|
| 1 | Accuracy | Measure how often the algorithm classifies a data point correctly. | Accuracy |
| 2 | Specificity | Measure the model’s capability to determine true negatives of each available class. | Specificity |
| 3 | Recall | Measure the model’s capability to determine true positives of each available class. | Recall |
| 4 | Precision | Defines how close measurements are to each other. | Precision |
| 5 | F-score | Evaluates the harmonic mean of precision and recall | F-score |
Classification Efficiency Analysis at the Fog Layer
A fuzzy-based k-nearest neighbor classifier was employed at the fog layer that classifies the user into one of the two classes: infected class or normal class. The algorithm was implemented using MATLAB R2021a. The sample dataset used for instant classification at the fog layer is shown in Table 7. As the dataset contains many categorical attributes, therefore first, the dataset is normalized in the range from 0 to 1. Moreover, since the performance of F-KNN is dependent on the fuzzy strength parameter, m, and the K values. Therefore, results are computed by varying the values of k as 3, 5, and 7 with a constant value of fuzzy strength parameter as 2. The computed results are then compared with the other classification algorithms, such as a K-NN, M-KNN, decision trees, random forest and logistic regression. Results show that F-KNN performs better with and .
Table 7.
Sample dataset instances on fog layer for F-KNN
| UID | Body temperature | Fever | Severe headache | Vomiting | Nausea | Confusion | Distortion | Hallucination | Coma | Paralysis | Memory loss | Infectious insects | Infected |
|---|---|---|---|---|---|---|---|---|---|---|---|---|---|
| 1 | 34 | 0 | 0 | 1 | 0 | 1 | 0 | 1 | 0 | 0 | 0 | 0 | 0 |
| 2 | 37.2 | 1 | 1 | 1 | 0 | 0 | 0 | 0 | 0 | 0 | 0 | 1 | 1 |
| 3 | 37.4 | 1 | 0 | 1 | 1 | 0 | 1 | 0 | 0 | 1 | 1 | 0 | 1 |
| 4 | 34 | 1 | 0 | 0 | 0 | 1 | 1 | 1 | 1 | 0 | 1 | 0 | 1 |
| 5 | 37.1 | 0 | 0 | 0 | 0 | 0 | 0 | 0 | 0 | 0 | 0 | 0 | 0 |
| 6 | 37.6 | 0 | 1 | 1 | 0 | 0 | 0 | 0 | 0 | 0 | 0 | 1 | 0 |
| 7 | 36.1 | 1 | 0 | 1 | 1 | 0 | 1 | 0 | 0 | 0 | 0 | 0 | 1 |
| 8 | 38.2 | 1 | 0 | 1 | 0 | 1 | 0 | 0 | 0 | 0 | 0 | 0 | 1 |
| 9 | 36.8 | 1 | 1 | 0 | 0 | 0 | 0 | 0 | 0 | 0 | 0 | 0 | 0 |
| 10 | 37.1 | 0 | 0 | 0 | 1 | 0 | 1 | 1 | 0 | 0 | 0 | 0 | 1 |
Various statistical metrics such as accuracy, specificity, precision, and recall were utilized for evaluating the performance of the proposed F-KNN. Figure 4 presents the analysis results of F-KNN with our classifiers, and the corresponding values are enlisted in Table 8. From the results, it is evident that F-KNN outperforms other classification algorithms with an average classification accuracy of 85.7%. Besides, the F-KNN results of sensitivity (85.5%), specificity (84.8%), and precision (83.93%) also prove the superiority of F-KNN over other classification methods. Furthermore, the performance of the algorithms was compared in terms of classification time. The F-KNN records the least classification time in comparison with different K-NN versions.
Fig. 4.
Analysis of F-KNN with other classifiers
Table 8.
Statistical comparison of F-KNN with other classifiers over different performance metrics
| Classifier model | Accuracy (%) | Sensitivity (%) | Specificity (%) | Precision(%) |
|---|---|---|---|---|
| F-KNN | 85.7 | 85.5 | 84.8 | 83.93 |
| M-KNN | 83.9 | 81.9 | 80.7 | 78.9 |
| K-NN | 77.7 | 75.4 | 74.21 | 69.5 |
| Decision tree | 75.3 | 75.6 | 75.7 | 75.5 |
| Random forest | 74.4 | 72.8 | 73.1 | 71.4 |
| Logistic regression | 72.5 | 72.3 | 72.3 | 71.9 |
Feature Selection Analysis
The proposed framework utilizes the fusion of data generated across multiple data sources, thus resulting in multiple input features. The accuracy of the proposed framework is affected by the number of features taken under consideration. Therefore, to select the most optimal features from a large feature set, the potential of the singular value decomposition technique (SVD) was utilized. SVD selects the most crucial features for encephalitis prediction, thereby ignoring the irrelevant features. SVD-based feature selection technique has been implemented in python, and the results of the implementations are reported in Table 9. From the results, it is evident that the first five singular vectors with the cumulative variance of 91.93% and eigenvalues greater than 1 represent utmost information over the remaining singular vectors, and hence these are further used for training the proposed ANFIS model. Table 10 summarizes the performance of SVD with other baseline feature selection method and principal component analysis (PCA) [38]. The analytical results are presented in Table 10. It is clear that the proposed SVD selects the eight most promising features and provides the best computational complexity with higher accuracy performance in comparison to PCA (Table 10).
Table 9.
SVD-based feature selection
| SVs | Eigen values | Variance | Cumulative variance |
|---|---|---|---|
| SV1 | 4.567 | 33.49 | 33.49 |
| SV2 | 4.192 | 18.44 | 51.93 |
| SV3 | 3.768 | 16.95 | 68.89 |
| SV4 | 2.457 | 12.49 | 91.37 |
| SV5 | 1.056 | 10.56 | 91.93 |
| SV6 | 0.897 | 5.41 | 97.34 |
| SV7 | 0.545 | 1.95 | 99.24 |
| SV8 | 0.106 | 0.27 | 99.49 |
| SV9 | 0.059 | 0.25 | 99.76 |
| SV10 | 0.024 | 0.24 | 100 |
Table 10.
Comparison of SVD and PCA computational complexity
| Feature selection techniques | Number of selected features | Epochs required for minimum error rate | % of classification accuracy achieved |
|---|---|---|---|
| SVD | 8 | (50th) | 90.54% |
| PCA | 10 | (60th) | 86.43% |
Training and Validation of ANFIS
ANFIS integrates ANN and FIS to model and predicts the occurrence of many uncertain encephalitis events. Table 11 demonstrates the sample dataset instances used for training and validation of ANFIS. Various structural parameters used for ANFIS are given in Table 12. The proposed ANFIS for the prediction of encephalitis has been trained using the fuzzy logic toolbox, available in MATLAB’s latest version, R2021a. An optimal set of features obtained using the feature selection technique is used as input features. The entire dataset is randomly split into training data and test data. Out of the total number of instances available in the dataset, 80% of instances are used for training, and the rest are utilized for testing and validation. The training process is repeated with varying epochs until the training error rate is reduced. The errors reported in different epochs are presented in Fig. 5. The training is stopped when the minimum error rate of 6.98% is achieved in the 50th epoch. After successful training, the ANFIS model can classify the users into one of the four classes: no risk, possible risk, low risk, and acute risk.
Table 11.
Sample dataset instances for ANFIS
| S.No. | Body temperature | Blood pressure | Oxygen level | Glucose level | Redness | Confusion | Change in personality | Paralysis | Risk |
|---|---|---|---|---|---|---|---|---|---|
| 1 | 34 | 85 | 90 | 101 | 0 | 1 | 0 | 0 | 0.2 |
| 2 | 37.2 | 110 | 87 | 110 | 1 | 0 | 0 | 0 | 0.6 |
| 3 | 37.4 | 140 | 89 | 126 | 1 | 0 | 0 | 0 | 0.7 |
| 4 | 34 | 82 | 72 | 96 | 0 | 0 | 1 | 1 | 0.9 |
| 5 | 37.1 | 95 | 98 | 97 | 0 | 0 | 0 | 0 | 0 |
| 6 | 37.6 | 100 | 97 | 105 | 1 | 0 | 0 | 0 | 0.3 |
| 7 | 36.1 | 130 | 95 | 114 | 1 | 0 | 1 | 0 | 0.5 |
| 8 | 38.2 | 125 | 96 | 119 | 0 | 1 | 0 | 0 | 0.55 |
| 9 | 36.8 | 94 | 98 | 97 | 0 | 0 | 0 | 0 | 0 |
| 10 | 37.1 | 108 | 99 | 130 | 1 | 0 | 0 | 0 | 0.6 |
Table 12.
ANFIS structural parameters
| ANFIS parameters | Description |
|---|---|
| Number of ANFIS layers | 5 |
| Number of inputs in layer 1 | 8 |
| Number of rules | 1728 |
| Number of output layers | 1 |
| Learning approach | Hybrid |
| Input membership function | Triangular |
Fig. 5.
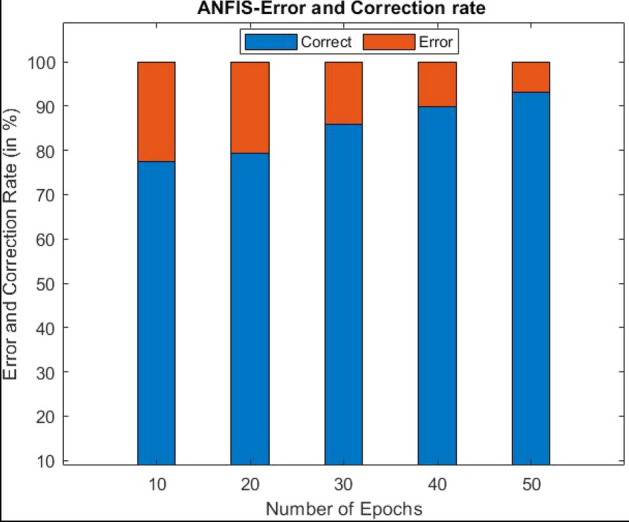
Errors observed in different epochs
ANFIS Efficiency Analysis
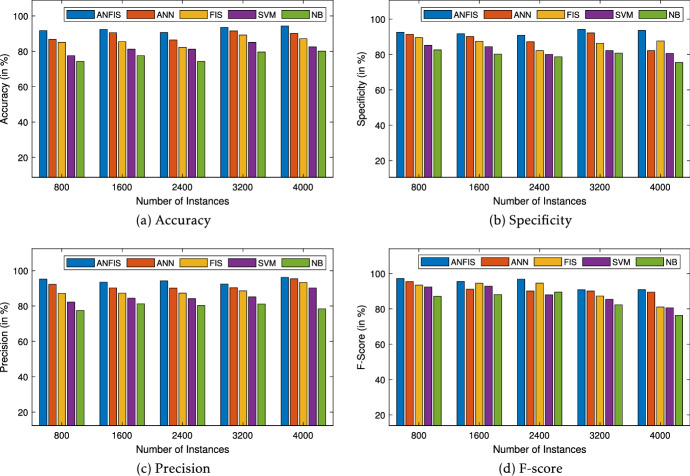
One of the most imperative tasks of determining the proposed model’s efficiency and performance is to compare its results with the other advanced classification algorithms. To achieve this, the results of ANFIS are compared with the other classifiers, namely, artificial neural networks (ANN), support vector machines (SVM), fuzzy inference systems (FIS), and naïve Bayes (NB). Various metrics used for performance analysis are depicted in Table 6. The confusion matrix for ANFIS is presented in Fig. 6, and detailed class-wise results are reported in Table 13. The results of the statistical analysis of the proposed ANFIS, utilizing fusion and feature selection techniques, can also be visualized as reported in Fig. 7. Therefore, it is evident from the results that the overall predictive accuracy of the proposed ANFIS model has improved using feature selection. Moreover, the results of specificity, precision, recall, and f-measure also prove the ANFIS approach’s superiority over other approaches.
Fig. 6.
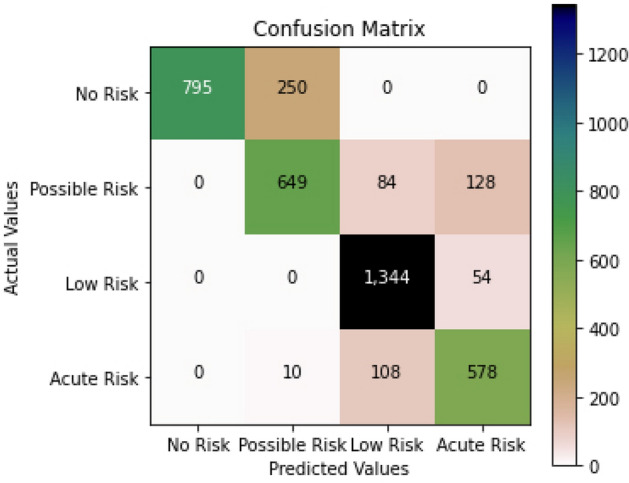
ANFIS confusion matrix
Table 13.
ANFIS classwise accuracy evaluation
| Class | Accuracy | Specificity | Precision | Recall | F-measure |
|---|---|---|---|---|---|
| No risk | 0.9125 | 0.9042 | 0.9156 | 0.9049 | 0.9102 |
| Possible risk | 0.9042 | 0.8672 | 0.8949 | 0.9142 | 0.9044 |
| Low risk | 0.8916 | 0.9067 | 0.9025 | 0.9158 | 0.9091 |
| Acute risk | 0.9134 | 0.8838 | 0.9362 | 0.9216 | 0.9288 |
| Weighted average | 0.9054 | 0.8905 | 0.9123 | 0.9141 | 0.9132 |
Fig. 7.
Statistical analysis of ANFIS
Alert Generation Efficiency Analysis
In cyberspace, alert generation works by providing real-time warning alerts to different stakeholders based on their health state. The warning alerts are provided so that timely action can be taken to save a patient’s life. The alerts are generated in the presented framework at the fog and cloud layers. The efficiency of alerts is measured due to latency or the delay involved in their delivery to the different stakeholders of the system. Latency or delay in the delivery of real-time alerts can be defined as the difference between the delay involved in event prediction and the delay in alerts generation. This can be mathematically formalized as:
| 9 |
The results obtained using the mathematical formalization are depicted in Fig. 8. The results prove the improved performance of alert generation at the fog layer compared to the cloud layer.
Fig. 8.
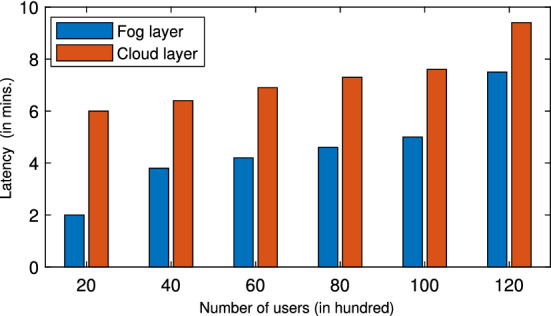
Latency analysis of alerts
Conclusion and Future Work
Viral encephalitis is a globally recognized viral infection that causes inflammation of the brain and is contemplated a public health problem worldwide. Limited medical facilities and slight delays in the diagnosis can exacerbate the severity of a patients’ illness. Consequently, this work presents an IoT–fog–cloud improvised intelligent healthcare cyber-physical framework for early prediction and monitoring of the infection. The proposed framework utilizes multiple data sources for data acquisition. The data is analyzed in real-time using a fuzzy-based k-nearest neighbor classifier for instant decision-making in the fog layer. Consequently, the alerts are disseminated in the event of patients’ adversity to the nearby caretakers. The other layer, namely the cloud layer, employs an information fusion mechanism that integrates data from multiple sources to give an information-rich dataset. The obtained data is preprocessed, and the SVD-based feature selection technique is applied to obtain the set of most prominent features for severity analysis using ANFIS. The proposed framework is implemented in a simulated environment, and the results are compared with state-of-the-art prediction models. At the fog layer, F-KNN highlights excellent performance and achieves a higher classification accuracy of 85.70% with a lower classification time. However, at the cloud layer, ANFIS shows notable performance and attains higher accuracy, specificity, precision, and f-score averaging 90.54%, 89.05%, 91.23%, and 91.32% respectively, in assessing the specific risk factor of encephalitis. Besides, the results are compared with other baseline algorithms for validation purposes. Based on the results, it is concluded that the adopted methodology is competent and highly efficient for early prediction and risk monitoring of viral encephalitis. Besides, the limitation of the proposed framework is that there is no security mechanism to ensure the privacy and security of patient information.
Furthermore, there exist some critical challenges for real-time implementation of the proposed model in a cloud environment, such as resource provisioning and load balancing. In this context, the future work will focus on overcoming the aforementioned challenges and considering security aspects to ensure security and privacy of patient data.
Declarations
Conflict of interest
On behalf of all authors, the corresponding author states that there is no confict of interest.
Footnotes
Publisher's Note
Springer Nature remains neutral with regard to jurisdictional claims in published maps and institutional affiliations.
References
- 1.Aceto G, Persico V, Pescapé A. Industry 4.0 and health: internet of things, big data, and cloud computing for healthcare 4.0. J. Ind. Inf. Integr. 2020;18:100129. [Google Scholar]
- 2.Zhang, C., Chen, Y., Chen, H., Chong, D.: Industry 4.0 and its implementation: a review. Inf. Syst. Front. 1–11 (2021)
- 3.Dey N, Ashour AS, Shi F, Fong SJ, Tavares JMR. Medical cyber-physical systems: a survey. J. Med. Syst. 2018;42(4):1–13. doi: 10.1007/s10916-018-0921-x. [DOI] [PubMed] [Google Scholar]
- 4.Lv Z, Chen D, Lou R, Alazab A. Artificial intelligence for securing industrial-based cyber-physical systems. Future Gener. Comput. Syst. 2021;117:291–298. doi: 10.1016/j.future.2020.12.001. [DOI] [Google Scholar]
- 5.Lv Z, Qiao L. Analysis of healthcare big data. Future Gener. Comput. Syst. 2020;109:103–110. doi: 10.1016/j.future.2020.03.039. [DOI] [Google Scholar]
- 6.Anuradha M, Jayasankar T, Prakash N, Sikkandar MY, Hemalakshmi G, Bharatiraja C, Britto ASF. Iot enabled cancer prediction system to enhance the authentication and security using cloud computing. Microprocess. Microsyst. 2021;80:103301. doi: 10.1016/j.micpro.2020.103301. [DOI] [Google Scholar]
- 7.Jain V, Kumar B. Combinatorial auction based multi-task resource allocation in fog environment using blockchain and smart contracts. Peer-to-Peer Netw. Appl. 2021;14(5):3124–3142. doi: 10.1007/s12083-021-01161-y. [DOI] [Google Scholar]
- 8.Maleki N, Zeinali Y, Niaki STA. A k-nn method for lung cancer prognosis with the use of a genetic algorithm for feature selection. Expert Syst. Appl. 2021;164:113981. doi: 10.1016/j.eswa.2020.113981. [DOI] [Google Scholar]
- 9.Shao Y, Cheng Y, Shah RU, Weir CR, Bray BE, Zeng-Treitler Q. Shedding light on the black box: explaining deep neural network prediction of clinical outcomes. J. Med. Syst. 2021;45(1):1–9. doi: 10.1007/s10916-020-01701-8. [DOI] [PMC free article] [PubMed] [Google Scholar]
- 10.Singh P, Kaur A, Batth RS, Kaur S, Gianini G. Multi-disease big data analysis using beetle swarm optimization and an adaptive neuro-fuzzy inference system. Neural Comput. Appl. 2021;33(16):10403–14. doi: 10.1007/s00521-021-05798-x. [DOI] [Google Scholar]
- 11.da Costa BK, Sato DK. Viral encephalitis: a practical review on diagnostic approach and treatment. Jornal de Pediatria (Versão em Português) 2020;96:12–19. doi: 10.1016/j.jpedp.2019.07.005. [DOI] [PMC free article] [PubMed] [Google Scholar]
- 12.Rosen L, Tesh RB, Lien JC, Cross JH. Transovarial transmission of Japanese encephalitis virus by mosquitoes. Science. 1978;199(4331):909–911. doi: 10.1126/science.203035. [DOI] [PubMed] [Google Scholar]
- 13.Chaudhuri A, Kennedy P. Diagnosis and treatment of viral encephalitis. Postgrad. Med. J. 2002;78(924):575–583. doi: 10.1136/pmj.78.924.575. [DOI] [PMC free article] [PubMed] [Google Scholar]
- 14.Viral encephalitis [online]. https://www.betterhealth.vic.gov.au/. Accessed 08 June 2021
- 15.Epidemiology of viral encephalitis [online] (2019). https://www.who.int/news-room/fact-sheets/detail/japanese-encephalitis
- 16.Singh AK, Kharya P, Agarwal V, Singh S, Singh NP, Jain PK, Kumar S, Bajpai PK, Dixit AM, Singh RK, et al. Japanese encephalitis in Uttar Pradesh, India: a situational analysis. J. Family Med. Prim. Care. 2020;9(7):3716. doi: 10.4103/jfmpc.jfmpc_449_20. [DOI] [PMC free article] [PubMed] [Google Scholar]
- 17.Shaban WM, Rabie AH, Saleh AI, Abo-Elsoud M. Detecting covid-19 patients based on fuzzy inference engine and deep neural network. Appl. Soft Comput. 2021;99:106906. doi: 10.1016/j.asoc.2020.106906. [DOI] [PMC free article] [PubMed] [Google Scholar]
- 18.Zhou Y, Lu Y, Pei Z. Intelligent diagnosis of Alzheimer’s disease based on internet of things monitoring system and deep learning classification method. Microprocess. Microsyst. 2021;83:104007. doi: 10.1016/j.micpro.2021.104007. [DOI] [Google Scholar]
- 19.Hu F, Huang M, Sun J, Zhang X, Liu J. An analysis model of diagnosis and treatment for covid-19 pandemic based on medical information fusion. Inf. Fusion. 2021;73:11–21. doi: 10.1016/j.inffus.2021.02.016. [DOI] [PMC free article] [PubMed] [Google Scholar]
- 20.Jan MA, Zakarya M, Khan M, Mastorakis S, Menon VG, Balasubramanian V, Rehman AU. An ai-enabled lightweight data fusion and load optimization approach for internet of things. Future Gener. Comput. Syst. 2021;122:40–51. doi: 10.1016/j.future.2021.03.020. [DOI] [PMC free article] [PubMed] [Google Scholar]
- 21.Souri A, Ghafour MY, Ahmed AM, Safara F, Yamini A, Hoseyninezhad M. A new machine learning-based healthcare monitoring model for student’s condition diagnosis in internet of things environment. Soft. Comput. 2020;24:17111–17121. doi: 10.1007/s00500-020-05003-6. [DOI] [Google Scholar]
- 22.Ali F, El-Sappagh S, Islam SR, Ali A, Attique M, Imran M, Kwak K-S. An intelligent healthcare monitoring framework using wearable sensors and social networking data. Future Gener. Comput. Syst. 2021;114:23–43. doi: 10.1016/j.future.2020.07.047. [DOI] [Google Scholar]
- 23.Uddin MZ, Hassan MM, Alsanad A, Savaglio C. A body sensor data fusion and deep recurrent neural network-based behavior recognition approach for robust healthcare. Inf. Fusion. 2020;55:105–115. doi: 10.1016/j.inffus.2019.08.004. [DOI] [Google Scholar]
- 24.Ramani R, Devi KV, Soundar KR. Mapreduce-based big data framework using modified artificial neural network classifier for diabetic chronic disease prediction. Soft. Comput. 2020;24(21):16335–16345. doi: 10.1007/s00500-020-04943-3. [DOI] [Google Scholar]
- 25.Lakshmanaprabu S, Mohanty SN, Krishnamoorthy S, Uthayakumar J, Shankar K, et al. Online clinical decision support system using optimal deep neural networks. Appl. Soft Comput. 2019;81:105487. doi: 10.1016/j.asoc.2019.105487. [DOI] [Google Scholar]
- 26.Alzubi JA, Bharathikannan B, Tanwar S, Manikandan R, Khanna A, Thaventhiran C. Boosted neural network ensemble classification for lung cancer disease diagnosis. Appl. Soft Comput. 2019;80:579–591. doi: 10.1016/j.asoc.2019.04.031. [DOI] [Google Scholar]
- 27.Devarajan M, Ravi L. Intelligent cyber-physical system for an efficient detection of Parkinson disease using fog computing. Multimed. Tools Appl. 2019;78(23):32695–32719. doi: 10.1007/s11042-018-6898-0. [DOI] [Google Scholar]
- 28.Al-Khafajiy M, Baker T, Chalmers C, Asim M, Kolivand H, Fahim M, Waraich A. Remote health monitoring of elderly through wearable sensors. Multimed. Tools Appl. 2019;78(17):24681–24706. doi: 10.1007/s11042-018-7134-7. [DOI] [Google Scholar]
- 29.Kaur P, Kumar R, Kumar M. A healthcare monitoring system using random forest and internet of things (iot) Multimed. Tools Appl. 2019;78(14):19905–19916. doi: 10.1007/s11042-019-7327-8. [DOI] [Google Scholar]
- 30.Iwendi, C., Mahboob, K., Khalid, Z., Javed, A.R., Rizwan, M., Ghosh, U.: Classification of covid-19 individuals using adaptive neuro-fuzzy inference system. Multimed. Syst. 1–15 (2021) [DOI] [PMC free article] [PubMed]
- 31.Ghosh SK, Ghosh A. Classification of gene expression patterns using a novel type-2 fuzzy multigranulation-based svm model for the recognition of cancer mediating biomarkers. Neural Comput. Appl. 2021;33(9):4263–4281. doi: 10.1007/s00521-020-05241-7. [DOI] [Google Scholar]
- 32.Viji C, Raja JB, Ponmagal R, Suganthi S, Parthasarathi P, Pandiyan S. Efficient fuzzy based k-nearest neighbour technique for web services classification. Microprocess. Microsyst. 2020;76:103097. doi: 10.1016/j.micpro.2020.103097. [DOI] [Google Scholar]
- 33.AlZubi AA, Alarifi A, Al-Maitah M, Alheyasat O. Multi-sensor information fusion for internet of things assisted automated guided vehicles in smart city. Sustain. Cities Soc. 2021;64:102539. doi: 10.1016/j.scs.2020.102539. [DOI] [Google Scholar]
- 34.Zhang Y-D, Dong Z, Wang S-H, Yu X, Yao X, Zhou Q, Hu H, Li M, Jiménez-Mesa C, Ramirez J, et al. Advances in multimodal data fusion in neuroimaging: overview, challenges, and novel orientation. Inf. Fusion. 2020;64:149–187. doi: 10.1016/j.inffus.2020.07.006. [DOI] [PMC free article] [PubMed] [Google Scholar]
- 35.Akritas AG, Malaschonok GI. Applications of singular-value decomposition (svd) Math. Comput. Simul. 2004;67(1–2):15–31. doi: 10.1016/j.matcom.2004.05.005. [DOI] [Google Scholar]
- 36.Dhs program demographic and health surveys [online]. www.dhsprogram.com/data/dataset/Angola StandardDHS. Accessed Mar 2021
- 37.World health organization: Media centre [online]. www.who.int/health-topics/japanese-encephalitis-disease. Accessed Mar 2021
- 38.Tanwar, S., Ramani, T., Tyagi, S.: Dimensionality reduction using pca and svd in big data: a comparative case study. In: International Conference on Future Internet Technologies and Trends, pp. 116–125. Springer (2017)


