

ABSTRACT
The tumor-adipose microenvironment (TAME) is a universal microecosystem, that is characterized by the dysfunction of lipid metabolism, such as excessive free fatty acids (FFAs). Macrophages are the most abundant immune cell type within TAME, although their diversity in the TAME is not clear. We first reveal that infiltration of M2-like macrophages in the TAME is associated with poor survival in breast cancer. To explore lipid-associated alterations in the TAME, we also detected the levels of FFAs transporters including fatty acid binding proteins (FABPs) and fatty acid transport protein 1 (FATP1). The results indicated that expression of fatty acid transporters in the TAME is tightly linked to the function of macrophages and predicts survival in breast cancer. To explore the impact of FFAs transporters on the function of macrophages, we performed single-cell RNA sequencing (scRNA-seq) and spatial transcriptomics. Consequently, we identified a special subpopulation of macrophages defined as lipid-associated macrophages (LAMs), highly expressed macrophage markers (CD163, SPP1 and C1QC), genes involved in lipid metabolism (FABP3, FABP4, FABP5, LPL and LIPA) and some lipid receptors (LGALS3 and TREM2). Functionally, LAMs were characterized by a canonical functional signature of M2-like macrophages, lipid accumulation and enhancing phagocytosis, and they were mostly distributed in tumor-adipose junctional regions. Finally, the allograft cancer mouse models confirmed that LAMs depletion in the TAME synergizes the antitumorigenic effects of anti-PD1 therapy. In summary, we defined a novel subtype of macrophages in the TAME, that has unique features and clinical outcomes.
KEYWORDS: lipid-associated macrophage, tumor-adipose microenvironment, breast cancer
Introduction
Breast cancer is the most common malignancy in women, and tumor metastasis is the major cause of death of breast cancer patients1. Metastasis is not only determined by the motility and invasive behavior of tumor cells, but is also associated with remodeling of the tumor microenvironment (TME).2 The TME contributes to enhanced cellular proliferation, angiogenesis and immunosuppression.3 Deciphering the dynamic ecosystem of the TME is challenging, and targeted TME therapy represents a promising treatment modality.
Adipocytes account for a large portion of the mammary stroma,4 and cancer-associated adipose is able to release abundant free fatty acids (FFAs) to satisfy the increased demand for membrane synthesis and energy metabolism in favor of rapid growth and proliferation.5 More importantly, FFAs are actively involved in the crosstalk among tumor cells and stromal cells, wherein FFA transporters, including fatty acid binding proteins (FABPs) and fatty acid transport protein (FATP), play an important role.6 The tissue origin of FABPs is strictly regulated. For example, FABP3 is highly expressed in the heart and skeletal muscles, FABP4 is enriched in adipose and FABP5 mainly derived from the epithelium.7 FABPs mainly act as intracellular fatty acid transporters to participate in lipid metabolism or directly interact with intracellular proteins.8 Similarly, extracellular FABPs, such as circulating A-FABP, function as new adipokines to enhance obesity-associated breast cancer development.9 The family of fatty acid transport proteins is composed of six members that are localized on cell membranes and intracellular organelle membranes, and they participate in the absorption of long chain FFAs.7,8 FATP1 predominantly originates from tissues with prolific FFAs metabolism, such as heart, adipose and skeletal muscle.10–12 Notably, FATP1 participates in the esterification and oxidation of FAs in parallel.13 It has been reported that tumor cells with elevated FATP1 expression could take up more FFAs from the TME to remain energetic.14,15 Overall, FABPs and FATP1 mediate tumor progression by regulating energy metabolism of tumor cells and tumor neovascularization,14,16–19 while the role of FFA transporters in the ontogeny and functions of immune cells in the TAME remains unclear.
Macrophages are highly heterogeneous and the most abundant immune cells in the tumor microenvironment(TME).20 In terms of origin, tissue-resident macrophages originate from embryos, while other macrophages are principally derived from myeloid-derived monocytes. These cells display different metabolic characteristics and immunologic functions.21 For classic macrophage polarization, M1-like macrophages are often associated with highly glycolytic metabolism and a robust ability to generate reactive oxygen species (ROS), which underlies their cytocidal functions.22 Conversely, M2-like macrophages employ oxidative phosphorylation as their main energy source, which has been associated with their ability to support tissue repair.23–25 Tumor-associated macrophages (TAMs) show high glycolytic activity and high oxidative phosphorylation, which means that TAMs present both M1 and M2 characteristics with heterogeneous subpopulations.26 The metabolic profile of TAMs is indeed very dynamic, and it varies in response to the alteration of the TME and the nutritional needs of malignant cells.
Recent studies have revealed that lipid-associated macrophages (LAMs) are present in the microenvironment of atherosclerotic plaques, fatty liver, obese adipose tissue and lung metastatic lesions.27–30 Typically, LAMs exhibit massive accumulation of lipid droplets in the cytoplasm, and particularly express diverse lipid receptors, such as TREM2 and LGALS3.29 TREM2 is a transmembrane receptor of the immunoglobulin superfamily, and can be phosphorylated and recruit intracellular signal transduction machinery after TREM2-ligand interaction.31,32 Functionally, TREM2 expression on macrophages prevents the development of multiple metabolic disorders, by promoting the formation of crown-like structures surrounding morbid adipocytes.29 LGALS3, a member of the galectin family, is also extensively involved in cell-cell interactions, cell-matrix adhesion, endocytosis, intracellular trafficking and signaling.33–35 Mechanically, LGALS3 is essential for M2-like macrophage differentiation.36,37 LGALS3 can be released into the TME in a paracrine manner, and further binds NKp30, LAG-3, CD8, T cell receptor (TCR), and integrin LFA-1 on immune cells to diminish their recruitment and cause NK and T-cell dysfunction.38–43 Nonetheless, the features, origins and functions of LAMs, especially in the TME, are still unknown. The role of fatty acid transport-related proteins in LAMs also needs to be further clarified.
In the present study, we reported that the co-enrichment of M2-like macrophages and FFAs transporters in the TAME, predicts a poor prognosis. Furthermore, we identified the features, origins and functions of LAMs in the TAME via scRNA-seq and spatial transcriptomics (ST) and found that LAMs activated lipid metabolism and immunosuppression by highly expressing various FFA-associated transporters and lipid receptors. Finally, the increased infiltration of LAMs in the TAME was correlated with poor survival of patients with breast cancer.
Materials and methods
Cell culture and reagents
The mouse cancer cell lines EMT6 was obtained from Guido Kroemer’s lab. EMT6 was maintained in Dulbecco’s modified Eagle’s medium (DMEM), supplemented with 10% (v/v) fetal bovine serum (FBS) at 37°C in a humidified atmosphere with 5% CO2.
Animal experiments
Six-to-seven-week-old female BALB/c mice were purchased from SJA Laboratory Animal Co., Ltd. (Hunan, China). All mice were raised under a temperature-controlled and pathogen-free environment with 12 h light/dark cycles, with food and water ad libitum. All experimental procedures involving animals were carried out according to the protocol approved by the Institutional Animal Care and Use Committee of Renmin Hospital of Wuhan University (approval no. 2018 K-C09). Mice were treated with clophosome (1.2 mg/mice, i.p.) a day before cell transplantation. Murine mammary carcinoma EMT6 wild-type cells (4 × 10⁵) were injected into the fourth fat pads of BALB/c host. When the tumors reached approximately 20 mm2, mice were treated with clophosome (0.3 mg/mice, i.h., every 3 days), with or without intraperitoneal injection of 200 μg anti-PD-1 antibody (Clone 29 F.1A12, BioXcell, West Lebanon, NH, USA). On the following days, the body weight and tumor growth of mice were monitored and recorded. Tumor area was calculated using the following equation: (longest diameter) × (shortest diameter) ×π/4 and was measured once every 3 days using a Vernier caliper. All the mice were sacrificed when tumor size reached endpoint, and the tumors were collected for immunohistochemistry (IHC) stain.
Tissue specimens
A total of 145 patients who were pathologically diagnosed with breast cancer were included in this study. Formalin-fixed paraffin-embedded breast cancer specimens were preserved in all cases, and corresponding clinical information was obtained from clinical medical records. The detailed clinicopathological characteristics of the patient are shown in Table S1. All patients were followed up for at least 5 years from the date of first diagnosis. All patients in this study provided written informed consent for sample collection and data analysis, and all methods were performed in accordance with relevant guidelines and local regulations. The study was approved by the Institutional Ethics Committee of Renmin Hospital of Wuhan University (approval no. 2018 K-C09).
Immunohistochemistry
A total of 145 paraffin-embedded human breast cancer specimens from the People’s Hospital of Wuhan University from 2011 to 2017 were collected for pathological analysis. Sixty-eight samples were used to detect FABPs and the corresponding macrophage signature, and the remaining 77 samples were used to detect FATP1 and the corresponding macrophage signature. Immunohistochemical staining was performed as follows: deparaffinization, antigen retrieval, blocking endogenous peroxidase (3%hydrogen peroxide solution, room temperature, out of light for 25 minutes), serum block (3% bovine serum albumin, room temperature, 30 min), primary antibodies were incubated overnight at 4°C, and horseradish peroxidase (HRP)-conjugated for 50 minutes at room temperature. Staining was visualized with DAB and time controlled under a microscope. Finally, nuclear counterstaining was performed using hematoxylin for approximately 3 minutes. Human breast cancer specimens treated with only secondary antibody served as negative controls and paraffin-embedded human hepatic carcinoma specimens were used as positive controls. The staining results were scored by two independent pathologists as follows: the protein expression levels of CD163 and CD206 were described by the average number of positive macrophages from five fields at a magnification of ×400 using Image-Pro Plus, while the protein expression levels of fatty acid transport related proteins (FABP3, FABP4, FABP5 and FATP1) were described by the percentage of positive cells calculated by ImageJ software. The proportion of positive cells was scored as follows: 0 (<10% positive cells), 1(10–20% positive cells), 2 (21–50% positive cells) or 3 (more than 50% positive cells). The intensity of protein expression was categorized into 4 levels: 0 (no staining), 1 (weak staining, light yellow), 2 (moderate staining, yellow brown), and 3 (strong staining, brown). The overall score was calculated according to the following formula: intensity score × percentage score. In addition, X-tile software (version 3.6.1) was used to determine the best cutoff values of all protein expression levels with respect to the survival rate.
Analysis of gene expression data
Breast cancer data from The Cancer Genome Atlas (TCGA) were downloaded to explore the correlation between the expression of fatty acid transport related proteins (FABP3, FABP4, FABP5 and FATP1) and macrophage markers (CD163 and CD206), and to further clarify the relationship between these factors and the prognosis of breast cancer.
Data availability
Single-cell transcriptome files of 32 primary breast cancer patients containing myeloid cells were obtained from the Gene Expression Omnibus (GEO: GSE161529). Normalized METABRIC expression matrices and survival information were downloaded from METABRIC (https://www.cbioportal.org/study/summary?id=brca_ metabric). Spatial transcriptomics data for the patient (CID4535) in this study was available from the Zenodo data repository (https://doi.org/10.5281/zenodo.4739739).
ScRNA-seq analysis
The Seurat package (v4.0.3) in R (v4.1.0) was applied to each sample separately to perform unsupervised clustering of the single cells using the read count matrix as input. The quality control applied to cells was based on two steps: the number of detected genes and proportion of mitochondrial gene count per cell. Specifically, cells with fewer than 200 detected genes and cells with more than 15% mitochondrial gene count were filtered. To avoid unexpected noise, genes detected in less than 3 cells were excluded from the downstream analysis. Then, we performed principal component analysis (PCA) on the normalized expression matrix using the top 2000 highly variable genes identified by the “FindVariableFeatures” function in Seurat. Following the results of the PCA, the top 15 principal components (PCs) were selected with a resolution parameter equal to 0.3 for the clustering of all cells in every individual sample. Finally, the clusters were compared pairwise using the “FindAllMarkers” function to detect the cluster-specific expressed genes, which were used to achieve annotations for the clusters based on classical gene markers. For every individual sample, we extracted the myeloid cell cluster based on the expression of LYZ, CD68, CD14 and FCER1A for downstream analysis. To correct the batch effects, data integration was performed by using the SeuratWrappers package (v0.3.0) based on the mutual nearest neighbor (MNN) method. After multiple quality control processes, we ultimately obtained 15272 myeloid cells with 28483 genes. Similarly, we performed dimensionality reduction with the top 40 PCs and clustering with a resolution parameter equal to 3 for the large-scale integrated myeloid cell datasets. The macrophage subsets were selected by positive expression of CD68 and CD163 and negative expression of CTSK. Then, we accomplished dimensionality reduction with the top 40 PCs and clustering with a resolution parameter equal to 1.
Gene set variation analysis
The GSVA package from Bioconductor was used for gene set variation analysis. The gene sets associated with M1/M2 polarization and angiogenesis/phagocytosis were described by Cheng et al and Jaitin et al.29,44
Survival analysis of scRNA-seq signatures
To explore the impact of lipid-associated macrophages described by our scRNA-seq data on the clinical outcome, we assessed the association between gene signatures (derived as described above) and patient relapse-free survival in the METABRIC cohort. For each tumor from the bulk expression cohort, average gene signature expression was derived using the top 25 genes from the gene signature of interest through the GSVA algorithm. Patients were then stratified based on the top and bottom 50% signature scores, and survival curves were generated using the Kaplan–Meier method with the survival package (version: 3.2–11). We used log-rank test statistics to assess the significance between two groups.
Spatial transcriptomics analysis
After downloading the public spatially transcriptomics data as mentioned above, the count matrices were loaded into Seurat (v4.0.3) for the downstream analysis. We performed data normalization on independent tissue sections using the variance-stabilizing transformation method implemented in the “SCTransform” function in Seurat.
Statistical analysis
Statistical analyses were performed using GraphPad Prism version 8.0. Kaplan-Meier analysis was applied to construct Kaplan-Meier curves and the best cutoff values were produced by X-tile (version 3.6.1). Hazard ratios (HRs) and 95% CIs were obtained from multivariate Cox proportional hazard regressions. The correlation between fatty acid transport related proteins (FABP3, FABP4, FABP5 and FATP1) and macrophage markers (CD163 and CD206) was assessed using Pearson’s correlation coefficient.
Results
Infiltration of M2-like macrophages in the TAME is associated with poor survival in breast cancer
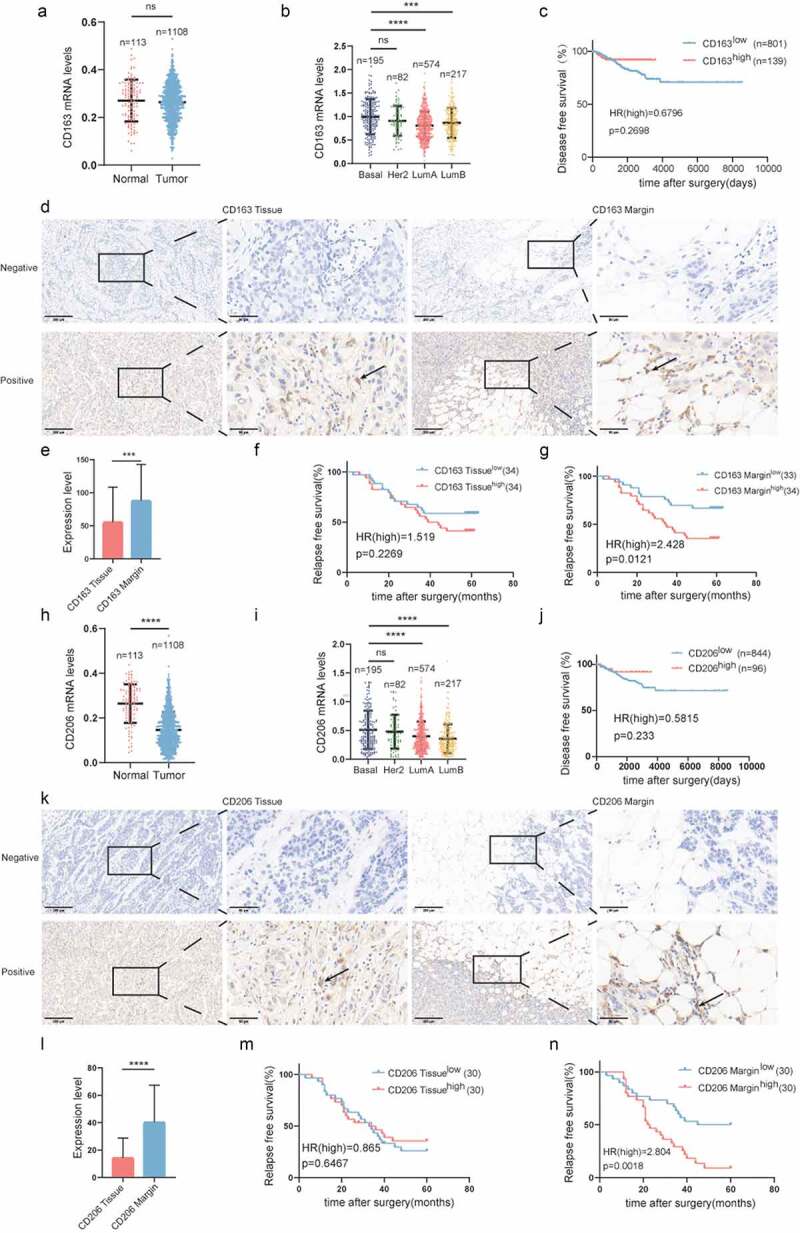
To investigate the expression and distribution characteristics of immunosuppressive macrophages in the breast cancer microenvironment, we first explored the TCGA database for the expression levels of CD163 and CD206 in normal tissue and breast cancer tissue. As shown in Figure 1a, h, there was a similar level of CD163 between normal and tumor tissue, while the expression of CD206 in tumor tissue was dramatically downregulated compared to that in normal tissue. The expression of CD163 and CD206 mRNA was highly detected in basal-like breast cancer among the four breast cancer subtypes. (Figure 1b, i). Patients with divergent CD163 and CD206 expression displayed similar disease-free survival (DFS) (Figure 1c, j). To verify the TCGA results, we performed immunohistochemistry on 68 paraffin-embedded human breast cancer specimens. CD163 and CD206 were uniquely upregulated in the TAME compared to tumor tissues (Figure 1e, l). Patients with high expression of CD163 or CD206 in the TAME exhibited a poor prognosis (Figure 1g, n), while the contribution of CD163 and CD206 expression in tumor tissues to clinical outcomes was less obvious (Figure 1).
Figure 1.
Infiltration of M2-like macrophages in the TAME is associated with poor survival in breast cancer.
(a) Comparison of CD163 mRNA expression in normal and tumor breast tissues in the TCGA datasets. (b) CD163 mRNA expression in different breast cancer subtypes in the breast cancer cohort of TCGA. (c) Kaplan-Meier plots of human BRCA specimens from the TCGA datasets (1082 patients) based on low vs. high gene expression of CD163. (d) Representative immunohistochemical images of CD163 in tumor invasive margins and tumor tissues, respectively. (e) A comparison of the expression levels of CD163 in tumor invasive margins and tumor tissues. (f,g) Kaplan-Meier survival analysis of patients with CD163-positive and -negative IHC staining in the margin or tumor tissues, respectively. (h)Comparison of CD206 mRNA expression in normal and tumor breast tissues in the TCGA datasets. (I) CD206 mRNA expression in different breast cancer subtypes in the breast cancer cohort of TCGA. (j) Kaplan-Meier plots of human BRCA specimens from the TCGA dataset (1082 patients) based on low vs. high gene expression of CD206. (k)Representative immunohistochemical images of CD206 in tumor invasive margins and tumor tissues, respectively. (l) A comparison of the expression levels of CD206 in tumor invasive margins and malignant tissues. (m, n) Kaplan-Meier survival analysis of patients with CD206-positive and -negative IHC staining in the margin or tumor tissues, respectively.*, p < .05; **, p < .01; ***, p < .001; ****, p < .0001;ns, not significant.
Expression of fatty acid transporters in the TAME is tightly linked to the function of macrophages and predicts survival in breast cancer
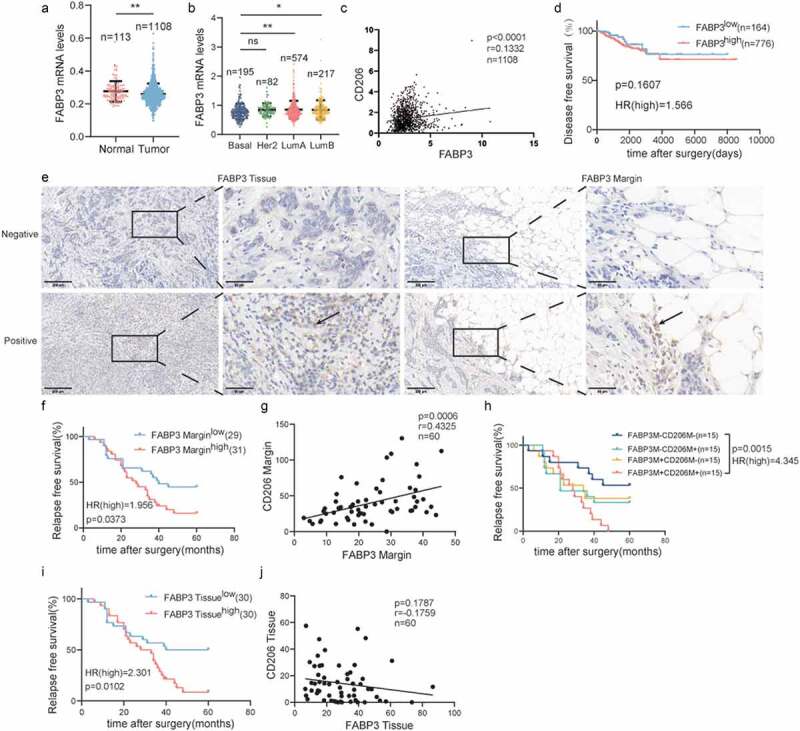
Despite the importance of lipid metabolism reprogramming for macrophages, the roles of FABPs and FATP1 in the polarization of macrophages have not been clarified. As shown in Figure 2a, FABP3 expression was downregulated in tumor tissues compared to normal tissues. Among various breast cancer subtypes, FABP3 was highly expressed in luminal A breast cancer (Figure 2b). FABP3 in the breast tumor microenvironment can be derived from adipocyte precursor cells, preadipocytes and epithelial cells (Figure S2A-D).45 Next, we confirmed that the expression of CD206 was positively correlated with the expression of FABP3 (Figure 2c). It has been reported that FABP3 can be detected in certain macrophages, which located in the lung and liver cancer microenvironment (Figure S2E-H).46,47 Further analysis showed that there were no differences in DFS between high and low FABP3-expressing patients (Figure 2d). To test this result further, immunohistochemical staining was performed on 68 paraffin-embedded human breast cancer specimens to examine the expression of FABP3 (Figure 2e). In contrast to the results of the TCGA database analysis, patients with high FABP3 expression in both tumor tissues and the TAME exhibited shorter relapse-free survival (Figure 2). However, there was only a positive correlation between FABP3 and CD206 in the TAME, and this pattern was not observed in tumor tissues (Figure 2g, 2j). Patients with high expression of both FABP3 and CD206 in the TAME had the worst prognosis (Figure 2h).
Figure 2.
Expression of FABP3 in the TAME is tightly linked to the polarization of CD206+macrophage and predicts survival in breast cancer.
(a) Comparison of FABP3 mRNA expression in normal and tumor breast tissues in the TCGA datasets. (b) FABP3 mRNA expression in different breast cancer subtypes in the breast cancer cohort of TCGA. (c) Correlation analyses between the protein expression levels of FABP3 and CD206 in the TCGA datasets. (d) Kaplan-Meier plots of human BRCA specimens from the TCGA datasets (1082 patients) based on low vs. high gene expression of FABP3. (e) Representative immunohistochemical images of FABP3 in tumor invasive margins and tumor tissues, respectively. (f, i) Kaplan-Meier survival analysis of patients with FABP3-positive and -negative IHC staining in the margin or tumor tissues, respectively. (g, j) Correlation analyses between the protein expression levels of FABP3 and CD206 in the margin or tumor tissues, respectively. (h) Kaplan-Meier survival analysis of patients with biomarker-positive and -negative IHC staining in the margin.*, p < .05; **, p < .01; ***, p < .001; ****, p < .0001; ns, not significant; Correlation calculations represent Pearson’s coefficient.
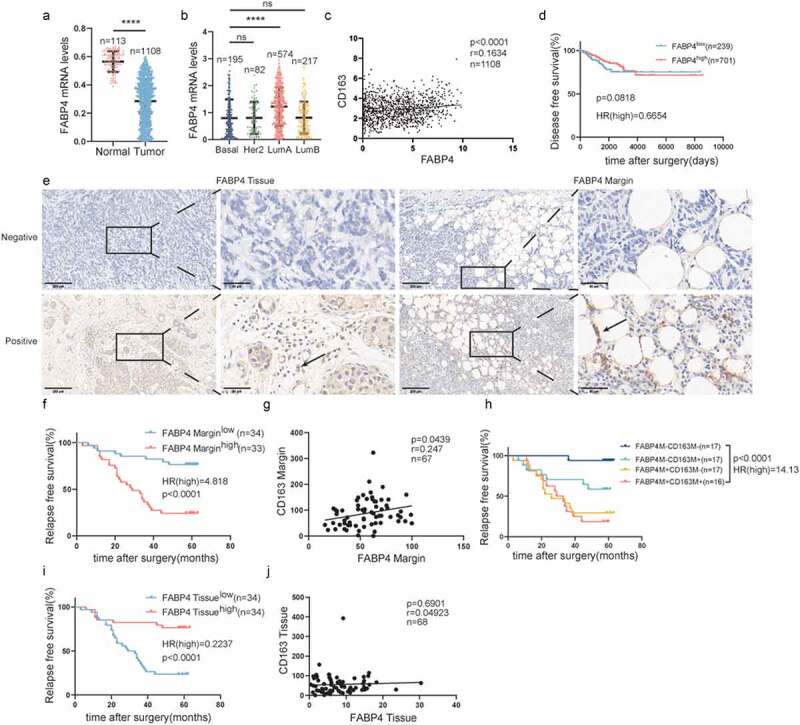
Through the analysis of the TCGA databases, FABP4 was downregulated in tumor tissues (Figure 3a). Luminal A breast cancer showed much higher FABP4 expression (Figure 3b). FABP4 was positively correlated with the expression of CD163 (Figure 3c). However, the expression levels of FABP4 did not predict patient outcome (Figure 3d). Remarkable FABP4 expression was detected in paraffin-embedded human breast cancer specimens by immunohistochemical staining (Figure 3e). Patients with FABP4 overexpression in the TAME had a shorter RFS, while the opposite was observed in tumor tissues (Figure 3). Similar to FABP3, the FABP4 level was positively associated with CD163 expression in the TAME but not in tumor tissues (Figure 3g, j). Additionally, patients with overexpressed FABP4 and CD163 in the TAME had inferior prognoses (Figure 3h).
Figure 3.
Expression of FABP4 in the TAME is tightly linked to the polarization of CD163+macrophage and predicts survival in breast cancer.
(a) Comparison of FABP4 mRNA expression in normal and tumor breast tissues in the TCGA datasets. (b) FABP4 mRNA expression in different breast cancer subtypes in the breast cancer cohort of TCGA. (c) Correlation analyses between the protein expression levels of FABP4 and CD163 in the TCGA datasets. (d) Kaplan-Meier plots of human BRCA specimens from the TCGA datasets (1082 patients) based on low vs. high gene expression of FABP4. (e) Representative immunohistochemical images of FABP4 in tumor invasive margins and tumor tissues, respectively. (f, i) Kaplan-Meier survival analysis of patients with FABP4-positive and -negative IHC staining in the margin or tumor tissues, respectively. (g, j) Correlation analyses between the protein expression levels of FABP4 and CD163 in the margin or tumor tissues, respectively. (h) Kaplan-Meier survival analysis of patients with biomarker-positive and -negative IHC staining in the margin.Notes: *, p < .05; **, p < .01; ***, p < .001; ****, p < .0001; ns, not significant; Correlation calculations represent Pearson’s coefficient.
According to TCGA database, there was a lower expression of FABP5 in tumor tissues than in normal tissues. FABP5 was highly expressed in basal-like breast cancer (Figure 4a, b). FABP5 expression was positively associated with CD163 expression (Figure 4c) and patients with high expression of FABP5 had a poor prognosis (Figure 4d). We further performed immunohistochemical staining on 68 paraffin-embedded human breast cancer specimens to examine the expression of FABP5. As shown in Figure 4e, FABP5 was highly expressed in both tumor tissues and TAME. Patients with elevated FABP5 expression in both tumor tissues and TAME suffered from a shorter RFS (Figure 4). Only the expression of FABP5 in the TAME had a positive association with CD163 expression (Figure 4g), which could not be observed in tumor tissues (Figure 4j). Further analysis showed that patients with upregulated FABP5 and CD163 in the TAME demonstrated the worst RFS (Figure 4h).
Figure 4.

Expression of FABP5 in the TAME is tightly linked to the polarization of CD163+macrophage and predicts survival in breast cancer.
(a) Comparison of FABP5 mRNA expression in normal and tumor breast tissues in the TCGA datasets. (b) FABP5 mRNA expression in different breast cancer subtypes in the breast cancer cohort of TCGA. (c) Correlation analyses between the protein expression levels of FABP5 and CD163 in the TCGA datasets. (d) Kaplan-Meier plots of human BRCA specimens from the TCGA datasets (1082 patients) based on low vs. high gene expression of FABP5. (e) Representative immunohistochemical images of FABP5 in tumor invasive margins and tumor tissues, respectively. (f, i) Kaplan-Meier survival analysis of patients with FABP5-positive and -negative IHC staining in the margin or tumor tissues, respectively. (g, j) Correlation analyses between the protein expression levels of FABP5 and CD163 in the margin or tumor tissues, respectively. (h) Kaplan-Meier survival analysis of patients with biomarker-positive and -negative IHC staining in the margin.*, p < .05; **, p < .01; ***, p < .001; ****, p < .0001; ns, not significant; Correlation calculations represent Pearson’s coefficient.
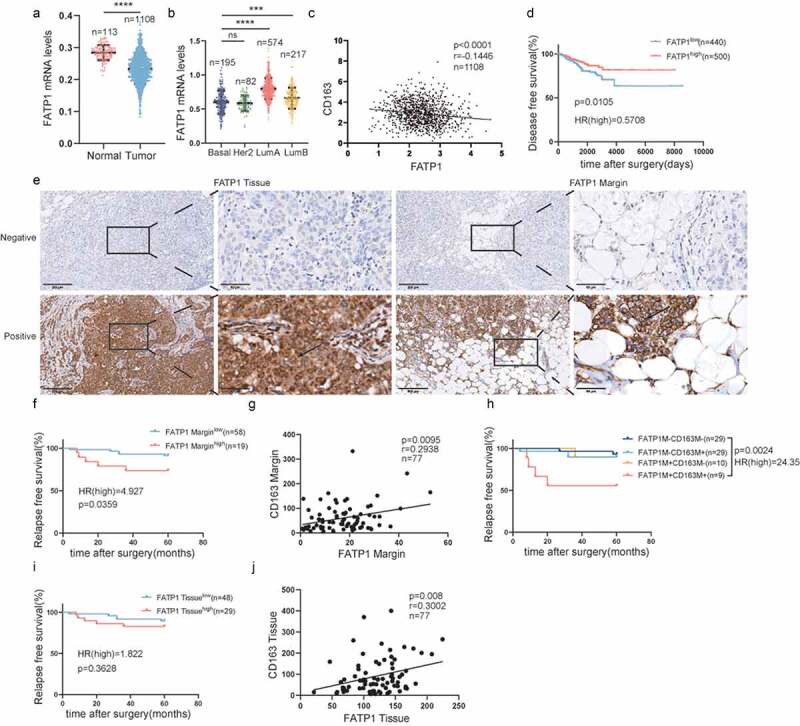
We subsequently analyzed the FATP1 mRNA levels in a large cohort of breast cancer patient data from the TCGA. As shown in Figure 5a, the FATP1 mRNA levels were downregulated in tumor tissues compared to normal tissues. And dramatically higher expression of FATP1 was observed in luminal A breast cancer (Figure 5b). Further analysis revealed that FATP1 expression was significantly negatively associated with CD163 expression (Figure 5c) and patients with upregulated FATP1 had a longer disease-free survival (Figure 5d). Furthermore, FATP1 expression was detected in paraffin-embedded human breast cancer specimens (Figure 5e). Patients with high expression of FATP1 in the TAME suffered from a shorter RFS (Figure 5), while overexpression of FATP1 in tumor tissues did not contribute to clinical outcomes (Figure 5i). Additionally, there was a significant positive correlation between FATP1 expression and CD163 expression in both TAME and tumor tissues (Figure 5g, j). Patients with elevated FATP1 and CD163 in the TAME exhibited a shorter RFS (Figure 5h).
Figure 5.
Expression of FATP1 in the TAME is tightly linked to the polarization of CD163+macrophage and predicts survival in breast cancer.
(a) Comparison of FATP1 mRNA expression in normal and tumor breast tissues in the TCGA datasets. (b) FATP1 mRNA expression in different breast cancer subtypes in the breast cancer cohort of TCGA. (c) Correlation analyses between the protein expression levels of FATP1 and CD163 in the TCGA datasets. (d) Kaplan-Meier plots of human BRCA specimens from the TCGA datasets (1082 patients) based on low vs. high gene expression of FATP1. (e) Representative immunohistochemical images of FATP1 in tumor invasive margins and tumor tissues, respectively. (f, i) Kaplan-Meier survival analysis of patients with FATP1-positive and -negative IHC staining in the margin or tumor tissues, respectively. (g, j) Correlation analyses between the protein expression levels of FATP1 and CD163 in the margin or tumor tissues, respectively. (h) Kaplan-Meier survival analysis of patients with biomarker-positive and -negative IHC staining in the margin.*, p < .05; **, p < .01; ***, p < .001; ****, p < .0001; ns, not significant; Correlation calculations represent Pearson’s coefficient.
Lipid-associated macrophages promote breast cancer progression
According to the heterogeneity and dynamics of macrophages, single-cell RNA sequencing (scRNA-seq) and spatial transcriptomics were applied to define these distinct subsets of macrophages in the TME (Figure 6a). First, we performed an unsupervised clustering analysis to define major cell populations. A total of 8 distinct clusters were annotated based on the specific genetic markers (Figure S1A-B). Furthermore, FFA transporters, including FABP3, FABP4, FABP5 and FATP1, were mostly enriched in myeloid cells (Figure S1C). After quality control, more than 10000 myeloid-lineage immune cells from 32 breast cancer patients were clustered into nine major clusters based on the classic markers (Figure S1D-E). Furthermore, we re-clustered macrophages into subpopulations, which identified 10 subclusters (Figure 6b-c). A special subpopulation of macrophages, defined as LAMs, highly expressed macrophage markers (SPP1, C1QC), FFA transporters (FABP3, FABP4 and FABP5) and lipid-associated genes (LPL, LIPA, LGALS3 and TREM2) (Figure S1F). To specify the polarity and function of the LAMs, we scored macrophages in LAMs against non-LAMs for the signatures described in the Methods. Overall, signatures associated with canonical functional signatures of M2-like macrophages tended to be enriched in LAMs (Figure 6d). LAMs were also characterized by the reinforcement of phagocytosis (Figure 6e). To decipher the special distribution of LAMs in the TAME, ADIPOQ was used to label adipose, and LYZ was regarded as a biomarker of monocyte-derived macrophages. As shown in Figure 6, LAMs mainly spread over the tumor-adipose adjacent regions, demonstrated by the fact that LAMs were mainly distributed in the ADIPOQ+ area, while LYZ+ macrophages did not exhibit such a phenomenon. Eventually, LAMs were widely dispersed among multiple subtypes of breast cancer (Figure S1G), and patients with an increased infiltration of LAMs in the TAME had a poor prognosis (Figure 6h).
Figure 6.

Lipid-associated macrophages promote breast cancer progression.
(a) Workflow of the bioinformatic analysis. (b) Reclustering of macrophages, UMAP visualization and marker-based annotation of 10 macrophage subtypes, colored by cluster identity. (c) Heatmap of DEGs between different macrophage subgroups. Selected genes of interest from each signature are listed. (d) Box plots show the enrichment scores of the M1 signature and M2 signature in the non-LAM and LAM, respectively. (e) Box plots show the enrichment scores of the angiogenesis signature and phagocytosis signature in the non-LAM and LAM, respectively. (f) The distributions of ADIPOQ and LAM signature in the BRCA ST datasets, respectively. (g) Box plots show the enrichment scores of the LAM signature and LYZ signature in the ADOPOQ- and ADOPOQ+ group, respectively. (h) Kaplan-Meier plots showing differences in survival among BRCA patients stratified based on the top and bottom 30% selected LAM signature scores. P values from log-rank test statistics.
LAMs depletion in the TAME synergizes the antitumorigenic effects of anti-PD1 therapy
To determine whether LAMs depletion in the TAME potentiates the efficiency of immune checkpoint inhibitors, clophosome treatment eliminated LAMs with enhanced phagocytosis in murine and EMT6 breast cancer cells are used to establish tumors in syngeneic BALB/c immunocompetent hosts (Figure 7a). To further interrogate whether clophosome enabled to eradicate LAMs in the TAME, the expressions of LAMs marker-CD163 was detected in mice tumors by IHC. The results indicated that a remarkable decrease of CD163 levels was found in tumors with clophosome treatment compared to those in control group (Figure 7b-c). In contrast to anti-PD1 monotherapy or clophosome treatment alone, the combination of clophosome and PD1 blocker was more efficient in decelerating tumor growth (Figure 7d-f). Taken together, these results highlight that eliminating LAMs in the TAME has capacity to potentiate the efficacy of immune-targeting drugs in preclinical models.
Figure 7.
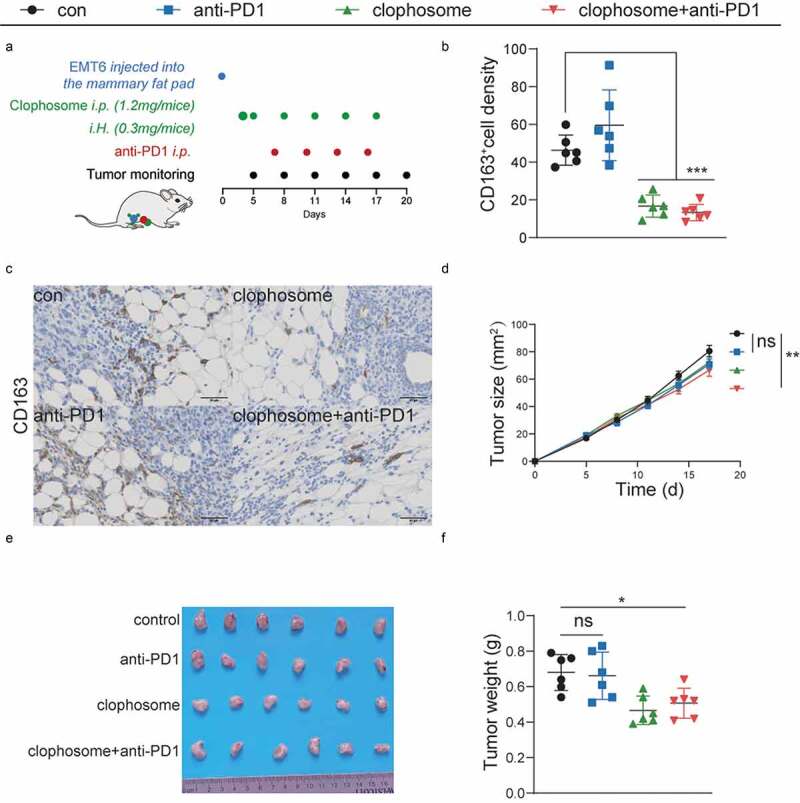
LAMs depletion in the TAME synergizes the antitumorigenic effects of anti-PD1 therapy.
(a) Balb/c mice inoculated with EMT6 cells were treated with anti-PD1 blocker and clophosome as scheduled. (b) The levels of CD163 are quantified by ImageJ after staining with the specific antibodies in paraffin-embedded tissues obtained from murine tumors. (c) Representative immunohistochemical images of CD163. (d-f) Growth curves (mean ± SEM), the representative images of tumors and tumor weight distributions at day 20 were shown.
Discussion
In our study, the overexpression of FABPs and FATP1 and the increased infiltration of M2-like macrophages were found in the TAME, and predicted a poor prognosis. In addition, the correlation between fatty acid-associated transporters and macrophages was sophisticated, suggesting that lipids accumulated in the TAME may alter the function and polarity of macrophages. Most importantly, we identified a specific subtype of macrophages in the TAME, named lipid-associated macrophages (LAMs). Using single-cell genomic analysis, LAMs were discovered to express FFAs -associated transporters, such as FABPs and FATP1, and some lipid receptors, such as TREM2 and LGALS3. The signature of LAMs represented an enrichment of lipid metabolism, M2-like immunosuppressive effects and phagocytosis. Ultimately, LAMs were defined as potent protumor factors regardless of the breast cancer subtypes.
The oncogenic properties of FFAs transporters have been reported in diverse cancers, including hepatocellular, breast and ovarian cancer.48–50 However, contrary or contradictory results have been reported,51 indicating that they have a context-specific role in malignant progression. Consequently, we exclusively sought to determine the functions of FFAs transporters in the TAME. Our results showed that FABP3, FABP4, FABP5 and FATP1 expression was dramatically increased in the breast cancer-adipose junctional district, and contributed to worse survival. Consistently, recent studies also revealed that the increased expression of these FFAs transporters was associated with tumor invasiveness especially in the case of obesity.5,9,52 Mechanistically, these FFAs transport proteins could deliver multitudinous FFAs and lipids from cancer-associated adipocytes to neoplastic cells, and provide substantial energy and ingredients to facilitate tumor growth and metastasis.5,53–55 Additionally, FFAs carried by these transporters could perturb mitochondrial metabolism to promote naïve T-cell apoptosis, inhibit anti-tumor cytokine secretion and stimulate T cell exhaustion.48,56 Thus, upregulation of these FFAs transporters may accommodate malignant cells to FFAs-enriched TAMEs and formulate an immunosuppressive microenvironment.
TAMs have been characterized by substantial heterogeneity in various cancers.57 However, the comprehensive resolution of the subpopulations, origin, polarization and function of macrophages in tumor ecosystems is still challenging. Initially, macrophages were classified into the M1/M2 dichotomy based on their function in cancer progression. In fact, the effects of macrophages on neoplastic progression are complex and dynamic due to their overlapping functions and nonspecificity. For instance, M2 macrophages were found to express arginine I, a key enzyme that catalyzes arginine to ornithine; in contrast, it was also demonstrated to be overexpressed in M1 macrophages induced by IFN-γ.58 Through an analysis of the IHC results, we found that multiple FFAs transporters colocalized with biomarkers of M2-like macrophages in the TAME. Considering that the results of immunohistochemistry were not completely consistent with the analysis results of the TCGA database, this is possibly explained by the TCGA dataset is an assessment of total mRNA expression levels while IHC is an assessment of protein expression levels. Translation can be highly heterogeneous, mRNA molecules originating from the same gene can produce different amounts of protein and can synthesize entirely different polypeptides.59 In addition, fatty acid transport proteins expressed in both tumor tissue and non-tumor tissue such as immune cells and stromal cells. The spatial differences in the distribution of FFAs transport proteins may be another potential cause,60 which also were confirmed by our results. High expression of FFAs transporters or co-expression of FFAs transporters and M2-like macrophage markers in the TAME were significantly associated with a lower survival rate of breast cancer patients. Previous studies have shown that FFAs transporters serve macrophage functions. For example, FABP4 was mainly expressed in CD11b+F4/80+MHCII−Ly6C−TAM, and it further exerted a tumor-promoting effect through activation of the IL-6/STAT3 pathway.61 Therefore, our study suggested that lipid metabolism mediated by various FFAs transporters represents a novel functional biomarker for tumor-promoting macrophages.
LAMs are regarded as a pivotal discovery connecting macrophage recruitment to metabolic syndrome, and monocyte-derived LAMs are recruited into obese adipose tissue.29 Subsequently, we performed single-cell sequencing and spatial transcriptomics to further characterize these macrophages in the TAME and found that LAMs were enriched in the TAME. We also observed that LAMs possessed some features of the M2-like phenotype and exhibited enhanced phagocytosis. For the specific markers, LAMs not only expressed the gene signatures involved in lipid and cholesterol metabolism, but also expressed lipid receptors, such as TREM2 and LGALS3. Interestingly, LAMs were also found in the pulmonary alveolus, and were enriched in lung metastatic lesions.30 TREM2+ LAMs are defined as a novel immunosuppressive subtype in cancer, and associated with T cell exhaustion. Furthermore, deletion of TREM2 in macrophages or anti-TREM2 antibody could enhance anti-PD-1 treatment mainly depending on T cell activation.62–64 In addition, LGALS3, a galectin with β-galactoside–binding lectins, is a ligand for LAG-3. LGALS3 could bind to LAG-3 to suppress the proliferation and activation of effector T cells.41 Furthermore, an LGALS3 inhibitor could retard lung adenocarcinoma growth, prevent metastasis, and synergize with an anti-PD-L1 inhibitor.65 These results highlight that LAMs could be a potential of target for reactivation of the anti-tumor immune response.
In conclusion, the function and spatial distribution of TAMs present an obvious heterogeneity in the TAME of breast cancer. Moreover, we identified a specific subset of macrophages – LAMs, which exhibit enhanced expression of FFAs transporters and lipid receptors, and display an immunosuppressive effect and intensified phagocytosis. Finally, the augmentation of LAMs in the TAME predicts a poor prognosis of breast cancer. Hence, LAMs serve as a new biomarker for tumor progression, and targeting LAMs may be a promising approach for tumor immunotherapy.
Supplementary Material
Acknowledgments
We would like to thank the participating patients for the source of BC tissue specimens.
Correction Statement
This article has been republished with minor changes. These changes do not impact the academic content of the article.
Funding Statement
This work was supported by a National Natural Science Foundation of China (NSFC) grant [Grant NO: 81471781] to Prof. Shengrong Sun and [Grant NO: 81903166] to Dr. Si Sun. This work was also supported by a [Grant No. WJ2019Q044] to Dr. Si Sun, a Fundamental Research Funds for the Central Universities of China (Grant NO: Central Universities of China grant 413000480 and 2042021kf0083) to Dr. Qi Wu and (Grant NO: 2042021kf0102) to Dr. Bei Li. Finally, this work was supported by the Natural Science Foundation of Hubei [grant No. 2018CKB916] to Dr. Si Su; Hubei Province health and family planning scientific research project
Disclosure statement
No potential conflict of interest was reported by the author(s).
Authors’ contributions
Si Sun, Juan Wu and Hong-Zhong Jin contributed to the conception and design of the study. Si-Qin Liu and Xiao-Yu Fu are responsible for collecting and collating documents. Zhou Liu and Zhi-Jie Gao performed these experiments. Yang-Yang Ou, Xin Yu and Zun Zhang participated in analysis and interpretation of the data. Bei Li, Juan-Juan Li and Qi Wu are responsible for writing this article, while Sheng-Rong Sun is responsible for proofreading and submission. All authors contributed to the article and approved the submitted version.
Supplementary material
Supplemental data for this article can be accessed online at https://doi.org/10.1080/2162402X.2022.2085432
References
- 1.Liang Y, Zhang H, Song X, Yang Q.. Metastatic heterogeneity of breast cancer: molecular mechanism and potential therapeutic targets. Semin Cancer Biol. 2020;60:14–14. doi: 10.1016/j.semcancer.2019.08.012. [DOI] [PubMed] [Google Scholar]
- 2.Luo Y, Barrios-Rodiles M, Gupta GD, Zhang YY, Ogunjimi AA, Bashkurov M, Tkach JM, Underhill AQ, Zhang L, Bourmoum M, et al. Atypical function of a centrosomal module in WNT signalling drives contextual cancer cell motility. Nat Commun. 2019;10(1):2356. doi: 10.1038/s41467-019-10241-w. [DOI] [PMC free article] [PubMed] [Google Scholar]
- 3.Hanahan D, Weinberg RA.. Hallmarks of cancer: the next generation. Cell. 2011;144(5):646–674. doi: 10.1016/j.cell.2011.02.013. [DOI] [PubMed] [Google Scholar]
- 4.Wang QA, Song A, Chen W, Schwalie PC, Zhang F, Vishvanath L, Jiang L, Ye R, Shao M, Tao C, et al. Reversible de-differentiation of mature white adipocytes into preadipocyte-like precursors during lactation. Cell Metab. 2018;28(2):282–288 e3. doi: 10.1016/j.cmet.2018.05.022. [DOI] [PMC free article] [PubMed] [Google Scholar]
- 5.Wu Q, Li B, Li Z, Li J, Sun S, Sun S. Cancer-associated adipocytes: key players in breast cancer progression. J Hematol Oncol. 2019;12(1):95. doi: 10.1186/s13045-019-0778-6. [DOI] [PMC free article] [PubMed] [Google Scholar]
- 6.Corn KC, Windham MA, Rafat M. Lipids in the tumor microenvironment: from cancer progression to treatment. Prog Lipid Res. 2020;80:101055. doi: 10.1016/j.plipres.2020.101055. [DOI] [PMC free article] [PubMed] [Google Scholar]
- 7.Li B, Hao J, Zeng J, Sauter ER. SnapShot: FABP Functions. Cell. 2020;182(4):1066–1066 e1. doi: 10.1016/j.cell.2020.07.027. [DOI] [PMC free article] [PubMed] [Google Scholar]
- 8.Hotamisligil GS, Bernlohr DA. Metabolic functions of FABPs–mechanisms and therapeutic implications. Nat Rev Endocrinol. 2015;11(10):592–605. doi: 10.1038/nrendo.2015.122. [DOI] [PMC free article] [PubMed] [Google Scholar]
- 9.Hao J, Zhang Y, Yan X, Yan F, Sun Y, Zeng J, Waigel S, Yin Y, Fraig MM, Egilmez NK, et al. Circulating adipose fatty acid binding protein is a new link underlying obesity-associated breast/mammary tumor development. Cell Metab. 2018;28(5):689–705.e5. doi: 10.1016/j.cmet.2018.07.006. [DOI] [PMC free article] [PubMed] [Google Scholar]
- 10.Martin G, Nemoto M, Gelman L, Geffroy S, Najib J, Fruchart JC, Roevens P, de Martinville B, Deeb S, Auwerx J. The human fatty acid transport protein-1 (SLC27A1; FATP-1) cDNA and gene: organization, chromosomal localization, and expression. Genomics. 2000;66(3):296–304. doi: 10.1006/geno.2000.6191. [DOI] [PubMed] [Google Scholar]
- 11.Ordovas L, Roy R, Zaragoza P, Rodellar C. Structural and functional characterization of the bovine solute carrier family 27 member 1 (SLC27A1) gene. Cytogenet Genome Res. 2006;115(2):115–122. doi: 10.1159/000095230. [DOI] [PubMed] [Google Scholar]
- 12.Schaffer JE, Lodish HF. Expression cloning and characterization of a novel adipocyte long chain fatty acid transport protein. Cell. 1994;79(3):427–436. doi: 10.1016/0092-8674(94)90252-6. [DOI] [PubMed] [Google Scholar]
- 13.Huang J, Zhu R, Shi D. The role of FATP1 in lipid accumulation: a review. Mol Cell Biochem. 2021;476(4):1897–1903. doi: 10.1007/s11010-021-04057-w. [DOI] [PubMed] [Google Scholar]
- 14.Mendes C, Lopes-Coelho F, Ramos C, Martins F, Santos I, Rodrigues A, Silva F, Andre S, Serpa J. Unraveling FATP1, regulated by ER-beta, as a targeted breast cancer innovative therapy. Sci Rep. 2019;9(1):14107. doi: 10.1038/s41598-019-50531-3. [DOI] [PMC free article] [PubMed] [Google Scholar]
- 15.Zhang M, Di Martino JS, Bowman RL, Campbell NR, Baksh SC, Simon-Vermot T, Kim IS, Haldeman P, Mondal C, Yong-Gonzales V, et al. Adipocyte-derived lipids mediate melanoma progression via FATP proteins. Cancer Discov. 2018;8(8):1006–1025. doi: 10.1158/2159-8290.CD-17-1371. [DOI] [PMC free article] [PubMed] [Google Scholar]
- 16.Gyamfi J, Yeo JH, Kwon D, Min BS, Cha YJ, Koo JS, Jeong J, Lee J, Choi J. Interaction between CD36 and FABP4 modulates adipocyte-induced fatty acid import and metabolism in breast cancer. NPJ Breast Cancer. 2021;7(1):129. doi: 10.1038/s41523-021-00324-7. [DOI] [PMC free article] [PubMed] [Google Scholar]
- 17.Liu X, Niu X, Qiu Z. A five-gene signature based on stromal/immune scores in the tumor microenvironment and its clinical implications for liver cancer. DNA Cell Biol. 2020;39(9):1621–1638. doi: 10.1089/dna.2020.5512. [DOI] [PubMed] [Google Scholar]
- 18.Luis G, Godfroid A, Nishiumi S, Cimino J, Blacher S, Maquoi E, Wery C, Collignon A, Longuespee R, Montero-Ruiz L, et al. Tumor resistance to ferroptosis driven by stearoyl-CoA desaturase-1 (SCD1) in cancer cells and fatty acid biding protein-4 (FABP4) in tumor microenvironment promote tumor recurrence. Redox Biol. 2021;43:102006. doi: 10.1016/j.redox.2021.102006. [DOI] [PMC free article] [PubMed] [Google Scholar]
- 19.Pan L, Xiao H, Liao R, Chen Q, Peng C, Zhang Y, Mu T, Wu Z. Fatty acid binding protein 5 promotes tumor angiogenesis and activates the IL6/STAT3/VEGFA pathway in hepatocellular carcinoma. Biomed Pharmacother. 2018;106:68–76. doi: 10.1016/j.biopha.2018.06.040. [DOI] [PubMed] [Google Scholar]
- 20.Condeelis J, Pollard JW. Macrophages: obligate partners for tumor cell migration, invasion, and metastasis. Cell. 2006;124(2):263–266. doi: 10.1016/j.cell.2006.01.007. [DOI] [PubMed] [Google Scholar]
- 21.Artyomov MN, Sergushichev A, Schilling JD. Integrating immunometabolism and macrophage diversity. Semin Immunol. 2016;28(5):417–424. doi: 10.1016/j.smim.2016.10.004. [DOI] [PMC free article] [PubMed] [Google Scholar]
- 22.Andrejeva G, Rathmell JC. Similarities and distinctions of cancer and immune metabolism in inflammation and tumors. Cell Metab. 2017;26(1):49–70. doi: 10.1016/j.cmet.2017.06.004. [DOI] [PMC free article] [PubMed] [Google Scholar]
- 23.Galvan-Pena S, O’Neill LA. Metabolic reprograming in macrophage polarization. Front Immunol. 2014;5:420. doi: 10.3389/fimmu.2014.00420. [DOI] [PMC free article] [PubMed] [Google Scholar]
- 24.Mills EL, O’Neill LA. Reprogramming mitochondrial metabolism in macrophages as an anti-inflammatory signal. Eur J Immunol. 2016;46(1):13–21. doi: 10.1002/eji.201445427. [DOI] [PubMed] [Google Scholar]
- 25.Netea-Maier RT, Smit JWA, Netea MG. Metabolic changes in tumor cells and tumor-associated macrophages: a mutual relationship. Cancer Lett. 2018;413:102–109. doi: 10.1016/j.canlet.2017.10.037. [DOI] [PubMed] [Google Scholar]
- 26.de-Brito N,M, Duncan-Moretti J, da-Costa HC, Saldanha-Gama R, Paula-Neto HA, Dorighello GG, Simoes RL, Barja-Fidalgo C. Aerobic glycolysis is a metabolic requirement to maintain the M2-like polarization of tumor-associated macrophages. Biochim Biophys Acta Mol Cell Res. 2020;1867(2):118604. doi: 10.1016/j.bbamcr.2019.118604. [DOI] [PubMed] [Google Scholar]
- 27.Baidzajevas K, Hadadi E, Lee B, Lum J, Shihui F, Sudbery I, Kiss-Toth E, Wong SC, Wilson HL. Macrophage polarisation associated with atherosclerosis differentially affects their capacity to handle lipids. Atherosclerosis. 2020;305:10–18. doi: 10.1016/j.atherosclerosis.2020.05.003. [DOI] [PubMed] [Google Scholar]
- 28.Remmerie A, Martens L, Thone T, Castoldi A, Seurinck R, Pavie B, Roels J, Vanneste B, De Prijck S, Vanhockerhout M, et al. Osteopontin expression identifies a subset of recruited macrophages distinct from Kupffer cells in the fatty liver. Immunity. 2020;53(3):641–657 e14. doi: 10.1016/j.immuni.2020.08.004. [DOI] [PMC free article] [PubMed] [Google Scholar]
- 29.Jaitin DA, Adlung L, Thaiss CA, Weiner A, Li B, Descamps H, Lundgren P, Bleriot C, Liu Z, Deczkowska A, et al. Lipid-associated macrophages control metabolic homeostasis in a Trem2-dependent manner. Cell. 2019;178(3):686–698.e14. doi: 10.1016/j.cell.2019.05.054. [DOI] [PMC free article] [PubMed] [Google Scholar]
- 30.Huggins DN, LaRue RS, Wang Y, Knutson TP, Xu Y, Williams JW, Schwertfeger KL. Characterizing macrophage diversity in metastasis-bearing lungs reveals a lipid-associated macrophage subset. Cancer Res. 2021;81(20):5284–5295. doi: 10.1158/0008-5472.CAN-21-0101. [DOI] [PMC free article] [PubMed] [Google Scholar]
- 31.Peng Q, Malhotra S, Torchia JA, Kerr WG, Coggeshall KM, Humphrey MB. TREM2- and DAP12-dependent activation of PI3K requires DAP10 and is inhibited by SHIP1. Sci Signal. 2010;3(122):ra38. doi: 10.1126/scisignal.2000500. [DOI] [PMC free article] [PubMed] [Google Scholar]
- 32.Ulland TK, Song WM, Huang SC, Ulrich JD, Sergushichev A, Beatty WL, Loboda AA, Zhou Y, Cairns NJ, Kambal A, et al. TREM2 maintains microglial metabolic fitness in alzheimer’s disease. Cell. 2017;170(4):649–663 e13. doi: 10.1016/j.cell.2017.07.023. [DOI] [PMC free article] [PubMed] [Google Scholar]
- 33.Hsu DK, Chen HY, Liu FT. Galectin-3 regulates T-cell functions. Immunol Rev. 2009;230(1):114–127. doi: 10.1111/j.1600-065X.2009.00798.x. [DOI] [PubMed] [Google Scholar]
- 34.Johannes L, Jacob R, Leffler H. Galectins at a glance. J Cell Sci. 2018;131(9). doi: 10.1242/jcs.208884. [DOI] [PubMed] [Google Scholar]
- 35.Liu FT, Rabinovich GA. Galectins as modulators of tumour progression. Nat Rev Cancer. 2005;5(1):29–41. doi: 10.1038/nrc1527. [DOI] [PubMed] [Google Scholar]
- 36.MacKinnon AC, Farnworth SL, Hodkinson PS, Henderson NC, Atkinson KM, Leffler H, Nilsson UJ, Haslett C, Forbes SJ, Sethi T. Regulation of alternative macrophage activation by galectin-3. J Immunol. 2008;180(4):2650–2658. doi: 10.4049/jimmunol.180.4.2650. [DOI] [PubMed] [Google Scholar]
- 37.Voss J, Ford CA, Petrova S, Melville L, Paterson M, Pound JD, Holland P, Giotti B, Freeman TC, Gregory CD. Modulation of macrophage antitumor potential by apoptotic lymphoma cells. Cell Death Differ. 2017;24(6):971–983. doi: 10.1038/cdd.2016.132. [DOI] [PMC free article] [PubMed] [Google Scholar]
- 38.Chen IJ, Chen HL, Demetriou M. Lateral compartmentalization of T cell receptor versus CD45 by galectin-N-glycan binding and microfilaments coordinate basal and activation signaling. J Biol Chem. 2007;282(48):35361–35372. doi: 10.1074/jbc.M706923200. [DOI] [PubMed] [Google Scholar]
- 39.Demotte N, Stroobant V, Courtoy PJ, Van Der Smissen P, Colau D, Luescher IF, Hivroz C, Nicaise J, Squifflet JL, Mourad M, et al. Restoring the association of the T cell receptor with CD8 reverses anergy in human tumor-infiltrating lymphocytes. Immunity. 2008;28(3):414–424. doi: 10.1016/j.immuni.2008.01.011. [DOI] [PubMed] [Google Scholar]
- 40.Demotte N, Wieers G, Van Der Smissen P, Moser M, Schmidt C, Thielemans K, Squifflet JL, Weynand B, Carrasco J, Lurquin C, et al. A galectin-3 ligand corrects the impaired function of human CD4 and CD8 tumor-infiltrating lymphocytes and favors tumor rejection in mice. Cancer Res. 2010;70(19):7476–7488. doi: 10.1158/0008-5472.CAN-10-0761. [DOI] [PubMed] [Google Scholar]
- 41.Kouo T, Huang L, Pucsek AB, Cao M, Solt S, Armstrong T, Jaffee E. Galectin-3 shapes antitumor immune responses by suppressing CD8+ T cells via LAG-3 and inhibiting expansion of plasmacytoid dendritic cells. Cancer Immunol Res. 2015;3(4):412–423. doi: 10.1158/2326-6066.CIR-14-0150. [DOI] [PMC free article] [PubMed] [Google Scholar]
- 42.Petit AE, Demotte N, Scheid B, Wildmann C, Bigirimana R, Gordon-Alonso M, Carrasco J, Valitutti S, Godelaine D, van der Bruggen P. A major secretory defect of tumour-infiltrating T lymphocytes due to galectin impairing LFA-1-mediated synapse completion. Nat Commun. 2016;7:12242. doi: 10.1038/ncomms12242. [DOI] [PMC free article] [PubMed] [Google Scholar]
- 43.Wang W, Guo H, Geng J, Zheng X, Wei H, Sun R, Tian Z. Tumor-released Galectin-3, a soluble inhibitory ligand of human NKp30, plays an important role in tumor escape from NK cell attack. J Biol Chem. 2014;289(48):33311–33319. doi: 10.1074/jbc.M114.603464. [DOI] [PMC free article] [PubMed] [Google Scholar]
- 44.Cheng S, Li Z, Gao R, Xing B, Gao Y, Yang Y, Qin S, Zhang L, Ouyang H, Du P, et al. A pan-cancer single-cell transcriptional atlas of tumor infiltrating myeloid cells. Cell. 2021;184(3):792–809 e23. doi: 10.1016/j.cell.2021.01.010. [DOI] [PubMed] [Google Scholar]
- 45.Hildreth AD, Ma F, Wong YY, Sun R, Pellegrini M, O’Sullivan TE. Single-cell sequencing of human white adipose tissue identifies new cell states in health and obesity. Nat Immunol. 2021;22(5):639–653. doi: 10.1038/s41590-021-00922-4. [DOI] [PMC free article] [PubMed] [Google Scholar]
- 46.Qian J, Olbrecht S, Boeckx B, Vos H, Laoui D, Etlioglu E, Wauters E, Pomella V, Verbandt S, Busschaert P, et al. A pan-cancer blueprint of the heterogeneous tumor microenvironment revealed by single-cell profiling. Cell Res. 2020;30(9):745–762. doi: 10.1038/s41422-020-0355-0. [DOI] [PMC free article] [PubMed] [Google Scholar]
- 47.Sun Y, Wu L, Zhong Y, Zhou K, Hou Y, Wang Z, Zhang Z, Xie J, Wang C, Chen D, et al. Single-cell landscape of the ecosystem in early-relapse hepatocellular carcinoma. Cell. 2021;184(2):404–421 e16. doi: 10.1016/j.cell.2020.11.041. [DOI] [PubMed] [Google Scholar]
- 48.Liu F, Liu W, Zhou S, Yang C, Tian M, Jia G, Wang H, Zhu B, Feng M, Lu Y, et al. Identification of FABP5 as an immunometabolic marker in human hepatocellular carcinoma. J Immunother Cancer. 2020;8(2):e000501. doi: 10.1136/jitc-2019-000501. [DOI] [PMC free article] [PubMed] [Google Scholar]
- 49.Nieman KM, Kenny HA, Penicka CV, Ladanyi A, Buell-Gutbrod R, Zillhardt MR, Romero IL, Carey MS, Mills GB, Hotamisligil GS, et al. Adipocytes promote ovarian cancer metastasis and provide energy for rapid tumor growth. Nat Med. 2011;17(11):1498–1503. doi: 10.1038/nm.2492. [DOI] [PMC free article] [PubMed] [Google Scholar]
- 50.Wu Q, Li J, Li Z, Sun S, Zhu S, Wang L, Wu J, Yuan J, Zhang Y, Sun S, et al. Exosomes from the tumour-adipocyte interplay stimulate beige/brown differentiation and reprogram metabolism in stromal adipocytes to promote tumour progression. J Exp Clin Cancer Res. 2019;38(1):223. doi: 10.1186/s13046-019-1210-3. [DOI] [PMC free article] [PubMed] [Google Scholar] [Retracted]
- 51.Fang Y, Shen ZY, Zhan YZ, Feng XC, Chen KL, Li YS, Deng HJ, Pan SM, Wu DH, Ding Y. CD36 inhibits β-catenin/c-myc-mediated glycolysis through ubiquitination of GPC4 to repress colorectal tumorigenesis. Nat Commun. 2019;10(1):3981. doi: 10.1038/s41467-019-11662-3. [DOI] [PMC free article] [PubMed] [Google Scholar]
- 52.Zeng J, Sauter ER, Li B. FABP4: a new player in obesity-associated breast cancer. Trends Mol Med. 2020;26(5):437–440. doi: 10.1016/j.molmed.2020.03.004. [DOI] [PMC free article] [PubMed] [Google Scholar]
- 53.Wu Q, Sun S, Li Z, Yang Q, Li B, Zhu S, Wang L, Wu J, Yuan J, Yang C, et al. Tumour-originated exosomal miR-155 triggers cancer-associated cachexia to promote tumour progression. Mol Cancer. 2018;17(1):155. doi: 10.1186/s12943-018-0899-5. [DOI] [PMC free article] [PubMed] [Google Scholar] [Retracted]
- 54.Wu Q, Sun S, Li Z, Yang Q, Li B, Zhu S, Wang L, Wu J, Yuan J, Wang C, et al. Breast cancer-released exosomes trigger cancer-associated cachexia to promote tumor progression. Adipocyte. 2019;8(1):31–45. doi: 10.1080/21623945.2018.1551688. [DOI] [PMC free article] [PubMed] [Google Scholar] [Retracted]
- 55.Wu Q, Li B, Li J, Sun S, Yuan J, Sun S. Cancer-associated adipocytes as immunomodulators in cancer. Biomarker Res. 2021;9(1):2. doi: 10.1186/s40364-020-00257-6. [DOI] [PMC free article] [PubMed] [Google Scholar]
- 56.Jin R, Hao J, Yi Y, Yin D, Hua Y, Li X, Bao H, Han X, Egilmez NK, Sauter ER , et al. Dietary fats high in linoleic acids impair anti-tumor T cell responses by inducing E-FABP-mediated mitochondrial dysfunction. Cancer Res. 2021;81(20):5296–5310. [DOI] [PMC free article] [PubMed] [Google Scholar]
- 57.Zilionis R, Engblom C, Pfirschke C, Savova V, Zemmour D, Saatcioglu HD, Krishnan I, Maroni G, Meyerovitz CV, Kerwin CM, et al. Single-cell transcriptomics of human and mouse lung cancers reveals conserved myeloid populations across individuals and species. Immunity. 2019;50(5):1317–1334.e10. doi: 10.1016/j.immuni.2019.03.009. [DOI] [PMC free article] [PubMed] [Google Scholar]
- 58.Murray PJ, Allen JE, Biswas SK, Fisher EA, Gilroy DW, Goerdt S, Gordon S, Hamilton JA, Ivashkiv LB, Lawrence T, et al. Macrophage activation and polarization: nomenclature and experimental guidelines. Immunity. 2014;41:14–20. [DOI] [PMC free article] [PubMed] [Google Scholar]
- 59.Sonneveld S, Verhagen BMP, Tanenbaum ME. Heterogeneity in mRNA Translation. Trends Cell Biol. 2020;30(8):606–618. doi: 10.1016/j.tcb.2020.04.008. [DOI] [PubMed] [Google Scholar]
- 60.Huang YK, Wang M, Sun Y, Di Costanzo N, Mitchell C, Achuthan A, Hamilton JA, Busuttil RA, Boussioutas A. Macrophage spatial heterogeneity in gastric cancer defined by multiplex immunohistochemistry. Nat Commun. 2019;10(1):3928. doi: 10.1038/s41467-019-11788-4. [DOI] [PMC free article] [PubMed] [Google Scholar]
- 61.Hao J, Yan F, Zhang Y, Triplett A, Zhang Y, Schultz DA, Sun Y, Zeng J, Silverstein KAT, Zheng Q, et al. Expression of adipocyte/macrophage fatty acid-binding protein in tumor-associated macrophages promotes breast cancer progression. Cancer Res. 2018;78(9):2343–2355. doi: 10.1158/0008-5472.CAN-17-2465. [DOI] [PMC free article] [PubMed] [Google Scholar]
- 62.Katzenelenbogen Y, Sheban F, Yalin A, Yofe I, Svetlichnyy D, Jaitin DA, Bornstein C, Moshe A, Keren-Shaul H, Cohen M, et al. Coupled scRNA-seq and intracellular protein activity reveal an immunosuppressive role of TREM2 in cancer. Cell. 2020;182(4):872–885.e19. doi: 10.1016/j.cell.2020.06.032. [DOI] [PubMed] [Google Scholar]
- 63.Molgora M, Esaulova E, Vermi W, Hou J, Chen Y, Luo J, Brioschi S, Bugatti M, Omodei AS, Ricci B, et al. TREM2 modulation remodels the tumor myeloid landscape enhancing Anti-PD-1 immunotherapy. Cell. 2020;182(4):886–900.e17. doi: 10.1016/j.cell.2020.07.013. [DOI] [PMC free article] [PubMed] [Google Scholar]
- 64.Binnewies M, Pollack JL, Rudolph J, Dash S, Abushawish M, Lee T, Jahchan NS, Canaday P, Lu E, Norng M, et al. Targeting TREM2 on tumor-associated macrophages enhances immunotherapy. Cell Rep. 2021;37(3):109844. doi: 10.1016/j.celrep.2021.109844. [DOI] [PubMed] [Google Scholar]
- 65.Vuong L, Kouverianou E, Rooney CM, McHugh BJ, Howie SEM, Gregory CD, Forbes SJ, Henderson NC, Zetterberg FR, Nilsson UJ, et al. An orally active galectin-3 antagonist inhibits lung adenocarcinoma growth and augments response to PD-L1 blockade. Cancer Res. 2019;79(7):1480–1492. doi: 10.1158/0008-5472.CAN-18-2244. [DOI] [PubMed] [Google Scholar]
Associated Data
This section collects any data citations, data availability statements, or supplementary materials included in this article.
Supplementary Materials
Data Availability Statement
Single-cell transcriptome files of 32 primary breast cancer patients containing myeloid cells were obtained from the Gene Expression Omnibus (GEO: GSE161529). Normalized METABRIC expression matrices and survival information were downloaded from METABRIC (https://www.cbioportal.org/study/summary?id=brca_ metabric). Spatial transcriptomics data for the patient (CID4535) in this study was available from the Zenodo data repository (https://doi.org/10.5281/zenodo.4739739).