

Abstract
Objective
There is a need for a systematic method to implement the World Health Organization’s Clinical Progression Scale (WHO-CPS), an ordinal clinical severity score for coronavirus disease 2019 patients, to electronic health record (EHR) data. We discuss our process of developing guiding principles mapping EHR data to WHO-CPS scores across multiple institutions.
Materials and Methods
Using WHO-CPS as a guideline, we developed the technical blueprint to map EHR data to ordinal clinical severity scores. We applied our approach to data from 2 medical centers.
Results
Our method was able to classify clinical severity for 100% of patient days for 2756 patient encounters across 2 institutions.
Discussion
Implementing new clinical scales can be challenging; strong understanding of health system data architecture was integral to meet the clinical intentions of the WHO-CPS.
Conclusion
We describe a detailed blueprint for how to apply the WHO-CPS scale to patient data from the EHR.
Keywords: public health informatics, medical informatics, electronic health records, World Health Organization, COVID-19
BACKGROUND AND SIGNIFICANCE
The 2019 novel coronavirus disease (COVID-19) pandemic prompted health organizations to develop best practices to facilitate rapid, but scientifically rigorous clinical research.1,2 In August 2020, the World Health Organization (WHO) Research and Development Blueprint initiative’s Clinical Characterisation and Management Working Group, with several other organizations, introduced the WHO Clinical Progression Scale (WHO-CPS) to study COVID-19’s burden on a health system.3 For hospitalized patients with COVID-19, the WHO-CPS scores progress from 4 to 10 with increasing severity. Scores of 4, 7, and 10 denote no oxygen support, invasive (IV) ventilation required, and death, respectively. By implementing this scale, health systems may transparently and reproducibly track a patient’s clinical trajectory based on respiratory disease progression and end-organ dysfunction.
Researchers at 2 tertiary-care academic centers, University of California, San Francisco (UCSF) and University of Texas Southwestern Medical Center (UTSW), aimed to use the WHO-CPS to study the clinical progression of COVID-19 and associated hospital burden. Examples of study questions included: How do social determinants of health affect in-hospital COVID-19 outcomes? and How can we create prediction models for allocating hospital resources? While both institutions had similarly structured electronic health record (EHR) data, there were areas of ambiguity in how to apply WHO-CPS scores to real-life data. It was essential to standardize data collection definitions and WHO-CPS scoring rules for performing analyses that generalize across multiple health systems.4 While blueprints exist to analyze COVID-19 data with Systematized Nomenclature of Medicine–Clinical Terms and Logical Observation Identifiers Names and Codes,5 no guidelines exist to assign WHO-CPS based on EHR data.
We present our blueprint of assigning WHO-CPS scores to real data. Our blueprint components include:
EHR elements required to implement WHO-CPS scoring,
Categorization of respiratory support devices, and
Pseudocode to implement the maximum WHO-CPS score per hospital day.
Since data collection may differ across EHRs, it is important to share a transparent process for developing and validating cross-institutional measures. We hope our WHO-CPS blueprint can serve as a useful baseline for others to study their health system’s COVID-19 burden.
MATERIALS AND METHODS
Data retrieval alignment
In January 2021, UCSF and UTSW researchers began the process of implementing the WHO-CPS as a measure to standardize and compare clinical progression and hospital burden across both sites. Each institution’s Independent Review Boards approved the research and data-use agreements were established.
Microsoft SQL Server was used to query data from similarly structured tables within each institution’s Epic Clarity data warehouse. Figure 1 shows the generalized star schema of queried data elements, each with appropriate date and timestamps, linked by a deidentified and unique SQL-generated patient-encounter ID. This data query created our COVID-19 patient encounter report (C19-Report). See Supplementary Material for data normalization details.
Figure 1.

Star schema for COVID-19 patient encounter report. *Comorbidity data collected were the ICD-10 codes linked to a patient's medical history at the time of admission. **Other social/demographic data includes zip code, insurance type, smoking status, marital status, and language.
Database development
Data and column definitions
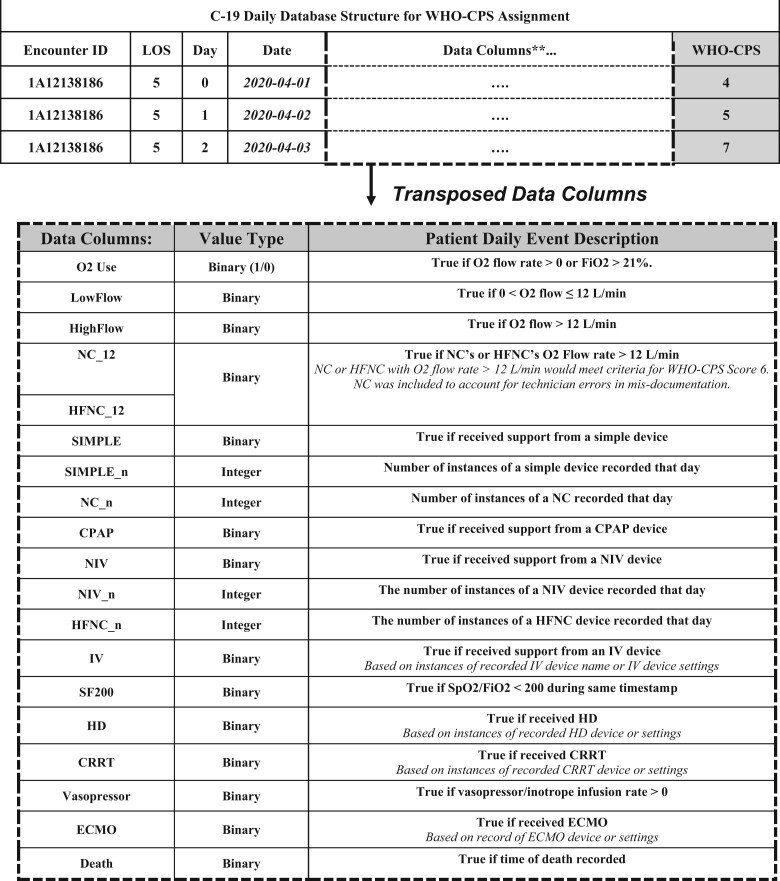
Each row of C19-Daily, a clinical and resource utilization database built using Python (version 3.8.1), was designed to summarize each hospital day (defined after midnight) per patient encounter. Table 1 defines the data columns of the C19-Daily. The WHO-CPS scoring logic utilizes the data column values to assign a per day (row) score.
Table 1.
COVID-19 Daily database structure for WHO-CPS assignment
|
Note: Daily WHO-CPS scores are assigned based on derived data columns, based on definitions applied to EHR data.
**Transposed data columns shown.
LOS: length of stay; WHO-CPS: World Health Organization’s Clinical Progression Scale.
O2: oxygen; FiO2: fraction of inspired oxygen; L/min: liters/minute, NC: nasal cannula; HFNC: high-flow nasal cannula; WHO-CPS: World Health Organization Clinical Progression Scale; CPAP: continuous positive airway pressure; NIV: noninvasive ventilation; IV: invasive ventilation; SpO2: oxygen saturation; HD: hemodialysis; CRRT: continuous renal replacement therapy; ECMO: extracorporeal membrane oxygenation.
Logic criteria
Defining the C19-Daily’s specific column categories was nontrivial, given the need to map categorized EHR data to clinically meaningful classifications for WHO-CPS scoring. Given the variety of oxygen support devices, for example, which ones should be categorized as simple versus noninvasive/high-flow (NIV)? Should we separate intermittent hemodialysis (HD) for chronic end-stage renal disease from continuous renal replacement therapy (CRRT) for acute kidney injury? These types of decisions impact how clinical severity scores are assigned. Consensus definition and categorization decisions were developed during weekly meetings and through expert consultations with specialty-trained physicians, clinical informaticians, and public health experts. Based on the complexities of how EHR data were recorded and the nuances of worsening end-organ dysfunction, we relied on 3 guiding principles to assist with clinical interpretation:
Principle 1: A higher WHO-CPS score should coincide with evidence of worsening clinical status (either worsening of a single organ or presence of multiple organ damage).
Principle 2: Multiple consistent observations (eg, oxygen (O2) flow >12 L/min and high-flow nasal cannula [HFNC]) should be used to define a score transition to mitigate user entry errors.
Principle 3: Chronic device usage (eg, dialysis in pre-existing renal disease) should not affect clinical severity score.
Consensus guidelines for scoring clinical severity based on EHR data
Categorization of respiratory support
WHO-CPS scores 4 through 7 were determined by the level of respiratory support a patient required: “none,” “simple,” “NIV,” or “IV.” For many oxygen devices present in our data set, it was not immediately obvious which respiratory support category was the most correct based on prior literature. Based on group consensus, Table 2 summarizes the categories of respiratory devices. For example, differentiating our device classifications between simple and NIV were based on both the patterns of how respiratory care was escalated at each institution and the additional resources required (eg, nursing staff, monitoring equipment, or respiratory therapist).
Table 2.
Respiratory support categorization and vasopressors/inotropes utilized for WHO-CPS score classification
| Respiratory support categorization | |||
|---|---|---|---|
| None | Simple | Noninvasive ventilation (NIV) | Invasive (IV) |
|
|
|
|
| |||
| Vasopressors/inotropes | |||
| Dobutamine | Milrinone | ||
| Dopamine | Norepinephrine | ||
| Ephedrine | Phenylephrine | ||
| Epinephrine | Vasopressin | ||
WHO-CPS: World Health Organization’s Clinical Progression Scale.
If no comment/free text left (data missing), categorized as None.
These are flow-dependent. Flows ≤12 L/min were classified as Simple, while flows ≥12 L/min classified as NIV/HF.
Calculation of SpO2/FiO2
To distinguish between WHO-CPS scores 7, 8, and 9, it was necessary to calculate whether SpO2/FiO2 ratios were greater than or equal to 200. Given continuous monitoring for ventilated patients in our hospitals, there existed a plethora of concurrent FiO2 and SpO2 measurements pulled automatically into the EHR.
Categorization of vasopressors
Regardless of respiratory support, the infusion of pressors, a sign of end-organ dysfunction, immediately elevates a patient to a WHO-CPS score of 8. This decision point also aligned with our resource utilization and clinical workflow, as patients receiving continuous pressors require intensive care. Similarly, we expanded the interpretation of vasopressor to include inotropes. Patients were classified as being on vasopressors each day if they received an infusion rate of the listed vasopressors/inotropes shown in Table 2. If no flow rates were recorded for 3 continuous hours, they were assumed to be discontinued (since documentation is required hourly). Vasopressor push doses were excluded, as these may be administered on nonintensive care areas as a temporizing measure. Last resort pressors,6,7 like methylene blue or angiotensin II, were also excluded because they are sometimes used for conditions other than shock.
Classification of end-stage renal disease and dialysis
We excluded intermittent HD while assigning the WHO-CPS. First, distinguishing end-stage renal disease with chronic intermittent HD versus new intermittent HD is nontrivial. Second, CRRT requires intensive-care resources staff, while intermittent HD is available in nonintensive care settings at our hospitals.
Missing data
At both institutions, vital signs and device data were recorded every 4 h, at minimum, and more frequently in higher acuity settings. Fortunately, our goal was to implement a daily, not hourly, WHO-CPS score. Nevertheless, we handled the relevant instances of missing data as follows:
No device and O2 flow recorded is interpreted as no oxygen delivered to the patient.
If only a single instance of a device was recorded without recorded oxygen flow rate or device settings (eg, BIPAP) that day, then it was deemed a fluke recording. This instance was interpreted as no oxygen delivered to the patient.
When multiple instances of invasive ventilator settings were recorded in the absence of a recorded device, a minimum WHO-CPS score of 7 was assigned (eg, occurred during prolonged intubation).
Daily WHO-CPS assignment
Given the amount of disease progression a patient can experience even within a single day, we decided to assign the maximum WHO-CPS score reached per day. We felt this approach represented the best proxy for hospital-resource use. Figure 2 shows the WHO-CPS staging algorithm pseudocode, which is applied to the C19-Daily.
Figure 2.

Pseudocode for assigning a maximum WHO-CPS score per hospital day for each patient encounter, based on C19-Daily data columns. WHO-CPS: World Health Organization’s Clinical Progression Scale.
RESULTS
From March 1, 2020 to February 9, 2021, UCSF had 918 patient encounters spanning 13 386 patient days, while UTSW had 1838 patient encounters spanning 19 049 patient days, respectively. We were able to assign the WHO-CPS to 100% of inpatient days. Figure 3 showcases the WHO-CPS score trends at UCSF and UTSW medical centers.
Figure 3.
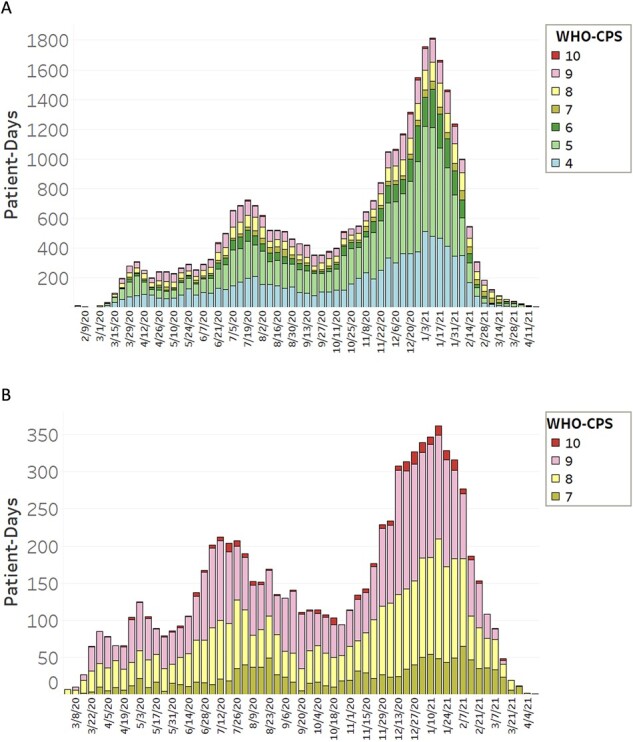
Patient-days per week at each WHO-CPS scale on aggregate UTSW and UCSF. Total number of patient days at each WHO-CPS stage per week across aggregate UCSF and UTSW are shown. From February 3, 2020 to April 22, 2021, there were 32 435 patient days spanning 2756 patient hospital admissions. (a) Shows WHO-CPS scores 4–10 while (b) shows only WHO-CPS scores 7–10, capturing severe disease (ICU level care) and death. UCSF: University of California, San Francisco; UTSW: University of Texas Southwestern Medical Center; WHO-CPS: World Health Organization’s Clinical Progression Scale.
DISCUSSION
We have developed a blueprint for reproducible, transparent assignment of clinical severity for each patient-day of a hospitalized COVID patient. While EHR variation may certainly be a limitation, we believe others can utilize our blueprint to implement a comparable assignment of WHO-CPS scores if similarly structured data are recorded. There are some challenges to our blueprint’s generalizability. We were fortunate to have reliable, automatically captured data in our EHRs with the same timestamps to calculate SpO2/FiO2. However, at other institutions a delay may exist between timestamps. Additionally, not all EHRs will lead to an as detailed C-19 Report, unrecorded or missing data may require institutions to modify the C19-Daily column definitions.
Since COVID-19 primarily affects the respiratory system,8 much consideration went into classifying respiratory devices, especially since no consensus exists. For example, a transtracheal catheter (TTC) can be classified as IV (enters a tracheostomy site), NIV, or simple (flow rates are generally between 6 and 11 L/min). Based on clinical experience and following Guiding Principle 1’ we classified TTC as NIV because it was more invasive than a simple face mask over the tracheostomy site but not as intensive as mechanical ventilation through tracheostomy. Similarly, a nonrebreather (NRB) was classified under NIV; while technically a low-flow device, in practice, it represents an escalation of respiratory care from a simple face mask. Our comprehensive list of respiratory support devices and their respective categorizations may be applicable to research beyond COVID-19 care.
Prior work has underscored the importance of using EHR data for COVID-19 research, especially highlighting the need for data interoperability.9 However, implementing clinical scales developed by leading organizations like the WHO in a reproducible manner can be challenging, especially across multiple sites. Our WHO-CPS blueprint is designed to maximize generalizability of results from multi-institutional studies and strengthen the statistical significance of differences observed between sites.10 Our algorithm intentionally assigns a score for each day based on our best understanding of respiratory status for a patient. This does not mean we do not have missing data in EHR documentation, but rather we have a method of adapting for it. Despite possible gaps in clinical data, we can reproducibly and transparently assign a WHO-CPS score each day. Clinical informaticians were essential in faithfully translating the local data architectures and definitions to match the clinical intentions of the original health scale, thus promoting robust data interoperability across different sites. A clinical informatician can not only understand, articulate, and champion the clinical significance of such scores but also ensure robust semantic interoperability of data to faithfully implement such scores locally or across institutions.11
CONCLUSION
Implementing clinical risk scores is challenging, as a series of important yet often undocumented decisions must be made due to the ambiguity of individual EHR data elements. We developed a detailed blueprint outlining how the WHO-CPS can be applied to EHR data. The development of national or international clinical scoring systems may benefit from the input of a clinical informatician to marry medical interpretation and technical data definitions. This approach would help assure data quality, consistency and mitigate varying institution-specific interpretations. While WHO-CPS scoring has areas of nuanced interpretation, we highlight how institutions can create a C19-Daily database to implement the WHO-CPS scoring in a reproducible, standardized, and transparent manner. In the future, we hope to utilize the WHO-CPS to study how patient severity changes over time and eventually develop severity prediction models. We hope our methods may be helpful to others who wish to implement WHO-CPS scoring quickly and efficiently.
FUNDING
Centers for Disease Control and Prevention Grant 1U01CK000590 (for all authors) and National Institutes of Health K12 EY031372 (for SB).
AUTHOR CONTRIBUTIONS
PR contributed to the conception, design, data analysis and interpretation, drafted, and critically revised the article. JG contributed to the conception, design, data analysis and interpretation, and critically revised the article. SS contributed to the conception, design, data acquisition, data analysis and interpretation, and critically revised the article. SMD contributed to the conception, design, data interpretation, and critically revised the article. SB contributed to the conception, design, data interpretation, and revised the article. RM contributed to the conception, design, data interpretation, and critically revised the article. XL contributed to the conception, design, data acquisition and interpretation, and critically revised the article.
SUPPLEMENTARY MATERIAL
Supplementary material is available at Journal of the American Medical Informatics Association online.
CONFLICT OF INTERESTS STATEMENT
None declared.
DATA AVAILABILITY
Data cannot be shared publicly to protect the privacy of patients. The derived data may be shared on reasonable request to the corresponding author.
Supplementary Material
Contributor Information
Priya Ramaswamy, Division of Hospital Medicine, Department of Medicine, University of California, San Francisco, San Francisco, California, USA; Department of Anesthesia and Perioperative Care, University of California, San Francisco, San Francisco, California, USA.
Jen J Gong, Center of Clinical Informatics and Improvement Research, Department of Medicine, University of California, San Francisco, San Francisco, California, USA.
Sameh N Saleh, Clinical Informatics Center, University of Texas Southwestern Medical Center, Dallas, Texas, USA; Section of Hospital Medicine, Division of General Internal Medicine, University of Pennsylvania Health System, Philadelphia, Pennsylvania, USA; Department of Biomedical & Health Informatics, Children’s Hospital of Philadelphia, Philadelphia, Pennsylvania, USA.
Samuel A McDonald, Clinical Informatics Center, University of Texas Southwestern Medical Center, Dallas, Texas, USA; Department of Emergency Medicine, University of Texas Southwestern Medical Center, Clinical Informatics Center, Dallas, Texas, USA.
Seth Blumberg, Francis I. Proctor Foundation, University of California San Francisco, San Francisco, California, USA; Centers of Disease Control’s Modeling infectious Diseases (MInD) Healthcare Program, USA; Department of Medicine, University of California San Francisco, San Francisco, California, USA.
Richard J Medford, Clinical Informatics Center, University of Texas Southwestern Medical Center, Dallas, Texas, USA; Department of Internal Medicine, Division of Infectious Diseases and Geographic Medicine, University of Texas Southwestern Medical Center, Clinical Informatics Center, Dallas, Texas, USA.
Xinran Liu, Division of Hospital Medicine, Department of Medicine, University of California, San Francisco, San Francisco, California, USA.
REFERENCES
- 1. Lacasa L, Challen R, Brooks-Pollock E, Danon L. Correction: a flexible method for optimising sharing of healthcare resources and demand in the context of the COVID-19 pandemic. PLoS One 2021; 16 (4): e0251222. [DOI] [PMC free article] [PubMed] [Google Scholar]
- 2. Moorthy V, Henao Restrepo AM, Preziosi M-P, Swaminathan S. Data sharing for novel coronavirus (COVID-19). Bull World Health Organ 2020; 98 (3): 150. [DOI] [PMC free article] [PubMed] [Google Scholar]
- 3. Marshall JC, Murthy S, Diaz J, et al. A minimal common outcome measure set for COVID-19 clinical research. Lancet Infect Dis 2020; 20 (8): e192–7. [DOI] [PMC free article] [PubMed] [Google Scholar]
- 4. Jauregui B, Hudson LD, Becnel LB, et al. The turning point for clinical research: global data standardization. J Appl Clin Trials 2019. https://www.researchgate.net/profile/Barbara-Jauregui/publication/331816025_The_Turning_Point_for_Clinical_Research_Global_Data_Standardization/links/5cbdc104299bf1209777777b/The-Turning-Point-for-Clinical-Research-Global-Data-Standardization.pdf. [Google Scholar]
- 5. Pedrera-Jiménez M, García-Barrio N, Cruz-Rojo J, et al. Obtaining EHR-derived datasets for COVID-19 research within a short time: a flexible methodology based on Detailed Clinical Models. J Biomed Inform 2021; 115: 103697. [DOI] [PMC free article] [PubMed] [Google Scholar]
- 6. Porizka M, Kopecky P, Dvorakova H, et al. Methylene blue administration in patients with refractory distributive shock – a retrospective study. Sci Rep 2020; 10 (1): 1–8. [DOI] [PMC free article] [PubMed] [Google Scholar]
- 7. Wong A, Alkazemi A, Eche IM, Petri CR, Sarge T, Cocchi MN. A retrospective review of angiotensin II use in adult patients with refractory distributive shock. J Intensive Care Med 2020; 35 (12): 1490–6. [DOI] [PubMed] [Google Scholar]
- 8. Brosnahan SB, Jonkman AH, Kugler MC, Munger JS, Kaufman DA. COVID-19 and respiratory system disorders: current knowledge, future clinical and translational research questions. Arterioscler Thromb Vasc Biol 2020; 40 (11): 2586–97. [DOI] [PMC free article] [PubMed] [Google Scholar]
- 9. Dagliati A, Malovini A, Tibollo V, Bellazzi R. Health informatics and EHR to support clinical research in the COVID-19 pandemic: an overview. Brief Bioinform 2021; 22 (2): 812–22. [DOI] [PMC free article] [PubMed] [Google Scholar]
- 10. Stupple A, Singerman D, Celi LA. The reproducibility crisis in the age of digital medicine. NPJ Digit Med 2019; 2 (2): 19. [DOI] [PMC free article] [PubMed] [Google Scholar]
- 11. Tong A, Baumgart A, Evangelidis N, et al. ; COVID-19-Core Outcomes Set Investigators. Core outcome measures for trials in people with coronavirus disease 2019: respiratory failure, multiorgan failure, shortness of breath, and recovery. Crit Care Med 2021; 49 (3): 503–16. [DOI] [PMC free article] [PubMed] [Google Scholar]
Associated Data
This section collects any data citations, data availability statements, or supplementary materials included in this article.
Supplementary Materials
Data Availability Statement
Data cannot be shared publicly to protect the privacy of patients. The derived data may be shared on reasonable request to the corresponding author.