SUMMARY
Differentiation proceeds along a continuum of increasingly fate-restricted intermediates, referred to as canalization1,2. Canalization is essential for stabilizing cell fate, but mechanisms underlying robust canalization are unclear. Here we show that the BRG1/BRM-associated factor (BAF) chromatin remodeling complex ATPase gene Brm safeguards cell identity during directed cardiogenesis of mouse embryonic stem cells. Despite establishment of well-differentiated precardiac mesoderm, Brm−/− cells predominantly became neural precursors, violating germ layer assignment. Trajectory inference showed sudden acquisition of non-mesodermal identity in Brm−/− cells. Mechanistically, loss of Brm prevented de novo accessibility of primed cardiac enhancers while increasing expression of neurogenic factor POU3F1, preventing binding of neural suppressor REST, and shifting composition of BRG1 complexes. Brm mutant identity switch was overcome by increasing BMP4 levels during mesoderm induction. Mathematical modeling supports these observations and demonstrates that Brm deletion affects cell fate trajectory by modifying saddle-node bifurcations2. In the mouse embryo, Brm deletion exacerbated mesoderm-deleted Brg1 mutant phenotypes, severely compromising cardiogenesis, unmasking an in vivo role for Brm. Our results reveal Brm as a compensable safeguard of the fidelity of mesoderm chromatin states, and support a model in which developmental canalization is not a rigid irreversible path, but a highly plastic trajectory.
BRG1/BRM-associated factor (BAF) chromatin remodeling complexes contribute to many aspects of gene regulation. Two ATPases, Brahma (BRM/SMARCA2) and Brahma-related gene 1 (BRG1/SMARCA4) are present in a mutually exclusive manner. BRM is reported to be dispensable for mouse development3, but is implicated in human developmental syndromes4,5 and cancers6 and can compensate for the loss of BRG17–9. To determine a potential role for BRM in cardiogenesis, we deleted Brm in mouse embryonic stem cells (ESCs) and subjected them to directed cardiac differentiation (Fig. 1a and Extended data Fig. 1a–c). Three independent Brm−/− lines failed to generate beating cTnT+ cardiomyocytes; two heterozygous lines from the same set of clones were beating (Fig. 1b, c, Supplementary Videos. 1–6). RNA-seq showed that at D4, mesoderm gene expression was unaffected in Brm−/− cells, while D6 (cardiac precursor, CP) and D10 (cardiomyocyte, CM) gene expression was significantly altered (FDR<0.05, ±2-fold change) (Fig. 1d). At D6, cardiac TFs were not induced in Brm−/− cells (Isl1, Nkx2-5, Mef2c), whereas osteoblast- and neural-associated TFs were upregulated. At D10, when WT cells were beating cardiomyocyte stage, Brm−/− cells completely failed to activate cardiac genes and instead expressed genes associated with neural (e.g. Ascl1, Pax6, Neurod1) or other cell types (Extended Data Fig. 1d).
Fig. 1. BRM activates cardiac gene expression programs and prevents acquisition of neural fate during directed cardiomyocyte differentiation.
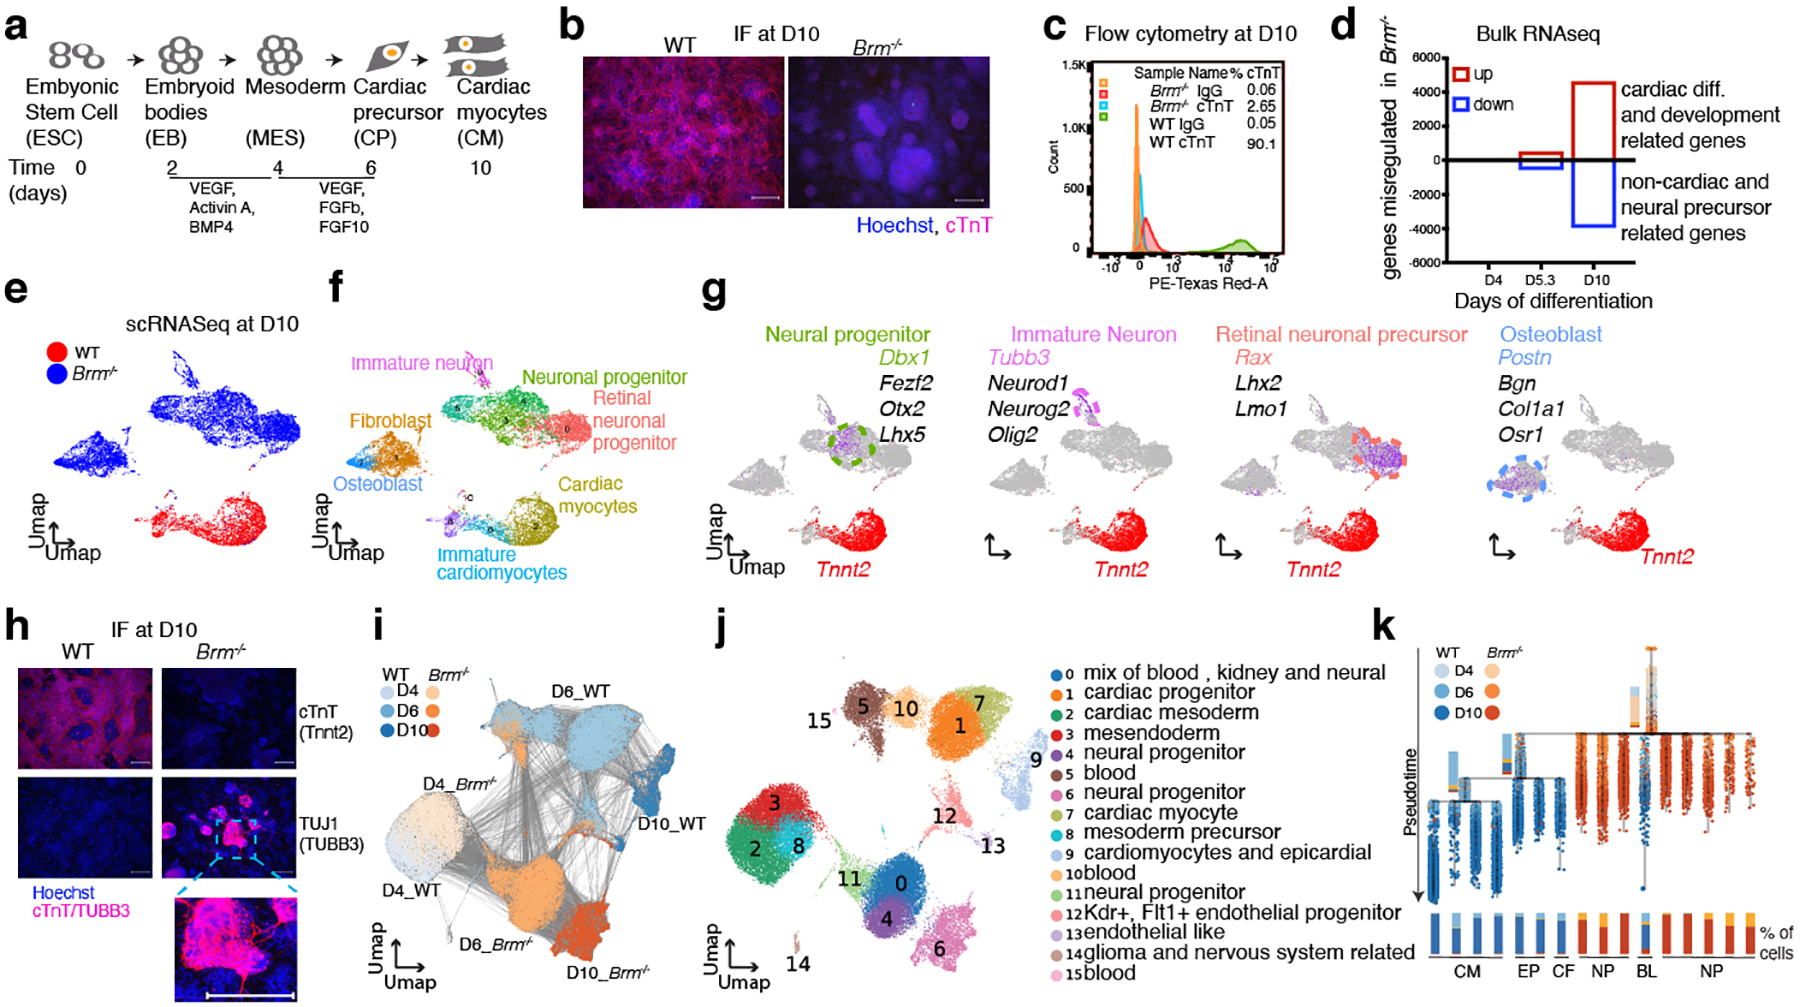
a-c, Cardiac differentiation scheme (a), assessment of cardiomyocytes at D10 of cardiac differentiation by immunofluorescence (b) and flow cytometry (c) of cardiac Troponin T (cTnT). d, Bulk RNA-seq data showing number of significantly de-regulated genes in BRM KO cells (FDR<0.05 and fold change > 2) at D4 (mesoderm), D5.3 (cardiac precursor) and D10 (cardiomyocyte) stages of differentiation. Single cell RNAseq gene expression projected on a UMAP space for WT and Brm−/− at D10 (e), inferred cell types (f) based on the marker genes highlighted (g). h, Immunofluorescence of cTnT and pan-neural progenitor marker TUBB3 (TUJ1) at D10. Scale bars are 200μm. i, Time course of scRNAseq data from D4, D6 and D10 projected on UMAP space showing days of differentiation of both WT and Brm−/− cells. Lines connecting cells are derived from a partition-based graph abstraction (PAGA) algorithm19 that reconciles clustering with cell lineage trajectory inference. j, PAGA clusters with inferred cell types. k, Transcriptional trajectory analysis from single cell data using URD20 showing stepwise transition of WT cells from D4 to D10, and sudden acquisition of neural fate in BRM KO cells. CM: cardiomyocyte, EP: epicardial, CF: cardiac fibroblast, NP: neural precursor, BL: blood cells.
BRM safeguards CP differentiation to CM
The drastic gene expression changes in Brm−/− cells upon cardiac differentiation suggested either 1) the formation of new non-cardiac populations, or 2) that a relatively homogeneous population activated normally mutually-exclusive expression modules. Single-cell RNA-seq on 21,916 WT and Brm−/− cells at D10 of differentiation showed that Brm−/− cells at D10 were radically distinct from their WT counterparts (Fig. 1e), lacked expression of cardiac genes, and clustered in sub-populations with signatures of neural stem cells (Sox2, Sox9, Ascl1), neural progenitors (Dcx, Otx2, Gap43, Tubb3), glia (Gfap, Olig2), Schwan cells (Gap43), and retinal precursors (Rax, Lhx2, Lmo1) (Fig. 1f, g, Extended Data Fig. 1e). We also identified a cluster of cells expressing markers of osteoblast development (Postn, Bgn, Col1a1), indicating that some Brm−/− cells adopt non-cardiac mesodermal fates. Immunofluorescence showed TUBB3+ staining in D10 Brm−/− cells, displaying neuron-like outgrowths (Fig. 1h). Notably, no other mesodermal or ectodermal derivatives, nor endodermal cell types, were observed, indicating a specific fate switch. Loss of BRM did not grossly affect directed neuronal precursor differentiation (Extended Data Fig. 1f).
BRM controls mesoderm to CP transition
Time courses of WT and Brm−/− differentiations by single cell RNA-seq confirmed that D4 (mesoderm) Brm−/− cells were statistically similar to WT cells (Fig 1i, j, Supplementary Table 1). In sharp contrast, most D6 WT cells expressed well-defined CP markers, whereas Brm−/− cells mostly expressed genes involved in neural lineages (Extended Data Fig. 2a, b). The few D6 WT and Brm−/− cells that clustered together expressed markers of hematopoietic lineages (Fig 1i, j, cluster 5, 12, 15; Supplementary Table 2). D10 WT and Brm−/− cells clustered in different UMAP spaces (Fig. 1i). This indicates a crucial early role of BRM immediately following cardiac mesoderm formation. Partition-Based Graph Abstraction10 revealed genotype-dependent connectivity (Extended Data Fig. 2c, d). Branching tree analysis (URD11) showed Brm−/− cells directly transitioning from mesoderm to non-cardiac neural lineages after D4 (Fig. 1k, Extended Data Fig. 2e).
At D4 Brm−/− cells do not express genes that would suggest extended pluripotency or neuromesodermal, or neuroectodermal precursors12,13 (Fig. 1i, Extended Data Fig. 2b, Supplementary Table 1). Pluripotency markers in WT and Brm null ESCs by immunofluorescence (Extended data Fig. 2f) and scRNAseq at D0 (Extended data Fig. 2g, h) were normally expressed (Supplementary Table 3). It is highly unlikely that a small non-mesodermal cell population could “jackpot” within a few cell cycles, although lineage tracing studies would definitively prove this.
BRG1, a paralog of BRM, has important roles in cardiogenesis14,15. We induced genetic Brg1 deletion at D2 (Brg1 cKO), (Extended Data Fig. 3a, b). Conditional Brg1 loss did not affect D4 transcription broadly but later formed few cardiac myocytes and instead formed endothelial cells, fibroblasts, neural progenitors, and developmentally-arrested progenitors (Extended Data Fig. 3c–f). Unlike Brm−/− cells, we did not observe TUBB3 staining in Brg1 cKO cells (Extended Data Fig. 3g). Integration of transcriptome data from Brg1 cKO and Brm−/− cells at D10 revealed their distinct gene expression patterns (Extended Data Fig. 3h).
BRM modulates dynamic chromatin accessibility
Using ATAC-seq16, Brm null cells had similar chromatin accessibility profiles at the ESC stage and at day 2 (Extended Data Fig. 4a). Although gene expression was minimally affected by Brm deletion at D4, we found reduced accessibility at 3320 chromatin regions in sites enriched for genes involved in cardiac and other developmental pathways (Fig. 2a). At D6 and D10, 8814 and 5391 regions were significantly changed (FDR<0.05, fold change >2), respectively (Fig 2b, c, Extended Data Fig. 4b, Supplementary Table 4) near regulatory elements of cardiac development genes. In contrast, D6 Brm−/− cells had newly or persistently open chromatin near genes involved in non-cardiac differentiation processes, including neural genes (Fig. 2b, Extended Data Fig. 4c). Altered chromatin accessibility was highly correlated with gene expression changes at D6 and D10 and modestly with D4 chromatin (Fig. 2d–g). In D6 and D10 Brm−/− cells, closed chromatin correlated with cardiac and open chromatin with neural progenitor enhancers (Extended Data Fig. 4d, e). Motifs enriched in significantly depleted regions in Brm−/− cells included those for cardiac-related transcription factors (GATA4, MEF2C, HAND2) while peaks newly opened were enriched for motifs for neuronal TFs (SOX2, OCT6/8 (POU3F1/3), OTX2, LHX2/3, RFX; Extended Data Fig. 4f). Thus, BRM primes and maintains open chromatin at cardiogenic genes, while contributing to the establishment or maintenance of the inaccessible chromatin in non-cardiac (including neural) enhancers.
Fig. 2. BRM modulates regulatory chromatin accessibility near cardiac and neural genes and modulates POU3F1 and REST to prevent neurogenesis during cardiac differentiation.
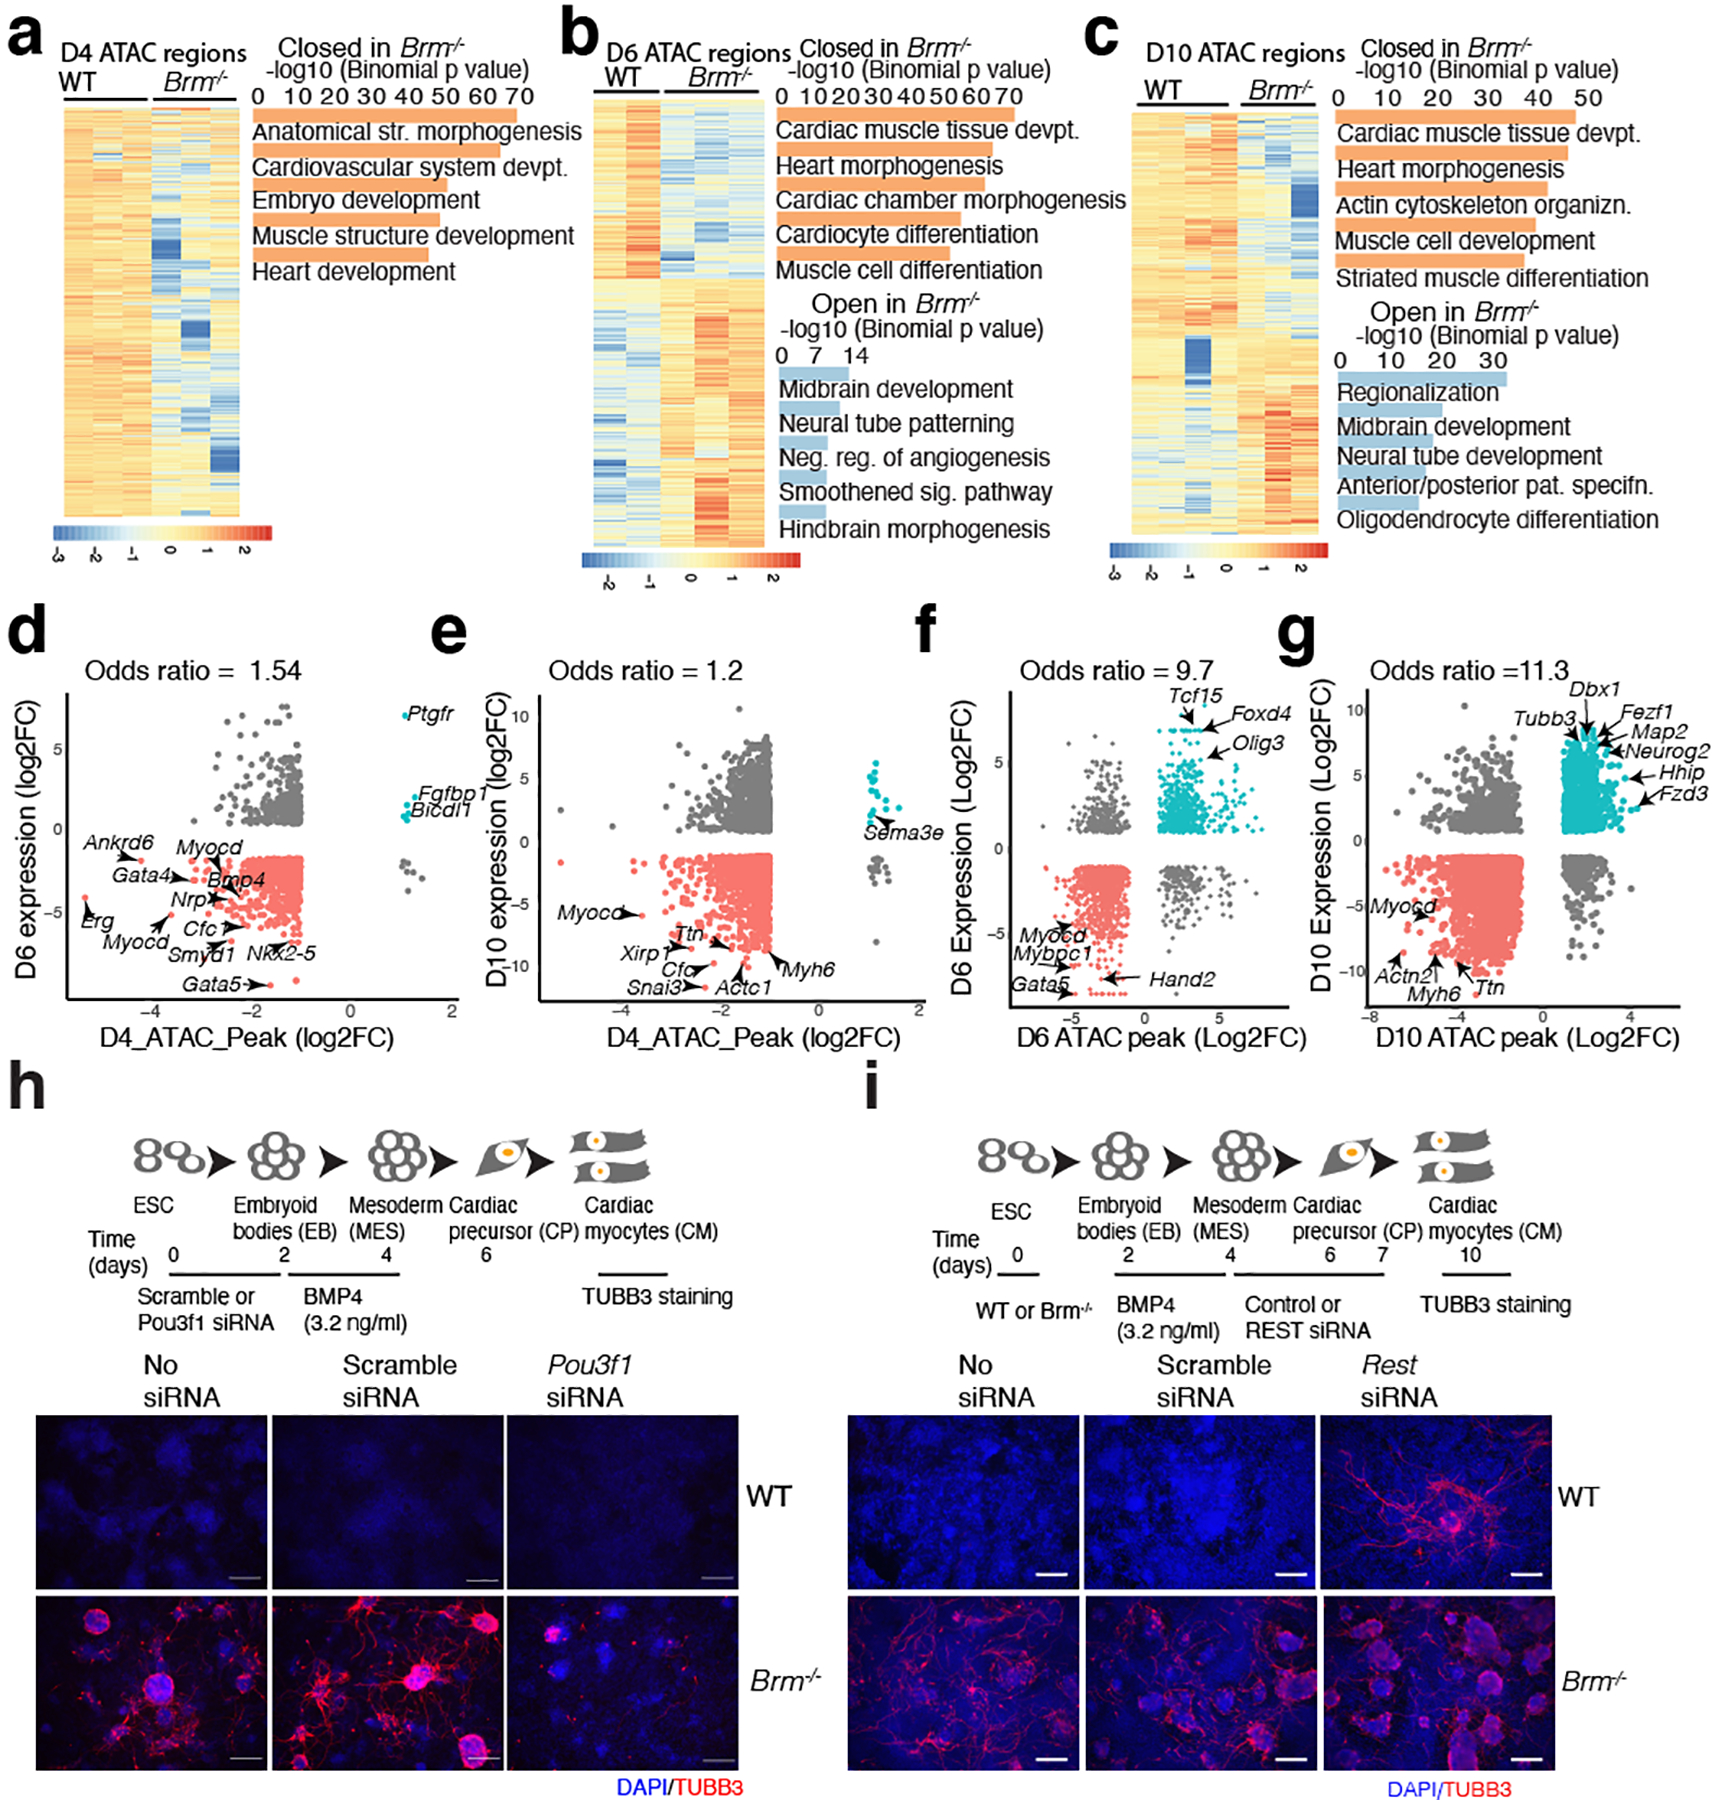
a-c, Heat maps of significantly altered ATAC-seq peaks in WT and BRM KO at D4 (a), D6 (b) and D10 (c). GREAT enrichment (two nearest genes within 100Kb) of significant (Benjamini-Hochberg adjusted p-value (FDR) <0.01) gene ontology (GO) biological processes shown on the right. d-g, ATAC-seq peak strengths are correlated with the neighboring BRM-regulated genes (within 100Kb, FDR<0.05, ±2 fold) for D4 ATAC peaks correlated with D6 (d) and D10 (e) and at respective ATAC peaks correlated with D6 (f) and D10 (g) gene expression. Scheme of Pou3f1 (h) or REST (i) knockdown during cardiac differentiation followed by TUBB3 immunostaining of control, scramble and knockdown cells at D10. Scale bars are 200μm.
Timing of BRM function
Using an auxin-inducible degron line, depletion of BRM prior to D4 and specifically during day 2–4, impaired differentiation, whereas subsequent depletion did not greatly affect cardiac differentiation (Extended Data Fig. 4g–i). This confirms the role of BRM after exit from pluripotency and during cardiac mesoderm formation, but before mesoderm to CP transition.
Epigenetic regulation of chromatin by BRM
BAF complex subunits have been implicated in the modulation of chromatin modifications17. Regions near cardiovascular genes gained repressive H3K27me3 marks in Brm−/− cells after d4, while PcG-repressed genes involved in early embryo development lost H3K27me3 marks (Extended Data Fig. 5a,b). Conversely, in D6 and D10 Brm−/− cells, there was reduced active H3K27ac marks at many sites near genes associated with cardiogenesis, and increased H3K27ac near genes involved in neurogenesis (Extended Data Fig. 5c,d,f,g). At D4, we identified sites with reduced H3K27ac in Brm−/− cells near cardiovascular development genes (Extended Data Fig. 5c, cluster b, Extended Data Fig. 5e,h). Despite absence of significant accessibility gains (Fig. 2b), 34% of sites gaining H3K27ac in D4 Brm−/− cells, were enriched for POU/OCT motifs (Extended Data Fig. 5c,d,h), suggesting potential involvement of these TFs in neural induction in Brm−/− cells.
Bulk RNAseq with a lower statistical cutoff (raw p<0.05) showed modestly increased Pou3f1 (Oct6) mRNA in Brm−/− D4 cells. POU3F1 promotes neural fate by activating neural lineage genes and inhibiting BMP4-dependent transcription18. POU3F1 protein was increased in D4 and D6 Brm−/− cells (Extended Data Fig. 5k), suggesting prolonged POU3F1 may initiate the neurogenic gene expression program. Indeed, knockdown of Pou3f1 in Brm−/− cells resulted in fewer TUBB3+ neuronal progenitor cells and absence of filamentous extensions (Fig. 2h).
BRM binds 110 genomic regions at D4, 521 regions at D6 and 1188 regions at D10 near genes involved in transcriptional regulation and muscle development (Extended Data Fig. 6a–e, Supplementary Table 5). Motif analysis revealed enrichment of REST motifs at all stages, along with cardiac TFs at D10 (Extended Data Fig. 6f). REST (RE1 silencing transcription factor) represses neuronal fate and can associates with BAF complexes19. BRM deletion reduced REST expression at D10 (Extended Data Fig. 6g). We detected BRM and REST co-occupancy near a number of neural genes, and observed reduced REST binding in Brm−/− cells (Extended Data Fig. 6h, i). REST knockdown from D4 to D7 resulted in ectopic expression of TUBB3+ cells at D10 (Fig. 2i), suggesting BRM controls expression and binding of REST to repress neural lineage genes during cardiac differentiation.
BMP4 rescue of anomalous differentiation
BRM is most critical during cardiac mesoderm induction (Extended Data Fig. 4h,i). At this stage, BRM regulates POU3F1, which counteracts BMP signaling18. BMP4 concentration at this stage is finely regulated to ensure proper cardiac differentiation20,21. Increased BMP4 concentration inhibited cardiac differentiation of WT ESCs but rescued cardiac differentiation of Brm−/− ESCs (Fig 3a, Extended Data Fig. 7a). High BMP4 also repressed prolonged POU3F1 expression in Brm−/− cells and normalized expression of BAF60c and REST (Fig. 3b). Loss of BRG1, however, was not similarly compensable by increasing BMP4 concentrations (Extended Data Fig. 7b). BMP4-mediated BRM KO rescue restored accessibility of cardiac enhancers and prevented accessibility of neural enhancers (Extended Data Fig. 7c–g).
Fig. 3. Loss of Brm is compensable in vitro and in vivo.
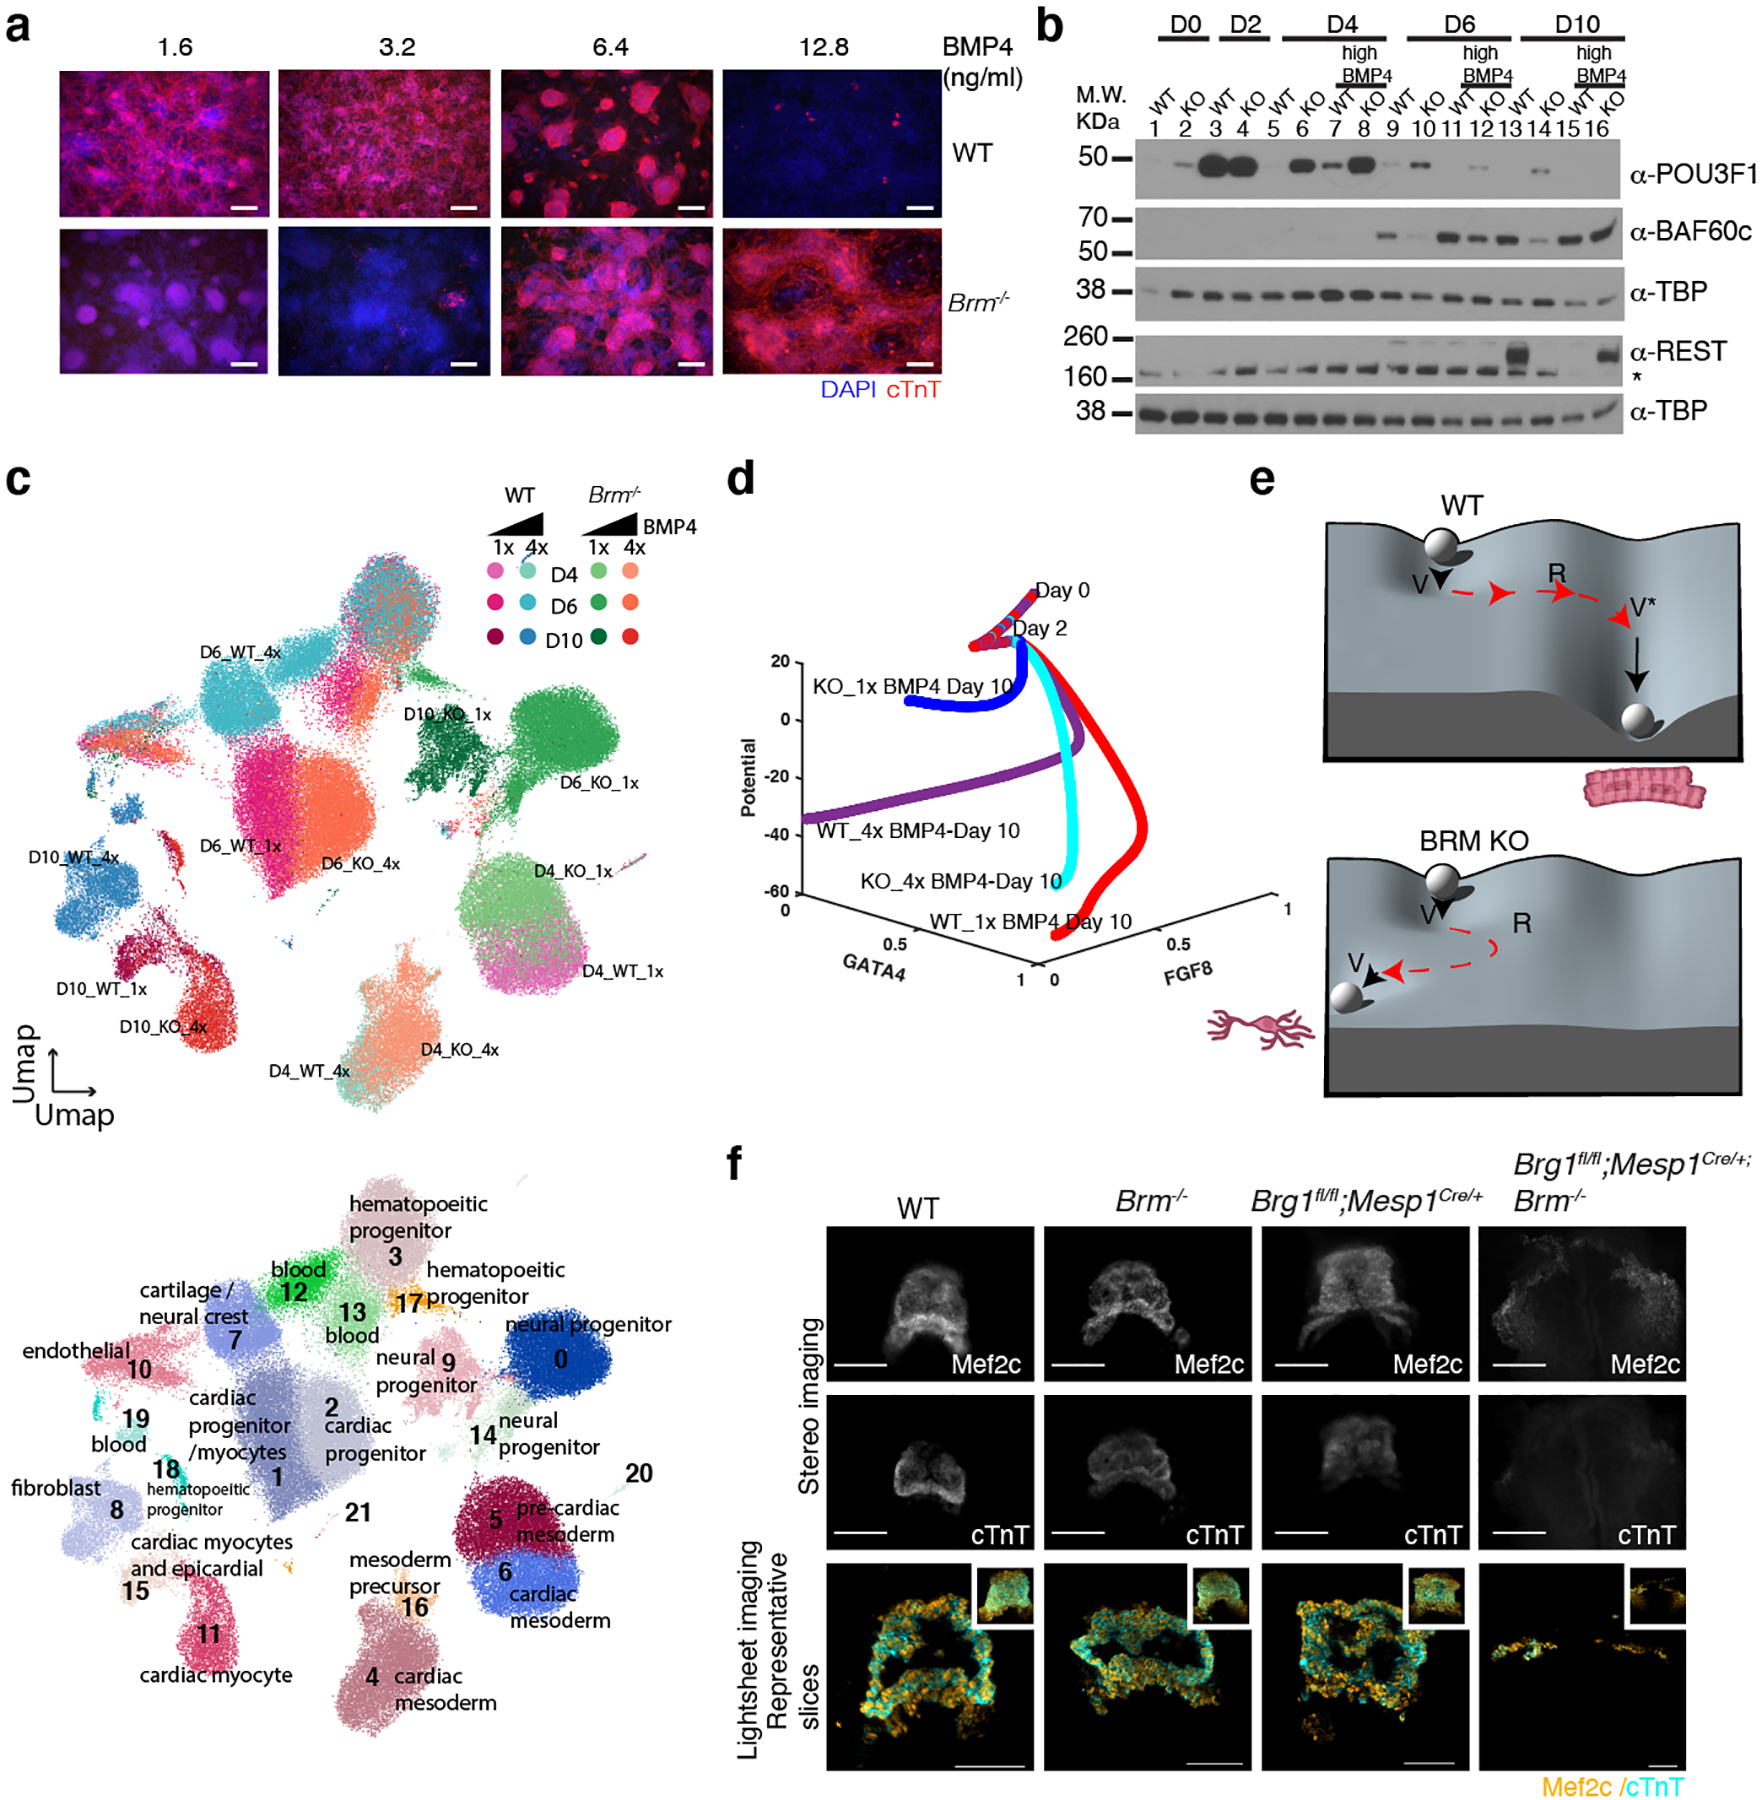
a, Immunostaining of WT and Brm−/− cells in presence of increasing concentrations of exogenous BMP4. BMP4 treatment occurred at D2 to D4 of differentiation. Scale bars are 200μm. b, Western blot showing repression of POU3F1 and re-expression of REST and BAF60c in presence of high BMP4 in BRM KO cells. c, Single cell RNA-seq data projected on UMAP space showing both WT and BRM KO genotypes clusters (upper panel) with inferred cell types (lower panel) at D4, D6 and D10 of differentiation induced with normal (1x, 3.2 ng/ml) and high (4x, 12.8ng/ml) BMP4 concentrations. d, A mathematical model using logic-based differential equations predicts the fate potential of WT and Brm−/− cells induced with normal and high BMP4 during cardiac differentiation. e, Waddington landscape depicting WT differentiation undergoing saddle-node bifurcations with hysteresis (red arrowheads), forming cardiomyocytes. Brm−/− cells differentiate undergoing a reversed saddle node bifurcation with dampened hysteresis to form neural progenitor cells. f, Mouse embryos at 8.5 days post coitum (E8.5) stained with MEF2c or cardiac troponin T (cTnT), (stereomicroscope images upper two panels, scale bars are 200μm.) and representative slices from light sheet microscopy images, with maximum intensity z-projections in inset (lower panel, scale bars are 100μm) for the indicated genotypes.
Single cell RNAseq analyses revealed that increased dosage of BMP4 completely restored the differentiation path of Brm−/− cells (Fig. 3c, Extended Data Fig. 8a–d). How BMP4 might change the differentiation path of Brm−/− cells is not clear. We confirmed that loss of BRM did not simply change BMP4 availability to the cells (Extended Data Fig. 8e). Intrinsic gene expression noise22,23 could participate in BMP4-dependent modulation of the Brm−/− transcriptional state, which pushes WT cells towards hematopoietic differentiation while making Brm−/− cells undergo a cardiac differentiation path (Extended Data Fig. 8f–i)
Mathematical modeling
To identify the dynamics underlying distinct cell fates in Brm−/− cells, we built a mathematical model based on our proposed regulatory mechanisms and logic-based normalized-Hill differential equations (LDEs, see methods)24. The model correctly predicted fate potential in WT and Brm−/− cells induced with normal or high BMP4 (Fig. 3d, Extended Data Fig. 9). The model (Extended Data Fig. 9a, b) predicted the fractional cell population and fractional transcriptional activity of Gata4 (cardiac) and Fgf8 (neural) from single cell RNAseq data (Extended Data Fig. 9c–f). Fractional activity of regulators of cardiac differentiation (POU3F1, REST) correlated well with western blot results (Extended data Fig. 9g, h, compare with Extended Data Fig. 5k and Extended Data Fig. 6g). The model was employed to compute the quasi-Waddington landscape (Supplementary Videos 7–10) and subsequent path of WT and Brm−/− ES cells during differentiation (Extended Data Fig. 9 i–k). Of note, the differentiation potential of Brm−/− cells remains high, indicating residual developmental plasticity. Utilizing the model, we performed a bifurcation analysis. Phase portrait results showed hysteresis (a pair of saddle-node bifurcations) for WT cells and reversal of a saddle-node bifurcation with delay in KO cells (Extended Data Fig. 9l, Supplementary Videos 11–12). Modeling also supports that the initiating event is likely to be around day 3 of differentiation, consistent with stable mesoderm state with an immediate transition to neural fate. A simplified diagram is shown in Fig 3e.
BAF complex composition dynamics
BRG1 complex composition was markedly altered in absence of BRM, with increased incorporation of DPF3, SMARCC2, SMARCD3, and ACTL6B during differentiation, subunits that are reminiscent of neural BAF complexes25,26, and reduction of WDR5 and other subunits (Extended Data Fig. 10a, left panel). Many of these subunits were restored to WT-like association upon exposure to high BMP4 levels (Extended Data Fig. 10a, right panel).
BRM is required for cardiogenesis in vivo
We generated a new Brm−/− mouse line with a 4bp deletion at Exon 2 resulting in a premature stop codon and loss of BRM protein (Extended Data Fig. 10b, c). As with the original line3, Brm−/− mice survived and were found at Mendelian ratios (Extended Data Fig. 10d). Viability may be due to compensatory action of BRG1 in Brm knockout tissues8,9. We observed increased expression of BRG1 in adult mouse tissues (Extended Data Fig. 10e), although not in our directed differentiation system (Extended Data Fig. 10f).
To explore BRG1 compensation of BRM activity in vivo we examined Brm loss in WT or mesoderm-specific Brg1 conditional null mice. Mesp1::Cre;Brg1fl/fl embryos form a heart tube at E8.5 that expresses high levels of MEF2c and TNNT2, comparable to control embryos (Fig 3g). In contrast, Mesp1::Cre;Brg1fl/fl;Brm−/−embryos failed to form a heart tube, and instead had bifid sheets of MEF2C expressing cells with barely detectable TNNT2 protein (Fig. 3f, Extended Data Fig. 10g). These results clearly show that BRG1 compensates for BRM in vivo, and unmasks an important role for BRM in embryonic development, including cardiogenesis.
The gene expression programs co-regulated by BRG1 and BRM in vivo will require further investigation.
Discussion
Along the “landscape” of cell fate decisions, epigenetic regulators are key determinants of transition states. In cancer, new attractor states are formed that result in anomalous differentiation or dedifferentiation. In normal development however, scant examples exist of natural transdifferentiation27,28. Forced reprogramming overcomes cell states, and chromatin remodeling factors including BRM are important safeguards against reprogramming29. Reprogramming of fibroblasts to neurons involves transient competition between myogenic and neural gene expression programs, evidence that genome plasticity can transcend germ layer specification30. We show that BRM maintains developmental canalization of mesoderm by providing epigenomic states favouring a limited range of hysteretic transitions. That we observe a “self-reprogramming” in a directed differentiation context, but not in the complete organism, indicates that in vitro cues are strictly narrow parameters, while in vivo they are likely highly buffered. The fragility of the differentiation path has important implications for understanding the stability of gene regulation in differentiation, and deregulated gene expression in disease.
Methods
Cell culture and in-vitro differentiations
Mouse embryonic stem cells (ESCs) were cultured in media containing fetal bovine serum (FBS) and leukemia inhibitory factor (LIF) without feeder mouse embryonic fibroblast cells with daily media change at 37°C, 7% CO2 and 85% relative humidity. CMs were differentiated as described previously20,31. Briefly, mouse ESCs were differentiated in presence of ascorbic acid (50μg/ml) in suspension cultures without LIF and Serum for 2 days to form embryoid bodies (EBs). EBs were dissociated and treated for 2 days with VEGF (5ng/ml), Activin A (8ng/ml) and BMP4 (3.2ng/ml, normal or 12.8ng/ml, high BMP4 condition) to induce cardiac mesoderm which were subsequently dissociated and cultured as monolayer in presence of VEGF (5ng/ml), FGF-basic (10ng/ml) and FGF10 (25ng/ml) for 2 days and daily media changes for next four days without cytokines to form beating cardiac myocytes. Brg1 was deleted in presence of 200 nM 4-hydroxytamoxifen (4-OHT) for 48 h with control cells treated similarly with tetrahydrofuran (THF)14,32,33. Neural stem cell differentiations were carried out in presence FGF2 and epidermal growth factor (EGF) (10ng/ml each), with growth factor removal forming neuronal progenitor cells as described previously34.
Cell line and mouse line generation
BRM was targeted using CRISPR/Cas9 with sgRNA targeting exon 2 following the described protocol35. sgRNA were cloned to a BbsI-digested pX330 vector (Addgene Cat #42230) by annealing the following primers: 5′ caccg GTCCACTGTGGATCCATGAA 3′ and 5′ aaac TTCATGGATCCACAGTGGAC c 3′ (bold indicates the BbsI digestion site). For construction of BRM-3xFLAG tag line, we followed a similar strategy to insert a 3xFLAG tag sequence between the stop and penultimate codon using the following primers to clone sgRNA to the BbsI site of pX330 vector : 5’ caccg CTGATAACGAGTGACCATCC 3’ and 5’ aaac GGATGGTCACTCGTTATCAG C 3’. The following sequence was inserted to the upstream homology sequence for the insertion of 3x-FLAG tag: 5’ ggaggcggtggagcc GAC TAC AAG GAC CAC GAC GGC GAC TAC AAG GAC CAC GAC ATC GAC TAC AAG GAC GAC GAC GAC AAG TGA 3’. BRM targeting vectors were constructed by cloning 450 to 500 bp of DNA upstream and downstream of midpoint of sgRNA target site into KpnI-XhoI and BamH1-NotI sites of pFPF (a derivative of Addgene plasmid #22687 in which neomycin is replaced with puromycin cassette). The BRM-AID strain was constructed following a previously-described strategy36. Briefly, pEN244-CTCF-AID_71–114_-eGFP-FRT-Blast-FRT plasmid (addgene Cat#92140) was digested with BamH1 and Sal1 and replaced the 3’ and 5’ homology of Ctcf with that of Brm respectively. The following primers were used to clone an sgRNA to pX330 vector: 5’ CAC CCT GAT AAC GAG TGA CCA TCC 3’ and 5’ GAC TAT TGC TCA CTG GTA GGC AAA 3’. 2.5 μg of each of the sgRNA plasmid, plus 20 μg of Brm targeting constructs were used for transfection. Single clones were selected, grown, PCR genotyped and DNA sequenced.
To construct the Brm mouse strain, we used CRISPR/Cas9 with the exact same exon 2 sgRNAs as in the cell line cloned to a BbsI-digested pX330 vector by annealing oligos: 5’ caccg GTCCACTGTGGATCCATGAA 3’ & 5’ aaac TTCATGGATCCACAGTGGAC c 3’. In-vitro transcribed RNA and CAS9 protein complex and were injected to the embryos and transferred to 0.5 days post coitum (dpc) pseudo-pregnant female mice. We obtained a mouse line with 4bp deletion resulting in a premature stop codon, confirmed by genotyping PCR sequencing. Wild type, heterozygous and homozygous mice are distinguished by sequencing PCR products amplified using following primers 5’ CATGGACAGTGAATGGTTGTG 3’ and 5’ CTTGTGGTGACAAAGGGGGT 3’ and tracking of indels by decomposition (TIDE, https://tide.nki.nl) of sequencing data. Loss of BRM protein was confirmed by western blot.
siRNA mediated knockdown
RNA knockdown were carried out using Lipofectamine-RNAiMax reagent (ThermoFisher, 13778150) and pre-designed siRNA against POU3F1 (Sigma,SASI_Mm02_00319981) and REST (Sigma, SASI_Mm01_00196017) mRNAs. Control siRNA were used as negative controls (Sigma, SIC001–10NMOL). Briefly, cells were split, washed and suspended in suspension culture plates (for D0 differentiation) or monolayer (D4 differentiation). siRNAs (3μl of 10μM conc.) and RNAiMax (7 μl) were mixed separately with 75 μl Optimem (Thermofisher, 31985062) each. Knockdown was initiated by mixing both siRNA and RNAiMAX suspensions together, incubated for 5 mins at RT. The entire 160 μl of silencing mix were added dropwise to 1ml culture or scaled accordingly.
Nuclear extracts and Western blot
Nuclear extracts were prepared using protocols described previously37. Briefly, frozen cells were thawed and washed once in hypotonic buffer (10 mM HEPES, pH 7.9, 1.5 mM MgCl2, 10 mM NaCl with 0.2 mM PMSF, 0.5 mM DTT added immediately before use) in ice, resuspended and incubated in 5 cell volume of hypotonic buffer for 15 mins and dounce-homogenized 15 times. Nuclei were collected by centrifuging 3000g for 5 mins. Nuclear extracts were prepared by resuspending nuclei in one cell volume of nuclear lyse buffer (20 mM HEPES, pH 7.9, 25% glycerol, 1.5 mM MgCl2, 0.3 M NaCl, 0.02% NP40, 0.2 mM EDTA with 0.2 mM PMSF, 0.5 mM DTT added immediately before use) for 30 mins followed by centrifugation at 25,000g for 30 mins. Western blotting was performed using standard techniques with PVDF membranes. Primary antibodies used were anti- BRG1 (Abcam, ab110641, 1:1000), anti-BRM (Abcam, ab240648, 1:1000), anti-FLAG (Sigma, F1804, 1:1000), anti-BAF170 (Bethyl, 1:1000, A301–39A), anti-BAF60c (Cell Signaling Technology, 62265, 1:1000), anti-REST (EMD-Millipore, 07–579, 1:1000), anti-POU3F1 (Abcam, ab126746, 1:1000), or anti-TBP (Abcam, ab51841, 1:2000), anti-Vinculin (Sigma-Aldrich V9131, 1:1000), anti-phospho-Smad (CST 9511, 1:1000), and anti-Smad1 (CST 9743, 1:1000). Secondary antibodies used were donkey anti-rabbit IRDye 800cw (Licor, 926–32213, 1: 10,000), donkey anti-mouse IRDye 800cw (Licor, 925–32212, 1: 10,000) and donkey anti-goat IRDye 680cw (Licor, 925–68074–1:10,000), HRP-linked-anti-mouse (Cell Signaling Technology, 7076, 1:10000) or HRP-linked-anti-rabbit (Cell Signaling Technology, 7074, 1:10000).
Immunofluoresence
Cells in monolayer were fixed for 30 mins in 4% para-formaldehyde, permeabilized in 0.1% Triton X and 5% goat serum in PBS for 1 hr and incubated with primary antibody (anti-FLAG (Sigma, F1804, 1:300), anti-OCT4 (R&D, MAB1759, 1:300), anti-SOX2 (Abcam, ab97959, 1:300), anti-NANOG (Abcam, ab80892, 1:300), anti-cardiac Troponin T (Thermo Scientific, MS-295-P, 1:100), or anti-TUBB3 (BioLegend, 8012 1:5000) overnight. They were then washed thrice with 0.1% triton X in PBS, incubated with secondary antibody (Goat anti-mouse Alexa 594 (Invitrogen, A11005, 1:1000), Goat anti-rabbit Alexa594 (Invitrogen, 110037, 1:1000) or Donkey-anti-goat AlexaFluor594, 1:1000) for 1hr at RT. Wells were washed thrice with 0.1% triton X in PBS and stained with DAPI (1:1000 dilution) for 1–2 min followed by a PBS wash. Images were taken in Keyence confocal microscope at 10x using BZ-X Viewer or Zeiss Spinning Disk microscope at 63x (for Extended Data Fig. 2f) magnification.
Mouse embryos
Mouse studies were conducted strictly following all relevant ethical regulations in the animal use protocols, UCSF animal use guidelines and the NIH Guide for the Care and Use of Laboratory Animals. Animal use protocols were approved by UCSF Institutional Animal Care and Use Committee (IACUC) and were accredited by the Association for Assessment and Accreditation of Laboratory Animal Care (AAALAC). Eight to ten week old male C57BL/6 mice mated with six to eight week old female mice and detection of plug on the noon of the day counted at E0.5. Mouse embryos (E8.5) were fixed in 4% paraformaldehyde for 1 hr at RT, washed 1x with PBS and permeabilized in blocking solution (5% normal donkey serum, 0.2% sodium azide, and 0.65% Triton X-100 in PBS) at 37C for 2hrs with gentle rocking. After removing blocking solution, embryos were stained with primary antibodies (MEF2c,sheep polyclonal, R&D Systems, AF6786, 1:250 dilution, Cardiac Troponin T, rabbit polyclonal, ProteinTech, 15513–1-AP, 1:400 dilution) at 37C overnight, washed thrice in blocking solution 45 mins each and stained with secondary antibody (Alexa Fluor 488, donkey anti-sheep IgG, Jakson Immuno, 713–545–147, 1:600 dilution and Alexa Fluor 555, Donkey anti-rabbit IgG, Thermo Fisher, A-31572, 1:500 dilution) in blocking solution with 0.32% Triton X-100 at 37C for 4 hrs with gentle rocking. After removing the blocking solution, embryos were washed thrice, 30 min each in PBS and stored at 4C in PBS with 0.2% sodium azide. Images were captured in a Leica stereoscope with 10x magnification and matching acquisition parameters.
For Light Sheet imaging embryos were embedded in 2% agarose (Fisher BP165-25) in PBS inside of glass capillaries (Sigma Z328502) and imaged on a Zeiss Z.1 Dual Light Sheet Fluorescence Microscope. Prospective heart tubes were imaged from three different angles to improve fluorescence signal intensity and resolution captured throughout the heart tubes. Z-stacks were collected for each angle at the optimal slice thickness determined by Zeiss’ Zen software, ranging from 0.55 to 1.12 um. Following image collection, the multiple views of each sample were registered and fused using the Bigstitcher plugin within ImageJ. Final image stacks were output with original z-anisotropy maintained. Maximum z-projections were generated and representative slices were chosen to indicate heart tube morphology.
Flow cytometry
At D10 of differentiation, WT and BRM KO cells were dissociated using TrypLE for 3 min at 37C, quenched with serum, washed in serum free media and fixed with 4% methanol-free formaldehyde for 30 mins at room temperature. Cells were washed with PBS and permeabilized using FACS buffer (0.5% w/v saponin, 4% Fetal Bovine Serum in PBS). For evaluation of differentiation efficiency, cells were stained with a mouse monoclonal antibody for cardiac isoform Ab-1 Troponin at 1:100 dilution (ThermoFisher Scientific #MS-295-P) or the isotype IgG1 control antibody (ThermoFisher Scientific #14-4714-82) at 1:100 dilution for 1 hour at room temperature. After washing with FACS buffer, cells were stained with goat anti-mouse IgG Alexa 594 secondary antibody at 1:200 dilution (ThermoFisher Scientific #A-11005) for 1 hour at room temperature. Cells were then washed thrice with FACS buffer, stained with DAPI for 2 minutes, rinsed, and filtered with a 40-micron mesh. At least 10,000 cells were analyzed using the BD FACS AriaII and results were processed using FlowJo (BD Bioscience).
Bulk RNA-seq
Total RNA was isolated from biologically triplicate samples using miRNeasy micro kit with on-column DNase I digestion (Qiagen). RNA-seq libraries were prepared using the Ovation RNA-seq system v2 kit (NuGEN). Libraries from the SPIA amplified cDNA were made using the Ultralow DR library kit (NuGEN). RNA-seq libraries were analyzed using Bioanalyzer, quantified using KAPA qPCR and paired-end 100 base reads were sequenced using a HiSeq 2500 instrument (Illumina). RNA reads were aligned with TopHat238, counts per gene calculated using feature Counts39 and edgeR40 was used for the analysis of differential expression. K-means clustering and pheatmap functions in R were used to cluster and generate heatmaps. GO enrichment analysis were performed using GO Elite41.
Single cell RNA-seq
Single-cell libraries were prepared from two independent biological replicates for D0 and D10 WT and Brm KO cells differentiated at normal BMP4 concentration, one replicate each of D4, D6 and D10 WT and Brm KO at normal and high BMP4 concentration from a different differentiation and one replicate each of WT and Brg1 conditional KO at D4 and D10 collected from another differentiation. Single-cell libraries were prepared using Single Cell 3’ Library Kit v2 (10x Genomics) according to the manufacturer’s protocol. Briefly, cells dissociated with TrypLE, quenched with FBS and about 10, 000 cells were suspended in 0.04% ultrapure BSA–PBS (McLab, #UBSA-500) in 30μl cell suspension for GEM generation. GEMs were reverse transcribed, and single stranded DNA were isolated and cleaned. Then cDNA was amplified, fragmented, end-repaired, A-tailed and index adaptor ligated, with Ampure cleanup (Beckman Coulter) after each step. Libraries were PCR amplified and cleaned with Ampure beads before shallow sequencing in a NextSeq 500. Read depth normalized libraries were re-sequenced in a NovaSeq 6000 sequencer (Illumina).
Sequencing reads were aligned using CellRanger 2.0.2 or 3.0 to the mm9 mouse reference genome. cellranger aggr was used to generate an aggregated read normalized data matrix of samples. The filtered gene matrix was subsequently used to create a Seurat object for QC and tSNE or UMAP visualizations as described in https://satijalab.org/seurat/ tutorial42.
Seurat analysis
Seurat package v2.3.4 or 3.1.4 or 4.0.1 was used to analyze single cell RNA sequencing data42. Quality control metrics used for filtering cells are listed in Supplementary Table 7. After log-normalization, sources of unwanted variation, including differences in the number of UMI, number of genes, percentage of mitochondrial reads and differences between G2M and S phase scores were regressed using the ScaleData function in Seurat v2 or SCTransform function in Seurat 3.1.4. Clustering was performed using the top 30–40 principal components and visualized using Uniform Manifold Approximation and Projection (UMAP)43. DoubletFinder44 was used to estimate doublet cells from each gem lane. DoubletFinder default parameters were used to estimate the number of principal components, pN, and 10X gem doublet rate percentage. The pk and nExp parameters were dynamically set based on the size of each gem lane according to 10X Genomics’ recommendations. The fraction of doublets found in our dataset were similar in all the genotypes. Fast integration of transcriptomes from Brg1 cKO and Brm KO at D10 was performed using reciprocal PCA with Seurat v4.0.2.
Differential gene expression tests were run using the FindMarkers function with min.pct set to 0.1 and logfc.threshold set to 0.25. Selected differentially expressed genes with an adjusted p-value less than 0.05 from the Wilcoxon Rank Sum test were then displayed using the Dotplot function.
Cell trajectories and pseudotime analysis
Single Cell Analysis in Python (Scanpy), version 1.4.5, was used for finding highly variable genes (HVGs), computing dimensionality reduction, regressing unwanted sources of variation, and building developmental trajectories. Two thousand HVGs were selected within each differentiation time separately and merged, to capture differentiation-specific genes42 Variations were regressed from HVGs that encode for ribosomal and mitochondrial proteins. HVGs were then scaled to unit variance and zero mean. Next, the cell by two thousand HVG matrix was decomposed to fifty principal components using the SciPy, version 1.4.1, ARPACK Singular Value Decomposition (SVD) solver. A k-nearest neighbor graph was then constructed from a local neighborhood size of ten using the following parameters-thirty principal components (PCs), the euclidean distance metric, and the connectivity estimation of the manifold set to Unified Manifold Approximation Projection (UMAP). The louvain-graph based clustering algorithm was then run at a resolution of 1.0 on the k-nearest neighbor graph45. A developmental trajectory was resolved by assessing the connectivities of the louvain clusters, using partition-based graph abstraction (PAGA)10. Finally, the UMAP embedding was recomputed using the PAGA initialization to visualize the developmental trajectory at single cell resolution.
Pseudotime analysis was performed using the URD package11 (version 1.0.2). A single expression matrix with data from three timepoints and WT and Brm−/− in normal and high BMP4 conditions was processed in Seurat v2.3.4, as described above. The object was then down-sampled to retain 5000 cells per sample in the normal BMP4 dataset or 3000 cells per sample in the combined normal and high BMP4 dataset. The down-sampled object was converted to an URD object using the seuratToURD function. Cell-to-cell transition probabilities were calculated by setting the number of nearest neighbors (knn) to the square root of total cells in the object. POU5F1+ clusters from day 4 were set as ‘root’ and all day 10 clusters were set as ‘tip’ cells. An URD tree was constructed by simulating biased random walks from each tip cluster to root.
Signaling Entropy Analysis
Gene-barcode matrices from single-cell RNA-sequencing of day 4 differentiation samples were first filtered and normalized using the Seurat package implemented in R. The “LogNormalize” method with a default scaling factor of 10,000 was applied for normalization. Differentiation potency was next estimated for each cell within the datasets using the SCENT algorithm implemented in R, which integrates a cell’s transcriptomic profile with existing protein-protein interaction (PPI) maps to quantify signaling entropy46. Higher entropy is an indication of greater developmental potency. A human PPI map compiled from Pathway Commons was used as input for an adjacency matrix (https://github.com/aet21/SCENT). Mouse Ensembl IDs were converted into their human homologues using the AnnotationTools Bioconductor package. The resulting set of genes were then integrated with the human PPI network. The entropy value for each cell was normalized to the largest eigenvalue (maximum possible entropy) of the adjacency matrix. Distributions of normalized entropy values for each sample were then plotted for comparison.
Differential Variability Testing with BASiCS
To assess changes in gene expression variability while accounting for artefactual technical noise and the confounding relationship between variance and mean, single-cell RNA-seq datasets were analyzed via the BASiCS framework as implemented in R47. This approach produces gene-specific estimates of residual over-dispersion: a metric describing how greatly a gene’s variability departs from what is expected given its mean expression. Quality control and filtering of gene-barcode matrices was performed using the BASiCS_Filter function with default parameters. Posterior estimates of mean and residual over-dispersion for each gene were computed using a Markov chain Monte Carlo (MCMC) simulation with 40,000 iterations, log-normal prior and regression analysis.
Computational model construction, Quasi-Waddington landscape, and bifurcation analysis
The network topology of the computational model has been developed based on the main mediators of the Brahma effect on cell fate in cardiac mesoderm differentiation. In addition to BRG1, REST, and POU3F1, due to the importance of BMP signaling in cell fate, we included the BMPS and BMPS-I as activator and inhibitor of BMP downstream signaling, to take in the interactions of BRM and BMP signaling in our model. The model inputs include BMP4 concentration and three step inputs specifying the timing of different cell type’s initiation during the ESC differentiation according to experimental protocol for example, BRM* indicates a form of active BRM, regarding its effect on downstream signaling components, after mesoderm initiation (Day 2). The model outputs are developed based on binary cell fate decision module48 and indicate cardiac and neural cell fates. Among the main effectors of cardiac and neural cell fates, GATA4 and FGF8 have been selected to represent model outputs based on their significance in the differentiation of cardiomyocytes and neural cells, respectively, and expected binary response of cell fate indicators during differentiation.
We applied the logic-based differential equation (LDE) approach to convert the BRM network to a system of ordinary differential equations. Six parameters regulate the nodes’ activity in the model. Activation of each node by its upstream reactions was modeled by a normalized Hill function. We modeled pathways crosstalk by continuous gates representing “OR” and “AND” logic. The reaction parameters in the model are reaction weight (W), half-maximal effective concentration (EC50), and Hill coefficient (n). The time constant (τ), initial activation (Yinit) and maximal activation (Ymax) regulate the dynamics of signaling nodes. For most parameters, we used default values consistent with our previous models24. We have adjusted the time constant (τ) of several nodes to be compatible with the experimental timing. The complete model structure and parameter values are provided in the Brahma model definition at https://github.com/mkm1712/Brahma_model. From this model definition, logic-based differential equations were generated automatically using Netflux (https://github.com/saucermanlab/Netflux). A simple model formulated by mass action kinetic was used to simulate the temporal variations of each cell population during differentiation with two time dependent inputs based on the outputs of the LDE model. By employing the dynamics of the BRM network model and a deterministic path-integral quasi-potential method, we obtained the paths followed by a simulated cell on the quasi-potential landscape for different experimental conditions. Also, this method was used to obtain a quantitative map of the quasi-potential landscape underlying cell fate decision during differentiation including the cell paths deriving from different initial conditions. As illustrated in classic Waddington diagrams49, bifurcations play a key role in the canalization of cells. Hence, we performed a bifurcation analysis on the model. By applying the model outputs, cardiac and neural fate activation, on a simple tristable gene regulatory network50, we obtained the cell phase portraits from Day 0 to Day 10 for WT and KO cells (Supplementary Videos 11–12). As the tristable network model is a two-dimensional system, there is no single bifurcation parameter. However, as the parameter representing neural fate activation is not significantly changing during the bifurcations, the parameter of cardiac fate activation is the dominant parameter in modifying bifurcations. Due to the time-dependent dynamics of the upstream Brahma signaling model, the linking cardiac and neural fate parameters change dynamically which results in a time-dependent phase portrait.
ATACseq
Assay for transposase-accessible chromatin using sequencing (ATAC-seq) was performed as described16 in two to four independent biological replicates. Briefly, 50,000 cells (>95% viability) were lysed, washed and tagmented for 45 mins for D0, D2, D4 and D6 cells and 3 h for D10 cells, respectively. DNA was purified and amplified for 5 cycles using universal Ad1 and barcoded reverse primers, quantified using qPCR and further amplified for necessary cycles16. Libraries were purified, quantified and analyzed on a bioanalyzer and sequenced (paired end 75 base) on a Illumina NextSeq 500 sequencer using NextSeq 500/550 High Output v2 kit (150 cycles).
ChIPseq
Chromatin immunoprecipitations of histone modifications (H3K27ac and H3K27me3) were performed as described51 with modifications. Briefly, cells were crosslinked with 1% formaldehyde, and quenched with 0.125 M glycine. Frozen pellets (1 ×10⁷) were thawed, washed, dounced and digested with MNase. Chromatin was sonicated at output 4 for 30s twice with a 1 min pause between cycles then centrifuged at 10,000 g for 10 min at 4°C and stored at −80°C. Chromatin was diluted five fold, pre-cleared for 2 h followed by immunoprecipitation with primary antibodies for 12–16 hours at 4°C (H3K27ac, Active motif 39133; H3K27me3, CST 9733s). 5% of samples were used as input DNA. Antibody-bound protein- DNA complexes were immunoprecipitated using 25 μl of M-280 goat anti- rabbit IgG or anti-mouse IgG dyna beads for 2 h, washed a total of ten times - twice with IP wash buffer 1 (50 mM Tris.Cl (pH 7.4), 150 mM NaCl, 1% NP-40, 0.25% sodium deoxycholate and 1 mM EDTA), five times with IP wash buffer 2 (100 mM Tris.Cl (pH 9.0), 500 mM LiCl, 1% NP-40 and 1% sodium deoxycholate), and then thrice with IP wash buffer 2 with 150 mM NaCl for increasing stringency and eluted with 200 μl of elution buffer [10 mM TrisCl (pH 7.5), 1 mM EDTA and 1%SDS) at 65°C for 30 mins. Samples were reverse crosslinked, digested with proteinase K and RNAse A, and purified using AMPure XP beads (Beckman Coulter). To prepare libraries for sequencing, DNA was end-repaired, A-tailed, adapter ligated (Illumina TrueSeq) and PCR amplified for 14 cycles. PCR-amplified libraries were size selected (200 – 500 bps) and ampure purified. The concentration and size of eluted libraries was measured (Qubit and Bioanalyzer) before single-end 75 base sequencing using a NextSeq 500 sequencer.
Chromatin IP with anti-FLAG antibodies (Sigma, F1806) to probe for BRM binding sites were performed similarly except following modifications. 1) Cells were double crosslinked with 2 mM disuccinimidyl glutarate (DSG) and 1% formaldehyde. 2) MNase digestion conditions were adjusted to have optimal chromatin digestion yielding fragments sizes of 400 to 1Kb. 3) Chromatin binding to antibody and initial two washes contained either 0.05% (low SDS) or 0.2% (high SDS) conditions. 4) Bound protein was competitively eluted with 0.1mg/ml FLAG peptides (ELIM biopharma) and remaining material at 65°C. We observed better ChIP signal over noise at high SDS samples eluted with the FLAG peptides. Chromatin IP with REST antibodies (Sigma-Aldrich, 17–10456) were performed with the following modifications. 1) cells were double crosslinked with 2 mM disuccinimidyl glutarate (DSG) and 1% formaldehyde. 2) chromatin was prepared in Covaris S2 sonicator (intensity 5, 10% duty cycle and 200 cycles per burst for 30 mins) to have 200–500bp fragments. Chromatin from 25×106 cells and 2μg antibodies were used per ChIP.
ATAC-seq and ChIP-seq analysis
Sequencing image files from both the ATAC-seq and ChIP-seq experiemnts were de-multiplexed and fastq files generated using -bcl2fastq. Reads were trimmed and aligned to mouse genome build mm9 assembly using Bowtie 252 with a minimum mapping quality score of 30. Data quality were measured by inspecting FASTQC report for each set of sequencing reads, the alignment rates of the reads to the genome, visual inspection of the browser tracks, the number of peak calls, the FRiP score per replicate and the PCA plot showing clustering of samples by genotype, time-point and bmp4 levels (for high BMP4 samples). The codes for calling peaks and the automated pipeline (MonkeyPipeline) we used to QC and generate bam, bed and bigwig files are provided (https://github.com/gladstone-institutes/Hota_et_al_2021_Brm_safeguards_canalization_cardiac_diff). Open chromatin regions (ATAC-sq) and regions marked by H3K27Ac for each sample were called using the narrowPeak output of the MACS2 peak caller53. Regions marked by H3K27me3 were called using the BCP54 peak caller. A consensus set of peaks across replicates (across samples for each of the ATAC-seq and the histone modification ChIPs) is defined using the -everything followed by -merge options of the bedops program55. A peak is included in the consensus set of peaks (for the ATAC-seq data or the particular histone modification ChIP-seq data) if it includes a peak called by the relevant peak caller for at least one of the associated replicates. The number of reads mapping to each of the consensus regions for each of replicates using the subread featureCounts program39. This creates a matrix of raw counts - the number of rows equals the number of consensus regions and the number of columns equals the number of samples. Regions that don’t have at least 5 reads in at least 2 of the samples are filtered out. The raw counts matrix is then normalized using edgeR bioconductor40,56 R package. For each data set, a linear model is fit for the mean normalized signal in each of the filtered consensus regions. This model allows for the main effects of genotype (BRM KO versus Wild type), differentiation time (D4, D6 and D10), conditions (normal BMP4 vs high BMP4) and the interaction between these two variables. The significance of the regions associated with genotype, condition and/or differentiation time is estimated by testing the combined null hypothesis that the main effects of genotype, differentiation time and the interaction effect between these two variables are all equal to zero. This was performed using the likelihood ratio tests as implemented in the glmLRT function in edgeR. The heatmap of significantly associated regions (FDR < 0.1) is done using the pheatmap package in R. UCSC genome browser and IGV were used to view the browser tracks. Deeptools package in Galaxy57 (usegalaxy.org) was used to pool multiple replicates to generate 1x genome coverage (average of multiple samples) browser tracks. GREAT58 was used to generate gene lists near ATACseq sites within 100Kb. The HOMER59 motif enrichment package was used to enrich DNA motifs in both ATAC-seq and ChIP-binding sites. HOMER calculates the q-value of known motifs to statistically confirm to Benjamini-Hochberg multiple hypothesis testing corrections.
Affinity purification and mass spectrometry
BRG1 complexes were affinity purified using anti-FLAG antibody conjugated agarose gel (Sigma, A2220) and mass spectrometry performed as described previously14. Briefly, nuclear extract was prepared from 108 cells of each genotype, BMP4 condition and stage of differentiation, followed by affinity purification and FLAG elution. Eluates were denatured and reduced in 1.7M urea, 50mM tris, and 1mM DTT for 30 min at 37°C, then alkylated with 3 mM iodoacetamide for 45 min at room temperature in dark. Trypsin (Promega) was added for overnight proteolytic digestion at 37°C. Following digestion, samples were desalted using C18 Ultra Micro Spin Columns (The Nest Group) according to the manufacturer’s specifications. Desalted samples were evaporated to dryness and resuspended in 1% formic acid for mass spectrometry analysis.
Digested samples were analyzed on an Orbitrap Lumos mass spectrometry system (Thermo Fisher Scientific) equipped with an Easy nLC 1200 ultra-high pressure liquid chromatography system (Thermo Fisher Scientific) interfaced via a Nanospray Flex nanoelectrospray source. For all analyses, samples were injected on a C18 reverse phase column (15 cm × 75 μm packed with BEH 1.7 μm particles). Mobile phase A consisted of 0.1% FA, and mobile phase B consisted of 0.1% FA/80% ACN. Peptides were separated by an organic gradient from 5% to 30% mobile phase B over 112 minutes followed by an increase to 58% B over 12 minutes, then held at 90% B for 16 minutes at a flow rate of 350 nL/minute. Analytical columns were equilibrated with 6 μL of mobile phase A. The peptides were separated over a gradient from 3% to 24% B in 38 min followed by an increase of B up to 32% over 9 min at a flow rate of 300 nl/min. The mass spectrometer collected data in a data-dependent fashion, collecting one full scan in the Orbitrap at 120,000 resolution over a m/z range from 350–1250. Peptides with charge states 2–6 were selected for MS/MS interrogation using higher energy collisional dissociation (HCD), MS/MS scans were collected with a fixed cycle time of 2 seconds. Dynamic exclusion was enabled for 30 s with a repeat count of 1.
Raw mass spectrometry data were analyzed using the MaxQuant software package (version 1.6.12.0)60. Data were matched to the SwissProt mouse protein sequences (downloaded from UniProt in November 2020). MaxQuant was configured to generate and search against a reverse sequence database for false discovery rate (FDR) calculations. Variable modifications were allowed for methionine oxidation and protein N-terminus acetylation. A fixed modification was indicated for cysteine carbamidomethylation. Full trypsin specificity was required. The first search was performed with a mass accuracy of ±20 ppm and the main search was performed with a mass accuracy of ±6ppm. A maximum of five modifications were allowed per peptide. A maximum of two missed cleavages were allowed. The maximum charge allowed was 7+. Individual peptide mass tolerances were allowed. For MS/MS matching, a mass tolerance of 0.5 Da was allowed and the top six peaks per 100 Da were analyzed. MS/MS matching was allowed for higher charge states, water and ammonia loss events. The data were filtered to obtain a peptide, protein and site-level FDR of 0.01. The minimum peptide length was seven amino acids. Results were matched between runs with a time window of 0.7 min. All precursor (MS1) intensities of valid peptide matches were quantified by the Maxquant LFQ algorithm using the match between runs option to minimize missing values.
Statistical analysis of the dataset was performed using the MSstats package (v. 3.18.5)61 and limma (3.42.2)62 R packages. Two differential analyses of peak intensities were performed – the first analysis to identify (interacting partner) proteins significantly enriched over non-tagged controls and the second one to identify protein interactions that are lost or gained in the Brm−/− cells when compared with the WT cells at the 5 different stages of cardiac differentiation under 2 settings of Bmp4 levels. The peptide intensities were log2 transformed and normalized for between-run differences. For the first analysis, these differences were estimated as the column effects from the Tukey Median Polish (TMP) procedure63 (as implemented in the medpolish function in R) applied to the matrix of intensities of peptides that were present (or not missing) in at least half of the runs. For the second analysis, the attempt was made to normalize for differences in bait (SMARCA4) levels in addition to other sources of differences between runs by applying the TMP procedure to the matrix of SMARCA4 peptide intensities across the runs. All peptide intensities were processed using the dataProcess function in MSstats with arguments summaryMethod set to “TMP”, the impute argument, Mbimpute set to TRUE and censoredInt set to NA. The resulting run level data summarized at the protein level was filtered for proteins with at least 3 non-missing values across the 20 runs under normal Bmp4 levels and for proteins with at least 2 non-missing values across the 12 runs under high BMP4 levels and was input for the differential analysis using limma. The protein intensities across runs at the 5 different stages were modeled either as a linear or a quadratic function of time in addition to a variable capturing pull-down in bait over mock conditions for the first differential analysis and variables capturing genotype (or Bmp4 level) and interactions between these variables with time. This model borrows information across time on differences in the mean protein intensity between the conditions at each time-point, reducing the effect of missing data at a given time-point while the empirical bayes-based estimation in limma provides for more stable variance estimates under these low replicate numbers situations. Interactors were identified using the statistical significance of the one-sided test (for enrichment over flag) and changes in interactions over time were identified using statistical significance of a composite hypothesis involving all genotype (or Bmp4 level) terms in the model. The mass spectrometry proteomics data have been deposited to the ProteomeXchange Consortium via the PRIDE64 partner repository with the dataset identifier PXD026638.
Statistics and Reproducibility
Representative immunofluorescence images are shown in Fig 1b and Fig 1h are out of three, Fig 2h, 2i and Fig 3a are out of two independent biological replicates. Fig 3b western blots are from 1–2 replicates. Images in Fig 3f is from 1–4 E8.5 embryos. Extended Fig 1c is from one replicate and 1f from two replicates. Extended Fig 2f from one replicate. Extended Fig 3g from three replicates, Extended Fig 4g, 4h, 4i are from two replicates each. Extended Fig 5k is from 2–3 replicates. Extended Fig 6g, 7a and 7b are from two independent biological replicates. Extended Fig 8e is from one replicate. Extended Data 10c is from two replicates, 10e from one replicate of heart and brain preparation and 10f is from 2–3 replicates. See Supplementary Figure 1 for raw data.
Extended Data
Extended Data Fig. 1. Loss of BRM leads to expression of neural genes in cardiac differentiation and has minimal effect in neural differentiation.
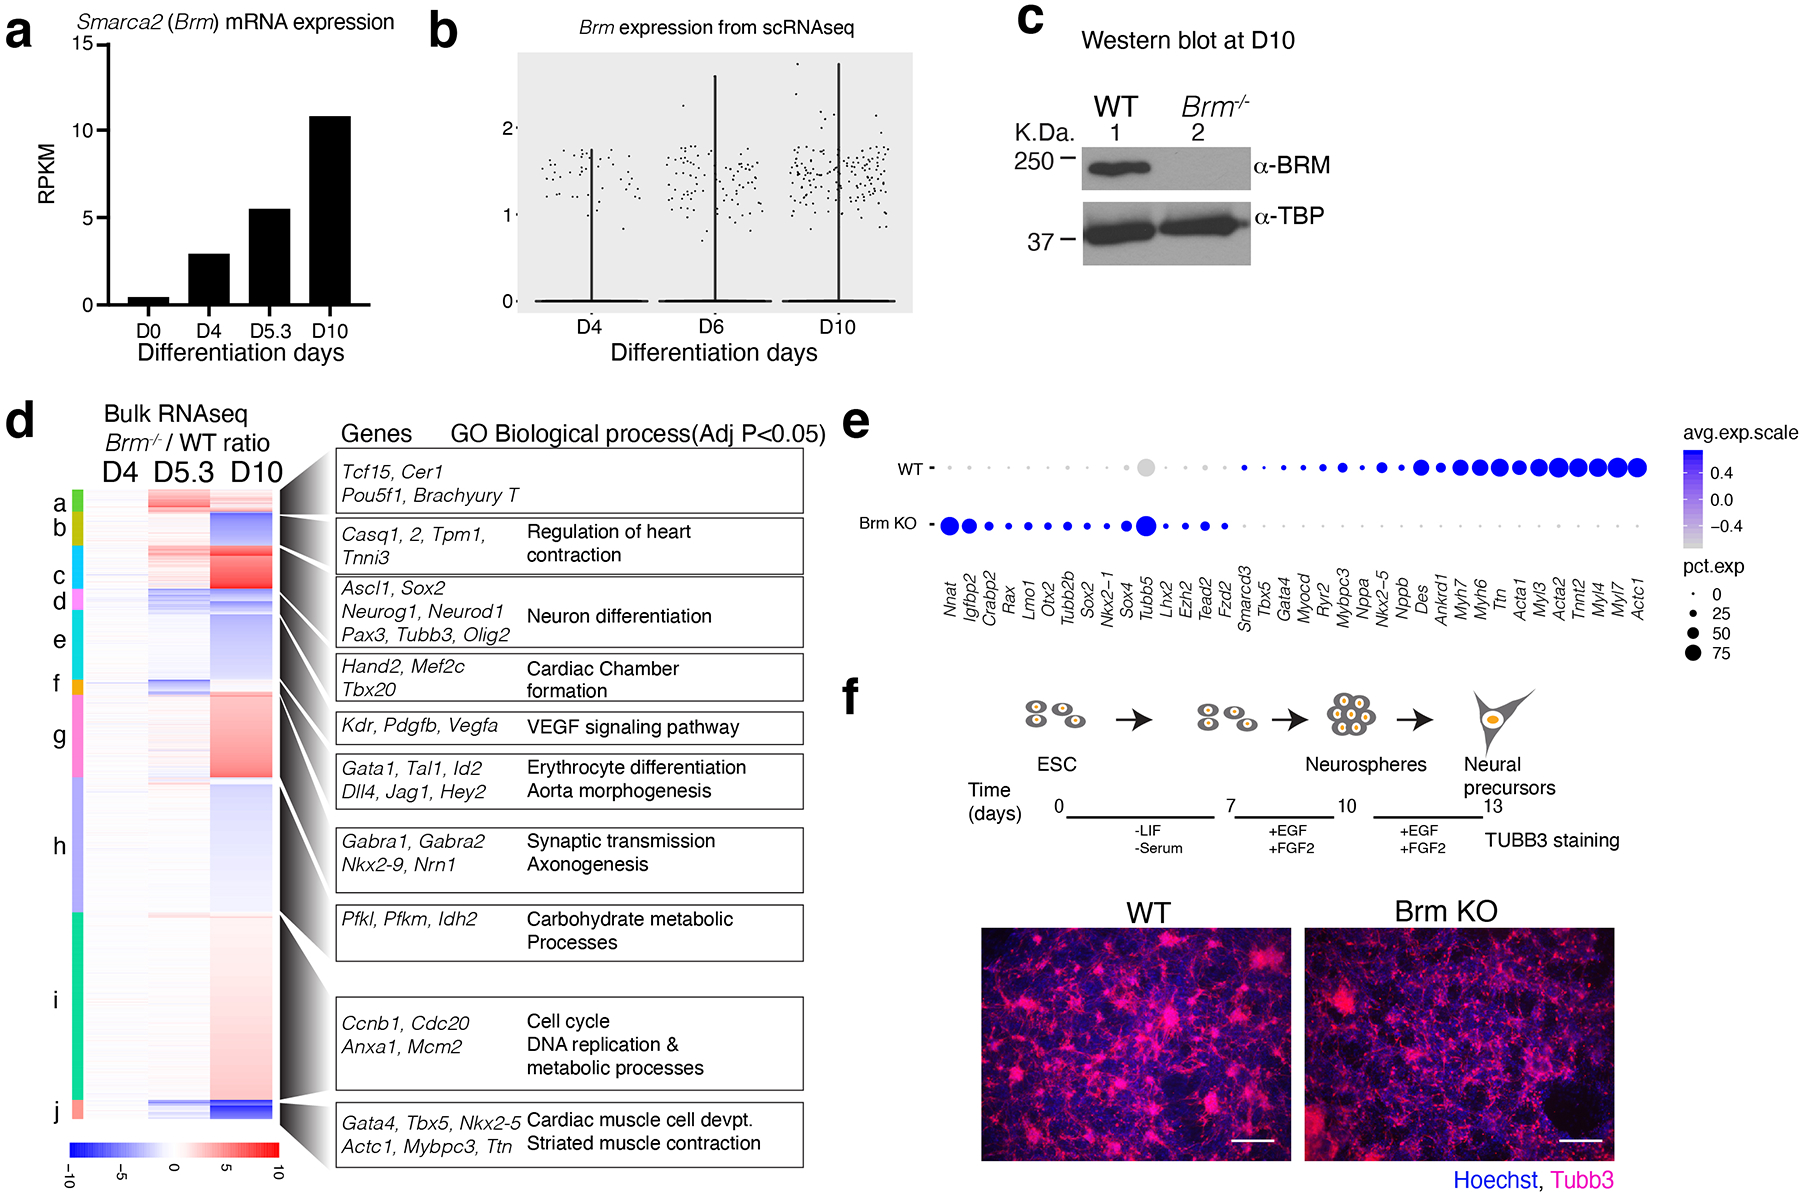
a, Brm mRNA expression during cardiac differentiation from Wamstad et al.31. b, Violin plots of Brm expression of single cell data from this study. c, Western blot of WT and BRM KO cells at D10 of cardiac differentiation. d, Bulk RNAseq analysis of WT and BRM KO cells at D4, D5.3 and D10 stages of differentiation. Counts per million (CPM) average of three biological replicates were plotted as a ratio of KO over WT. Gene Ontology (GO) biological process enrichment was determined by GOElite. e, Dots plots showing expression of indicated genes from D10 WT and Brm–/– single cell RNA-seq data. f, Scheme of neural precursor differentiation from ES cells and TUBB3 immunostaining of WT and Brm−/− cells differentiated to neural precursor (D13) cells. Scale bars are 200μm.
Extended Data Fig. 2. BRM prevents acquisition of neural fate after pre-cardiac mesoderm formation.
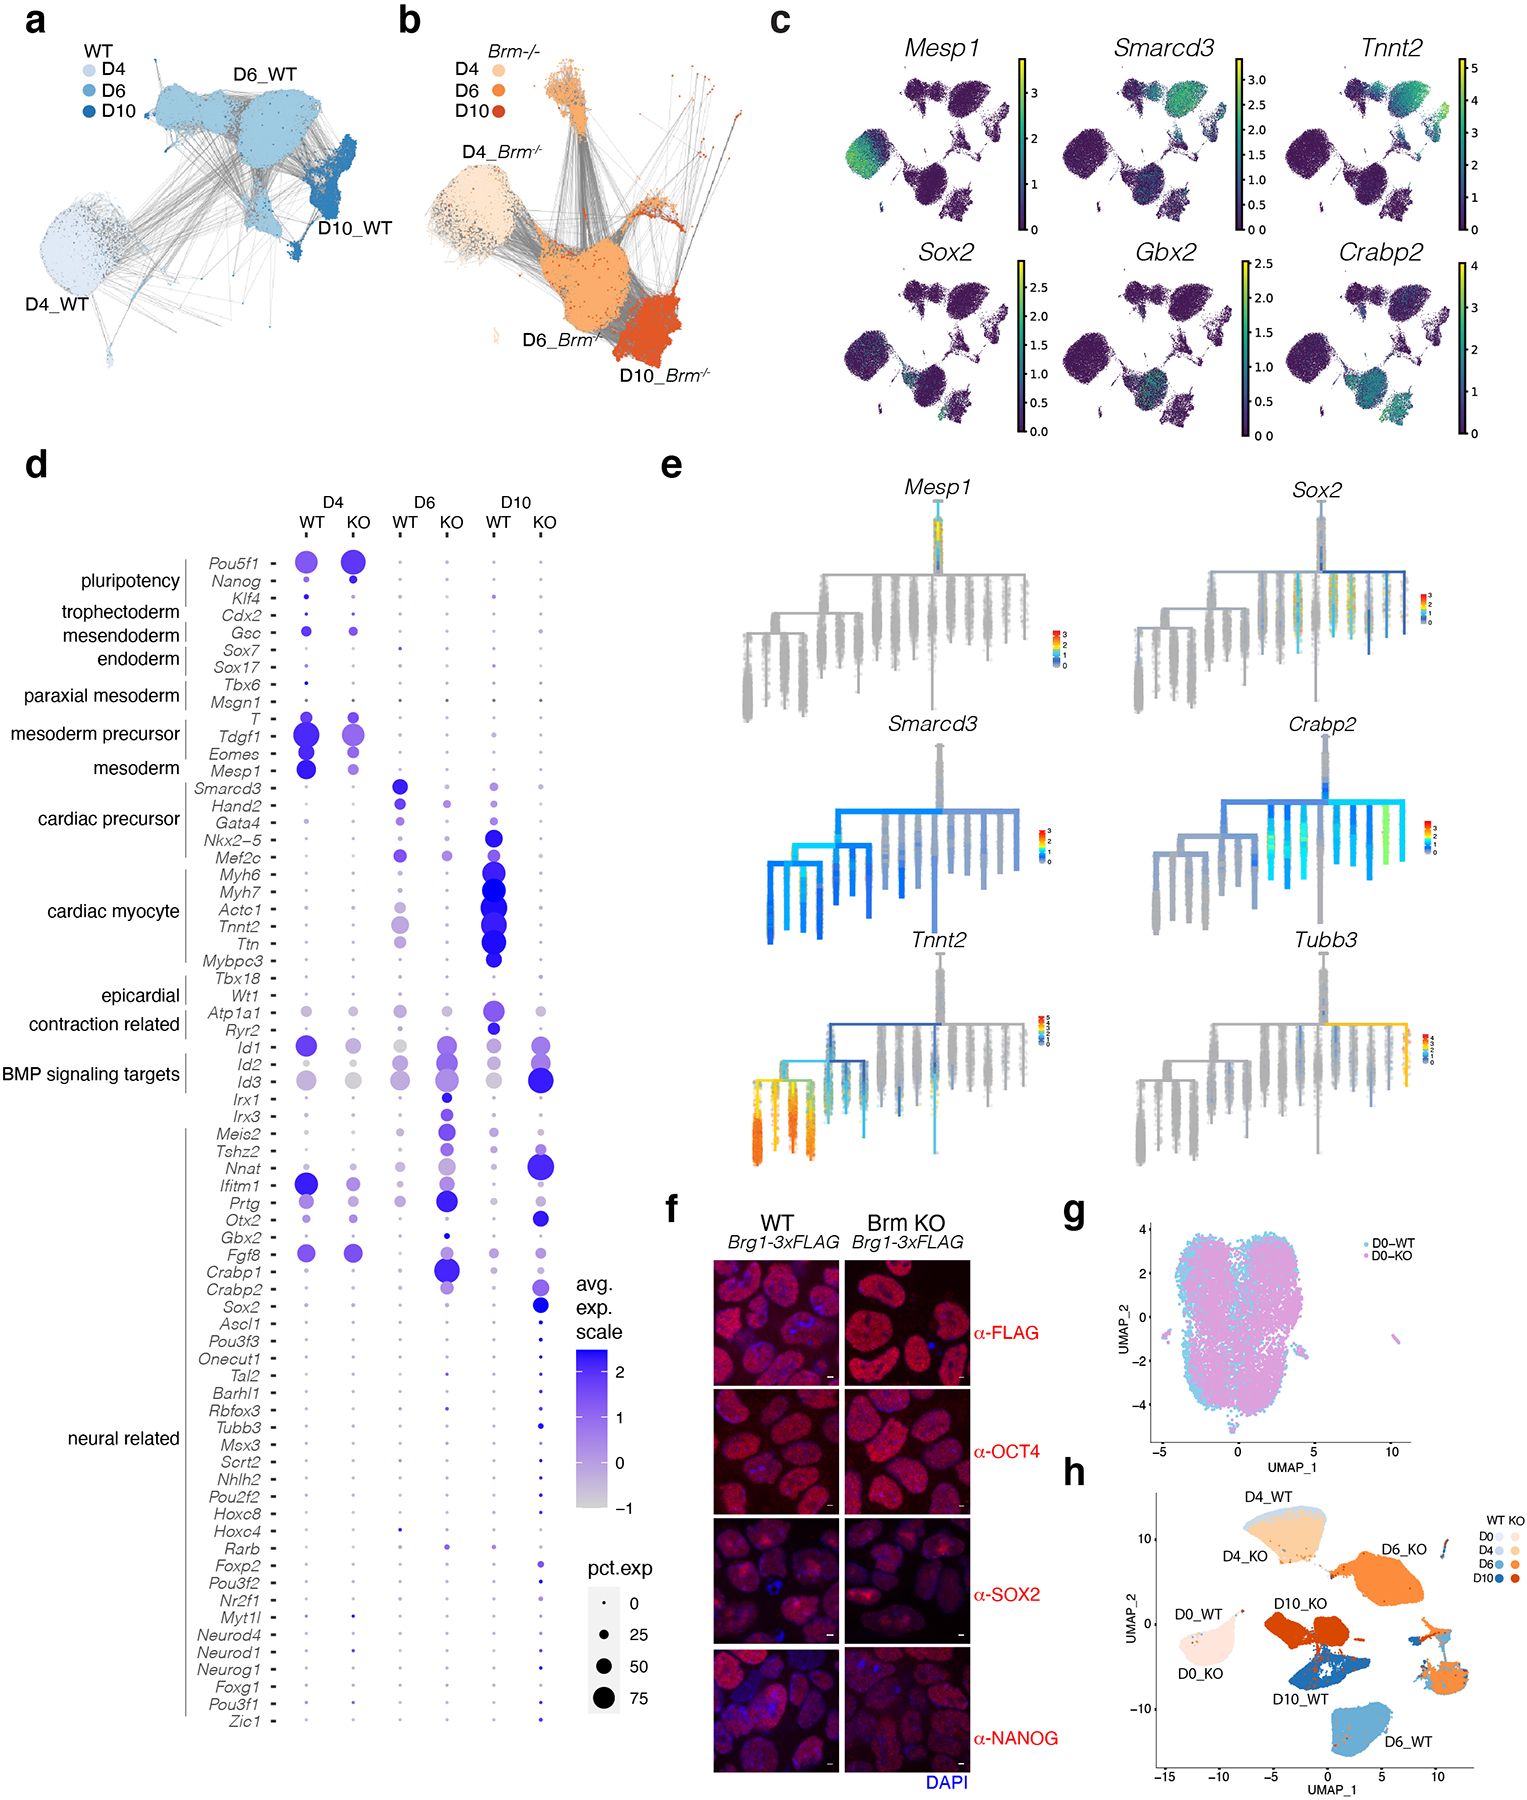
a-d, Single cell RNAseq data from D4, D6 and D10 of cardiac differentiation projected on UMAP space showing PAGA connectivity lines projected for WT (a) or Brm−/− (b), gene expression feature plots (c) and dot plots of quantitative bulk changes in gene expression between WT and Brm−/− cells at D4, D6 and D10 stages of differentiation for early developmental, cardiac mesoderm, cardiac precursors, cardiac myocytes, genes enriched in Brm−/− cells, and a select set of genes involved in neuroectoderm development (d). e, Feature plots of developmental trajectory analysis using URD for selected cardiac and neural genes. f-g, Pluripotency is unaffected in BRM KO cells. f, Immunostaining of WT and Brm−/− ES cells with indicated pluripotency markers. Scale bars are 2μM, magnification 63x. g, Single cell RNAseq of WT and Brm−/− cells in ESCs cluster together. h, Integration of single cell RNAseq data from D0 ESCs with D4, D6 and D10 scRNAseq datasets.
Extended Data Fig. 3. Loss of BRG1 early in differentiation leads to formation of non-cardiac cell types.
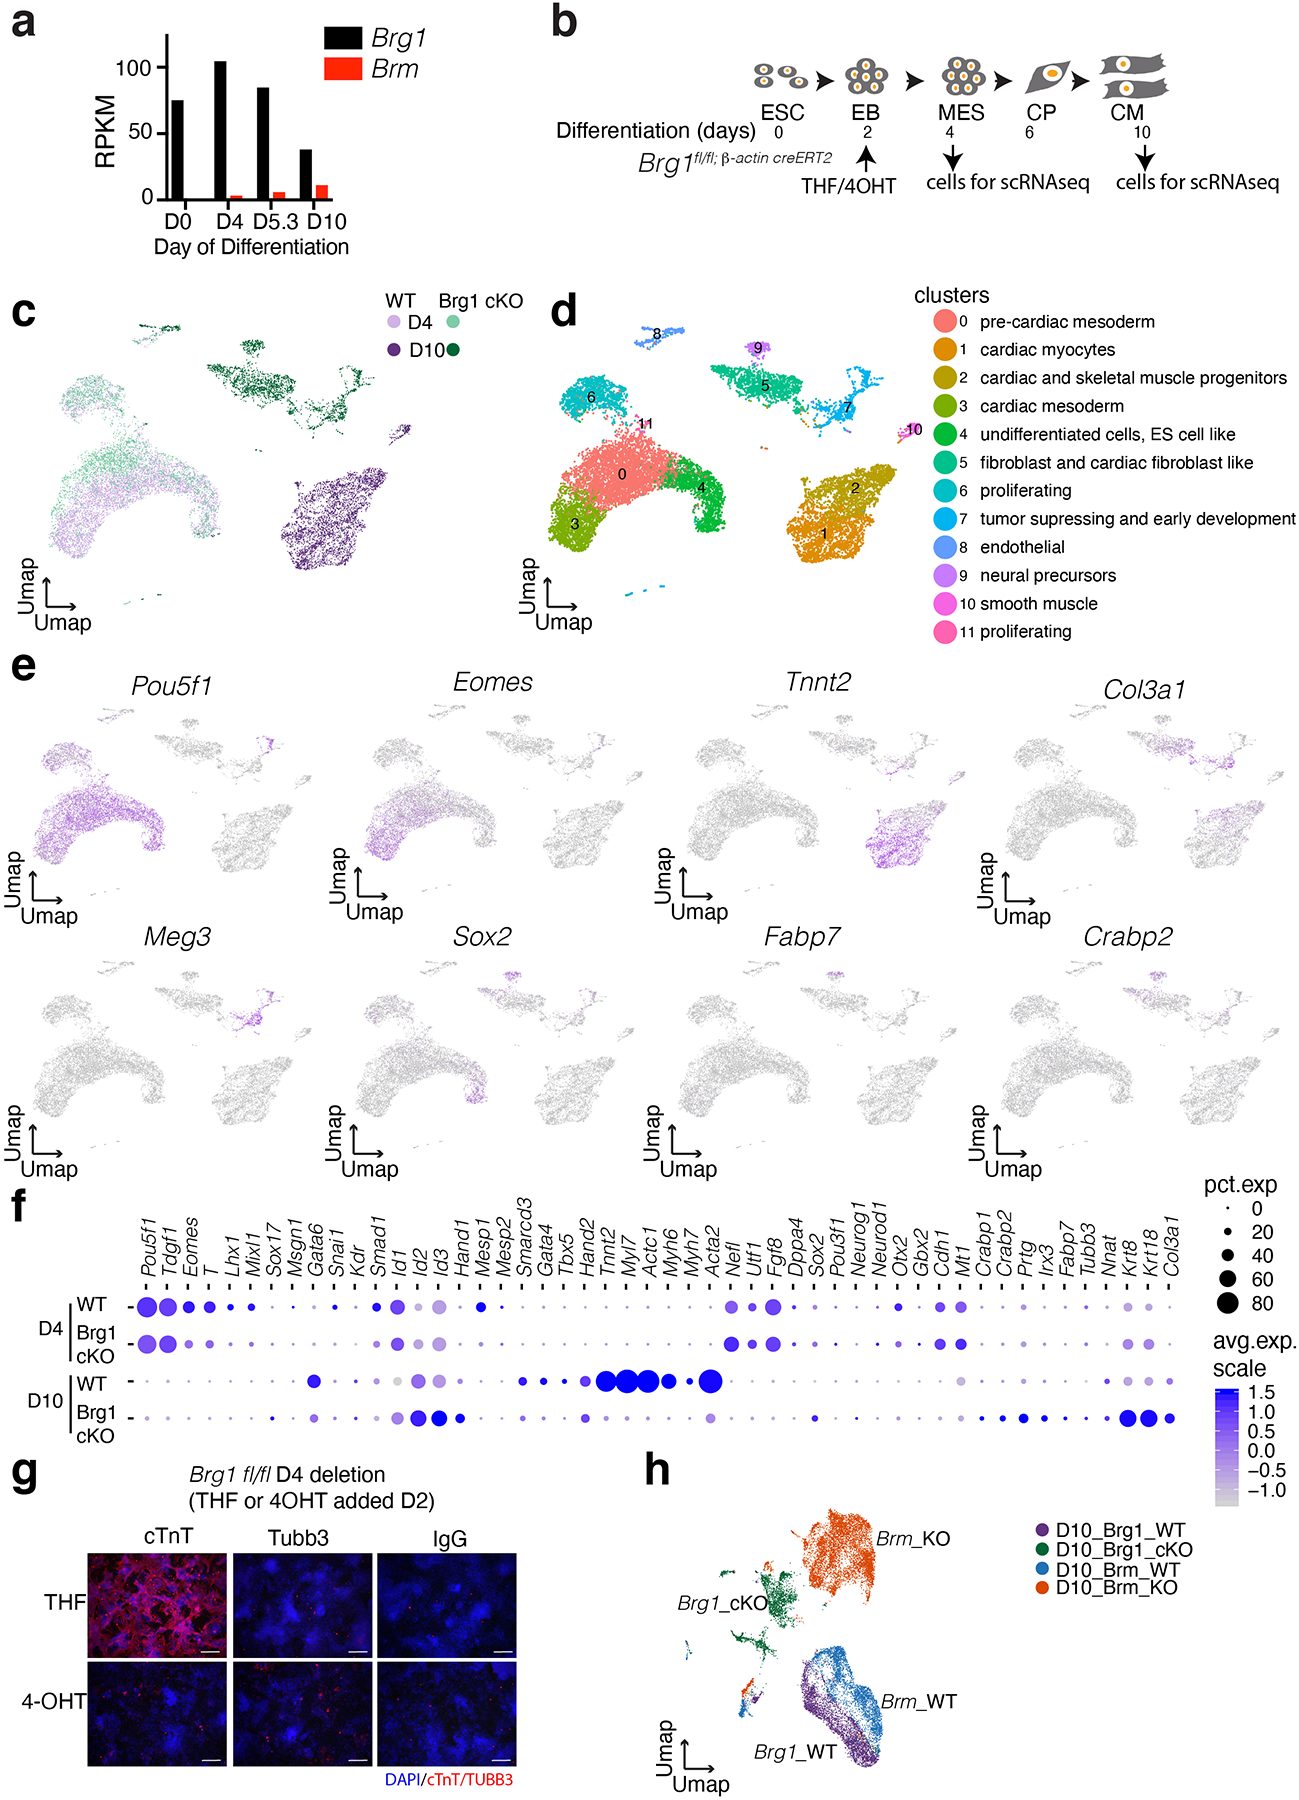
a, Comparison of Brg1 and Brm expression during cardiac differentiation31. b, Scheme of cardiac differentiation showing timing of induction with 4-hydroxy tamoxifen (4-OHT) or the control tetrahydrofuran (THF) and scRNA-seq. THF or 4-OHT was treated for 2 days to achieve complete Brg1 deletion14. c-e, UMAPs of single cell RNA-seq data at D4 and D10 of differentiation of WT and conditional BRG1 KO genotypes (c), clusters with inferred cell types (d) and feature plots of expression of indicated genes (e). f, Dot plots comparing gene expression quantification of WT and conditional BRG1 KO at D4 and D10 of differentiation. g, Cardiac troponin T (cTnT) and TUBB3 immunostaining at D10 for WT and BRG1 cKO cells deleted at D4 of differentiation. Scale bars are 200μm. h, Integration of scRNAseq data of Brg1 cKO and Brm KO at D10 stage of differentiation.
Extended Data Fig. 4. BRM is required during cardiac mesoderm formation.
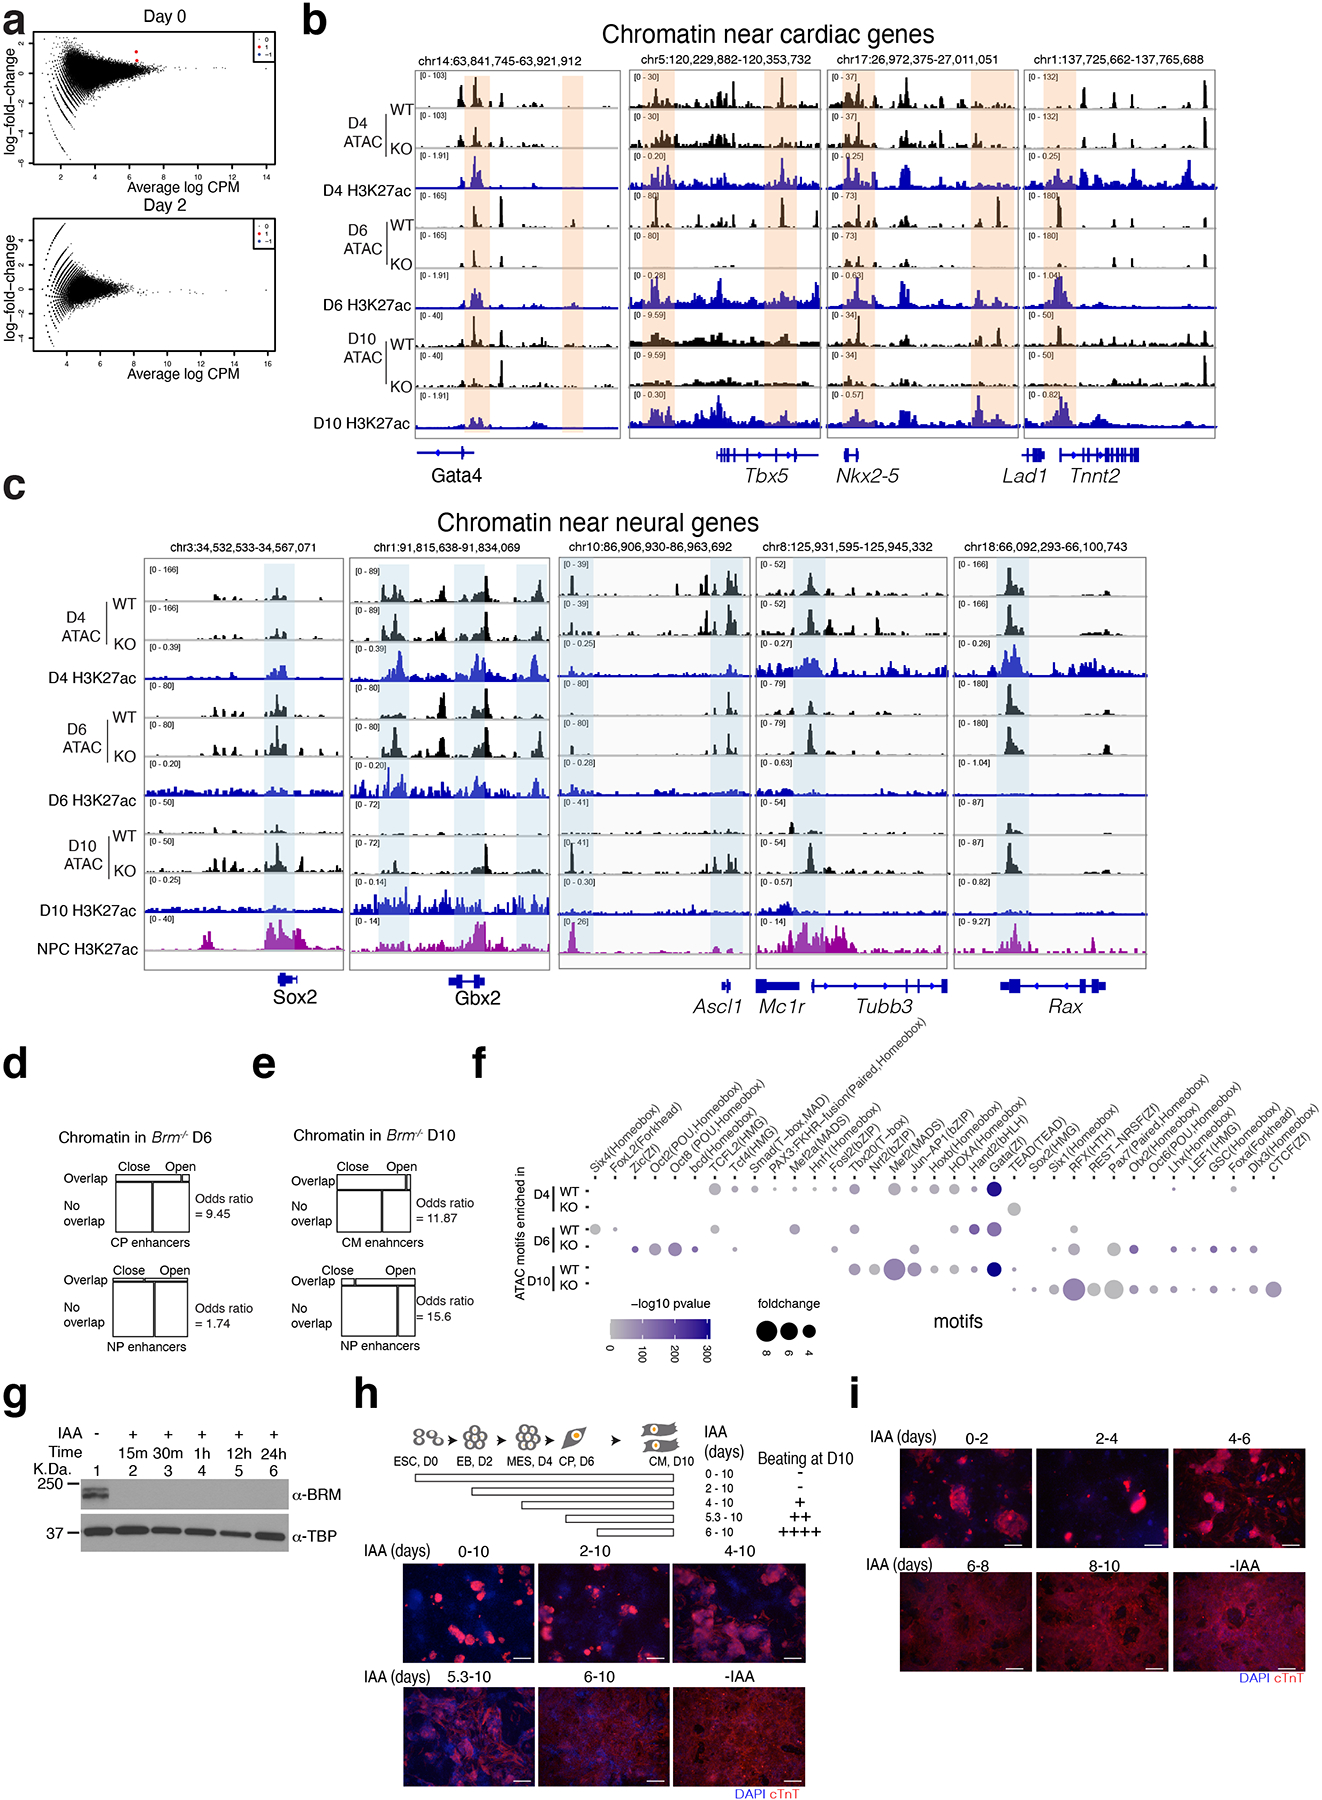
a, Mean difference plots of ATAC-seq data plotting average log fold change between WT and Brm−/− cells and average log CPM (3 biological replicates each) at D0 and D2 of differentiation. Statistically significant (FDR <0.05) peaks showing log2 fold change >1, unchanged, and <1 are shown in red, black and blue respectively. b-c, ATAC-seq browser tracks showing WT and BRM KO chromatin accessibility at D4, D6 and D10 of cardiac differentiation along with H3K27ac active enhancer marks near cardiac genes (b) and indicated neural gene loci, along with neural precursor H3K27ac marks65 (c). d-e, BRM-mediated open and closed chromatin regions compared with cardiac and neural progenitor enhancers. Closed and open chromatin in Brm−/− at D6 (d) and at D10 (e) are compared with respective cardiac and neural progenitor enhancers. f, Motifs enriched at the open chromatin regions in WT and BRM KO cells at D4, D6, D10 differentiation stages. BRM activity is essential before D4 of differentiation. g, Auxin inducible degron mouse ES strain of BRM (Brm-AID) differentiated to cardiomyocytes at D10 and treated without (lane 1) or with auxin analog indole acetic acid (IAA) for indicated length of time shows rapid BRM degradation by western blot. h-i, Schematic of cardiac differentiation showing time of IAA treatment and beating at D10. Cells treated with IAA for indicated length of time (h) or a period of two days at a time (i) were analyzed by immunostaining of cardiac troponin T at D10. Scale bars are 200μm.
Extended Data Fig. 5. BRM loss leads to reduced H3K27ac marks near cardiac genes and increased H3K27ac marks near neural genes.
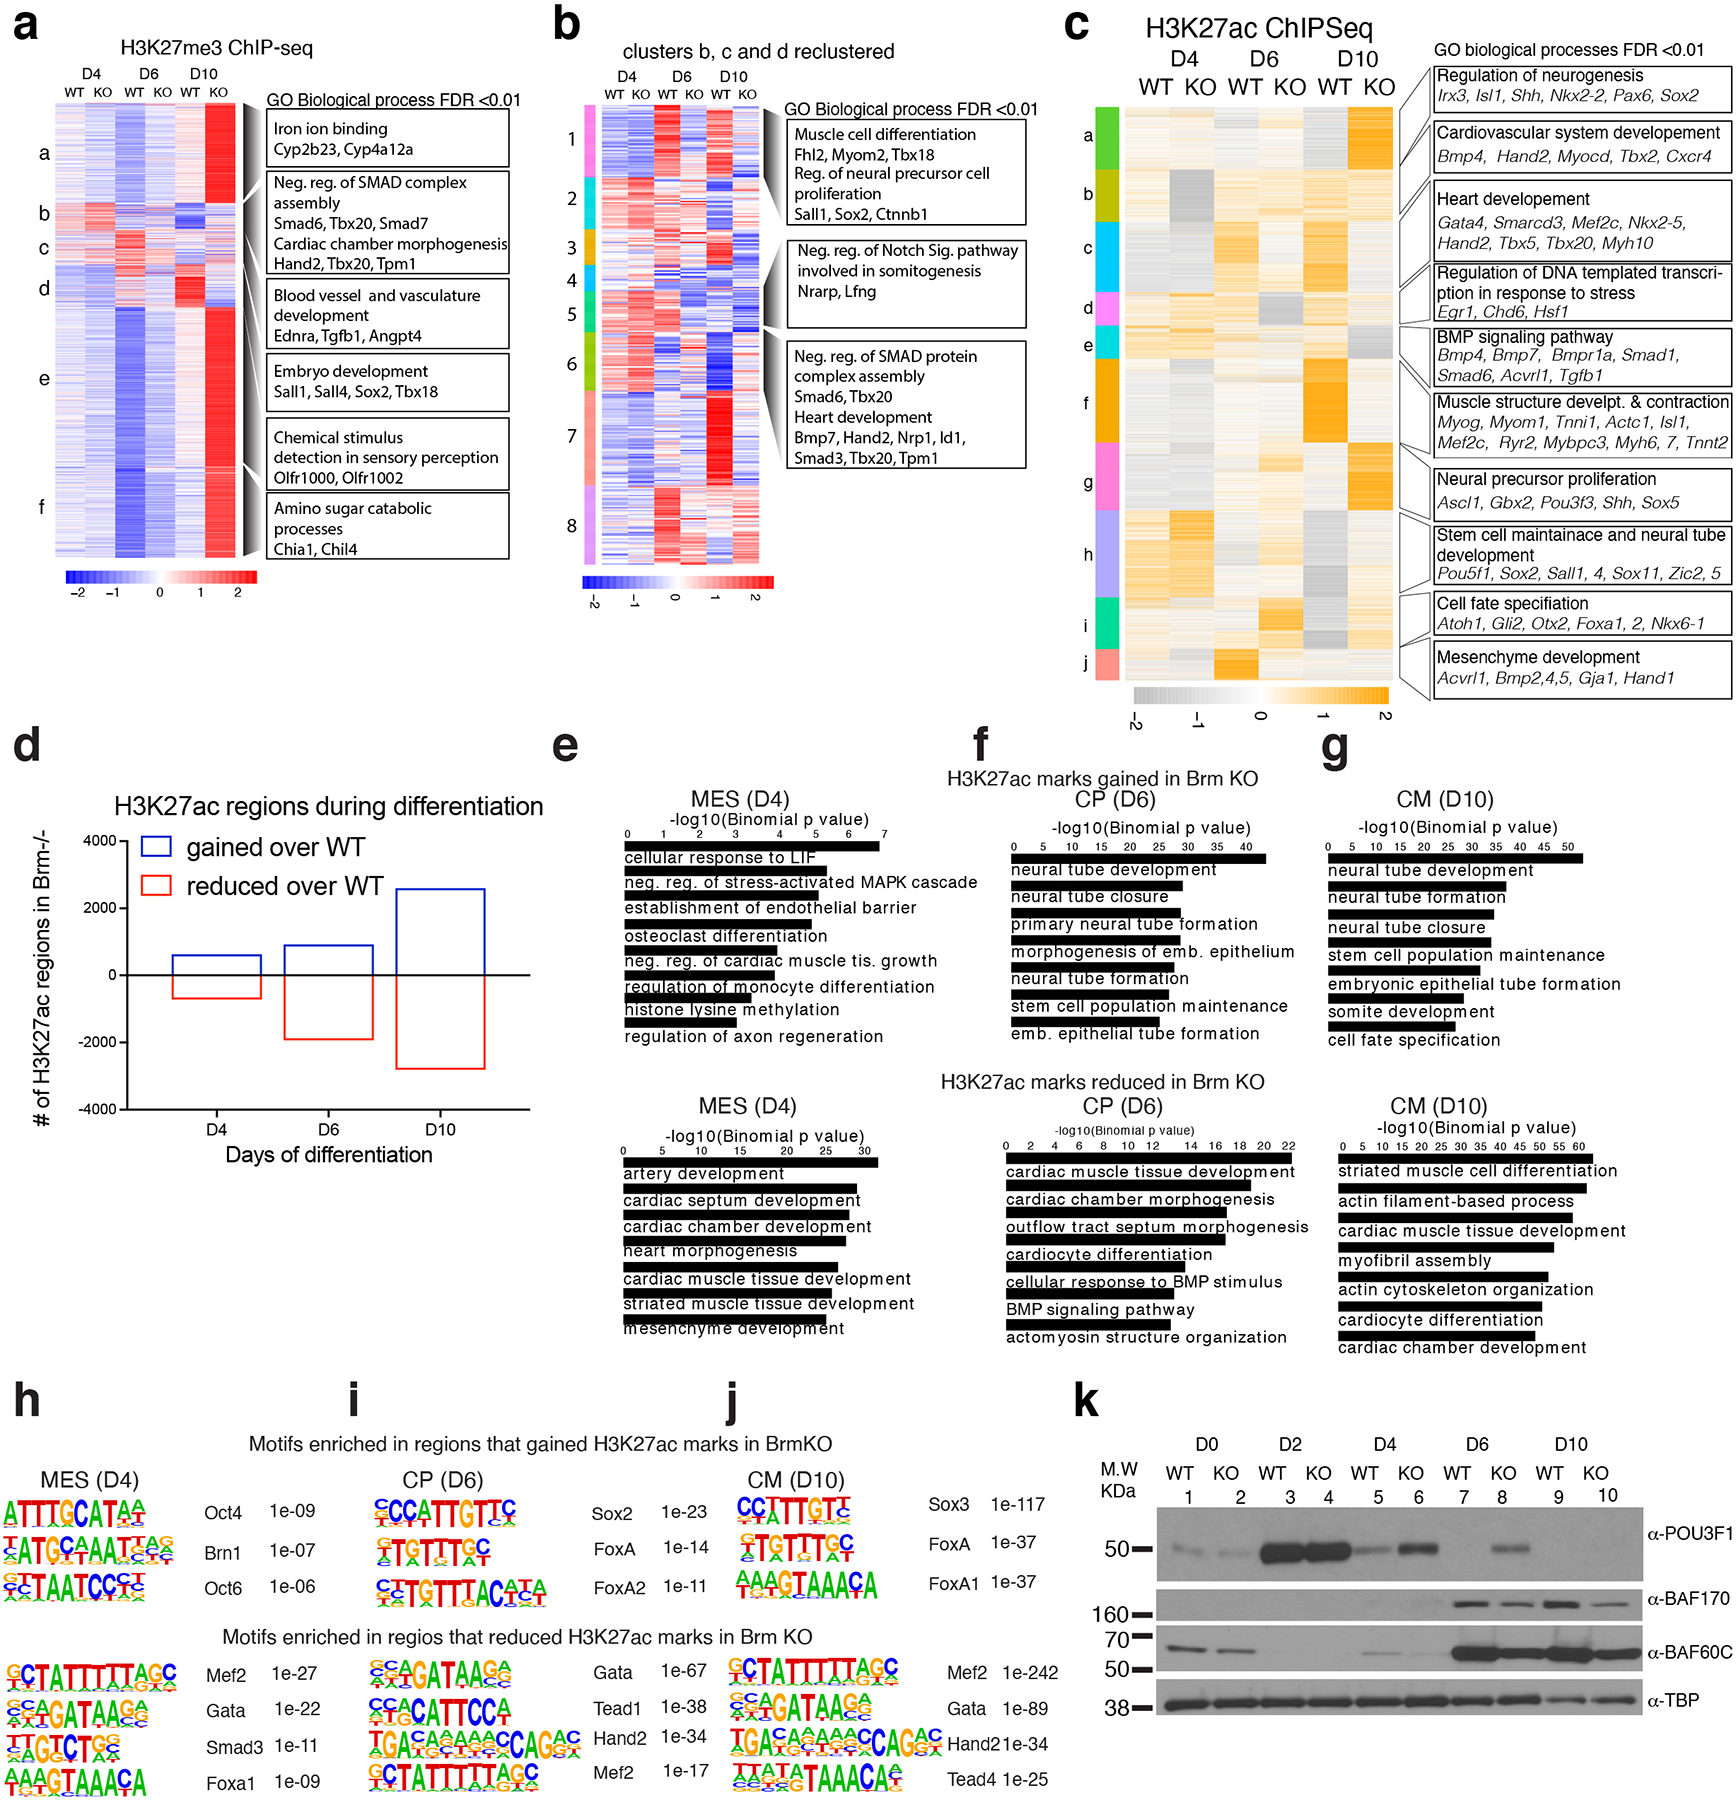
a, Differential enrichment of H3K27me3 marks in WT and Brm−/− cells during cardiac differentiation displayed in the form of a heat map. b, Clusters b, c, and d were re-clustered and shown in a separate heat map (right). GREAT analysis of significant (Benjamini-Hochberg adjusted p-value (FDR) <0.01) GO biological processes (within 1Mb) enrichment for the clusters are on the right with representative genes shown. c, Heat map of significantly affected (FDR<0.05, fold change 2) H3K27ac peaks due to loss of BRM at D4, D6 and D10 of differentiation. GREAT GO biological processes enriched (within 1mb) are shown to the right of the clusters. d, Number of regions significantly affected in Brm−/− cells at D4, D6 and D10 of differentiation are plotted over WT. e-g, GO biological processes enriched for genes (within 1mb) near sites that gained (upper panels) or reduced (lower panels) H3K27ac marks in Brm−/− cells at D4 (e), D6 (f) and D10 (g) of differentiation. h-j, Motifs enriched at the differentially enriched sites in Brm−/− cells are shown at D4 (h), D6 (i) and D10 (j) stages of cardiac differentiation respectively. k, Western blot of indicated proteins in WT or BRM KO cells during D0, D2, D4, D6 and D10 of cardiac differentiation
Extended Data Fig. 6. BRM regulates REST binding during cardiac differentiation.
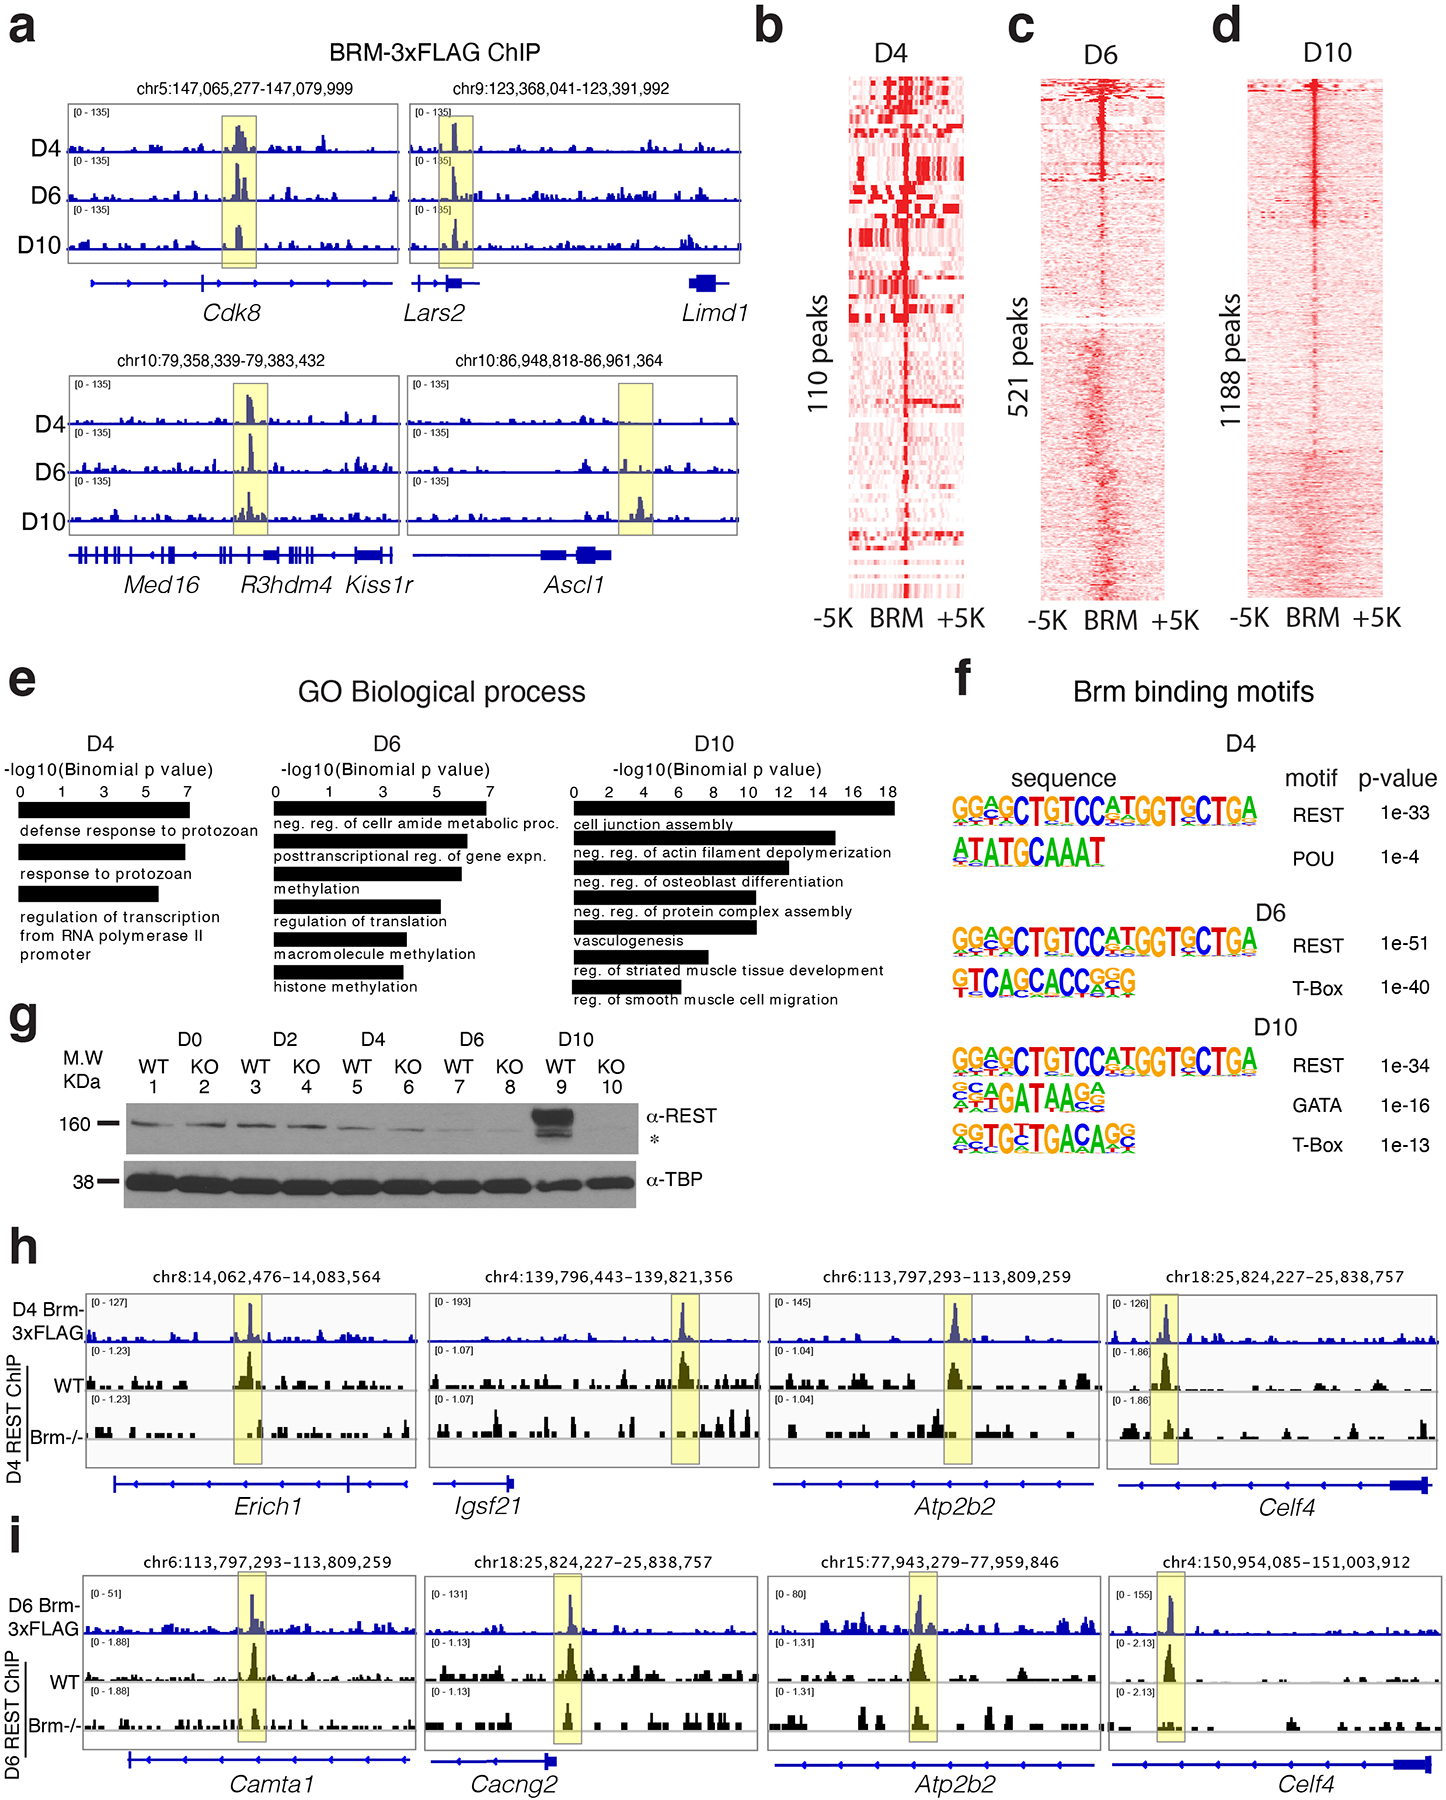
a-d, Genome browser (IGV) tracks showing BRM-3xFLAG ChIP-seq over indicated loci (a) and heat maps of BRM-3xFLAG ChIP-seq over identified BRM binding sites at D4 (b), D6 (c) and D10 (d) of differentiation. e-f, GO biological processes enriched (within 100kb) (e) and motifs enriched (f) in BRM binding sites at the indicated differentiation stages. g, Western blot of REST expression in WT or BRM KO cells during D0, D2, D4, D6 and D10 of cardiac differentiation h-i, Genome browser (IGV) tracks of Brm-3x FLAG ChIP seq near neural related genes over indicated genomic loci and REST ChIPseq in WT and Brm−/− cells at D4 (h) and D6 (i) of cardiac differentiation.
Extended Data Fig. 7. BMP4 restores WT-like chromatin accessibility in Brm−/− cells.
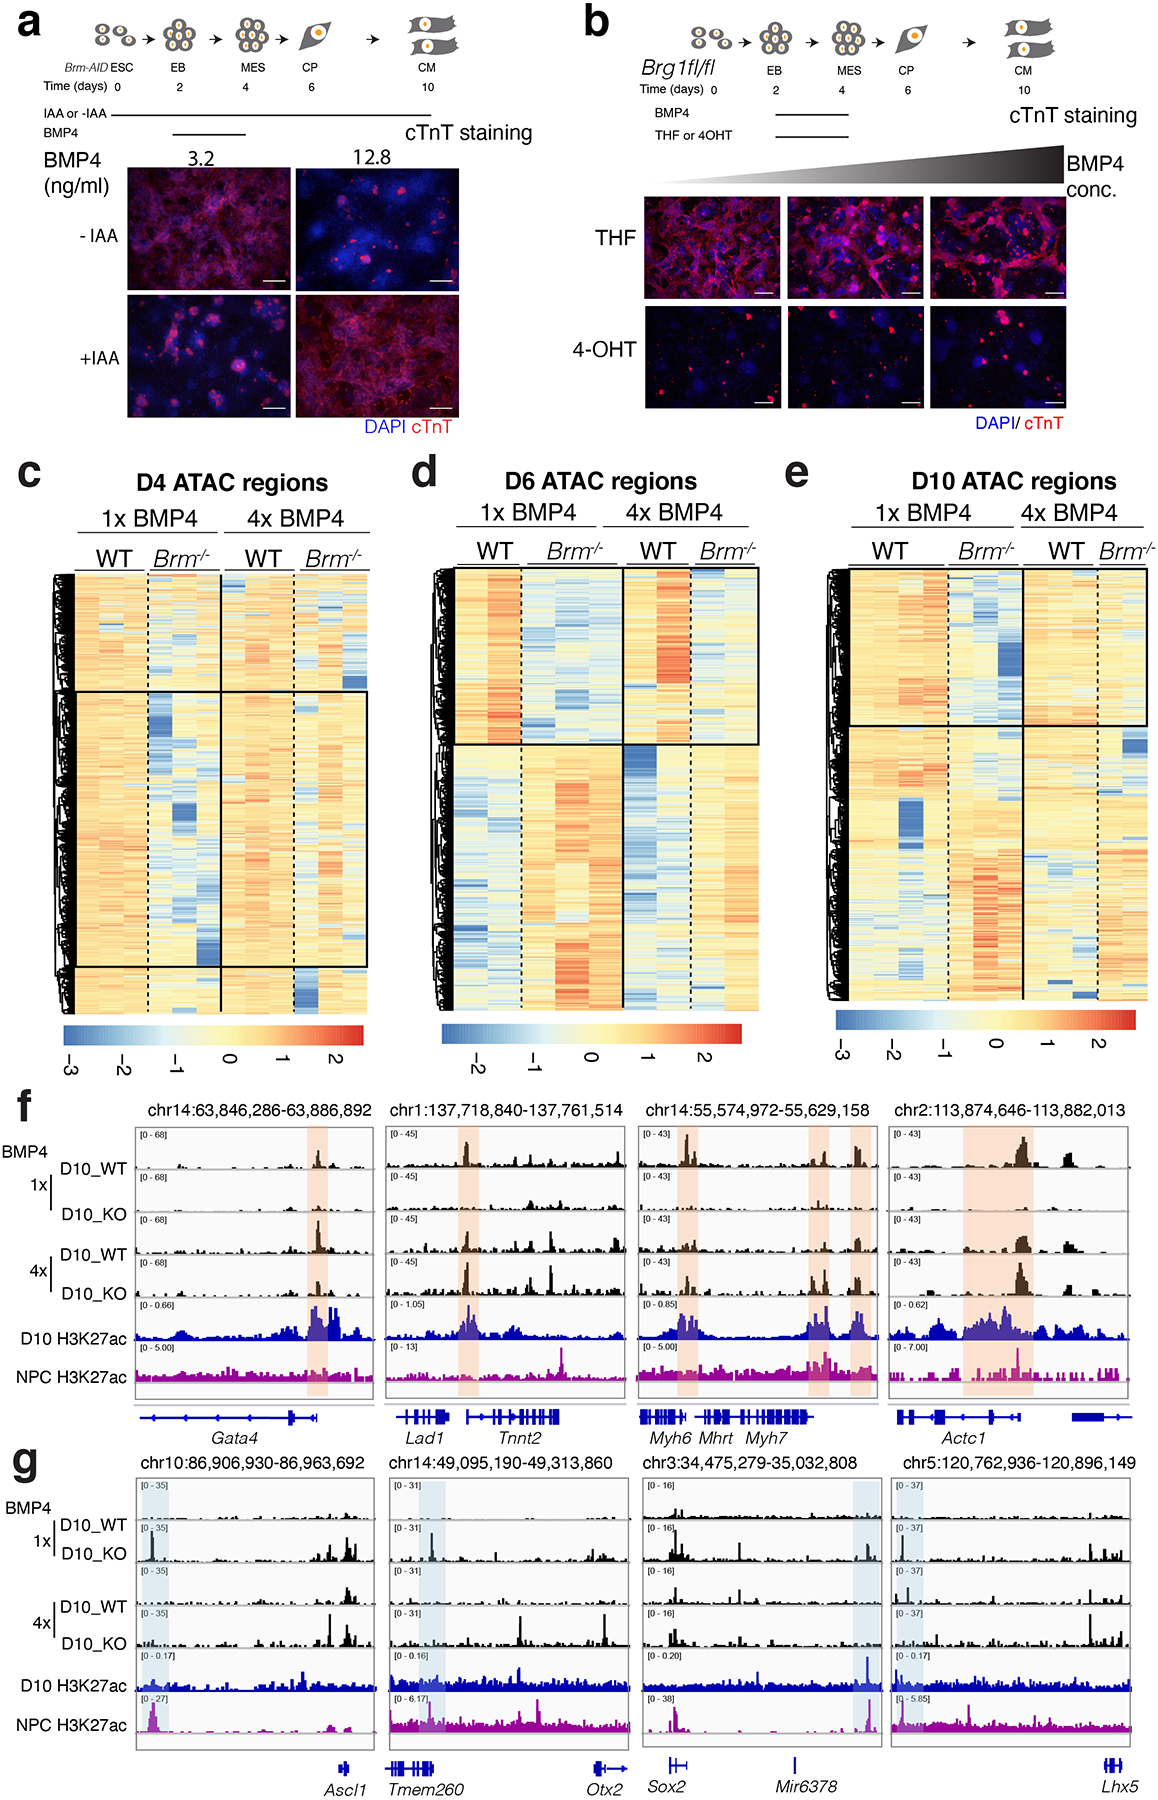
a, Scheme of cardiac differentiation showing timing of IAA and BMP4 addition. Cardiac troponin T (cTnT) immunostaining of an auxin inducible degron strain of BRM (Brm-AID) at D10 of differentiation induced with two different BMP4 concentrations with or without IAA present throughout the differentiation. b, Immunostaining with cTnT shows that Brg1 loss is not rescued by addition of increasing the amount of BMP4. Scale bars are 200μm. c-e, Heat maps showing differential enrichment of ATAC-seq peaks of WT and BRM KO cells at D4 (c), D6(d) and D10 (e) of cardiac differentiation with normal (1x) and high (4x) BMP4 concentrations. Boxed regions show restoration of WT-like chromatin in KO cells at high BMP4 condition. Vertical lanes show replicate data. f-g, Browser tracks show chromatin accessibility in WT and Brm−/− cells along with H3K27ac marks in cardiomyocytes and neural precursor cells (purple track) near indicated cardiac genes (f) and neural genes (g).
Extended Data Fig. 8. BMP4 restore WT-like gene expression in Brm−/− cells and increases gene expression noise in D4 cells.
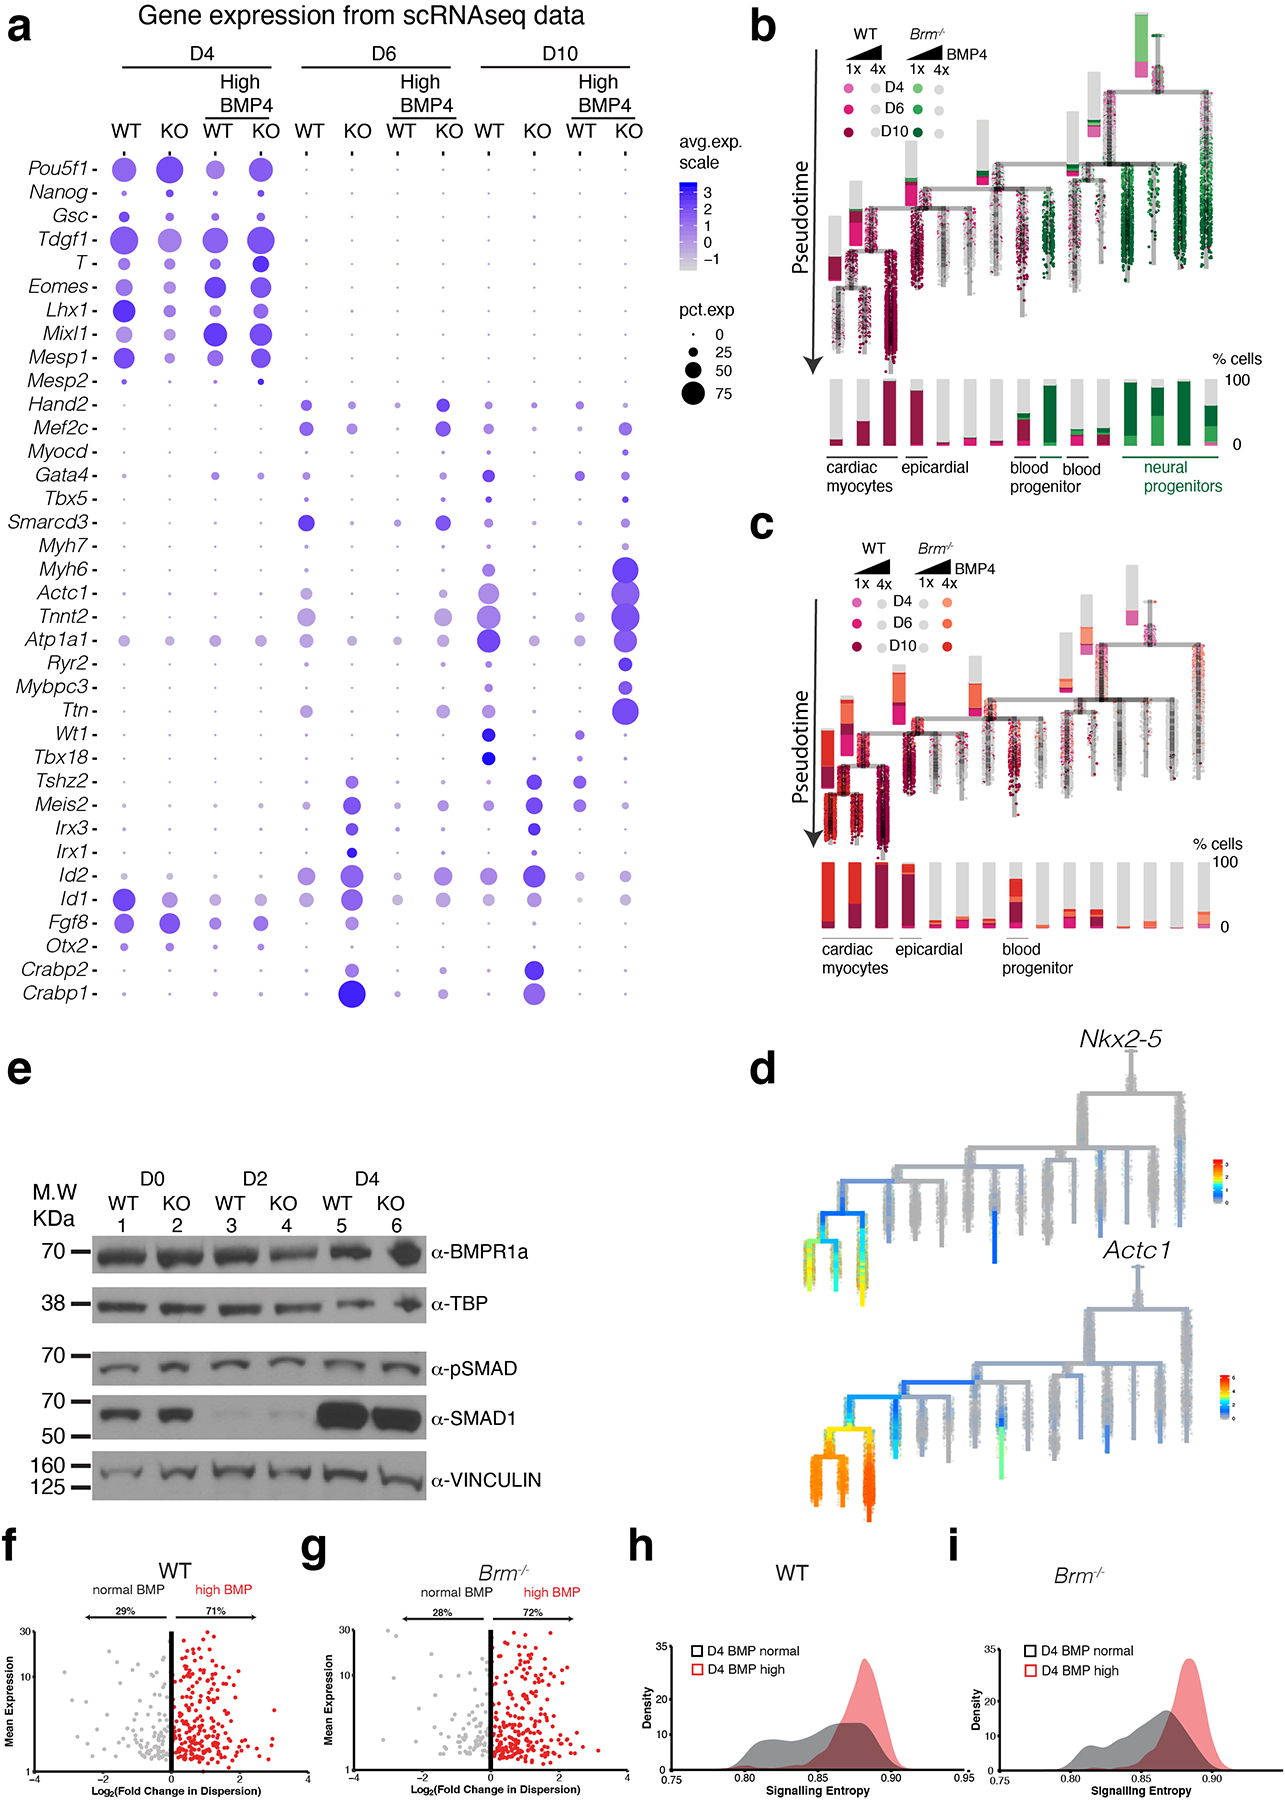
a, Dot plots showing quantitative changes in gene expression between WT and Brm−/− cells induced with normal (1x) or high (4x) BMP4 concentrations at D4, D6 and D10 stages of differentiation for early developmental, cardiac mesoderm, precursor, and myocyte genes enriched in BRM KO cells. b-d, Transcriptional trajectory analysis of WT and BRM KO cells showing the genotype representation in normal BMP4 concentration (b), normal BMP4 for WT and 4x BMP4 concentration for BRM KO cells (c) and URD feature plots of expression of Nkx2-;5, and Actc1 (d). e, Western blots showing BMP receptor, Smad1 and phospho-SMAD expression during D0 to D4 of cardiac differentiation, f-g, Scatter plots of single cell RNASeq data showing mean gene expression and variance from mean gene expression at D4 stage of differentiation for WT (f) and Brm−/− cells (g) in low and high BMP4 conditions. h-i, Signaling entropy calculated similarly for WT (h) and Brm−/− cells (i) with low and high BMP4 conditions.
Extended Data Fig. 9. Computational model using logic-based differential equations supports BRM’s role in cardiac and neural cell fate.
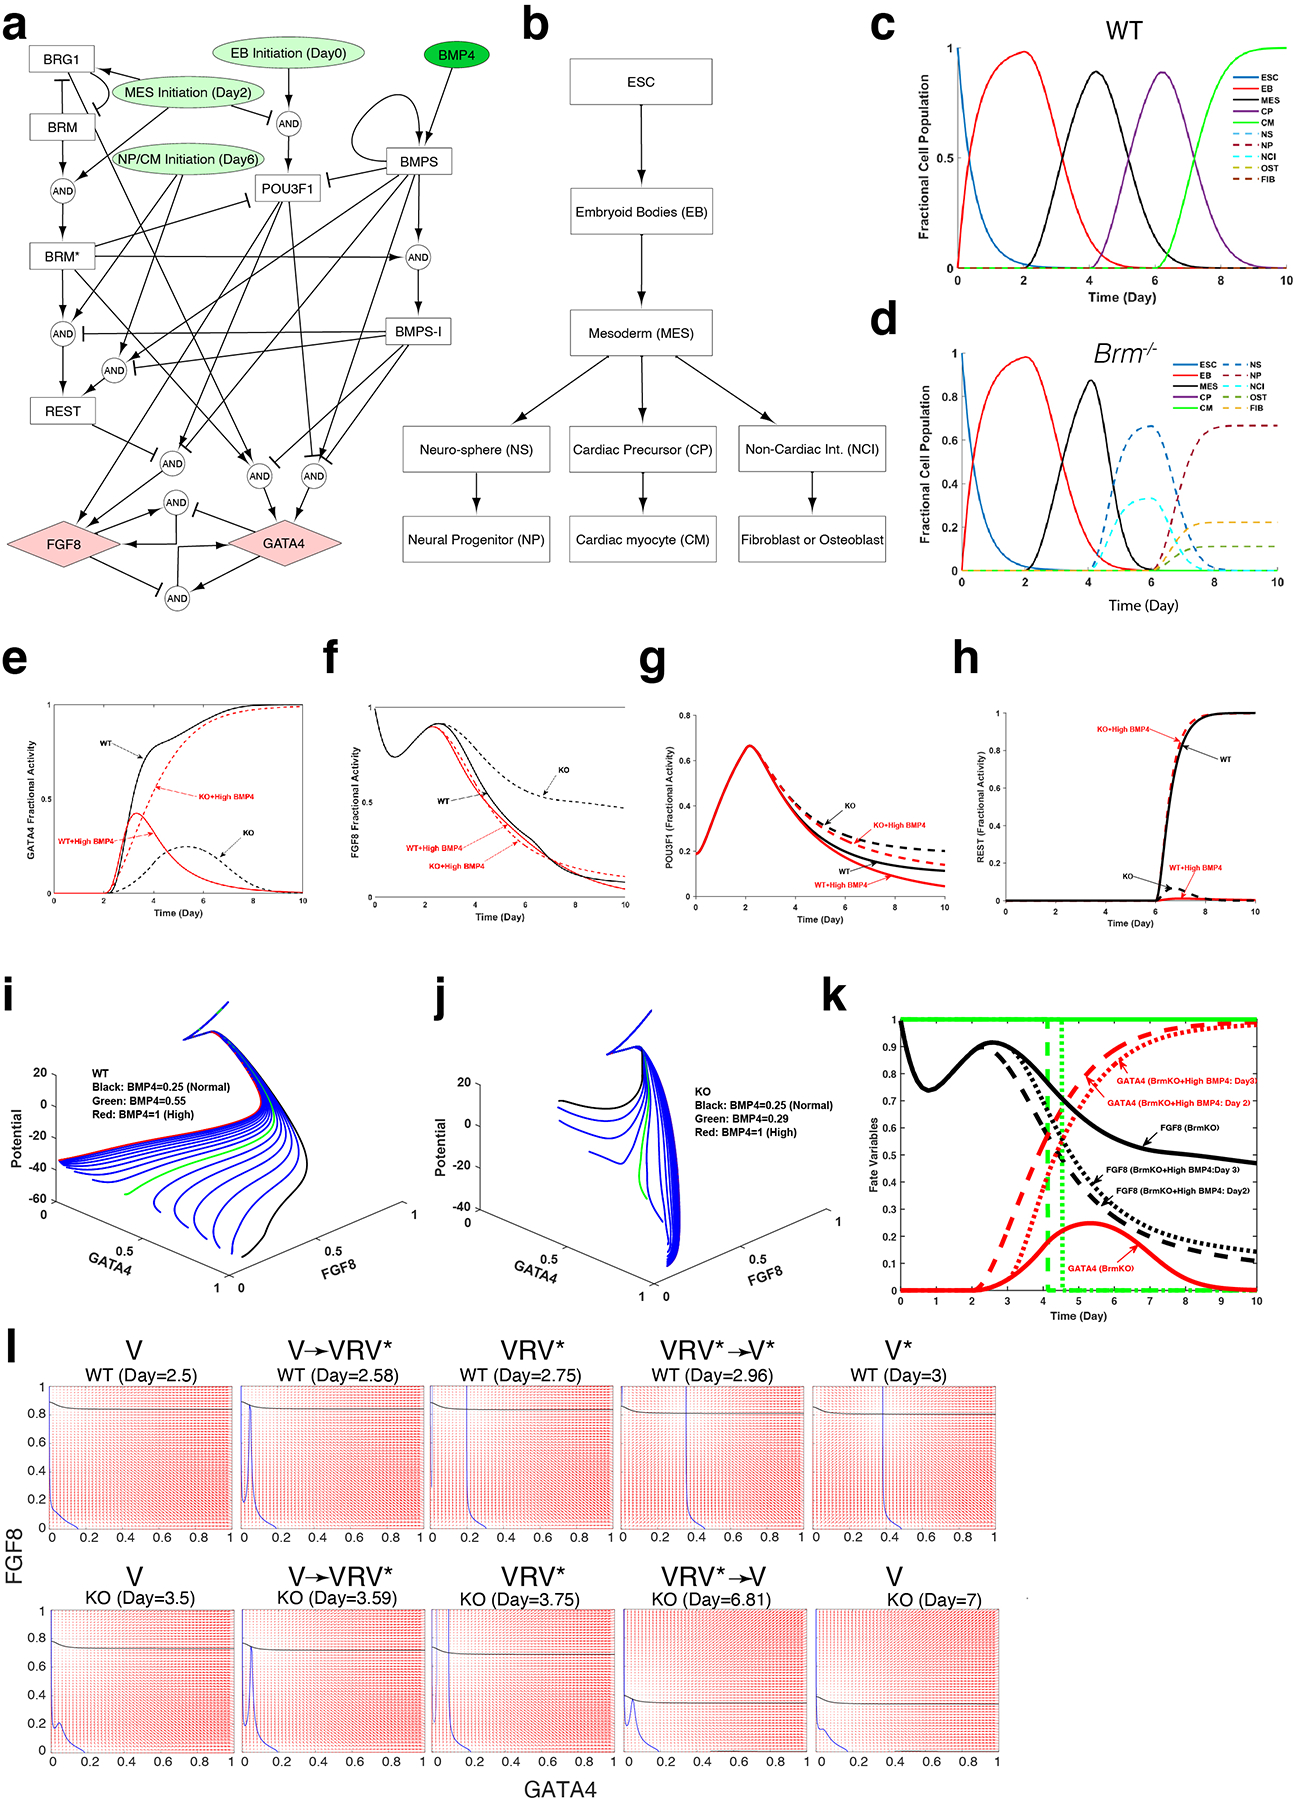
a, The model interaction graph including signaling components and transcription factors critical for cardiac differentiation. b-d, The model outputs determine the cell fate (b) and temporal variations in fractional cell population during cardiac differentiation for WT (c) and Brm−/− (d) cells. e-h, Model-predicted fractional activities of cardiac and neural transcription factors GATA4 (e), and FGF8 (f), as well as mediators of BRM POU3F1 (g) and REST (h) during cardiac differentiation. i-j, Model-predicted variations of quasi-potential landscape and subsequent path of WT (i) and Brm−/− (j) cells induced with different levels of BMP4 from normal (3.2 ng/ml) to high (12.8 ng/ml) during cardiac differentiation. k, Model simulation shows that Brm−/− cells (solid line) induced with high BMP4 at D3 (dotted line) would follow a path similar to that induced with D2 (dashed line) as computed from the GATA4 (red) and FGF8 (black) fractional activities, forming cardiomyocytes. Green line show fate variables with neural fate at 1 and cardiac fate at 0 and predicts D4 as the time of fate divergence. l, Phase portrait plots of bifurcation analysis of WT (upper panels) and BRM KO (lower panels) during indicated differentiation days. As differentiation progresses, WT cells undergo two sequential saddle-node bifurcations (V-> VRV* and VRV*-> V*) completing a hysteresis, while BRM KO cells undergo a saddle node bifurcation (V->VRV*) that reverses with a delay in differentiation timing (VRV*->V) with a dampened hysteresis. V= valley, R=ridge and V*= valley different from V
Extended Data Fig. 10. BRG1 compensates for BRM loss in vivo.
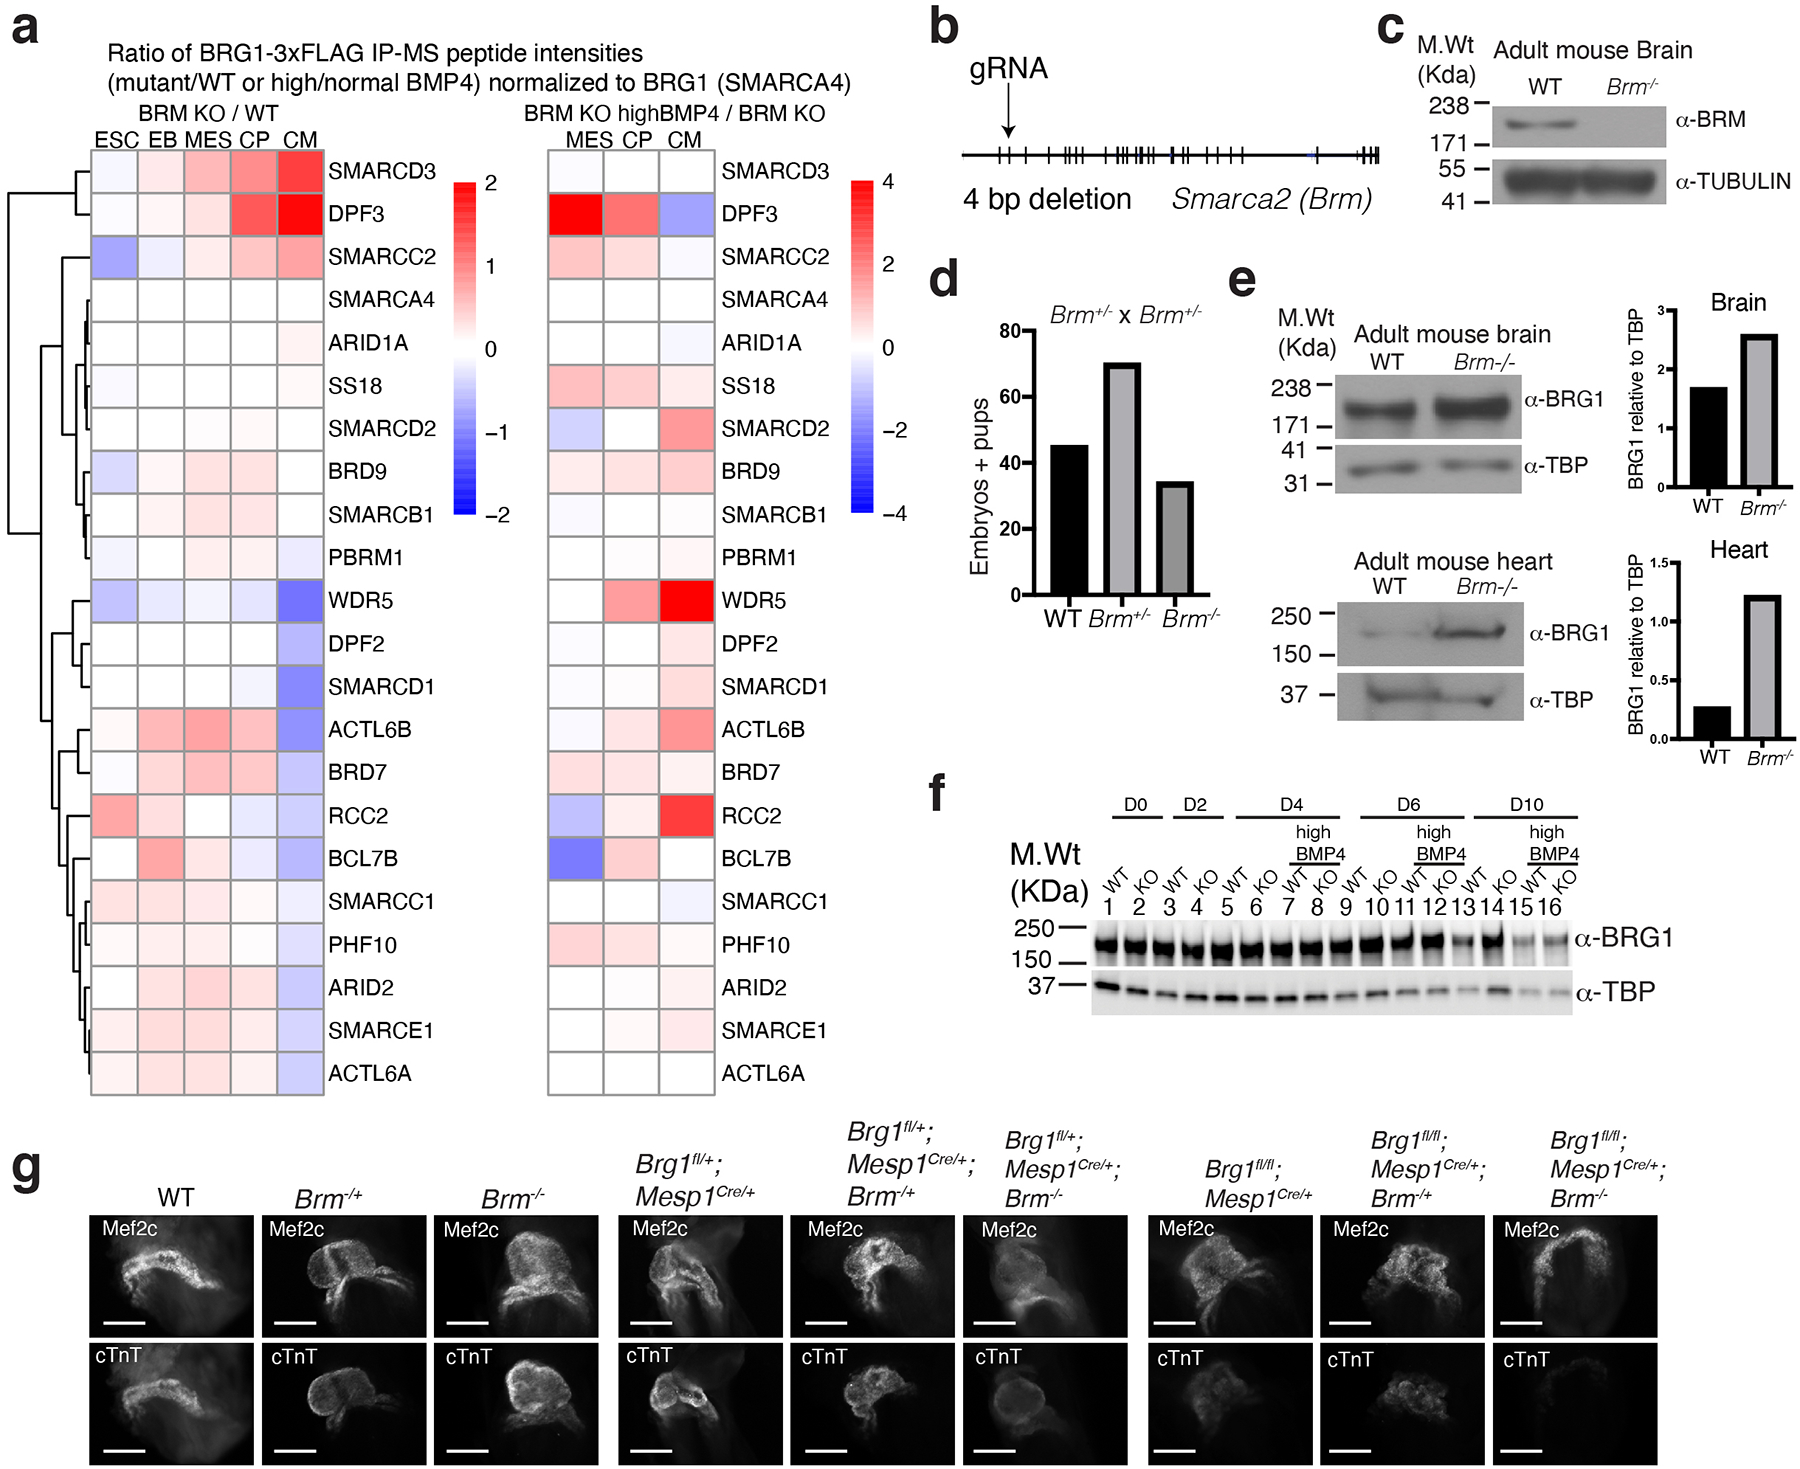
a, Anti-FLAG affinity purification of BRG1- complex followed by mass spectrometry. BRG1 (bait protein) normalized peptide intensity ratios of Brm−/− (Brg1-3xFLAG;Brm−/−) over WT (Brg1-3x FLAG) are plotted at five different stages of differentiation (left panel) and Brm−/− cells at high BMP4 over normal BMP4 at MES, CP and CM stages of differentiation (right panel). b, The exon–intron organization of Smarca2 (encodes BRM) and the site of guide RNA that targets exon2. The mouse strain from this transfection had a 4 bp deletion leading to premature stop codon. c, Western blot with anti-BRM antibody showing loss of BRM protein in Brm−/− mouse brain whole cell extract. α-tubulin is used as a loading control. d, Heterozygous Brm mouse mating resulted in pups and embryos at expected mendelian ratios. e-f, Western blot with antibody against BRG1 shows partial BRG1 compensation in absence of BRM in adult mouse brain (upper panel) and heart (lower panel) with quantifications shown to the right (e), but no compensation in the in vitro cardiac differentiation system (f) g, E 8.5 mouse embryos stained with MEF2c or cardiac troponin T (cTnT) for the indicated genotypes. Scale bars are 200μm.
Supplementary Material
Acknowledgements
We thank N. Carli, Y. Hao, M. Bernardi, and J. McGuire (Gladstone Genomics Core) for RNA-Seq and 10X Genomics library preparation, the UCSF Center for Applied Technologies for sequencing, E. Nora for help with Brm-AID strain construction, J. Zhang (Gladstone Transgenic Core) for knockout mouse generation, Gladstone Stem Cell Core for cell culture, R. Wang for ChIPseq, K. Choudhary for ATACseq analysis, K. Claiborn for editorial assistance, and G. Maki for graphics. This work was supported by grants from the NIH/NHLBI (P01HL089707 and P01HL146366 to B.G.B. and N.J.K., Bench to Bassinet Program UM1HL098179, and R01HL114948 to B.G.B., R01HL137755 to J.J.S.); and postdoctoral fellowships from the American Heart Association (13POST17290043), Tobacco Related Disease Research Program (22FT-0079), NIH training grant (2T32- HL007731 26) and career development award (861914) from the American Heart Association to S.K.H. I.S.K. was supported by funds from the Society for Pediatric Anesthesia, Hellman Family Fund, UCSF REAC Award and the UCSF Department of Anesthesia and Perioperative Care. This work was also supported by an NIH/NCRR grant (C06 RR018928) to the J. David Gladstone Institutes, The Roddenberry Foundation, and The Younger Family Fund (B.G.B.).
Competing interests:
B.G.B. is a co-founder and is a shareholder of Tenaya Therapeutics. and consults for and has equity in Silvercreek Pharmaceuticals. The work presented here is not related to the interests of Tenaya Therapeutics or Silvercreek Pharmaceuticals. The Krogan Laboratory has received research support from Vir Biotechnology and F. Hoffmann-La Roche. N.K. has consulting agreements with the Icahn School of Medicine at Mount Sinai, New York, Maze Therapeutics and Interline Therapeutics, is a shareholder of Tenaya Therapeutics and has received stocks from Maze Therapeutics and Interline Therapeutics. All other authors declare no competing interest.
Footnotes
Code availability
Open source GitHub repository codes are provided for single cell data analysis https://github.com/swhota/Brm-scripts, mathematical modeling of Brahma with definitions of all model state variables, parameters, parameter values, and interactions https://github.com/mkm1712/Brahma_model, logic-based differential equations generation using Netflux (https://github.com/saucermanlab/Netflux), peaks from ChIPseq and ATACseq datasets (https://github.com/gladstone-institutes/Hota_et_al_2021_Brm_safeguards_canalization_cardiac_diff) and the pipeline for automated ChIPseq and ATACseq data processing https://github.com/gladstone-institutes/MonkeyPipeline
Data availability
Bulk and single cell RNAseq, ATACseq, and ChIPseq datasets have been deposited in GEO under accession number GSE150186 and mass spectrometry proteomics data to the ProteomeXchange Consortium with the dataset identifier PXD026638.
References
- 1.Waddington CH The Strategy of the Genes, a Discussion of Some Aspects of Theoretical Biology. 20, (George Allen & Unwin Ltd, 1957). [Google Scholar]
- 2.Ferrell JE Jr. Bistability, Bifurcations, and Waddington’s Epigenetic Landscape. Current Biology 22, R458–R466 (2012). [DOI] [PMC free article] [PubMed] [Google Scholar]
- 3.Reyes JC et al. Altered control of cellular proliferation in the absence of mammalian brahma (SNF2alpha). The EMBO Journal 17, 6979–6991 (1998). [DOI] [PMC free article] [PubMed] [Google Scholar]
- 4.Van Houdt JKJ et al. Heterozygous missense mutations in SMARCA2 cause Nicolaides-Baraitser syndrome. Nat Genet 44, 445–9–S1 (2012). [DOI] [PubMed] [Google Scholar]
- 5.Tsurusaki Y et al. Mutations affecting components of the SWI/SNF complex cause Coffin-Siris syndrome. Nat Genet 44, 376–378 (2012). [DOI] [PubMed] [Google Scholar]
- 6.Kadoch C Diverse compositions and functions of chromatin remodeling machines in cancer. Sci Transl Med 11, (2019). [DOI] [PMC free article] [PubMed] [Google Scholar]
- 7.Hoffman GR et al. Functional epigenetics approach identifies BRM/SMARCA2 as a critical synthetic lethal target in BRG1-deficient cancers. Proc. Natl. Acad. Sci. U.S.A 111, 3128–3133 (2014). [DOI] [PMC free article] [PubMed] [Google Scholar]
- 8.Smith-Roe SL & Bultman SJ Combined gene dosage requirement for SWI/SNF catalytic subunits during early mammalian development. Mamm. Genome 24, 21–29 (2013). [DOI] [PMC free article] [PubMed] [Google Scholar]
- 9.Bultman SJ et al. BRG1 and BRM SWI/SNF ATPases redundantly maintain cardiomyocyte homeostasis by regulating cardiomyocyte mitophagy and mitochondrial dynamics in vivo. Cardiovascular Pathology 25, 258–269 (2016). [DOI] [PMC free article] [PubMed] [Google Scholar]
- 10.Wolf FA et al. PAGA: graph abstraction reconciles clustering with trajectory inference through a topology preserving map of single cells. Genome Biol. 20, 59–9 (2019). [DOI] [PMC free article] [PubMed] [Google Scholar]
- 11.Farrell JA et al. Single-cell reconstruction of developmental trajectories during zebrafish embryogenesis. Science 360, (2018). [DOI] [PMC free article] [PubMed] [Google Scholar]
- 12.Gouti M et al. A Gene Regulatory Network Balances Neural and Mesoderm Specification during Vertebrate Trunk Development. Developmental Cell 41, 243–261.e7 (2017). [DOI] [PMC free article] [PubMed] [Google Scholar]
- 13.Thomson M et al. Pluripotency Factors in Embryonic Stem Cells Regulate Differentiation into Germ Layers. Cell 145, 875–889 (2011). [DOI] [PMC free article] [PubMed] [Google Scholar]
- 14.Hota SK et al. Dynamic BAF chromatin remodeling complex subunit inclusion promotes temporally distinct gene expression programs in cardiogenesis. Development 146, dev174086 (2019). [DOI] [PMC free article] [PubMed] [Google Scholar]
- 15.Takeuchi JK et al. Chromatin remodelling complex dosage modulates transcription factor function in heart development. Nature Communications 2, 187–11 (2011). [DOI] [PMC free article] [PubMed] [Google Scholar]
- 16.Corces MR et al. An improved ATAC-seq protocol reduces background and enables interrogation of frozen tissues. Nat Meth 14, 959–962 (2017). [DOI] [PMC free article] [PubMed] [Google Scholar]
- 17.Weber CM et al. mSWI/SNF promotes Polycomb repression both directly and through genome-wide redistribution. Nature Structural & Molecular Biology 28, 501–511 (2021). [DOI] [PMC free article] [PubMed] [Google Scholar]
- 18.Zhu Q et al. The transcription factor Pou3f1 promotes neural fate commitment via activation of neural lineage genes and inhibition of external signaling pathways. Elife 3, (2014). [DOI] [PMC free article] [PubMed] [Google Scholar]
- 19.Battaglioli E et al. REST repression of neuronal genes requires components of the hSWI.SNF complex. Journal of Biological Chemistry 277, 41038–41045 (2002). [DOI] [PubMed] [Google Scholar]
- 20.Kattman SJ et al. Stage-specific optimization of activin/nodal and BMP signaling promotes cardiac differentiation of mouse and human pluripotent stem cell lines. Cell Stem Cell 8, 228–240 (2011). [DOI] [PubMed] [Google Scholar]
- 21.Paulsen M, Legewie S, Eils R, Karaulanov E & Niehrs C Negative feedback in the bone morphogenetic protein 4 (BMP4) synexpression group governs its dynamic signaling range and canalizes development. Proc. Natl. Acad. Sci. U.S.A 108, 10202–10207 (2011). [DOI] [PMC free article] [PubMed] [Google Scholar]
- 22.Arias AM & Hayward P Filtering transcriptional noise during development: concepts and mechanisms. Nat Rev Genet 7, 34–44 (2006). [DOI] [PubMed] [Google Scholar]
- 23.Bier E & De Robertis EM BMP gradients: A paradigm for morphogen-mediated developmental patterning. Science 348, aaa5838 (2015). [DOI] [PubMed] [Google Scholar]
- 24.Kraeutler MJ, Soltis AR & Saucerman JJ Modeling cardiac β-adrenergic signaling with normalized-Hill differential equations: comparison with a biochemical model. BMC Syst Biol 4, 157–12 (2010). [DOI] [PMC free article] [PubMed] [Google Scholar]
- 25.Lessard J et al. An Essential Switch in Subunit Composition of a Chromatin Remodeling Complex during Neural Development. Neuron 55, 201–215 (2007). [DOI] [PMC free article] [PubMed] [Google Scholar]
- 26.Lamba DA, Hayes S, Karl MO & Reh T Baf60c is a component of the neural progenitor-specific BAF complex in developing retina. Dev. Dyn 237, 3016–3023 (2008). [DOI] [PMC free article] [PubMed] [Google Scholar]
- 27.Zuryn S et al. Sequential histone-modifying activities determine the robustness of transdifferentiation. Science 345, 826–829 (2014). [DOI] [PubMed] [Google Scholar]
- 28.Molina-García L et al. Direct glia-to-neuron transdifferentiation gives rise to a pair of male-specific neurons that ensure nimble male mating. Elife 9, (2020). [DOI] [PMC free article] [PubMed] [Google Scholar]
- 29.Jiang Z et al. Knockdown of Brm and Baf170, Components of Chromatin Remodeling Complex, Facilitates Reprogramming of Somatic Cells. Stem Cells and Development 24, 2328–2336 (2015). [DOI] [PMC free article] [PubMed] [Google Scholar]
- 30.Treutlein B et al. Dissecting direct reprogramming from fibroblast to neuron using single-cell RNA-seq. Nature 534, 391–395 (2016). [DOI] [PMC free article] [PubMed] [Google Scholar]
- 31.Wamstad JA et al. Dynamic and coordinated epigenetic regulation of developmental transitions in the cardiac lineage. Cell 151, 206–220 (2012). [DOI] [PMC free article] [PubMed] [Google Scholar]
- 32.Alexander JM et al. Brg1 modulates enhancer activation in mesoderm lineage commitment. Development 142, 1418–1430 (2015). [DOI] [PMC free article] [PubMed] [Google Scholar]
- 33.Ho L et al. An embryonic stem cell chromatin remodeling complex, esBAF, is essential for embryonic stem cell self-renewal and pluripotency. Proc. Natl. Acad. Sci. U.S.A 106, 5181–5186 (2009). [DOI] [PMC free article] [PubMed] [Google Scholar]
- 34.Conti L et al. Niche-Independent Symmetrical Self-Renewal of a Mammalian Tissue Stem Cell. PLoS Biol 3, e283–13 (2005). [DOI] [PMC free article] [PubMed] [Google Scholar]
- 35.Cong L et al. Multiplex genome engineering using CRISPR/Cas systems. Science 339, 819–823 (2013). [DOI] [PMC free article] [PubMed] [Google Scholar]
- 36.Nora EP et al. Targeted Degradation of CTCF Decouples Local Insulation of Chromosome Domains from Genomic Compartmentalization. Cell 169, 930–944.e22 (2017). [DOI] [PMC free article] [PubMed] [Google Scholar]
- 37.Abmayr SM, Yao T, Parmely T & Workman JL Preparation of nuclear and cytoplasmic extracts from mammalian cells. Curr Protoc Pharmacol Chapter 12, Unit12.3–12.3.10 (2006). [DOI] [PubMed] [Google Scholar]
- 38.Kim D et al. TopHat2: accurate alignment of transcriptomes in the presence of insertions, deletions and gene fusions. Genome Biol. 14, R36 (2013). [DOI] [PMC free article] [PubMed] [Google Scholar]
- 39.Liao Y, Smyth GK & Shi W featureCounts: an efficient general purpose program for assigning sequence reads to genomic features. Bioinformatics 30, 923–930 (2014). [DOI] [PubMed] [Google Scholar]
- 40.Robinson MD, McCarthy DJ & Smyth GK edgeR: a Bioconductor package for differential expression analysis of digital gene expression data. Bioinformatics 26, 139–140 (2010). [DOI] [PMC free article] [PubMed] [Google Scholar]
- 41.Zambon AC et al. GO-Elite: a flexible solution for pathway and ontology over-representation. Bioinformatics 28, 2209–2210 (2012). [DOI] [PMC free article] [PubMed] [Google Scholar]
- 42.Satija R, Farrell JA, Gennert D, Schier AF & Regev A Spatial reconstruction of single-cell gene expression data. Nat. Biotechnol 33, 495–502 (2015). [DOI] [PMC free article] [PubMed] [Google Scholar]
- 43.McInnes L, Healy J & Melville J UMAP: Uniform Manifold Approximation and Projection for Dimension Reduction. arXiv.org stat.ML, arXiv:1802.03426 (2018). [Google Scholar]
- 44.McGinnis CS, Murrow LM & Gartner ZJ DoubletFinder: Doublet Detection in Single-Cell RNA Sequencing Data Using Artificial Nearest Neighbors. Cell Systems 8, 329–337.e4 (2019). [DOI] [PMC free article] [PubMed] [Google Scholar]
- 45.Lambiotte R, Delvenne JC & Barahona M Laplacian Dynamics and Multiscale Modular Structure in Networks. arXiv.org physics.soc-ph, (2008). [Google Scholar]
- 46.Teschendorff AE & Enver T Single-cell entropy for accurate estimation of differentiation potency from a cell’s transcriptome. Nature Communications 8, 15599 (2017). [DOI] [PMC free article] [PubMed] [Google Scholar]
- 47.Eling N, Richard AC, Richardson S, Marioni JC & Vallejos CA Correcting the Mean-Variance Dependency for Differential Variability Testing Using Single-Cell RNA Sequencing Data. Cell Systems 7, 284–294.e12 (2018). [DOI] [PMC free article] [PubMed] [Google Scholar]
- 48.Wang J, Zhang K, Xu L & Wang E Quantifying the Waddington landscape and biological paths for development and differentiation. Proc. Natl. Acad. Sci. U.S.A 108, 8257–8262 (2011). [DOI] [PMC free article] [PubMed] [Google Scholar]
- 49.Waddington CH Canalization of Development and the Inheritance of Acquired Characters. Nature 150, 563–565 (1942). [Google Scholar]
- 50.Bhattacharya S, Zhang Q & Andersen ME A deterministic map of Waddington’s epigenetic landscape for cell fate specification. BMC Syst Biol 5, 85–12 (2011). [DOI] [PMC free article] [PubMed] [Google Scholar]
- 51.O’Geen H, Echipare L & Farnham PJ Using ChIP-seq technology to generate high-resolution profiles of histone modifications. Methods Mol. Biol 791, 265–286 (2011). [DOI] [PMC free article] [PubMed] [Google Scholar]
- 52.Langmead B & Salzberg SL Fast gapped-read alignment with Bowtie 2. Nat Meth 9, 357–359 (2012). [DOI] [PMC free article] [PubMed] [Google Scholar]
- 53.Zhang Y et al. Model-based analysis of ChIP-Seq (MACS). Genome Biol. 9, R137–9 (2008). [DOI] [PMC free article] [PubMed] [Google Scholar]
- 54.Xing H, Mo Y, Liao W & Zhang MQ Genome-Wide Localization of Protein-DNA Binding and Histone Modification by a Bayesian Change-Point Method with ChIP-seq Data. PLoS Comput Biol 8, e1002613–12 (2012). [DOI] [PMC free article] [PubMed] [Google Scholar]
- 55.Neph S et al. BEDOPS: high-performance genomic feature operations. Bioinformatics 28, 1919–1920 (2012). [DOI] [PMC free article] [PubMed] [Google Scholar]
- 56.McCarthy DJ, Chen Y & Smyth GK Differential expression analysis of multifactor RNA-Seq experiments with respect to biological variation. Nucleic Acids Research 40, 4288–4297 (2012). [DOI] [PMC free article] [PubMed] [Google Scholar]
- 57.Afgan E et al. The Galaxy platform for accessible, reproducible and collaborative biomedical analyses: 2018 update. Nucleic Acids Research 46, W537–W544 (2018). [DOI] [PMC free article] [PubMed] [Google Scholar]
- 58.McLean CY et al. GREAT improves functional interpretation of cis-regulatory regions. Nat. Biotechnol 28, 495–501 (2010). [DOI] [PMC free article] [PubMed] [Google Scholar]
- 59.Heinz S et al. Simple combinations of lineage-determining transcription factors prime cis-regulatory elements required for macrophage and B cell identities. Molecular Cell 38, 576–589 (2010). [DOI] [PMC free article] [PubMed] [Google Scholar]
- 60.Cox J & Mann M MaxQuant enables high peptide identification rates, individualized p.p.b.-range mass accuracies and proteome-wide protein quantification. Nat. Biotechnol 26, 1367–1372 (2008). [DOI] [PubMed] [Google Scholar]
- 61.Choi M et al. MSstats: an R package for statistical analysis of quantitative mass spectrometry-based proteomic experiments. Bioinformatics 30, 2524–2526 (2014). [DOI] [PubMed] [Google Scholar]
- 62.Ritchie ME et al. limma powers differential expression analyses for RNA-sequencing and microarray studies. Nucleic Acids Research 43, e47 (2015). [DOI] [PMC free article] [PubMed] [Google Scholar]
- 63.Venables WN & Ripley BD Modern applied statistics with S, 4th Edition. Statistics and computing (2002). [Google Scholar]
- 64.Perez-Riverol Y et al. The PRIDE database and related tools and resources in 2019: improving support for quantification data. Nucleic Acids Research 47, D442–D450 (2018). [DOI] [PMC free article] [PubMed] [Google Scholar]
- 65.Rhee HS et al. Expression of Terminal Effector Genes in Mammalian Neurons Is Maintained by a Dynamic Relay of Transient Enhancers. Neuron 92, 1252–1265 (2016). [DOI] [PMC free article] [PubMed] [Google Scholar]
Associated Data
This section collects any data citations, data availability statements, or supplementary materials included in this article.
Supplementary Materials
Data Availability Statement
Bulk and single cell RNAseq, ATACseq, and ChIPseq datasets have been deposited in GEO under accession number GSE150186 and mass spectrometry proteomics data to the ProteomeXchange Consortium with the dataset identifier PXD026638.


