Summary
Real world memories are formed in a particular context and are often not acquired or recalled in isolation 1–5. Time is a key variable in the organization of memories, since events experienced close in time are more likely to be meaningfully associated, while those experienced with a longer interval are not1–4. How does the brain segregate events that are temporally distinct? Here, we report that a delayed (12-24h) increase in the expression of the C-C chemokine receptor type 5 (CCR5), an immune receptor well known as a co-receptor for HIV infection6,7, following the formation of a contextual memory, determines the duration of the temporal window for associating or linking that memory with subsequent memories. This delayed CCR5 expression in mouse dorsal CA1 (dCA1) neurons results in a decrease in neuronal excitability, which in turn negatively regulates neuronal memory allocation, thus reducing the overlap between dCA1 memory ensembles. Lowering this overlap affects the ability of one memory to trigger the recall of the other, thus closing the temporal window for memory linking. Remarkably, our findings also show that an age-related increase in neuronal CCL5/CCR5 expression leads to impairments in memory linking in aged mice, which could be reversed with a Ccr5 knockout and an FDA approved drug that inhibits this receptor, a result with significant clinical implications. All together the findings reported here provide the first insights into the molecular and cellular mechanisms that shape the temporal window for memory linking.
Memory formation can be affected by previous experiences. For example, memories acquired close in time often become linked such that the retrieval of one increases the likelihood of retrieving the other (i.e., memory linking). Abnormal memory linking (e.g., improper relational memory), is involved in psychiatric disorders such as post-traumatic stress disorder and schizophrenia8,9. However, very little is known about the mechanisms that regulate interactions amongst memories. Activation of CREB and subsequent increases in neuronal excitability are thought to open the temporal window for memory linking, so that a given neuronal ensemble involved in encoding one memory is more likely to participate in encoding a second memory acquired close in time2,10–13. Accordingly, the neuronal overlap between memory ensembles has been shown to be critical for memory linking1–3. In contrast, little is known about the mechanisms that segregate events that are temporally distinct. CCR5 has been extensively studied in the context of inflammatory responses and HIV infection6,7. However, comparatively little is known about its role in learning and memory. Both CCR5 and its ligand CCL5 are highly enriched in the CA1 region of the hippocampus14–16, and CCR5 is a negative regulator of CREB activation and neuronal excitability15,17. Here, we demonstrate that a gradual increase in the expression of CCL5/CCR5 following memory formation closes the temporal window for memory linking, thus segregating memories that are temporally distinct.
CCR5 expression is enhanced after learning
To explore CCR5’s role in contextual memory linking, where the memory of one context is associated or linked to the memory of a second context1, we first tested whether the expression of CCR5 and its ligands changes after contextual fear conditioning (Fig. 1a) in a brain region critical for this form of learning (i.e., dCA1). Compared to expression levels in mice that stayed in their home cage (HC), both Ccr5 and Ccl5 mRNA increased 12 hours (12h) after contextual conditioning (Fig. 1b, c), while there were no significant changes in the expression of other CCR5 ligands tested (Ccl3, Ccl4 and Ccl11; Extended Data Fig. 1a–d). Next, we used in situ hybridization to determine the hippocampal cellular distribution of this learning-induced increase in Ccr5 expression (Fig. 1d). Although in dCA1 of HC mice there were more Ccr5-expressing microglia than Ccr5-expressing neurons (Fig. 1e), there was a dramatic increase in Ccr5-expressing neurons, but not microglia, at 6h and 12h after contextual conditioning (Fig. 1f). Further analysis showed that the increase was mainly in excitatory neurons (Extended Data Fig. 1e, f). Unlike Ccr5, in dCA1 of HC mice there were more Ccl5-expressing neurons than Ccl5-expressing microglia, which is consistent with previous report14, while no obvious changes in the number of Ccl5-expressing neurons or microglia were observed (Extended Data Fig. 1g–i). To examine whether Ccr5 is primarily expressed in memory ensemble cells after learning, we used either the cFos-tTA transgenic mice and AAV-TRE-mCherry virus to label neurons involved in contextual memory, or the ChR2 E123T/T159C (ETTC) to pre-activate a set of neurons before contextual learning to increase the probability that these neurons would be involved in the contextual memory18. With both methods, we found that Ccr5 had a significantly higher probability to be expressed in memory ensemble cells than chance (Extended Data Fig. 2).
Fig. 1|. CCR5 expression and activation in the dorsal hippocampus after contextual fear conditioning.
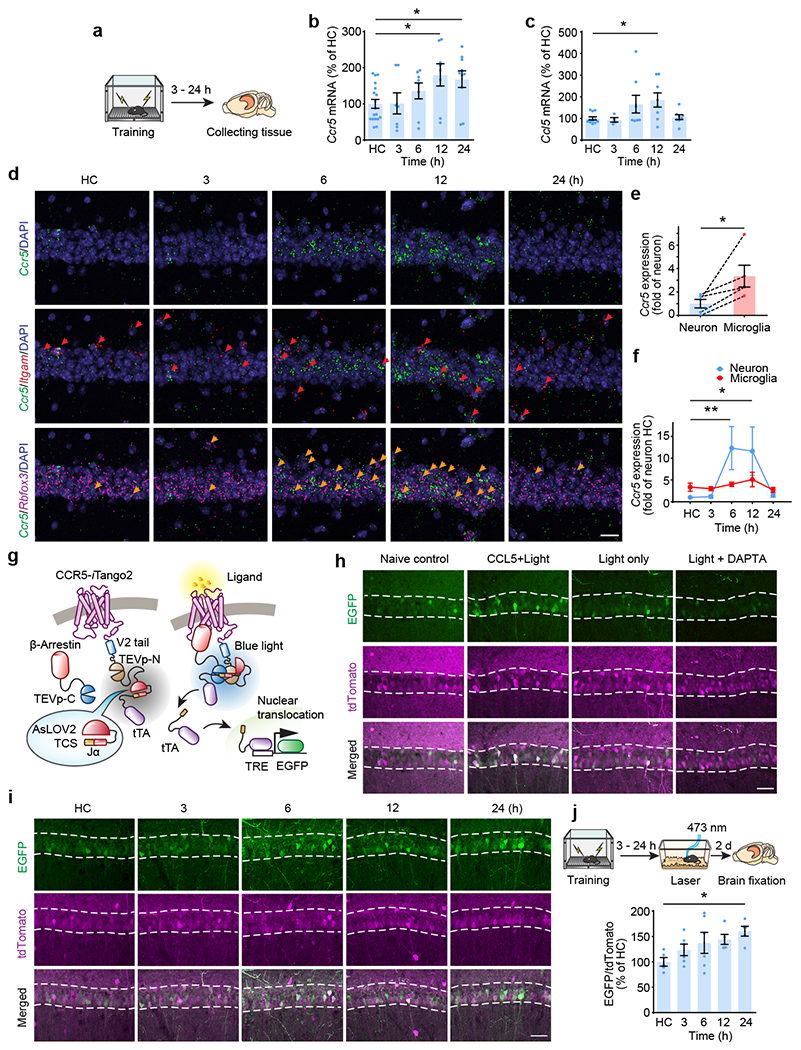
a-c, mRNA levels of Ccr5 (b) and Ccl5 (c) in mouse dCA1 at 3-24h after fear conditioning (a). Tissue (dCA1) from home cage (HC) mice was collected at the same time points (3-24h) and pooled together as the control HC group. Results were normalized to HC (Ccr5: HC n=18, 3 h n=7, 6 h n=8, 12 h n=8, 24 h n=10 mice; Ccl5: HC n=11, 3 h n=4, 6 h n=8, 12 h n=8, 24 h n=8 mice; *P < 0.05, one-way ANOVA).
d, Representative images of Ccr5, Itgam (microglial marker), and Rbfox3 (neuronal marker) mRNA expression in dCA1 from naïve mice or mice 3-24h after fear conditioning. Red arrows: cells expressing Ccr5 and Itgam. Orange arrows: cells expressing Ccr5 and Rbfox3. Scale bar, 20 μm.
e, Number of Ccr5-expressing microglia and neurons in naïve mice (n=5 mice per group; *P < 0.05, paired t-test).
f, Number of Ccr5-expressing microglia and neurons 3-24h after fear conditioning (HC n=5, 3 h n=4, 6 h n=5, 12 h n=4, 24 h n=4 mice; *P < 0.05, **P < 0.01, two-way repeated measures ANOVA).
g, Schematics for CCR5-iTango2.
h, Representative images of CCR5-iTango2-expressing dCA1 neurons after treatment with CCL5, DAPTA (CCR5 antagonist) and light stimulation. Scale bar, 50 μm.
i, Representative images of CCR5-iTango2-expressing dCA1 neurons after fear conditioning. Scale bar, 50 μm.
j, Quantification of EGFP expression (intensity normalized to tdTomato which is tagged to β-Arrestin through P2A, reflecting expression of the iTango system. HC n=5, 3 h n=6, 6 h n=6, 12 h n=5, 24 h n=5 mice; *P < 0.05, one-way ANOVA).
All results shown as mean ± s.e.m.
In addition to CCR5 expression, we also measured neuronal CCR5 activity after learning with the iTango2 system19 (Fig. 1g). The light- and ligand-gated gene expression system we constructed (CCR5-iTango2) enables cellular expression of a reporter gene (i.e., EGFP) only in the presence of both CCR5 ligand(s) and blue-light exposure (detailed information in Methods). When tested in either HEK293 cells (Extended Data Fig. 3a–j), in dCA1 (Fig. 1h; Extended Data Fig. 4a–f), or in the dentate gyrus (Extended Data Fig. 3k–m), CCR5-iTango2 showed a significant increase in EGFP expression only when both light and ligand (CCL5) were present, demonstrating that CCR5-iTango2 is capable of monitoring ligand dependent CCR5 activation. Therefore, CCR5-iTango2 viruses were injected into mouse dCA1, and 3 weeks later mice were trained with contextual fear conditioning. Compared to HC controls, there was a gradual increase in neuronal CCR5 activity in trained mice over time after conditioning (Fig. 1i, j), a result consistent with the delayed expression patterns of CCR5 and CCL5 presented above (Fig. 1b, c and f). Notably, CCR5 activation measured by CCR5-iTango2 also showed a selectivity for memory ensemble cells after learning (Extended Data Fig. 4g–i).
Overall, our results demonstrated that after contextual learning there was a delayed (12-24h) increase in CCL5/CCR5 signaling in dCA1 neurons, especially in the neurons involved in contextual learning.
CCR5 regulates contextual memory linking
To determine whether CCR5 modulates the temporal window for contextual memory linking1, we first exposed the mice to one context (context A) and either 5h, 1, 2 or 7 days later we exposed the mice to a second context (context B) (Fig. 2a). Two days later, the mice were given an immediate shock in context B, and then contextual memory linking was tested 2d later in context A. During the memory linking test, the 5h group showed higher freezing (i.e., higher linking) than the 1d, 2d or the 7d groups. This result shows that contextual memory linking decreases significantly between 5h and 1d, indicating a time course parallel to the increase in CCR5 signaling after learning (Fig. 1). Therefore, we subsequently investigated whether increasing or inhibiting CCR5 signaling affected the temporal window for contextual memory linking.
Fig. 2|. CCR5 regulates the temporal window of memory linking.
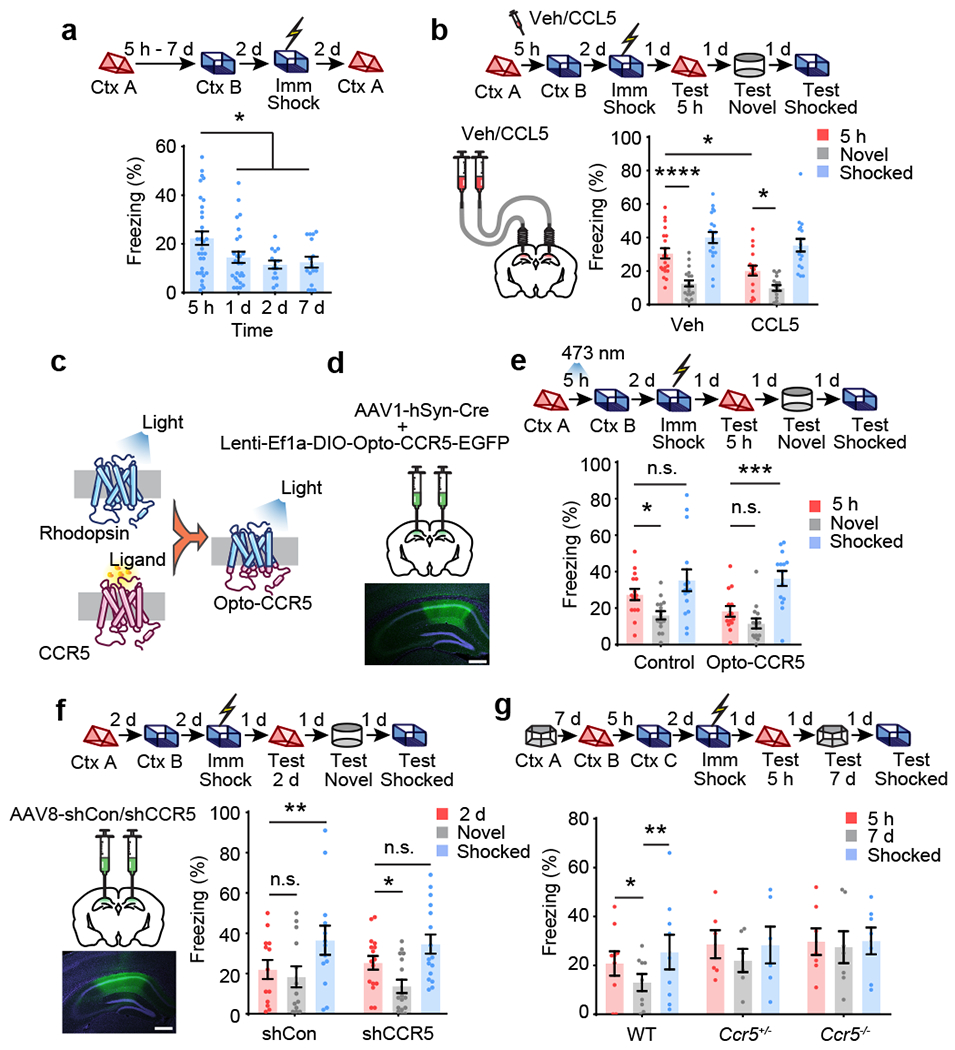
a, Characterization of the temporal window for contextual memory linking (Ctx A, Context A; Ctx B, Context B; 5h n=32, 1d n=26, 2d n=14, 7d n=16 mice; *P < 0.05, one-way ANOVA).
b, CCL5 infusion in dCA1 attenuated 5h contextual memory linking (Veh n=20, CCL5 n=17 mice; *P < 0.05, ****P <0.0001, two-way repeated measures ANOVA).
c, Schematics of the Opto-CCR5 construct.
d, Schematics of viral constructs injection. Scale bar, 500 μm.
e, Optogenetic activation of neuronal CCR5 impaired 5h contextual memory linking (Control n=15, Opto-CCR5 n=14 mice; *P < 0.05, ***P < 0.001, two-way repeated measures ANOVA).
f, Left: Schematics of AAV8-shCon or AAV8-shCCR5 intrahippocampal injection. Scale bar, 500 μm. Right: Ccr5 knockdown in dCA1 neurons extended the temporal window of contextual memory linking (shRNA-Con n=13, shRNA-CCR5 n=16 mice; *P < 0.05, **P < 0.01, two-way repeated measures ANOVA).
g, Ccr5 knockout extended the temporal window of contextual memory linking (WT n=9, Ccr5+/− n=6, Ccr5−/− n=7 mice; *P < 0.05, **P < 0.01, two-way repeated measures ANOVA).
All results shown as mean ± s.e.m.
We first enhanced CCR5 activity by infusing CCL5 into dCA1 4h after mice were exposed to context A, a time point that preceded the expected endogenous CCR5 signaling increase. During the contextual memory linking test, compared to the control group, the CCL5 group showed significantly lower freezing in context A that the mice had explored 5h before context B (Fig. 2b), indicating that increasing CCR5 activity led to an attenuation of contextual memory linking. Notably, mice in both the control and CCL5 groups had higher freezing in the 5h context than in a novel context, suggesting that besides the CCL5/CCR5 signaling pathway, other mechanisms, including those involving other CREB inhibitors or inhibitory microcircuits2, might also regulate the temporal widow for memory linking. We then tested whether contextual memory linking could be regulated specifically by direct manipulation of neuronal CCR5 activity with a genetically encoded optical tool (Opto-CCR5) with high spatiotemporal precision20 (Fig. 2c; detailed information in Methods). Consistent with CCR5 activation21–24, light stimulation of Opto-CCR5 caused both a significant enhancement of intracellular Ca2+ and phosphorylation of Erk1/2 (Extended Data Fig. 5a–e; Supplementary Fig. 1). To ensure specific neuronal expression, AAV1-hSyn-Cre was co-injected with Lenti-EF1a-DIO-Opto-CCR5 (or EGFP control virus) into dCA1 (Fig. 2d and Extended Data Fig. 5f). During the contextual memory linking test, only the control group, but not the Opto-CCR5 group, showed evidence of memory linking (i.e., higher freezing in context A, that the mice experienced 5h before context B, compared to a novel context; Fig. 2e), confirming that increasing neuronal CCR5 activity specifically after exposure to context A is sufficient to impair contextual memory linking without impairing memory for context B.
To examine whether attenuating CCR5 signaling could extend the window for contextual memory linking, AAV8 containing shRNA-Control or shRNA-CCR5 was injected into dCA1 (Fig. 2f). Three weeks later, mice were pre-exposed to context A and then context B with a 2d interval. As expected, during testing, the control group did not show memory linking (i.e., showed similar freezing in context A as in a novel context; Fig. 2f). In contrast, the shRNA-CCR5 group showed higher freezing in context A than in a novel context, and there was no difference in freezing between contexts A and B, demonstrating strong memory linking (Fig. 2f).
Additionally, Ccr5 knockout mice (Ccr5−/− mice) were also tested for contextual memory linking. As expected, during the test in context A, the WT mice froze less when the interval between contexts was 7d versus 5h. In contrast, Ccr5−/− mice showed similar freezing in context A when the intervals between context A and B were 5h or 7d. These freezing levels were also similar to those shown in the shocked context (context C; Fig. 2g), demonstrating strong memory linking in Ccr5−/− mice with a time interval (i.e., 7d) when WT mice do not show memory linking. Thus, two very different manipulations that decreased the levels of CCR5 (shRNA-mediated knockdown and a knockout) extended the temporal window for memory linking. Similar to Ccr5−/− mice, Ccl5 knockout (Ccl5−/−) mice also showed an extended linking window (Extended Data Fig. 6g), indicating that CCL5 is critical for CCR5 regulation of memory linking. To test whether CCR5 regulates linking for other forms of memory, we developed a memory linking task based on place preference with saccharin water used as a reward (Extended Data Fig. 6a). As with contextual memory linking with fear conditioning, the mice were able to link two memories when they were separated by 5h but not 7d (Extended Data Fig. 6b–d). Additionally, CCL5 infusion to dCA1 also inhibited memory linking in this appetitive linking task tested with a 5h interval, demonstrating that CCR5 activation inhibits both forms of memory linking (Extended Data Fig. 6e, f).
Altogether, our results show that increasing or inhibiting CCR5 signaling impaired or extended (respectively) the temporal window for contextual memory linking, demonstrating a key role for CCR5 in setting the duration for the memory linking window.
CCR5 modulates memory co-allocation
Next, we investigated how CCR5 regulates the temporal window for contextual memory linking. Previous results suggested that a temporary increase in neuronal excitability following learning25,26 biases the allocation of a subsequent memory to the neuronal ensemble encoding the initial memory1, and that this ensemble overlap was critical for memory linking27. Thus, we examined whether CCR5 modulated neuronal excitability and consequently memory ensemble overlap, since this could explain CCR5’s role in shaping the temporal window for memory linking. When treated with CCL5, dCA1 neurons from acute hippocampal slices showed a decrease in current injection-induced firing rate (Fig. 3a, b), indicating an inhibition of neuronal excitability. This is a significant result, since neuronal excitability is critical for determining which specific neurons in a neural network will store a given memory (known as memory allocation)13,18,28. Importantly, decreases in excitability, caused by increases in CCR5 signaling following learning, could explain how this receptor decreases memory ensemble overlap, and thus closes the window for memory linking.
Fig. 3|. CCR5/CCL5 modulate neuronal excitability, memory allocation and the overlap of memory ensembles.
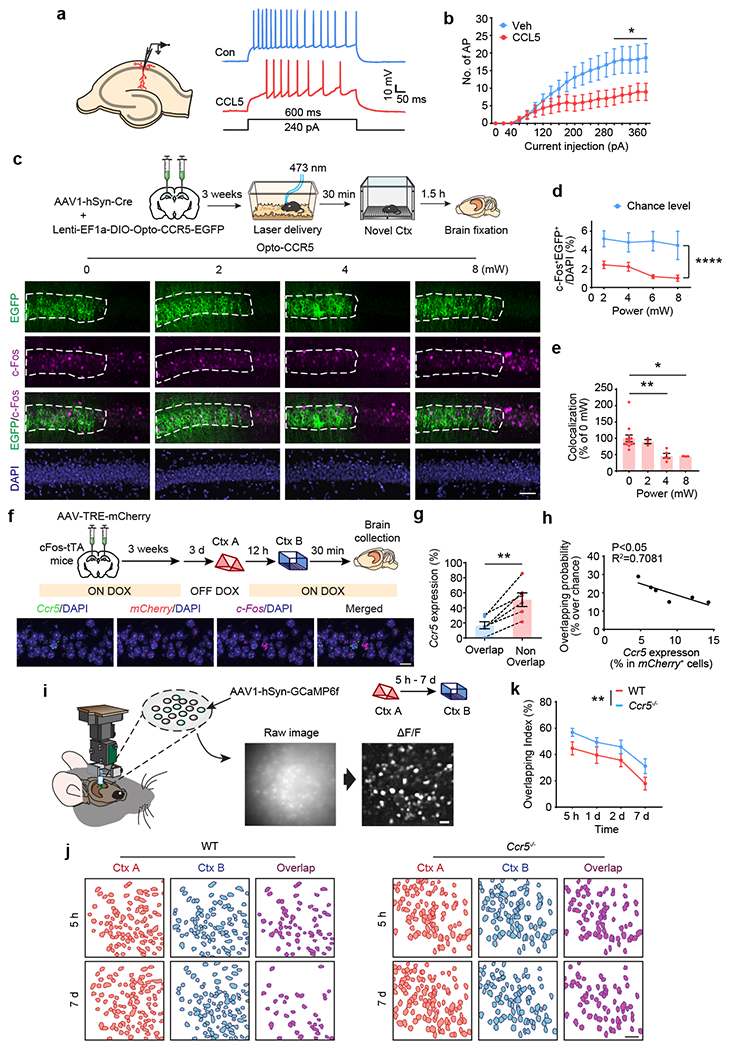
a, Schematics of neuronal recordings and representative traces.
b, dCA1 neurons treated with CCL5 for 1h showed a significant decrease in firing rate (Veh control n=10 cells, CCL5 n=9 cells, *P < 0.05, two-way repeated measures ANOVA).
c, Representative images of colocalization between c-Fos and Opto-CCR5-EGFP after light stimulation and novel context exposure. Scale bar, 50 μm.
d, Percentage of c-Fos+EGFP+ cells at different power levels (0 mW n=13, 2 mW n=3, 4 mW n=5, 8 mW n=3 mice; ****P < 0.0001, two-way repeated measures ANOVA).
e, Colocalization between c-Fos+ cells and EGFP+ cells after normalization to chance level. (0 mW n=13, 2 mW n=3, 4 mW n=5, 8 mW n=3 mice; *P < 0.05, ** P < 0.01, one-way ANOVA).
f, Schematics & representative images of Ccr5 expression and the overlap between memory ensembles of context A (mCherry) and context B (c-Fos) with a 12h interval between the two contextual exposures. Scale bar, 20 μm.
g, The probability of Ccr5 expression in the overlapping cells is lower than that in the non-overlapping cells (n=6 mice; **P < 0.01, paired t-test).
h, Probability of ensemble overlap (between context A and context B) and Ccr5 expression in mCherry+ cells (ensemble for context A) are negatively corelated (n=6 mice; R2=0.7081, P < 0.05).
i, Schematics for miniscope setup and calcium signal identification. Images were collected from mice exploring different contexts separated by either 5h, 1d, 2d, or 7d. Scale bar, 50 μm.
j, Neuronal overlap between different contexts. Scale bar, 50 μm.
k, Overlapping index for WT and Ccr5−/− mice (WT 5 h–7 d n = 7 mice; Ccr5 5 h n = 7, 1 d–7 d n = 6 mice; **P < 0.01, two-way ANOVA).
All results shown as mean ± s.e.m.
To directly test whether increases in CCR5 activity could decrease memory allocation, Opto-CCR5-EGFP or the EGFP control were expressed in mouse dCA1, and then subjected to blue light for 30 min (at different light power levels) before context exploration (Fig. 3c). Following light activation (4 and 8 mW) and contextual training, dCA1 neurons expressing Opto-CCR5 showed a significant reduction in the expression of learning-induced c-Fos, a widely used marker for neurons involved in memory29 (Fig. 3d, e), while the number of overall c-Fos+ or EGFP cells were similar among groups (Extended Data, Fig. 7g, h). This result supports the hypothesis that CCR5 activation excludes neurons from memory ensembles. Additionally, light activation did not cause any changes in c-Fos expression in the EGFP+ cells in the EGFP control group (Extended Data, Fig. 7c–f). Furthermore, when AAV8 containing shRNA-CCR5 was injected into dCA1, neurons with Ccr5 knockdown had a higher probability of expressing c-Fos (i.e., being involved in memory; Extended Data, Fig. 7a, b) compared with control neurons, a result that also supports the hypothesis that CCR5 activity modulates memory allocation in neuronal networks.
Altogether, the results presented suggest that the increase in CCR5 expression and signaling after learning prevents subsequent memories from being allocated to the neuronal ensemble encoding the initial memory, thus reducing the overlap between the two memory ensembles, and consequently attenuating memory linking. To test this hypothesis, we first labeled the memory neural ensembles activated by two contextual exposures with the cFos-tTA/TRE-mCherry system and with c-Fos mRNA in situ hybridization. There was significantly higher Ccr5 expression in the non-overlapping neuronal ensemble population than in the overlapping population, and there was a negative correlation between Ccr5 expression in cells encoding the first contextual memory and the probability of overlap between the two memory ensembles (Fig. 3f–h), indicating that increased Ccr5 expression in the first memory engram reduces the overlap between the two memory ensembles.
To further test this hypothesis, we recorded neuronal calcium activity (with GCaMP6f) in dCA1 with head mounted fluorescent microscopes (miniscopes1) while mice were exploring two different contexts separated by either 5h, 1d, 2d, or 7d. Then, we measured the overlap between the active neuronal populations recorded during the two contextual exposures in both WT and Ccr5 knockout mice (Fig. 3i, j). Compared to WT mice, Ccr5−/− mice revealed an overall significantly higher neural ensemble overlap (Fig. 3k). Neurons in a contextual memory ensemble were reported to have significantly higher mean firing rate30. Therefore, we next focused our analyses on the cells with high (top 10%) activity during the contextual exposures. There was a time dependent reduction in neuronal activity of this group of cells with high activity in WT mice, while no reduction was observed in Ccr5−/− mice (Extended Data Fig. 8). When the overlap between high activity cells was measured, a time-dependent (5h vs 2d) decrease in overlap was observed in WT mice, and this decrease was attenuated by the Ccr5 KO (Extended Data Fig. 9). Altogether these results support the hypothesis that CCR5 modulates the temporal window for memory linking by regulating neuronal co-allocation and consequently the overlap between memory ensembles.
CCR5 and aging-related linking deficits
CCR5 and CCL5 expression in peripheral immune cells increases with age31,32. Similar increases in aging neurons could contribute to age-related decreases in contextual memory linking1. To test this hypothesis, we measured hippocampal Ccr5 and Ccl5 expression in 16~18-month-old mice (middle-aged), an age in which mice still show intact contextual conditioning, but deficits in contextual memory linking1. Compared with young mice, middle-aged home cage mice had significantly enhanced Ccl5 and Ccr5 mRNA levels (Fig. 4a). Middle-aged mice also showed an increase in the transient Ccl5 expression at 3h following contextual learning (Fig. 4b), which was earlier than in young mice (6-12h after learning, Fig. 1c). In situ hybridization showed that the increase in Ccr5 and Ccl5 expression was mainly in neurons (Fig. 4c–f).
Fig. 4|. Enhanced CCL5/CCR5 signaling contributes to age-related memory linking deficits.
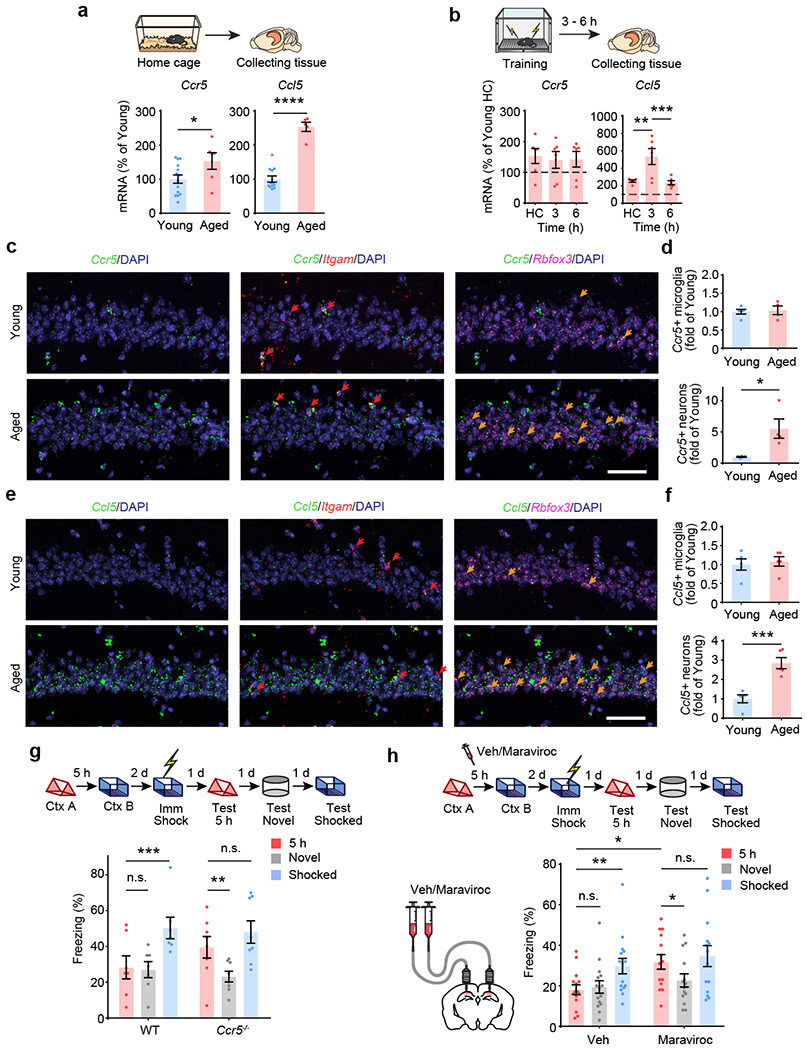
a, Middle-aged HC mice had higher Ccr5 and Ccl5 mRNA levels in dCA1 than young HC mice (Ccr5: young n=14, aged n=6, Ccl5: young n=12, aged n=5; *P < 0.05, ****P < 0.0001, Student’s t-test).
b, Ccr5 and Ccl5 expression after fear conditioning in dCA1 of middle-aged mice (Ccr5: n=6 for all groups, Ccl5: HC n=5, 3h n=6, 6h n=6; **P < 0.01, ***P < 0.001, one-way ANOVA).
c, Representative images of Ccr5, Itgam and Rbfox3 mRNA expression in dCA1 from naïve young or middle-aged mice. Red arrows: cells expressing Ccr5 and Itgam. Orange arrows: cells expressing Ccr5 and Rbfox3. Scale bar, 50 μm.
d, Number of Ccr5-expressing microglia and neurons in young or middle-aged mice (young n=5, aged n=4 mice; *P < 0.05, Student’s t-test).
e, Representative images of Ccl5, Itgam and Rbfox3 mRNA expression in dCA1 from naïve young or middle-aged mice. Red arrows: cells expressing Ccr5 and Itgam. Orange arrows: cells expressing Ccr5 and Rbfox3. Scale bar, 50 μm.
f, Number of Ccl5-expressing microglia and neurons in young or middle-aged mice (n=5 mice; ***P < 0.001, Student’s t-test).
g, Ccr5 knockout rescued 5h memory linking deficits in middle-aged mice (WT n=7, Ccr5−/− n=8; **P < 0.01, ***P < 0.001, two-way repeated measures ANOVA).
h, Maraviroc, a CCR5 antagonist, rescued 5h memory linking deficits in middle-aged mice (Veh n=15, maraviroc n=14; *P < 0.05, **P < 0.01, two-way repeated measures ANOVA).
All results shown as mean ± s.e.m.
Although middle-aged WT mice showed deficits in contextual memory linking1, even when short intervals (i.e., 5h) were used (Fig. 4g), middle-aged Ccr5−/− mice showed clear evidence for memory linking tested with a 5h interval (i.e., higher freezing in contexts A than in a novel context; Fig. 4g). To test the effect of pharmacologically blocking CCR5 activity on contextual memory linking in middle-aged mice, maraviroc (an FDA approved CCR5 antagonist used for HIV treatment; Extended Data Fig. 4d–f)33 was infused to dCA1 of these mice 1h before they were exposed to context B in a contextual memory linking experiment with a 5h interval. Unlike control mice, maraviroc-treated mice showed memory linking (Fig. 4h). Thus, blocking CCR5 with maraviroc ameliorates the memory linking deficits in middle-aged mice. Altogether these results support a role for CCR5 expression in closing the temporal window for memory linking as well as in age-related deficits in memory linking.
In summary, the findings reported here show that a delayed (12-24h) increase in CCL5/CCR5 signaling in dCA1 neurons of a given memory ensemble closes the temporal window for memory linking. CCR5 activation decreases neuronal excitability, thus negatively regulating memory allocation. This change in memory allocation decreases the overlap between memory ensembles, and therefore impairs the ability of one memory to trigger the recall of the other, thus closing the temporal window for memory linking (Extended Data Fig. 10). Remarkably, our findings also show that an age-related increase in CCL5/CCR5 expression leads to impairments in memory linking in middle-aged mice that could be reversed with an FDA approved drug that inhibits this receptor, a result with significant clinical implications. All together the findings reported here provide the first insights into the molecular and cellular mechanisms that close the temporal window for memory linking, thus segregating the memories for events that are temporally distinct.
Methods
Animals
Ccr5 knockout (Ccr5−/−) mice were purchased from Taconic Farms (Germantown, NY; B6.129P2-Ccr5tm1Kuz N10). Experimental WT, Ccr5+/− and Ccr5−/− mice (3 to 5 months old) were generated by intercrossing Ccr5+/− mice. Littermates were used for Ccr5 KO linking test. cFos-tTa mice that express tetracycline transactivator (tTA) protein under the control of the c-Fos (also known as Fos) promoter were maintained in a C57BL/6N background. Ccrl5 knockout (Ccl5−/−) mice were purchased from Jackson lab (B6.129P2-Ccl5tm1Hso/J). 16-month-old male C57BL/6Nia were purchased from NIA for Ccr5 expression detection and linking test. 11-week-old male C57BL/6N Tac mice were purchased from Taconic Farms (Germantown, NY) for all other experiments. Mice are housed in an AAALAC accredited facility with 12-12 light/dark cycles. Housing conforms to The Guide for the Care and Use of Laboratory Animals, 8th edition. The temperature setpoint is 72 degrees plus or minus 3 degrees; the humidity range is between 30% to 70%. All experiments were performed during the light phase of the cycle. All studies were approved by the Animal Research Committee at UCLA.
Viral constructs
Constructs for iTango2 system were gifts from Hyungbae Kwon, which include pAAV-hSYN-DRD2-V2tail-TevN-BLITz1-TetR-VP16-bGHpA (Addgene plasmid #89874; http://n2t.net/addgene:89874; RRID:Addgene_89874), pAAV-hSYN-bArrestin2-TevC-P2A-TdTomato-WPRE-bGHpA (Addgene plasmid #89873; http://n2t.net/addgene:89873; RRID:Addgene_89873), pAAV-TRE-EGFP (Addgene plasmid #89875; http://n2t.net/addgene:89875; RRID: Addgene_89875), pTRE-EGFP (Addgene plasmid #89871; http://n2t.net/addgene:89871; RRID: Addgene_89871). pGP-CMV-NES-jRGECO1a was a gift from Douglas Kim & GENIE Project (Addgene plasmid # 61563; http://n2t.net/addgene:61563; RRID: Addgene_61563). pAAV.Syn.GCaMP6f.WPRE.SV40 was a gift from Douglas Kim & GENIE Project (Addgene viral prep # 100837-AAV1; http://n2t.net/addgene:100837 ; RRID:Addgene_100837)
For the AAV-based shRNA construct for mouse CCR5, the target sequence (shCCR5) is 5′- GTGCAAGCTCAGTCTATACCTCAAGAGGGTATAGACTGAGCTTGCAC-3′.
The control sequence (shDsRed) is 5′- AGTTCCAGTACGGCTCCAAGAAGCTTGTTGGAGC CGTACTGGAACT-3′.
For the Opto-CCR5 experiment, pLenti-Ef1α-DIO-Opto-CCR5-EGFP was made by replacing the intracellular loops of rhodopsin with those of CCR5 to activate its specific intracellular signaling with light. The details of viral information are described in the Supplementary Table 1.
Real time-PCR
Total RNA was prepared using RNeasy Mini Kit (Qiagen, 74104) according to the manufacturer’s instructions. Single-stranded cDNA was synthesized using SuperScript III First-Strand Synthesis SuperMix (Invitrogen, 18080400). Real-time PCR was performed with SYBR Green-based reagents (iQ SYBR Green Supermix; Bio-Rad, 1708880) using a LightCycler 480 II (Roche). The following are primers used for real-time PCR:
Mouse ccr5, 5’-GCTGCCTAAACCCTGTCATC-3’ and 5’GTTCTCCTGTGGATCGGGTA-3’
Mouse ccl5, 5’-TGCAGTCGTGTTTGTCACTC-3’ and 5’-AGAGCAAGCAATGACAGGGA-3’
Mouse ccl3, 5’-TTCCACGCCAATTCATCGTT-3’ and 5’-GCATTCAGTTCCAGGTCAGTG-3’
Mouse ccl4, 5’-CCTCCCACTTCCTGCTGTTT-3’ and 5’-GCTTGGAGCAAAGACTGCTG-3’
Mouse 36B4, 5’-AGATGCAGCCAGATCCGCAT-3’ and 5’-GTTCTTGCCCATCAGCACC-3’
In situ hybridization
Mouse brains were dissected and fast-frozen in OCT by dry Ice without PFA fixation. 20 μm frozen sections were sliced. In situ hybridization was performed using RNAscope Fluorescent Multiplex Reagent Kit V1(ACD, 320850) and V2 (ACD, 323120) according to the manufacturer’s instructions. RNAscope Probe-Mm-Ccr5 (ACD, 438651) and Probe-Mm-Ccl5 was used to detect ccr5 and Ccl5 mRNA. Probe-Mm-Rbfox3 (ACD, 313311) and Probe-Mm-Itgam (ACD, 469601) were used as markers for neurons and microglia, respectively. Probe-Mm-Slc17a7 (ACD, 416631) and Probe-Mm-Gad2 (ACD, 311491) were used as markers for excitatory and inhibitory neurons. Probe-mCherry (ACD, 431201) and Probe-Mm-Fos (316921) were used for memory ensemble labeling.
Immunostaining
Mice were transcardially perfused with 4% PFA (4% paraformaldehyte in 0.1 M phosphate buffer) and after perfusion, brains were sliced coronally (50 μm thick) with a vibratome and processed for immunostaining. Primary antibodies, including chicken polyclonal anti-GFP (Abcam AB13970, 1:1000), mouse monoclonal anti-GFP (Synaptic Systems, 132 011, 1:500), Chicken anti-RFP (Synaptic Systems, 409 006, 1:500), mouse anti-TetR Monoclonal Antibody (Clone 9G9, Takara, 63113, 1:500), mouse anti-NeuN (Chemicon, MAB377, 1:1000), rabbit anti-GFAP (Dako, Z0334, 1:500), rabbit anti-c-Fos (Cell Signaling, 9F6, #2250, 1:500), and rabbit anti-P2Y12 (AnaSpec, AS-55043A, 1:1000) and secondary antibodies, including goat anti-chicken 488 (Invitrogen, A11039, 1:2000), goat anti-mouse 488 (Invitrogen, A11029, 1:2000), goat anti-chicken 594 (Invitrogen, A11042, 1:2000), goat anti-rabbit 647 (Invitrogen, A21245, 1:2000) were used for immunostaining. Brain slices were incubated with 4’,6-diaminodino-2-phenylindole (DAPI, Invitrogen, 1:2000) for 10 min and washed with PBS three times before mounting onto slides. Immunostaining images were acquired by NIS-Elements AR (Nikon, v4.40.00) with a Nikon A1 Laser Scanning Confocal Microscope (LSCM). NIS-Elements AR Analysis (Nikon, v4.40.00) was used to analyze the confocal images.
Immunoblotting
Cultured HEK 293 cells were lysed with RIPA buffer (Sigma, St. Louis, MO, R0278) with protease inhibitor cocktail (Sigma, P8340), phosphatase inhibitor cocktail 2 (Sigma, P5726), phosphatase inhibitor cocktail 3 (Sigma, P0044). Protein samples (10 μg/well) were loaded to NuPAGE Novex 4–12% Bis-Tris protein gel (ThermoFisher Scientific, Carlsbad, CA, NP0336BOX) and transferred onto polyvinylidene difluoride (PVDF) membranes. The membranes were then blocked with 5% nonfat milk at room temperature for 1 hour and then probed with primary antibodies (phospho-p44/42 MAPK, Cell Signaling 9101, 1:4000, dilution) at 4°C overnight. Membranes were then incubated with HRP-conjugated secondary antibodies (goat anti-rabbit HRP, Bio Rad, 170-6515, 1:5000) for 1 hour and developed with SuperSignal solutions (Thermo Scientific). Then the membrane was stripped and probed again with primary antibodies (p44/42 MAPK, Cell Signaling 9102, 1:4000 dilution, β-actin 1:10,000, A5316, Sigma-Aldrich) and secondary antibodies including goat anti-mouse HRP (Bio Rad, 170-6516, 1:10000) and goat anti-rabbit HRP (Bio Rad, 170-6515, 1:5000),
CCR5-iTango2 system
Inducible Tango2 (iTango2) system is a genetic method of labeling and manipulating cells with particular GPCR activation initially reported by Hyung-Bae Kwon lab19. Based on this method, we designed CCR5-iTango2. Briefly, it couples a tetracycline-controlled transcriptional activator (tTA) to the C-terminal of mouse CCR5 via a specific tobacco etch virus protease (TEVp)-sensitive cleavage site (TCS), which is protected by AsLOV2/Jα (light sensitive domain). Upon activation, β-Arrestin tagged with TEVp-C (C-terminal region of TEVp) binds intracellular loop of CCR5 tagged with TEVp-N (N-terminal region of TEV), which forms functional TEV and cleave TEV-seq exposed to light stimulation. Then tTA is released and translocate into nucleus to induce specific gene expression. To generate the CCR5-iTango2 DNA constructs, full length mouse CCR5 cDNA was sub-cloned into pAAV-hSYN-DRD2-V2tail-TevN-BLITz1-TetR-VP16-bGHpA to replace DRD2 cDNA sequence (by VectorBuilder).
For analysis, ImageJ (v1.53f51) was used to quantify the EGFP and tdTomato intensity. Briefly, EGFP cells were identified and outlined automatically (to create ROIs for EGFP+ counting) by threshold imaging (threshold: 1.5-fold of the background intensity). Then, the intensity (gray value) of the EGFP and tdTomato was measured by the software within the ROIs of identified cells, and the EGFP/tdTomato ratio was calculated.
Opto-CCR5 system
Opto-XR is the genetically encoded optical tool designed by Karl Deisseroth lab20, which can control GPCR-initiated biochemical signaling pathways with high spatiotemporal precision. Based on opto-XR, Won Do Heo lab designed and made the Opto-CCR5 construct and subclone it into a lentivirus backbone (Lenti-Ef1a-DIO-Opto-CCR5-EGFP). Briefly, the intracellular loops of rhodopsin were replaced with those of mouse CCR5. As a result, light induced structure change of rhodopsin would activate intracellular CCR5 signaling.
Stereotaxic Surgery
Animals were anesthetized with 2% isoflurane and placed in a stereotaxic head frame on a heat pad. Artificial tears were applied to the eyes to prevent eye drying. A midline incision was made down the scalp, and a craniotomy was performed with a dental drill. After surgery, the animals were subcutaneously injected with Carprofen (5 mg/kg) and Dexamethasone (0.2 mg/kg) before recovery. Water with amoxicillin was applied for two weeks.
For cannula implantation, two guide cannulas (Plastics One, C313GS-5/SPC) were implanted at the following coordinates relative to bregma (mm): 1) for dCA1, AP: −2.1, ML: ±1.7; 2) for lateral ventricle, AP: −0.3, ML: ±1.0. Three weeks after cannulation, mice were anesthetized and sterilized Veh or drug was infused into hippocampus through the internal cannula (Plastics One, C313IS-5/Spc, 100nL/min) at DV: −1.6 mm (dCA1) or −2.5 mm (ventricle) relative to skull. After infusion, the internal cannula was left in place for an additional 5 min to ensure full diffusion. Drugs with the following concentration were infused: mouse CCL5 peptide (70nM in PBS, 1 μL), Maraviroc (10 mg/ml in saline with 7.5% beta-cyclodextrin, 1 μL), DAPTA (50 nM in PBS, 1 μL).
For virus injection, a Nanoliter injector (World Precision Instruments) was used to infuse virus with Micro4 Controller (World Precision Instruments). Virus was infused at 50-100 nL/min. After infusion, the capillary was kept at the injection site for 5 min and then withdrawn slowly. The incision was closed with clips, which were removed 7 days later. The details of viruses used are described in the Supplementary Table 1.
For optical fiber implantation, fiber Optic Cannula (Newdoon, 200 μm, NA=0.37) was immediately implanted after virus injection. The tip of the optic fiber was placed 600 μm above the virus injection site. Then, the canula was fixed with Metabond and dental cement.
For miniscope implantation, a GRIN lens was implanted into the dorsal hippocampal CA1 region as previously described1. After GCaMP6f virus injection, a ~2mm diameter circular craniotomy was centered at the injection site. The cortex directly below the craniotomy was aspirated with a 27-gauge blunt syringe needle attached to a vacuum pump. Cortex buffer (NaCl 135mM, KCL 5mM, CaCl2 2.5mM, MgSO4 1.3mM, HEPES 5mM, PH 7.4) was repeatedly applied to the exposed tissue to prevent drying. The GRIN lens (0.50 NA, 2.0 mm in diameter, Grintech Gmbh) was slowly lowered above CA1 to a depth of 1.35 mm ventral to the surface of the skull at the most posterior point of the craniotomy. Next, a skull screw was used to anchor the lens to the skull. Both the lens and skull screw were fixed with super glue (Loctite, 45198) and dental cement (Jet Denture Repair Package, Lang, 1223CLR). Low Toxicity Silicone Adhesive (Kwik-Sil,World Precision Instruments) was used to cover the GRIN Lens for protection. Three weeks later, a small baseplate was cemented onto the animal’s head atop the previously formed dental cement.
Memory ensemble labeling with cFos-tTA mice
Adult male and female (3-8 months) cFos-tTa transgenic were bilaterally microinjected with 500 nl of AAV1-TRE-mCherry into the dCA1. Mice were allowed to recover from surgeries for 3 weeks and high doxycycline chow (1g/kg) was applied during the recovery. Mice were removed from doxycycline chow and were fed with regular chow for 3 days before the behavior to allow the tagging of neuronal ensemble for the memory linking experiments. The activity-dependent tagging was shut off by administration of high dox chow 1h after behavioral tagging.
Optogenetics
For the CCR5-iTango2 system, 3 weeks after virus injection and optic cannula implantation, the mice were handled for 3 days and then habituated with the optic fiber connected in their home cage for another 3 days (10min/day). Then the mice received contextual fear conditioning training and returned to their home cage. After 2.5h, 5.5h, 11.5h and 23.5h, different groups of mice received light stimulation in their home cage (473nm, 8-10mW, 10s on/50s off for 1h). The mice were kept for another 48h for GFP expression before the brains were collected and fixed with PFA perfusion. To validate CCR5-iTango2 in vitro, HEK293 cells were transfected with iTango2 system constructs using Lipofectamine 2000 (Invitrogen, 11668027). One day later, light (473nm, 10s on/50s off for 1h) was delivered to the cells with/without CCL5 (1nM).
For Opto-CCR5, the mice were anesthetized with 1.5% isoflurane during light delivery (473nm, ~8mW, 50s on/10s off for 30min). Then, the mice were returned to their home cage for 30 min to recover before exposure to a different context. To validate Opto-CCR5 in vitro, HEK293 cells were transfected with Opto-CCR5 construct using Lipofectamine 2000 (Invitrogen, 11668027). One day later, light (473nm or 500nm, ~1-2 mW/mm2, 2-5 min) was delivered to the cells to activate Opto-CCR5.
For memory ensembles labeling with ChR2ETTC pre-activation, 3 weeks after virus injection and optic cannula implantation, the mice were handled for 3 days (2 min/day) and then habituated to the experimental room and wearing optical fibers for another 3 days. For the pre-activation, mice were connected to the optical fibers and returned to home cages for 5 min first, and then 3 min light stimulation (473nm, ~4-5mW,10Hz, 20% duty cycle) was applied in home cage. After light stimulation, optical fibers were disconnected and mice were allowed another 5 min recovery in home cage before contextual fear conditioning.
Memory linking with contextual fear conditioning
The contextual memory linking task was carried out as previously described1. Mice were first handled for 3 days (1min/day) and then habituated to transportation and external environmental cues for 2 minutes in the experimental room each day for another 3 days. In the contextual memory linking task, mice explored 2 different contexts (A and then B, counterbalanced) which were separated by 5h-7d. Mice explored each context for ten minutes. For immediate shock, mice were placed in chamber B for 10 s followed by a 2s shock (0.65 mA). 58 seconds after the shock, mice were placed back in their home cage. For the context tests, mice were returned to the designated context. Freezing was assessed via an automated scoring system (Med Associates) with 30 frames per second sampling; the mice needed to freeze continuously for at least one second before freezing could be counted.
Memory linking with place preference task
Mice were gradually water restricted to 1.5-2.0 ml/day. Body weight was tightly monitored every day to avoid a loss of over 15% of body weight. From the 3rd day of water restriction, mice were handled for 5min/day for 3 days. Then mice were placed in the experimental room for 1h/day for another 3 days for habituation. To test memory linking, mice were exposed to one of the two-compartment apparatus (context A or context B, for each group the two contexts were counter balanced) for 10 min, and 5h or 7d later, mice were placed in context C (with 1.5ml water containing 0.2% saccharin) for 15min. One day later, mice were placed back to the two-compartment apparatus and were allowed to freely explore the context A (pre-exposed context) and context B (Novel context). The exploration was recorded and the time in each apparatus was measured to examine the preference for each context.
Slice preparation and CCL5 treatment
Adult mice (3-6 months old) were deeply anesthetized with isoflurane and the brains were rapidly dissected out and transferred to oxygenated (95% O2/5% CO2), ice-cold cutting solution containing 92 mM NaCl, 2.5 mM KCl, 1.25 mM NaH2PO4, 30 mM NaHCO3, 20 mM HEPES, 25 mM glucose, 2 mM Thiourea, 5m M Na-ascorbate, 3 mM Na-pyruvate, 2 mM CaCl2, and 2 mM MgCl2. Coronal slices (400 μm thick) containing the hippocampus were cut using a Leica VT1200 vibrating blade microtome, transferred to a submerged holding chamber containing oxygenated cutting solution and allowed to recover for 1h at room temperature. Prior to performing whole-cell recordings, each slice was incubated in a separate chamber containing either oxygenated aCSF (containing 115 mM NaCl, 10 mM glucose, 25.5 mM NaHCO3, 1.05 mM NaH2PO4, 3.3 mM KCl, 2 mM CaCl2, and 1 mM MgCl2) or 10nM CCL5 in oxygenated aCSF for 1h. Following incubation, slices were immediately transferred to a superfused recording chamber and constantly perfused with oxygenated aCSF maintained at 28°C. All recordings were performed within 30 min of aCSF or CCL5 incubation.
Whole-cell patch recordings
Whole cell current-clamp recordings were performed on pyramidal neurons in the CA1 region of the hippocampus using pipettes (3-5MΩ resistance) pulled from thin-walled Borosilicate glass using a Sutter P97 Flaming/Brown micropipette puller and filled with an internal solution containing 120 mM K-methylsuphate, 10 mM KCl, 10 mM HEPES, 10 mM Na-phosphocreatine, 4 mM Mg-ATP, and 0.4 mM Na-GTP. All recordings were obtained using a MultiClamp 700B amplifier controlled by the pClamp 10 software and digitized using the Digidata 1440A system. Signals were filtered at 10 kHz and digitized at 20 kHz. Neurons were included in the study only if the initial resting membrane potential (Vm) < −55 mV, access resistance (Ra) was < 20MΩ, and were rejected if the Ra changed by >20% of its initial value. For all recordings, neurons were held at −65 mV. The stable resting membrane potential of neurons was measured and averaged over a 60s duration with 0 mA current injection immediately after breaking in. To investigate the firing rate of neurons, the number of action potentials fired in response to a 600 msec pulse of depolarizing current injection (0 pA to 380 pA in 20 pA increments) was calculated. Three pulses were delivered for each current amplitude and the average number of action potentials fired for each current amplitude was plotted. The recordings were analyzed using Stimfit 0.15.8 and the data were screened for statistical outliers (± 2SD).
Miniscope data acquisition and analyses
One-photon calcium imaging was recorded using UCLA miniscopes34. During recordings, digital imaging data were sent from the CMOS imaging sensor (Aptina, MT9V032) to custom data acquisition (DAQ) electronics and USB Host Controller (Cypress, CYUSB3013) over a light-weight, highly flexible co-axial cable. Images were acquired at 30 frames per second, using display resolution at 752 x 480 pixels (1 pixel = 1-2μm), and saved into uncompressed avi files. The analysis pipeline was written in MATLAB using first the NoRMCorre algorithm for motion correction (rigid registration)35, followed by individual neuron identification and extraction using the CNMF-E algorithm36. During motion correction, videos were 2x spatially down-sampled using the default built-in NoRMCorre protocol. During CNMF-E initialization, videos were further 2x spatially down-sampled and 5x temporally down-sampled. The quality of neuron extraction was verified using a MATLAB custom-made Neuron Deletion GUI. We excluded the detected putative neurons exhibiting ROI morphology or calcium trace abnormalities or incoherencies between the calcium trace peaks and the expected correspondent fluorescence increases in the video, and the neuron deletion was performed by experimenters blinded of the experimental groups and conditions. Each 10-min video from individual sessions was analyzed separately. Recordings from multiple sessions of the same animal were aligned using the spatial foot prints (neuron.A, output from CNMF-E) of each one of the detected cells for individual sessions. The centroid distance and spatial correlation were calculated for all cell pairs. Cell pairs from different sessions were considered to match if their spatial correlation ≥ 0.8 and their centroid distance ≤ 5 pixels. Overlapping percentages between two given sessions were calculated as the number of matched cells over the average of the total number of detected cells in each one of the two sessions. Overlapping Index= Ctx A+ Ctx B+ cell (Overlap) / [(Ctx A+ cell + Ctx B+ cell)/2] %.
We reanalyzed our miniscope data using a MATLAB custom-made concatenation analysis pipeline37 to identify, track, and analyze the activity of individual neurons across sessions. Briefly, the motion-corrected videos (as described above), from context exposure sessions of individual animals, were aligned and concatenated into a long video. The long video was then processed through CNMF-E using the same parameters described above to extract putative neurons. After deletion of false-positive ROIs using the Neuron Deletion GUI protocol described above, we projected the raw calcium trace of the remaining ROIs for each session separately using the CNMF-E algorithm. Finally, we inferred spike activity from raw calcium traces from individual sessions using the Foopsi Thresholded algorithm38, and we binarized neuronal activity (NA) from individual frames into 1 (active frame) and 0 (inactive frame). We calculated interevent intervals (IEI) as the time interval between consecutive active frames from individual sessions (Extended Fig. 8). The cumulative distribution of IEIs was first calculated for each individual neuron, then averaged across neurons to represent individual animals. Finally, the single animal values were averaged to depict group results (Extended Fig. 8c, d, g). We defined subsets of neurons based on their average NA by calculating the number of active frames for each neuron within specific sessions and sorting cells from highest to lowest NA (e.g., Top 10%, as in Extended Fig. 9b) or from lowest to highest NA (e.g., Bottom 10%, as in Extended Fig. 9c). The coefficient of variation for each neuron in a specific session was defined as the ratio between the standard deviation of the IEI distribution and the average NA within that session. We validated the usage of IEI from calcium imaging as a significantly reliable representation of inter-spike interval (ISI) from in-vivo electrophysiology recordings (ephys) by leveraging a dataset containing simultaneous GCaMP6f calcium imaging and loose-seal cell-attached electrical recordings of cortical neuronal activity39. ISIs were defined by the time interval between consecutive spikes and the coefficient of variation for ephys recordings was calculated the same way as in calcium imaging recordings using the ISI distribution instead of the IEI distribution.
We defined the probability of overlap based on average NA by calculating the probability of a subset of neurons from Ctx A (e.g., Top 10% NA) to have a specific relative level of NA (e.g., be within the Top 30% NA) in Ctx B. This was mathematically defined as in the example: , where is the probability of the Top 10% NA in Ctx A (A10) to be within the Top 30% NA in Ctx B (B30); is the actual number of neurons lying within A10 and B30, and is the universe of all cells detected from all sessions by the analysis using the concatenated long video. The probability values were normalized by chance through the calculation of the ratio between and (Extended Fig. 9b–d). For plots on Extended Fig. 9b,c (X axis), the same percentage values were used for contexts A and B (e.g., ). We have also calculated between different subsets of 10% cells from Ctx A and the Top 10% NA cells from Ctx B (Extended Fig. 9e). We have spanned all cells from Ctx A, from highest to lowest NA, with a sliding window of size = 10% and step = 2% (Extended Fig. 9e, X axis). To express the significance of the probability of overlap values, they were represented as standard deviations from the mean of a null distribution created by randomly subsampling (10,000 times) 10% cells from Ctx A followed by the calculation of , in which B10 is the Top 10% NA from Ctx B.
Colocalization calculation
Different calculations were applied to reflect colocalization between protein or mRNA distributions. For overlap between c-Fos and Opto-CCR5/ChR2ETTC/CCR5-iTango2/shCCR5, chance level = (c-Fos+/DAPI)*(EGFP+/DAPI)%, colocalization = [(c-Fos+EGFP+/DAPI)% /Chance level]%, distribution index = [a/(a+b)]%, a = (c-Fos+EGFP+/EGFP+)%, b = (c-Fos+EGFP−/EGFP−)%, EGFP+, c-Fos+ and EGFP+ indicate the number of cells with positive signal respectively. Opto-CCR5, CCR5-iTango2 and shCCR5 had EGFP as the reporter while ChR2ETTC was tagged with mCherry instead. For overlap among Ccr5, mCherry and c-Fos mRNA, overlapping probability (over chance) = (a-b)/b, a= (mCherry+c-Fos+/DAPI)% (which is the observed overlap%), b = [(mCherry+/DAPI)*(c-Fos +/DAPI)]% (which is the overlap chance%).
Statistics and reproducibility
The investigators who collected and analyzed the data including behavior, miniscope, electrophysiological and staining were blinded to the mouse genotypes and treatment conditions. Error bars in the figures indicate the SEM. All statistical analyses were performed using GraphPad Prism 6. For behavior experiments, n designates the number of mice. For biochemical experiments, n designates the number of brains or cells collected. For electrophysiological measurements, n designates the number of neurons. All statistical tests are two-sided. Statistical significance was assessed by Student’s t test, Kolmogorov–Smirnov test or one- or two-way ANOVA where appropriate, followed by the indicated post hoc tests for repeated measures. Significance levels were set to P = 0.05. Significance for comparisons: *P < 0.05; **P < 0.01; ***P < 0.001. The details of statistical information are described in the Supplementary Table 2.
Representative histological images were repeated independently in different mice with similar results for Fig. 1d (n≥4 per group), Fig. 1h (n=3 per group), Fig. 1i (n≥5 per group), Fig. 2d and f (n=6), Fig. 3c (n≥3 per group), Fig. 3f (n=6), Fig. 4c (n≥4 per group) and Fig. 4e (n=5 per group), and Extended Data Fig. 1e (n≥3 per group), Extended Data Fig. 1e (n≥3 per group), Fig. 1g (n=5 per group), Extended Data Fig. 2a (n=5), Extended Data Fig. 2d (n=4), Extended Data Fig. 2h (n=4 per group), Extended Data Fig. 3l (n≥3 per group), Extended Data Fig. 4b (n=3 per group), Extended Data Fig. 4e (n≥3 per group), Extended Data Fig. 4h (n≥4 per group) Extended Data Fig. 5f (n=4), Extended Data Fig. 7a (n=8) and Extended Data Fig. 7d (n=4 per group). Representative in vitro images were biologically duplicated.
Extended Data
Extended Data Fig. 1|. Dorsal hippocampal expression of CCR5 and its ligands after fear conditioning.
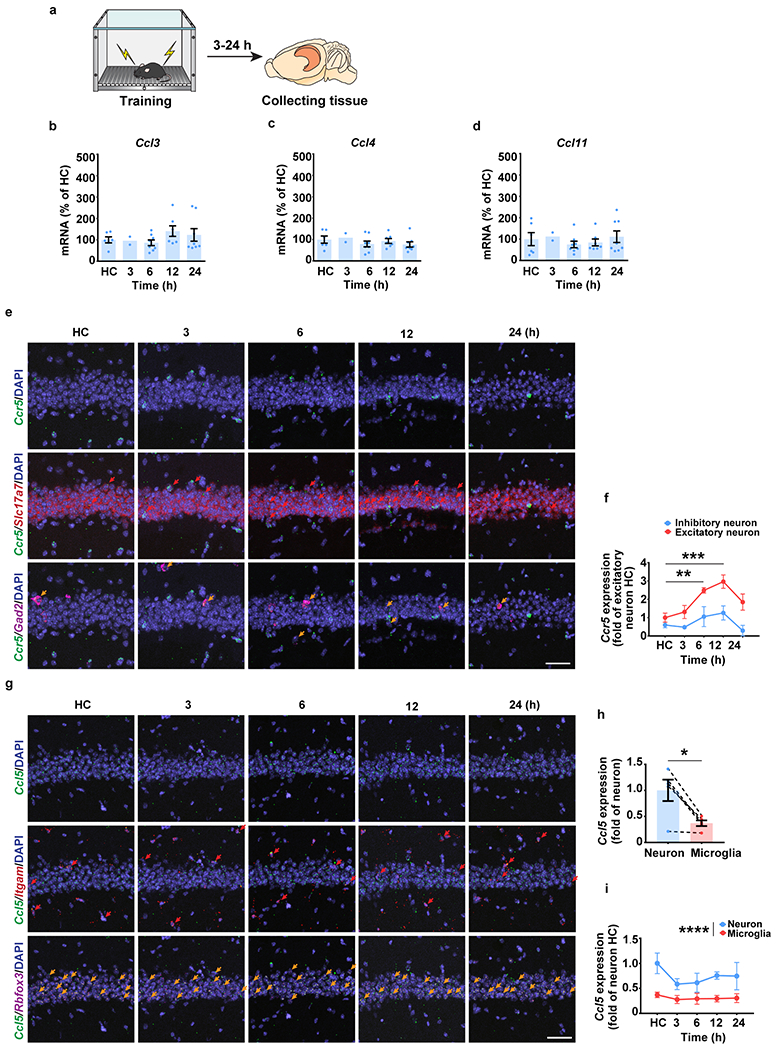
a, Schematics of hippocampal tissue collection.
b-d, qPCR experiment to measure Ccl3 (b), Ccl4 (c), and Ccl11 (d) expression in naïve mice (HC) and in mice at different times after contextual fear conditioning. HC=home cage. HC n=6, 3 h n=2, 6 h n=8, 12 h n=7, 24 h n=8 mice.
e, Representative images of Ccr5, Slc17a7 (excitatory neuronal marker), and Gad2 (inhibitory neuronal marker) mRNA expression in dCA1 from naïve mice or mice 3-24h after fear conditioning. Red arrows: cells expressing Ccr5 and Slc17a7. Orange arrows: cells expressing Ccr5 and Gad2. Scale bar, 50 μm.
f, Number of Ccr5-expressing excitatory and inhibitory neurons 3-24h after fear conditioning (HC n=4, 3 h n=4, 6 h n=4, 12 h n=4, 24 h n=3 mice; **P < 0.01, ***P < 0.001, two-way repeated measures ANOVA).
g, Representative images of Ccl5, Itgam, and Rbfox3 mRNA expression in dCA1 from naïve mice or mice 3-24h after fear conditioning. Red arrows: cells expressing Ccl5 and Itgam. Orange arrows: cells expressing Ccl5 and Rbfox3. Scale bar, 50 μm.
h, Number of Ccl5-expressing microglia and neurons in naïve mice (n=5 mice; *P < 0.05, paired t-test).
i, Number of Ccl5-expressing microglia and neurons in HC mice and 3-24h after fear conditioning (n=5 mice per group; ****P < 0.0001, two-way repeated measures ANOVA).
All results shown as mean ± s.e.m.
Extended Data Fig. 2|. The co-localization of Ccr5 expression and memory ensembles measured with cFos-tTA mice and the optogenetic (ChR2ETTC) pre-activation system.
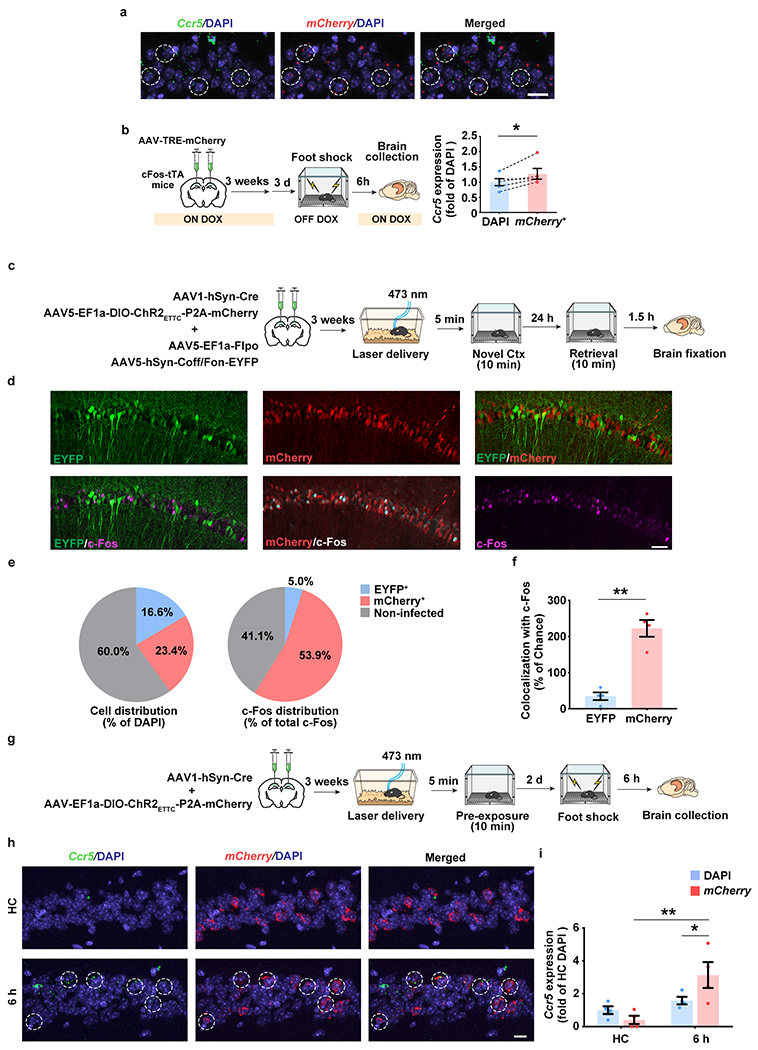
a, Representative images of Ccr5 and mCherry (neuronal ensemble) mRNA expression in dCA1 from cFos-tTA mice 6h after fear conditioning. Co-localization was labeled with dashed circles. Scale bar, 20 μm.
b, Quantification of Ccr5 expression in total cells (DAPI) and neuronal ensemble (mCherry+). (n=5 mice; *P < 0.05, paired t-test).
c, Schematics to use blue light to activate ChR2ETTC-expressing neurons to be involved in neuronal ensemble by pre-activation. INTRSECT system (Cre-off/Flp-on) was used to label non-ChR2ETTC-expressing neurons as the control.
d, Representative images of mCherry (pre-activated neurons), c-Fos (neuronal ensembles), and EYFP (non-preactivated neurons) in dCA1 24h after the novel context exposure. Scale bar, 50 μm.
e, c-Fos distribution in mCherry+, EYFP+ or non-infected cells.
f, Quantification of the colocalization between c-Fos and mCherry or EYFP. Colocalization (of c-Fos and mCherry) = (c-Fos+mCherry+/DAPI)/[(c-Fos+/DAPI)*(mCherry+/DAPI)] (n=4 mice per group; **P < 0.01, paired Student’s t-test).
g, Schematics to detect the colocalization of Ccr5 expression in neuronal ensembles using pre-activation system.
h, Representative images of Ccr5 and mCherry (pre-activated neuronal ensemble) mRNA expression in dCA1 6h after fear conditioning. Colocalization was labeled with dashed circles. Scale bar, 20 μm.
i, Quantification of Ccr5 expression in total cells (DAPI) and pre-activated neuronal ensemble (mCherry+) (n=4 mice per group; *P < 0.05, **P < 0.01, two-way repeated measures ANOVA).
All results shown as mean ± s.e.m.
Extended Data Fig. 3|. Characterization of CCR5-iTango2.
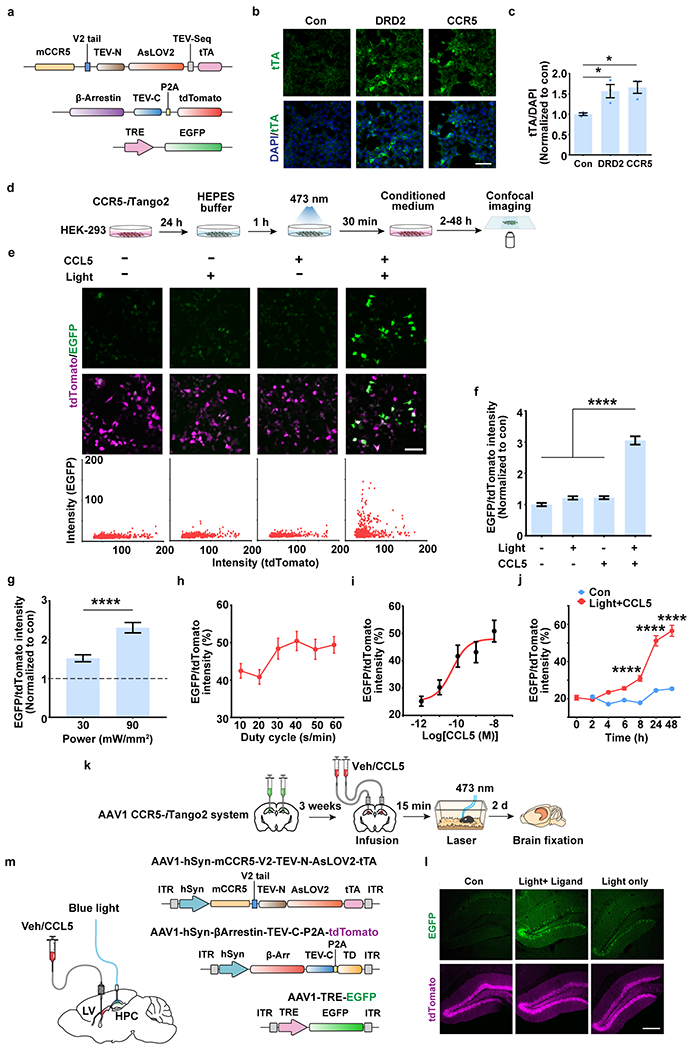
a, Schematics of CCR5-iTango2 constructs.
b, c, Expression validation of the CCR5-iTango system in HEK-293 cells. DRD2-iTango2 (for Dopamine 2 receptor) was used as a positive control. b, Representative images of tTA immunostaining. Scale bar, 50 μm. c, Quantification of tTA expression (intensity normalized to DAPI). n=3 slides per group; *P < 0.05, one-way ANOVA.
d, HEK-293 cells were transfected with 3 plasmids (see methods) for 24h and then treated with 10 nM CCL5 and blue light to induce EGFP expression.
e, Representative images of EGFP expression after different treatments. Light−CCL5− n=558, Light+CCL5− n=507, Light−CCL5+ n=521, Light+CCL5+ n= 500 cells. Scale bar, 50 μm.
f, Quantification of EGFP and tdTomato ratio (intensity). Compared to control, light or CCL5 group, only the group with both light and CCL5 showed EGFP expression. Light−CCL5− n=70, Light+CCL5− n=97, Light−CCL5+ n=97, Light+CCL5+ n=282 cells; ****P < 0.0001, one-way ANOVA.
g, Power-dependent EGFP expression. Results were normalized to no light control (30 mW/mm2 n=320, 90 mW/mm2 n=307 cells; ****P < 0.0001, student’s t-test).
h, Duty cycle dependent EGFP expression. The light stimulation was delivered every minute (~0.017 Hz) to induce EGFP expression. Light was kept on for 10-60 s during each stimulation to induce EGFP expression (10 s/min n=407, 20 s/min n=377, 30 s/min n=307, 40 s/min n=383, 50 s/min n=353, 60 s/min n=524 cells).
i, Dose curve of CCL5 to induced CCR5 activation (measured by EGFP/tdTomato fluorescence ratio) in cultured HEK-293 cells (10−12 M n=49, 10−11 M n=39, 10−10 M n=29, 10−9 M n=77, 10−8 M n=86 cells).
j, Time course of EGFP expression. The green fluorescence increased monotonically during the different time intervals investigated. Compared to other time intervals (2, 4, 6, 8 and 24h), the 48h time interval showed the highest EGFP/tdTomato ratio (Light+CCL5+ 0 h n=58, 2 h n=194, 4 h n=282, 6 h n=310, 8 h n=316, 24 h n=396, 48 h n=345 cells; Light−CCL5− 2 h n=195, 4 h n=219, 6 h n=290, 8 h n=304, 24 h n=445, 48 h n=401 cells; ****P < 0.0001, two-way ANOVA).
k, Schematics of CCR5-iTango2 AAVs injected into mouse hippocampus and validated through intra-hippocampal infusion of CCL5 and fiber-optic light stimulation.
l, Representative images of CCR5-iTango2-expressing hippocampal dentate gyrus neurons in control condition (no light and CCL5), light only, and light with CCL5. Ligand and light were directly delivered into the hippocampus. Scale bar, 250 μm.
m, Left: To test CCR5-iTango2 activation in dCA1 (Fig. 1h), CCL5 was infused into the lateral ventricle (LV) while light was delivered into dCA1 of hippocampus (HPC). Right: Schematics of CCR5-iTango2 AAVs.
All results shown as mean ± s.e.m.
Extended Data Fig. 4|. CCR5 activation measured with the CCR5-iTango2 system in vivo.
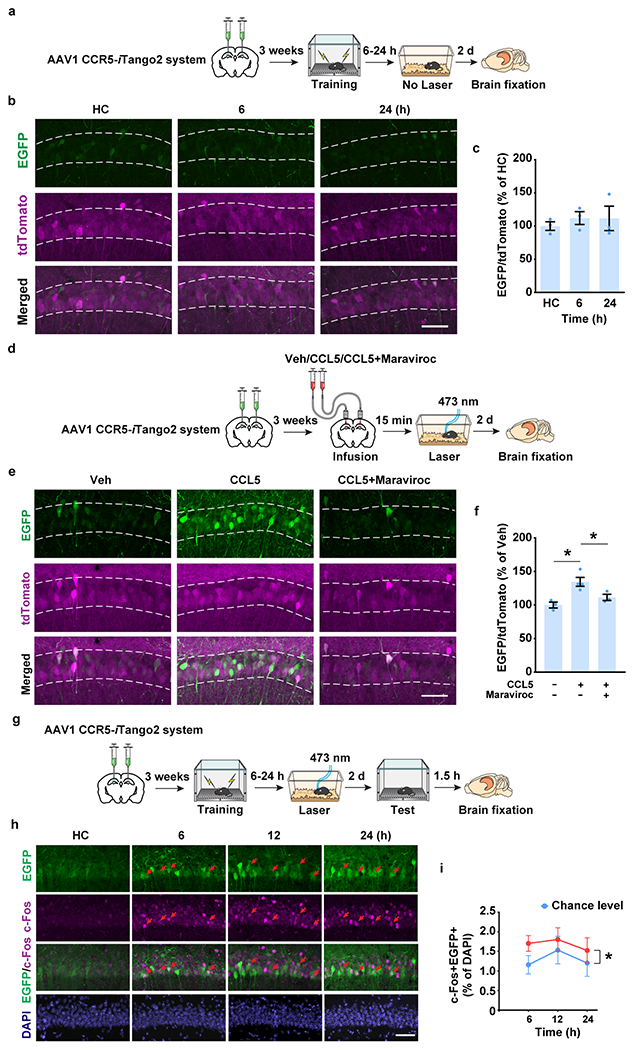
a-c, Validation of the leakage in CCR5-iTango2 system in vivo.
a, Schematics to test the CCR5-iTango2 system without light activation.
b, Representative images of EGFP and CCR5-iTango2-expressing dCA1 neurons after fear conditioning. Scale bar, 50 μm.
c, Quantification of EGFP expression (intensity normalized to tdTomato, n=3 mice per group).
d-f, Validation of the maraviroc mediated CCR5 inhibition in vivo.
d, Maraviroc was co-infused with CCL5 into mouse dCA1. The CCR5-iTango2 was used to measure CCR5 activation in vivo.
e, Representative images of CCR5-iTango2-expressing dCA1 neurons after fear conditioning. Scale bar, 50 μm.
f, Quantification of EGFP expression in different treatment (CCL5−Maraviroc− n=3, CCL5+Maraviroc− n=4, CCL5+Maraviroc+ n=3 mice; *P < 0.05, one-way ANOVA).
g-i, Analyses of colocalization of c-Fos and CCR5 activation in vivo.
g, Schematics to test c-Fos expression in EGFP+ cells after learning with the CCR5-iTango2 system.
h, Representative images of colocalization between EGFP and c-Fos in dCA1. Red arrows: c-Fos+EGFP+ cells. Scale bar, 50 μm.
i, Percentage of c-Fos+EGFP+ cells in total cells (6 h n=6, 12 h n=4, 24 h n=5 mice; *P < 0.05, two-way repeated measures ANOVA).
All results shown as mean ± s.e.m.
Extended Data Fig. 5|. Characterization of Opto-CCR5.
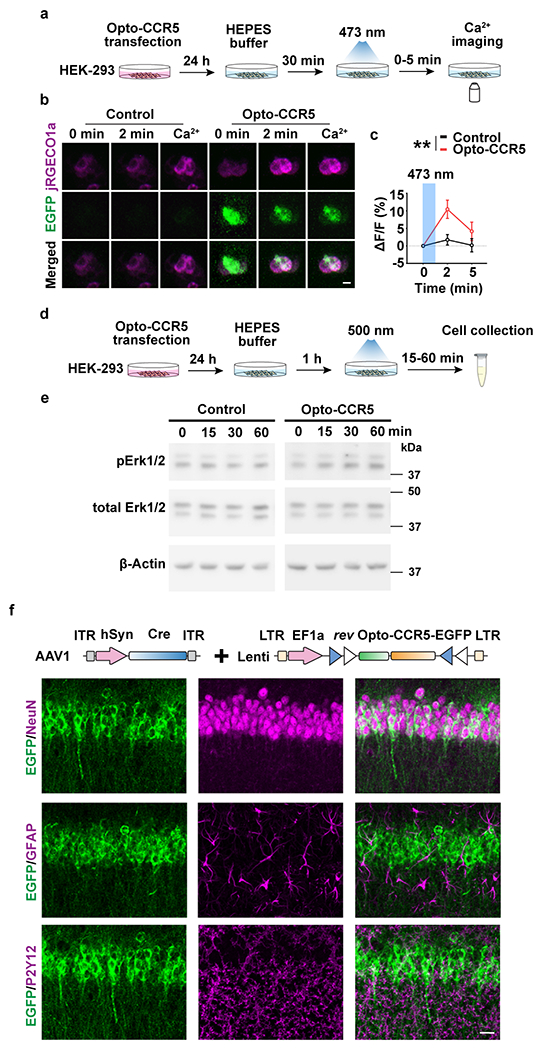
a, HEK-293 cells were transfected with Opto-CCR5 and jRGECO1a (Calcium sensor with red florescence) for 24h and then stimulated with blue light to induce a calcium response.
b, Representative images at 0 min or 2 min after stimulation, or in the medium with high calcium concentration. Scale bar, 20 μm.
c, Quantification of florescence change after light stimulation. In HEK-293 cells, Opto-CCR5-EGFP activation by light significantly increased intracellular Ca2+ concentration reflected by jRGECO1a (Control 2 min n=95, Control 5 min n=96, Opto-CCR5 2 min n=86, Opto-CCR5 5 min n=89 cells; **P < 0.01, two-way ANOVA).
d, e, Opto-CCR5 activation increased pErk1/2 in HEK-293 cells.
d, HEK-293 cells were transfected with the Opto-CCR5 construct. After 24h expression, the cells were starved in HEPES buffer for 1h before a 2 min light stimulation to reduce basal pErk1/2 levels. Cells were collected at 0 (no light stimulation), 15, 30 or 60 min after light stimulation and subjected to Western blot analysis to investigate the phosphorylation level of Erk1/2 (e).
f, Expression of Opto-CCR5 in dCA1 neurons. To express Opto-CCR5 in dCA1 neurons, AAV1-hSyn-Cre was co-injected with Lenti-DIO-Opto-CCR5. NeuN (neuron marker), GFAP (astrocyte marker) and P2Y12 (microglia marker) were co-stained with EGFP in dCA1. Scale bar, 20 μm.
All results shown as mean ± s.e.m.
Extended Data Fig. 6|. CCR5/CCL5 signaling regulates memory linking in an appetitive place preference task.
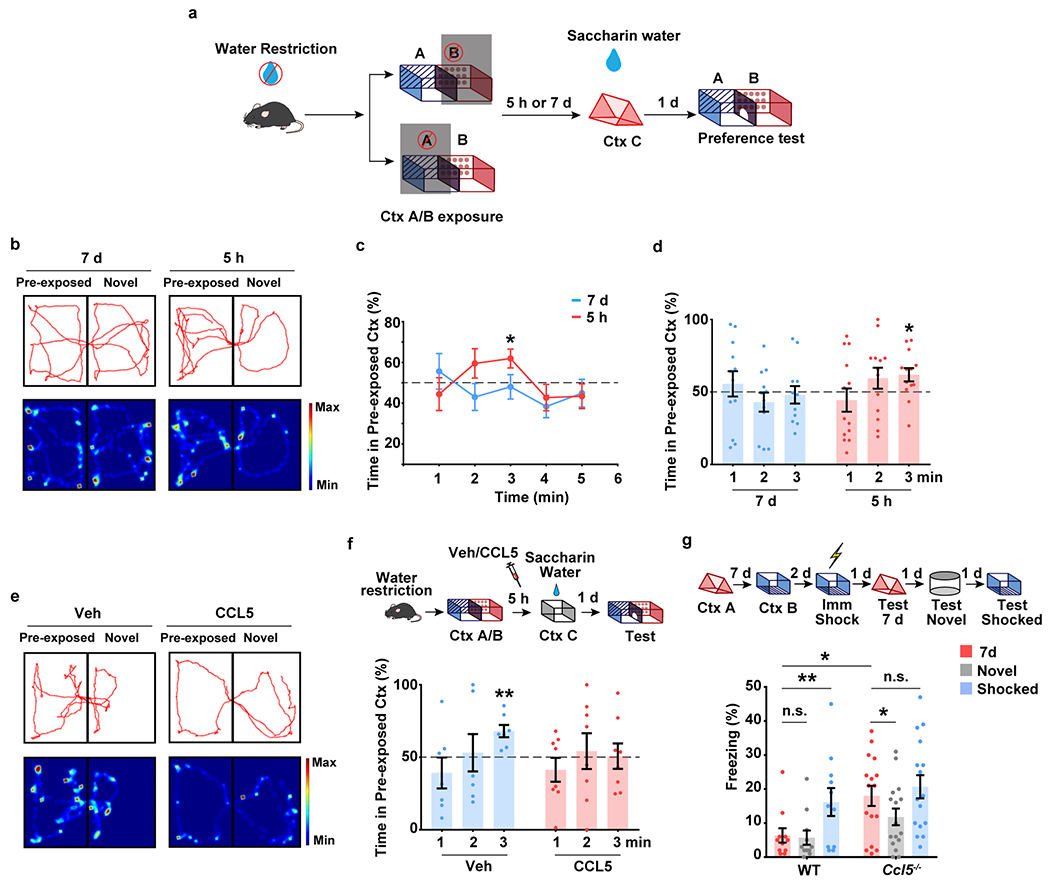
a-f, Place preference-based behavior model to test the linking of contextual memories.
a, Schematics of place preference-based linking behavior.
b, Representative trajectory plot (in the 3rd minute) of mice in the pre-exposed context and a novel context with a 5h and 7d interval.
c, d, Mice showed a significant preference for pre-exposed context during the 3rd minute in the 5h group compared to the 7d group (5h, n=13, 7d n=12 mice; *P < 0.05, one sample paired t-test compared to 50%)
e, Representative trajectory plot (in the 3rd minute) of mice in the pre-exposed context and a novel context with Vehicle or CCL5 infusion.
f, CCL5 infusion in dCA1 impaired contextual memory linking with a 5h interval (Veh n=7, CCL5 n=8; **P < 0.01, one sample paired t-test compared to 50%).
g, Ccl5 knockout extended the temporal window of contextual memory linking (WT n=11, Ccl5−/− n=16; *P < 0.05, **P < 0.01, two-way repeated measures ANOVA).
All results shown as mean ± s.e.m.
Extended Data Fig. 7|. CCR5 regulate memory allocation.
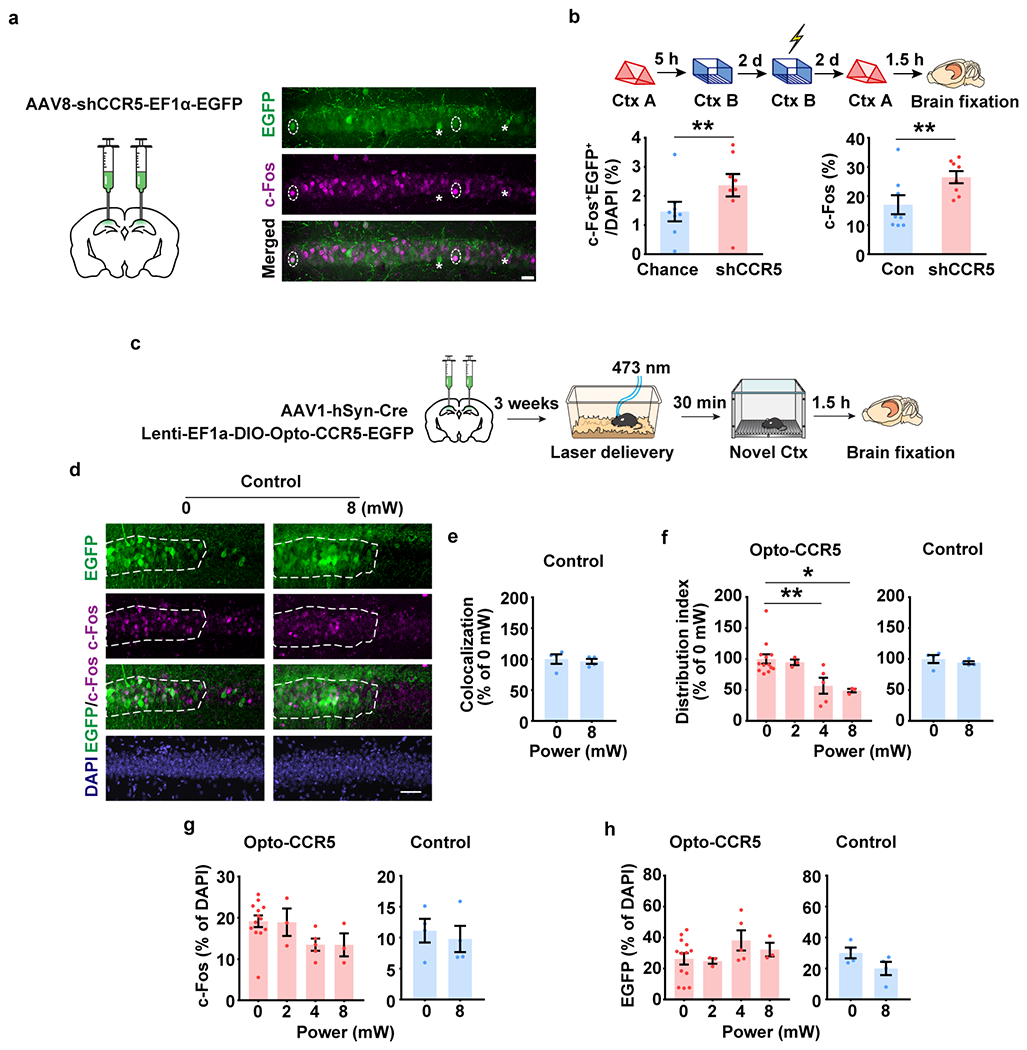
a, b, Ccr5 knockdown enhanced memory allocation.
a, Schematics of AAV8-shRNA-CCR5-Ef1α-EGFP injection, and representative images of c-Fos and EGFP staining. Two EGFP+c-Fos+ cells were labelled by dotted line circle and two EGFP+c-Fos− cells were labelled by asterisk. Scale bar, 20 μm.
b, dCA1 neurons with Ccr5 knockdown had a higher probability of expressing c-Fos after a memory test in context A. Left: The percentage of c-Fos+EGFP+ cells in total (DAPI). Right: percentage of c-Fos+ cells in EGFP− cells (Con) or in EGFP+ cells with Ccr5 knockdown (shCCR5) (n=8 mice, **P < 0.01, paired t-test).
c-h, Expression of c-Fos and Opto-CCR5 or EGFP control in dCA1 (Opto-CCR5 0 mW n=13, 2 mW n=3, 4 mW n=5, 8 mW n=3 mice; EGFP control n=4 mice per group).
d, Representative images of colocalization between c-Fos and EGFP control after light stimulation and novel context exposure. Scale bar, 50 μm.
e, Colocalization between c-Fos+ cells and EGFP+ cells after normalization to chance level.
f, Quantification of c-Fos distribution in EGFP+ and EGFP− cells in the Opto-CCR5-EGFP or EGFP control group (*P < 0.05, **P < 0.01, one-way ANOVA).
g, Percentage of c-Fos positive cells (normalized to cells with DAPI staining) in dCA1 with light stimulation of different power levels.
h, Percentage of EGFP expression cells (normalized to cells with DAPI staining) in dCA1with light stimulation of different power levels.
All results shown as mean ± s.e.m.
Extended Data Fig. 8|. Analysis of the cumulative distribution of inter-event intervals recorded with miniscopes in WT and Ccr5 KO mice.
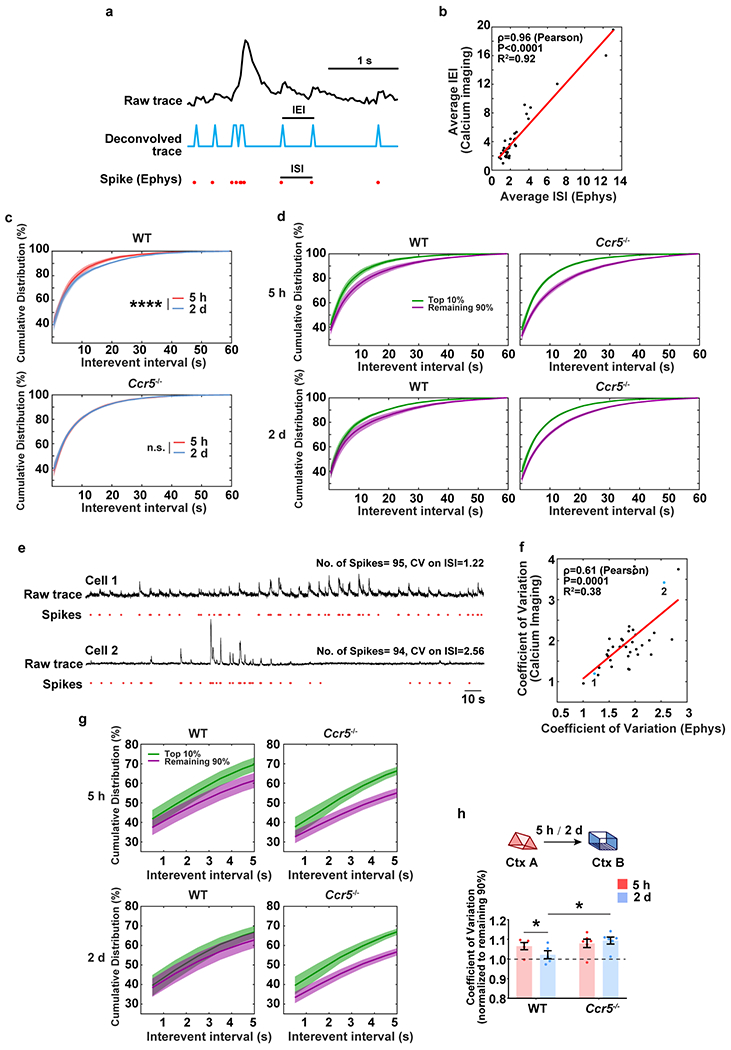
a, Schematics used to extract spike information from raw traces of calcium imaging. Plot shows a 3s chunk of data from a single neuron using GCaMP6f calcium imaging and loose-seal cell-attached electrophysiological (Ephys) recordings.
b, The average inter-event interval (IEI, from miniscope recordings) is highly correlated with the average inter-spike interval (ISI, by Ephys) (n=36 cells; R2=0.92, P < 0.0001, ρ=0.96, Pearson’s correlation coefficient).
c, Cumulative distribution of IEI of the top 10% most active neurons (in Ctx A). The top 10% most active neurons from WT mice showed a significantly different distribution of IEI 5h compared to 2d after the context A exposure. In contrast, this subset of cells showed a similar pattern for both time intervals in Ccr5−/− mice (WT n=5, Ccr5−/− n=6 mice; ****P < 0.0001, Kolmogorov–Smirnov test).
d, Cumulative distribution of IEIs of the top 10% most active neurons and the remaining 90% neurons (in Ctx A) at 5h or 2d after the context A exposure (WT n=5, Ccr5−/− n=6 mice).
e, Although neurons may have similar number of spikes during a certain time period of recording, the difference of their coefficient of variation unveils different firing patterns ranging from regular firing (Cell 1) to bursty firing (Cell 2).
f, The coefficient of variation of IEI (by calcium imaging) highly correlates with the coefficient of variation of ISI (by Ephys) (n=36 cells; R2=0.38, P=0.0001, ρ=0.61, Pearson’s correlation coefficient).
g, Cumulative distribution of IEI (the first 5s, zoom-in from d) of the top 10% highly active neurons and the remaining 90% neurons (in Ctx A) at 5h or 2d after the context A exposure. The difference between the top 10% most active and the remaining 90% neurons in Ctx A was strongly reduced from 5h to 2d in WT mice but not in Ccr5−/− mice (WT n=5, Ccr5−/− n=6 mice).
h, Coefficient of variation from the top 10% most active neurons (normalized to the remaining 90%). WT or Ccr5−/− mice were exposed to Ctx B 5h or 2d after Ctx A. WT mice showed a significant decrease in the coefficient of variation of IEI comparing the data for the 2d and 5h intervals, while Ccr5−/− mice had similar coefficient of variation of IEI in both intervals (WT n=5, Ccr5−/− n=6 mice; *P < 0.05, two-way repeated measures ANOVA).
All results shown as mean ± s.e.m.
Extended Data Fig. 9|. Analysis of neuronal activity and overlap probability in WT and Ccr5 KO mice.
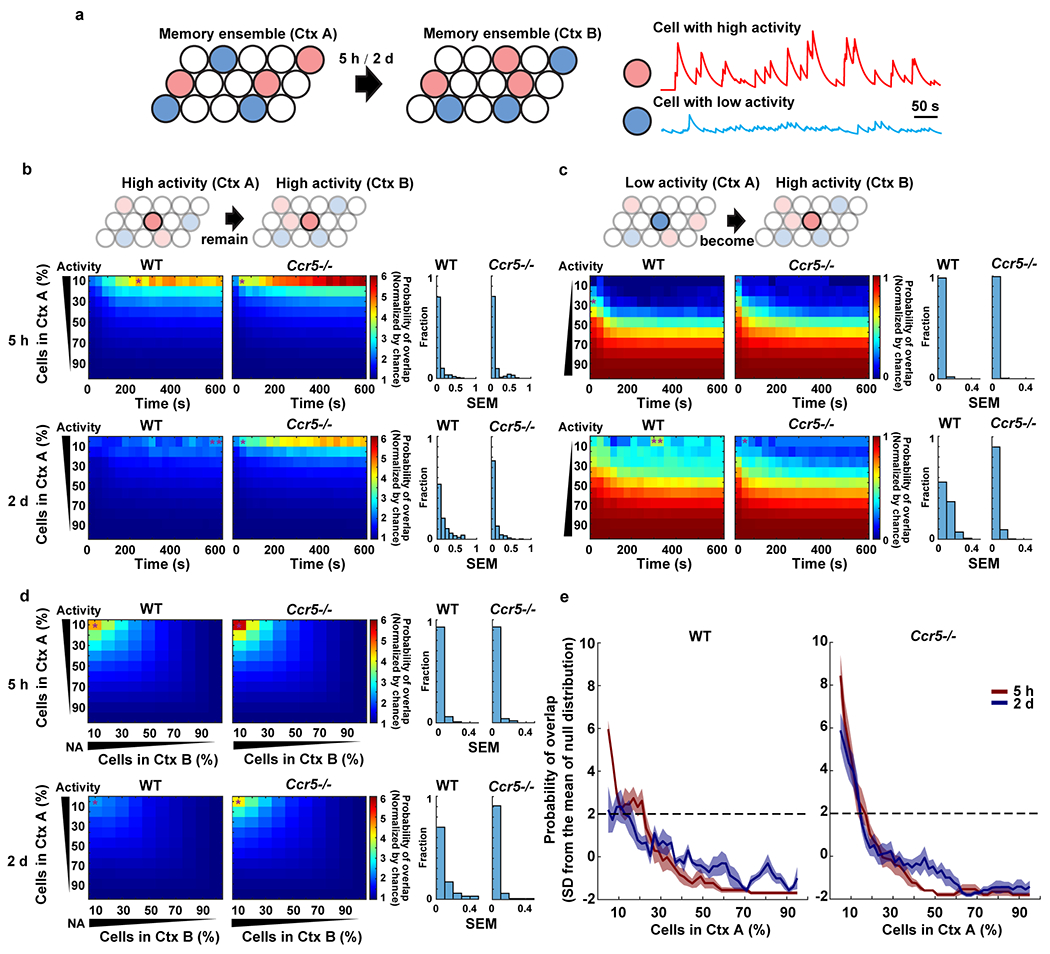
a, Schematics showing that cells in neuronal ensembles can be sorted into cells with high neuronal activity (red) and low activity (blue), based on their average activity during the exploration of Ctx A and Ctx B which were separated by either a 5h or 2d interval.
b, c, Left: Probability of overlap (averaged across mice) between subsets of cells with different levels of activity (y axis) during exploration of Ctx A and Ctx B, in WT and Ccr5−/− mice across time in Ctx B (x axis). Color bars refer to normalized probabilities (chance=1). Cumulative values were used for x and y axis (e.g., for x axis, 200s means 0-200s; for y axis, 30 refers to the neurons within the top 30% of high (b) or low (c) activity). Right: the distribution of SEM across mice for the figures on the left. Asterisks (in the probability of overlap figures) represent the maximum SEM from each plot (WT n=5, Ccr5−/− n=6 mice).
b, Probability of overlap between high activity cells in Ctx A and high activity cells in Ctx B in WT and Ccr5−/− mice. Note that the top 10% high activity cells in Ctx A are very likely to remain within the top 10% high activity cells in Ctx B 5h later for both WT and Ccr5−/− mice. In contrast, this subset of cells was reactivated around chance levels 2d later in Ctx B in WT mice, but not in Ccr5−/− mice. In the Ccr5−/− mice this subset of cells was still very likely to remain within the top 10% high activity cells in Ctx B.
c, Probability of overlap between low activity cells in Ctx A and high activity cells in Ctx B in WT and Ccr5−/− mice. In contrast to high activity cells in Ctx A, the low activity cells in Ctx A were less likely (compared to chance) to be within the high activity cells in Ctx B.
d, The probability of overlap between different ensembles (Ctx A and Ctx B) was sorted by neuronal activity in Ctx A and Ctx B, with a 5h or 2d interval between the two contextual exposures. Cells were sorted in percentages from top to bottom mean neuronal activity in the first context (Ctx A, y axis) and from left to right in the second context (Ctx B, x axis). With a 5h interval between Ctx A and B, the likelihood that neurons with high activity in Ctx A remained with high activity in Ctx B was higher than chance for both WT and Ccr5 KO mice. With a 2d interval, the likelihood that neurons with high activity in Ctx A remained high activity in Ctx B was at chance levels in WT mice. In contrast, Ccr5 KO mice showed a pattern similar to that observed with the 5h interval (WT n=5, Ccr5−/− n=6 mice).
e, Cells were again sorted from high to low activity in Ctx A with a 10% sliding window and 2% steps. The probability of overlap between subsets of cells (10% ensemble size) from Ctx A and the ensemble cells with top 10% high activity in Ctx B was plotted. The probability values were z-scored with respect to a null distribution created by randomly subsampling 10% of cells from Ctx A 10,000 times (i.e., results are represented as standard deviation (SD) from the mean of the null distribution). The 2SD threshold is labeled with a dashed line (WT n=5, Ccr5−/− n=6 mice).
Extended Data Fig. 10|. Graphic abstract.
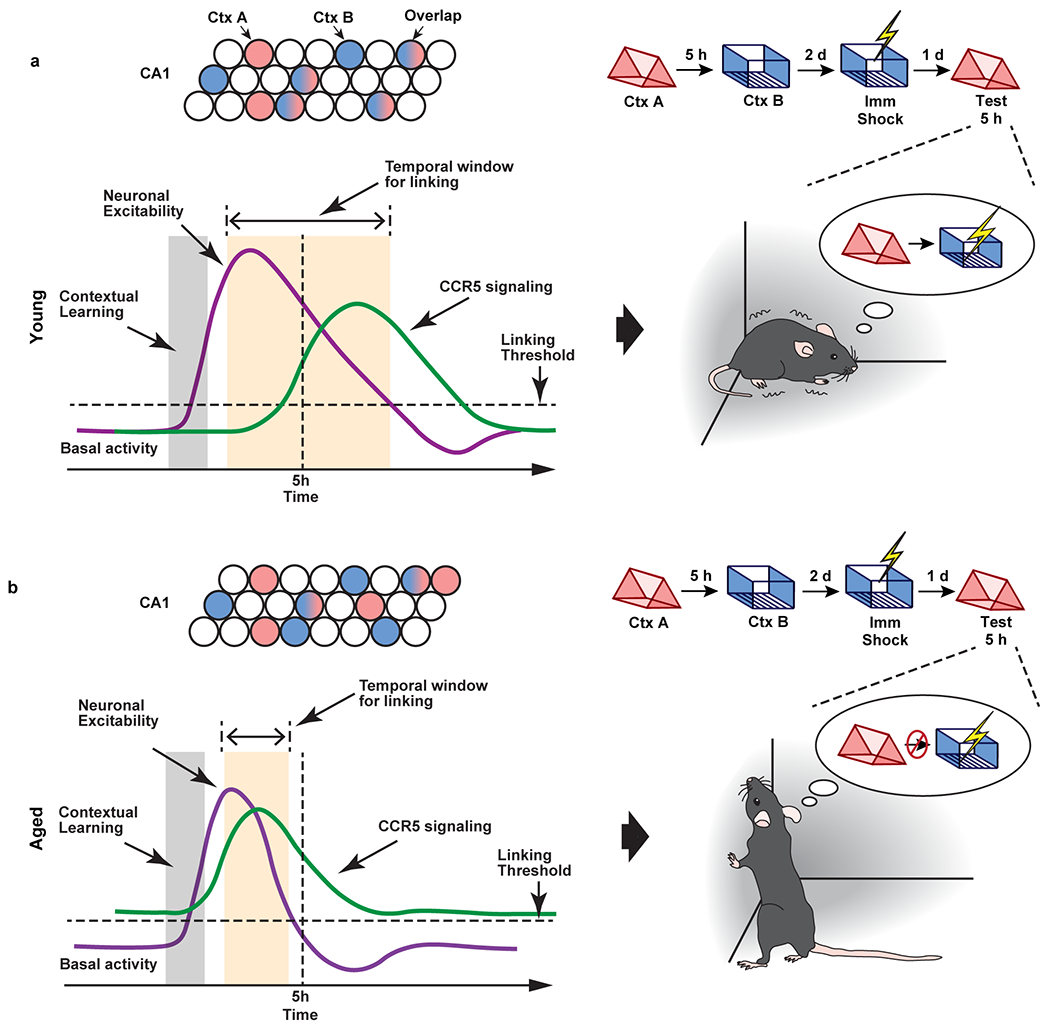
a, In young mice, CCR5 signaling increases at a time point more than 5h after learning, and neuronal excitability and memory ensemble overlap remain high at 5h after learning. As a result, memories for context A (neutral context) and context B (shocked context) are linked together, and mice show high freezing during the test in context A.
b, In aged mice, CCR5 signaling is higher than young mice at baseline and there is a further increase before 5h after learning, which lead to a reduction of neuronal excitability and memory ensemble overlap at 5h after learning. As a result, memories for context A (neutral context) and context B (shocked context) are not linked, and mice show low freezing during the test in context A.
Supplementary Material
Acknowledgements
We thank A. Macalino, E. Chen, E. Ramirez, C. Riviere-Cazaux, M. López-Aranda and E. Lu for advice and technical support; M. Sehgal and LM. De Biase for providing transgenic mice; A. Luchetti for analysis discussion. This work was supported by grants from the NIMH (R01 MH113071), NIA (R01 AG013622), NINDS (RO1 NS106969) and from the Dr. Miriam and Sheldon G. Adelson Medical Research Foundation to A.J.S.
Footnotes
Code availability
The code for concatenation analysis of miniscope videos is available on github.
https://github.com/Almeida-FilhoDG/ConcatMiniscope.
All other code is available from the corresponding authors.
Competing interests The authors declare no competing interests.
Data availability
The original videos and datasets generated and/or analyzed during the current study are available from the corresponding authors.
References
- 1.Cai DJ et al. A shared neural ensemble links distinct contextual memories encoded close in time. Nature 534, 115–118 (2016). [DOI] [PMC free article] [PubMed] [Google Scholar]
- 2.Rashid AJ et al. Competition between engrams influences fear memory formation and recall. Science 353, 383–387 (2016). [DOI] [PMC free article] [PubMed] [Google Scholar]
- 3.Abdou K et al. Synapse-specific representation of the identity of overlapping memory engrams. Science 360, 1227–1231, doi: 10.1126/science.aat3810 (2018). [DOI] [PubMed] [Google Scholar]
- 4.Yetton BD, Cai DJ, Spoormaker VI, Silva AJ & Mednick SC Human Memories Can Be Linked by Temporal Proximity. Front Hum Neurosci 13, 315, doi: 10.3389/fnhum.2019.00315 (2019). [DOI] [PMC free article] [PubMed] [Google Scholar]
- 5.Mack ML, Love BC & Preston AR Building concepts one episode at a time: The hippocampus and concept formation. Neurosci Lett 680, 31–38, doi: 10.1016/j.neulet.2017.07.061 (2018). [DOI] [PMC free article] [PubMed] [Google Scholar]
- 6.Zhou L & Saksena NK HIV Associated Neurocognitive Disorders. Infect.Dis.Rep. 5, e8 (2013). [DOI] [PMC free article] [PubMed] [Google Scholar]
- 7.Ellis R, Langford D & Masliah E HIV and antiretroviral therapy in the brain: neuronal injury and repair. Nat Rev Neurosci 8, 33–44, doi: 10.1038/nrn2040 (2007). [DOI] [PubMed] [Google Scholar]
- 8.Jung W & Lee SH Memory deficit in patients with schizophrenia and posttraumatic stress disorder: relational vs item-specific memory. Neuropsychiatr Dis Treat 12, 1157–1166, doi: 10.2147/ndt.S104384 (2016). [DOI] [PMC free article] [PubMed] [Google Scholar]
- 9.Avery SN et al. Impaired relational memory in the early stage of psychosis. Schizophr Res 212, 113–120, doi: 10.1016/j.schres.2019.07.060 (2019). [DOI] [PMC free article] [PubMed] [Google Scholar]
- 10.Czajkowski R et al. Encoding and storage of spatial information in the retrosplenial cortex. Proc.Natl.Acad.Sci.U.S.A 111, 8661–8666 (2014). [DOI] [PMC free article] [PubMed] [Google Scholar]
- 11.Han JH et al. Selective erasure of a fear memory. Science 323, 1492–1496, doi: 10.1126/science.1164139 (2009). [DOI] [PubMed] [Google Scholar]
- 12.Sano Y et al. CREB regulates memory allocation in the insular cortex. Curr Biol 24, 2833–2837, doi: 10.1016/j.cub.2014.10.018 (2014). [DOI] [PMC free article] [PubMed] [Google Scholar]
- 13.Zhou Y et al. CREB regulates excitability and the allocation of memory to subsets of neurons in the amygdala. Nat Neurosci 12, 1438–1443, doi: 10.1038/nn.2405 (2009). [DOI] [PMC free article] [PubMed] [Google Scholar]
- 14.Lanfranco MF, Mocchetti I, Burns MP & Villapol S Glial- and Neuronal-Specific Expression of CCL5 mRNA in the Rat Brain. Front Neuroanat. 11, 137 (2017). [DOI] [PMC free article] [PubMed] [Google Scholar]
- 15.Zhou M et al. CCR5 is a suppressor for cortical plasticity and hippocampal learning and memory. Elife 5, doi: 10.7554/eLife.20985 (2016). [DOI] [PMC free article] [PubMed] [Google Scholar]
- 16.Torres-Muñoz JE, Van Waveren C, Keegan MG, Bookman RJ & Petito CK Gene expression profiles in microdissected neurons from human hippocampal subregions. Brain Res Mol Brain Res 127, 105–114, doi: 10.1016/j.molbrainres.2004.05.017 (2004). [DOI] [PubMed] [Google Scholar]
- 17.Shepherd AJ, Loo L & Mohapatra DP Chemokine co-receptor CCR5/CXCR4-dependent modulation of Kv2.1 channel confers acute neuroprotection to HIV-1 glycoprotein gp120 exposure. PLoS One 8, e76698, doi: 10.1371/journal.pone.0076698 (2013). [DOI] [PMC free article] [PubMed] [Google Scholar]
- 18.Yiu AP et al. Neurons are recruited to a memory trace based on relative neuronal excitability immediately before training. Neuron 83, 722–735, doi: 10.1016/j.neuron.2014.07.017 (2014). [DOI] [PubMed] [Google Scholar]
- 19.Lee D et al. Temporally precise labeling and control of neuromodulatory circuits in the mammalian brain. Nat Methods 14, 495–503, doi: 10.1038/nmeth.4234 (2017). [DOI] [PubMed] [Google Scholar]
- 20.Airan RD, Thompson KR, Fenno LE, Bernstein H & Deisseroth K Temporally precise in vivo control of intracellular signalling. Nature 458, 1025–1029, doi: 10.1038/nature07926 (2009). [DOI] [PubMed] [Google Scholar]
- 21.Shideman CR, Hu S, Peterson PK & Thayer SA CCL5 evokes calcium signals in microglia through a kinase-, phosphoinositide-, and nucleotide-dependent mechanism. J Neurosci Res 83, 1471–1484, doi: 10.1002/jnr.20839 (2006). [DOI] [PubMed] [Google Scholar]
- 22.Marozsan AJ et al. Mechanisms involved in stimulation of human immunodeficiency virus type 1 replication by aminooxypentane RANTES. J Virol 75, 8624–8638, doi: 10.1128/jvi.75.18.8624-8638.2001 (2001). [DOI] [PMC free article] [PubMed] [Google Scholar]
- 23.Wang SW et al. CCL5 and CCR5 interaction promotes cell motility in human osteosarcoma. PLoS One 7, e35101, doi: 10.1371/journal.pone.0035101 (2012). [DOI] [PMC free article] [PubMed] [Google Scholar]
- 24.Shen W et al. Activation of the chemotactic peptide receptor FPRL1 in monocytes phosphorylates the chemokine receptor CCR5 and attenuates cell responses to selected chemokines. Biochem Biophys Res Commun 272, 276–283, doi: 10.1006/bbrc.2000.2770 (2000). [DOI] [PubMed] [Google Scholar]
- 25.Moyer JR Jr., Thompson LT & Disterhoft JF Trace eyeblink conditioning increases CA1 excitability in a transient and learning-specific manner. J.Neurosci. 16, 5536–5546 (1996). [DOI] [PMC free article] [PubMed] [Google Scholar]
- 26.Oh MM, Oliveira FA & Disterhoft JF Learning and aging related changes in intrinsic neuronal excitability. Front Aging Neurosci 2, 2, doi: 10.3389/neuro.24.002.2010 (2010). [DOI] [PMC free article] [PubMed] [Google Scholar]
- 27.Yokose J et al. Overlapping memory trace indispensable for linking, but not recalling, individual memories. Science 355, 398–403, doi: 10.1126/science.aal2690 (2017). [DOI] [PubMed] [Google Scholar]
- 28.Rogerson T et al. Molecular and Cellular Mechanisms for Trapping and Activating Emotional Memories. PLoS One 11, e0161655, doi: 10.1371/journal.pone.0161655 (2016). [DOI] [PMC free article] [PubMed] [Google Scholar]
- 29.Mayford M & Reijmers L Exploring Memory Representations with Activity-Based Genetics. Cold Spring Harb Perspect Biol 8, a021832, doi: 10.1101/cshperspect.a021832 (2015). [DOI] [PMC free article] [PubMed] [Google Scholar]
- 30.Tanaka KZ et al. The hippocampal engram maps experience but not place. Science 361, 392–397, doi: 10.1126/science.aat5397 (2018). [DOI] [PubMed] [Google Scholar]
- 31.Mello CV et al. Fat-storing multilocular cells expressing CCR5 increase in the thymus with advancing age: potential role for CCR5 ligands on the differentiation and migration of preadipocytes. Int.J.Med.Sci. 7, 1–14 (2009). [DOI] [PMC free article] [PubMed] [Google Scholar]
- 32.Yung R, Mo R, Grolleau-Julius A & Hoeltzel M The effect of aging and caloric restriction on murine CD8+ T cell chemokine receptor gene expression. Immun Ageing 4, 8, doi: 10.1186/1742-4933-4-8 (2007). [DOI] [PMC free article] [PubMed] [Google Scholar]
- 33.Wilkin TJ & Gulick RM CCR5 antagonism in HIV infection: current concepts and future opportunities. Annu Rev Med 63, 81–93, doi: 10.1146/annurev-med-052010-145454 (2012). [DOI] [PMC free article] [PubMed] [Google Scholar]
- 34.Aharoni D, Khakh BS, Silva AJ & Golshani P All the light that we can see: a new era in miniaturized microscopy. Nat Methods 16, 11–13, doi: 10.1038/s41592-018-0266-x (2019). [DOI] [PMC free article] [PubMed] [Google Scholar]
- 35.Pnevmatikakis EA & Giovannucci A NoRMCorre: An online algorithm for piecewise rigid motion correction of calcium imaging data. J Neurosci Methods 291, 83–94, doi: 10.1016/j.jneumeth.2017.07.031 (2017). [DOI] [PubMed] [Google Scholar]
- 36.Zhou P et al. Efficient and accurate extraction of in vivo calcium signals from microendoscopic video data. Elife 7, doi: 10.7554/eLife.28728 (2018). [DOI] [PMC free article] [PubMed] [Google Scholar]
- 37.Almeida-Filho D ConcatMiniscope: This is the first release of the ConcatMiniscope Pipeline (Version 1.0.0-Beta) Zenodo, doi: 10.5281/zenodo.5676164 (2021). [DOI] [Google Scholar]
- 38.Friedrich J, Zhou P & Paninski L Fast online deconvolution of calcium imaging data. PLoS Comput Biol 13, e1005423, doi: 10.1371/journal.pcbi.1005423 (2017). [DOI] [PMC free article] [PubMed] [Google Scholar]
- 39.Wei Z et al. A comparison of neuronal population dynamics measured with calcium imaging and electrophysiology. PLoS Comput Biol 16, e1008198, doi: 10.1371/journal.pcbi.1008198 (2020). [DOI] [PMC free article] [PubMed] [Google Scholar]
Associated Data
This section collects any data citations, data availability statements, or supplementary materials included in this article.
Supplementary Materials
Data Availability Statement
The original videos and datasets generated and/or analyzed during the current study are available from the corresponding authors.


