

Abstract
We compared growth, physical features and minor anomalies in 131 first grade children with fetal alcohol spectrum disorders (FASD) to those of a representative comparison group of typically developing children from the same populations (n=1212). The data were collected from three regional sites in the NIAAA-funded Collaboration on FASD Prevalence (CoFASP). Dysmorphology examinations were performed by a team of expert clinical geneticists, and FASD diagnoses were assigned according to the Revised Institute of Medicine Guidelines, which include assessments of growth, dysmorphology, neurobehavior and maternal risk interviews. We present detailed data on 32 physical traits, minor anomalies and a summary dysmorphology score for children within each of the four diagnostic categories in the continuum of FASD. There were few differences in the frequency of FASD diagnoses by race or Hispanic ethnicity. Children with FASD were born to mothers who reported using alcohol, tobacco (28.3%), and other drugs (14.2%) during pregnancy. Controlling for tobacco and other drug use, risk analysis indicated that women with a drinking pattern of 3 drinks per drinking day prior to pregnancy were 10 times more likely (p<.001, OR=9.92, 95% CI: 4.6–21.5) to bear a child with FASD than those who reported abstinence prior to pregnancy.
Keywords: fetal alcohol spectrum disorders (FASD), FASD physical phenotypes, maternal risk for FASD, alcohol use in pregnancy
1.1. Introduction: Fetal Alcohol Spectrum Disorders in the United States
The population-based prevalence of fetal alcohol spectrum disorders (FASD) is not well known for most populations in the world (Lange et al., 2017; Roozen et al., 2016). FASD prevalence generally has been estimated from studies of alcohol use reported by women of childbearing age and those who are pregnant (Denny et al., 2020; Lange et al., 2017; Popova et al., 2018). Because FASD is rarely diagnosed (or frequently misdiagnosed) (Chasnoff, Wells, & King, 2015; Lange, Rehm, & Popova, 2018; May, Chambers et al., 2018), few large clinic- or population-based studies have provided comprehensive details of the growth and morphologic features of children with FASD in the general population of the United States (U.S.) (Abel & Sokol, 1987; Astley, 2010; Spohr, 2018; Streissguth et al., 1990). Moreover, few studies have provided comparisons with verified, typically-developing controls representative of the same populations studied.
The complete phenotypic range of children with FASD in the general U.S. population was not described in detail until recently. From 2009–18, the National Institute on Alcohol Abuse and Alcoholism (NIAAA), of the National Institutes of Health (NIH), sponsored an initiative called the Collaboration on Fetal Alcohol Spectrum Disorders Prevalence (CoFASP). Two grant-funded teams, led by different principal investigators, embarked on FASD prevalence studies in four regions of the U.S., collecting data from eight distinct cohorts of first grade students. The minimum prevalence rate among the cohorts was reported in JAMA to range from 1.1% to 5% (mean = 2.2%, median = 1.9%). Furthermore, using a conservatively weighted estimation methodology that corrected for the proportion of children that were not accessed by the study due to consent procedures, the prevalence ranged from 3.1% to 9.9% (mean= 6.5%, median = 6.7%), among the eight cohorts (May, Chambers et al., 2018).
1.2. Background: Documentation of Physical Characteristics of Children with FASD
In the first papers that defined a physical phenotype of fetal alcohol syndrome (FAS) (Aase, 1994; Clarren & Smith, 1978; Hanson et al., 1976; Jones & Smith, 1973, 1975), physical traits gathered from clinical cases were categorized and/or described individually or in aggregate. But few such studies have provided details of the physical traits of children within the full continuum of FASD (May et al., 2015; Roozen et al., 2016). However, over the past two decades, population-based studies in South Africa (May et al., 2000, 2005, 2007, 2013, 2016a, 2016b, 2017, 2021), Italy (May et al., 2006, 2011), and Canada (Popova et al., 2019) have provided detailed descriptions of the physical phenotypes of children with diagnoses within the complete continuum of FASD.
The CoFASP studies made final diagnoses based on detailed assessments of: 1) growth and physical traits via in-person dysmorphology examinations, 2) neurobehavioral testing by school psychologists and behavioral evaluations by teachers and parents, and 3) maternal risk factor interviews with the mothers. Both children with a specific FASD (cases) and a large number of typically-developing comparison (control) children were studied, and a rich cross-sectional data set was compiled for each site (Chambers et al., 2019; May, Hasken, Baete, et al., 2020; May, Hasken, Bozeman, et al., 2020; May, Hasken, Stegall, et al., 2020). The present manuscript sets forth a summary, case control description and analysis of the physical traits of children with FASD and typically-developing comparison children in three regions of the CoFASP study. The purpose of this report is to describe in detail the physical phenotypes and proximal maternal risk factors of children within the complete continuum of FASD in the U.S. population.
1.3. Variation in Physical Phenotypes of Fetal Alcohol Syndrome and FASD
Animal and human studies document substantial differences in facial and other physical characteristics of subjects within the continuum of FASD, largely because of the widely variable quantity, frequency and gestational timing of alcohol exposure (and other drugs) in the prenatal period (May, Blankenship, Marais, Gossage, Kalberg, Joubert, et al., 2013). This is true across the various diagnostic categories of FASD. However, variation in the physical phenotypes of affected children can also be demonstrated within each diagnostic category (Jacobson et al., 2021; May et al., 2021; Suttie et al., 2018).
Gastrulation and neurulation (weeks 3 and 4 of human gestation) constitute two early developmental periods in which the embryo is highly susceptible to alcohol-induced teratogenicity (Sulik, 2005). During gastrulation and neurulation, prenatal alcohol exposure can bring about apoptosis, resulting in changes to the morphology of midline facial structures, brain, eyes and inner ear (Godin et al., 2010; Sulik, 2005). Animal models demonstrate that alcohol exposure on gestational day 7 in mice (equivalent to week 3 in humans) induces phenotypic changes that are recognized as the classic “FAS face,” with a smooth philtrum, narrow vermilion border of the upper lip, and short palpebral fissures (Lipinski et al., 2012; Sulik et al., 1981). Prenatal alcohol exposure during neurulation (gestational day 8.5 in mice and week 4 in humans) induces more subtle defects of the face and brain; however, phenotypic differences were identified in mice regardless of whether exposure occurred on gestational day 7 or 8.5 (Lipinski et al., 2012). Prenatal alcohol exposure in mice on gestational day 8/9 resulted in mild midfacial hypoplasia and shorter palpebral fissures and a preserved philtrum. Brain structural alterations, such as smaller and/or misshapen olfactory bulb, cerebellum and hippocampus and enlargement of the septal region and all cranial ventricles, were consistently seen in early prenatal alcohol exposure animal models (O’Leary-Moore et al., 2010; Parnell et al., 2009, 2013). Moreover, alcohol exposure alone and concurrent exposure to cannabinoids and alcohol during neurulation have been shown to synergistically down-regulate the Sonic Hedgehog pathway, leading to the highest rate of morphological changes, especially in the fetal facial midline and eyes (Fish et al., 2019).
2. Methods
Protocols and consent forms were approved by The University of New Mexico School of Medicine, HRRC, and the University of North Carolina. Active, written consent from parents and/or guardians was required for children to participate in the study, and the maternal interviews required the mother to sign a separate consent.
2.1. Diagnosticians and Diagnostic Criteria
The Revised Institute of Medicine (IOM) Diagnostic Guidelines for FASD (Hoyme et al., 2005) were used to assign diagnoses in the CoFASP initiative, along with defined thresholds and cutoff values that were established by consensus among members of a NIAAA-formed CoFASP advisory group (Hoyme et al., 2016). Physical examinations and dysmorphology assessments were performed by experts in pediatric clinical genetics and dysmorphology. Licensed school psychologists performed all standardized testing of neurobehavioral traits, and teachers and parents completed behavioral checklists. Nurses and social workers administered detailed, face-to-face interviews for assessing maternal risk factors. All research team members assessing physical traits and maternal risks were blinded from prior knowledge of children and mothers. The following domains were assessed in all study participants: (1) growth, (2) dysmorphology, (3) cognitive and behavioral characteristics, and (4) maternal risk factors for the index pregnancy (Figure 1). During the diagnostic process, other recognizable genetic or malformation syndromes were ruled out by the dysmorphologists. The dysmorphologists also assigned the final diagnoses in formal, data-driven case conferences with input from the other examiners who were present (psychologists and maternal risk interviewers), to provide diagnostic input and expert interpretation of the data collected by each.
Figure 1.
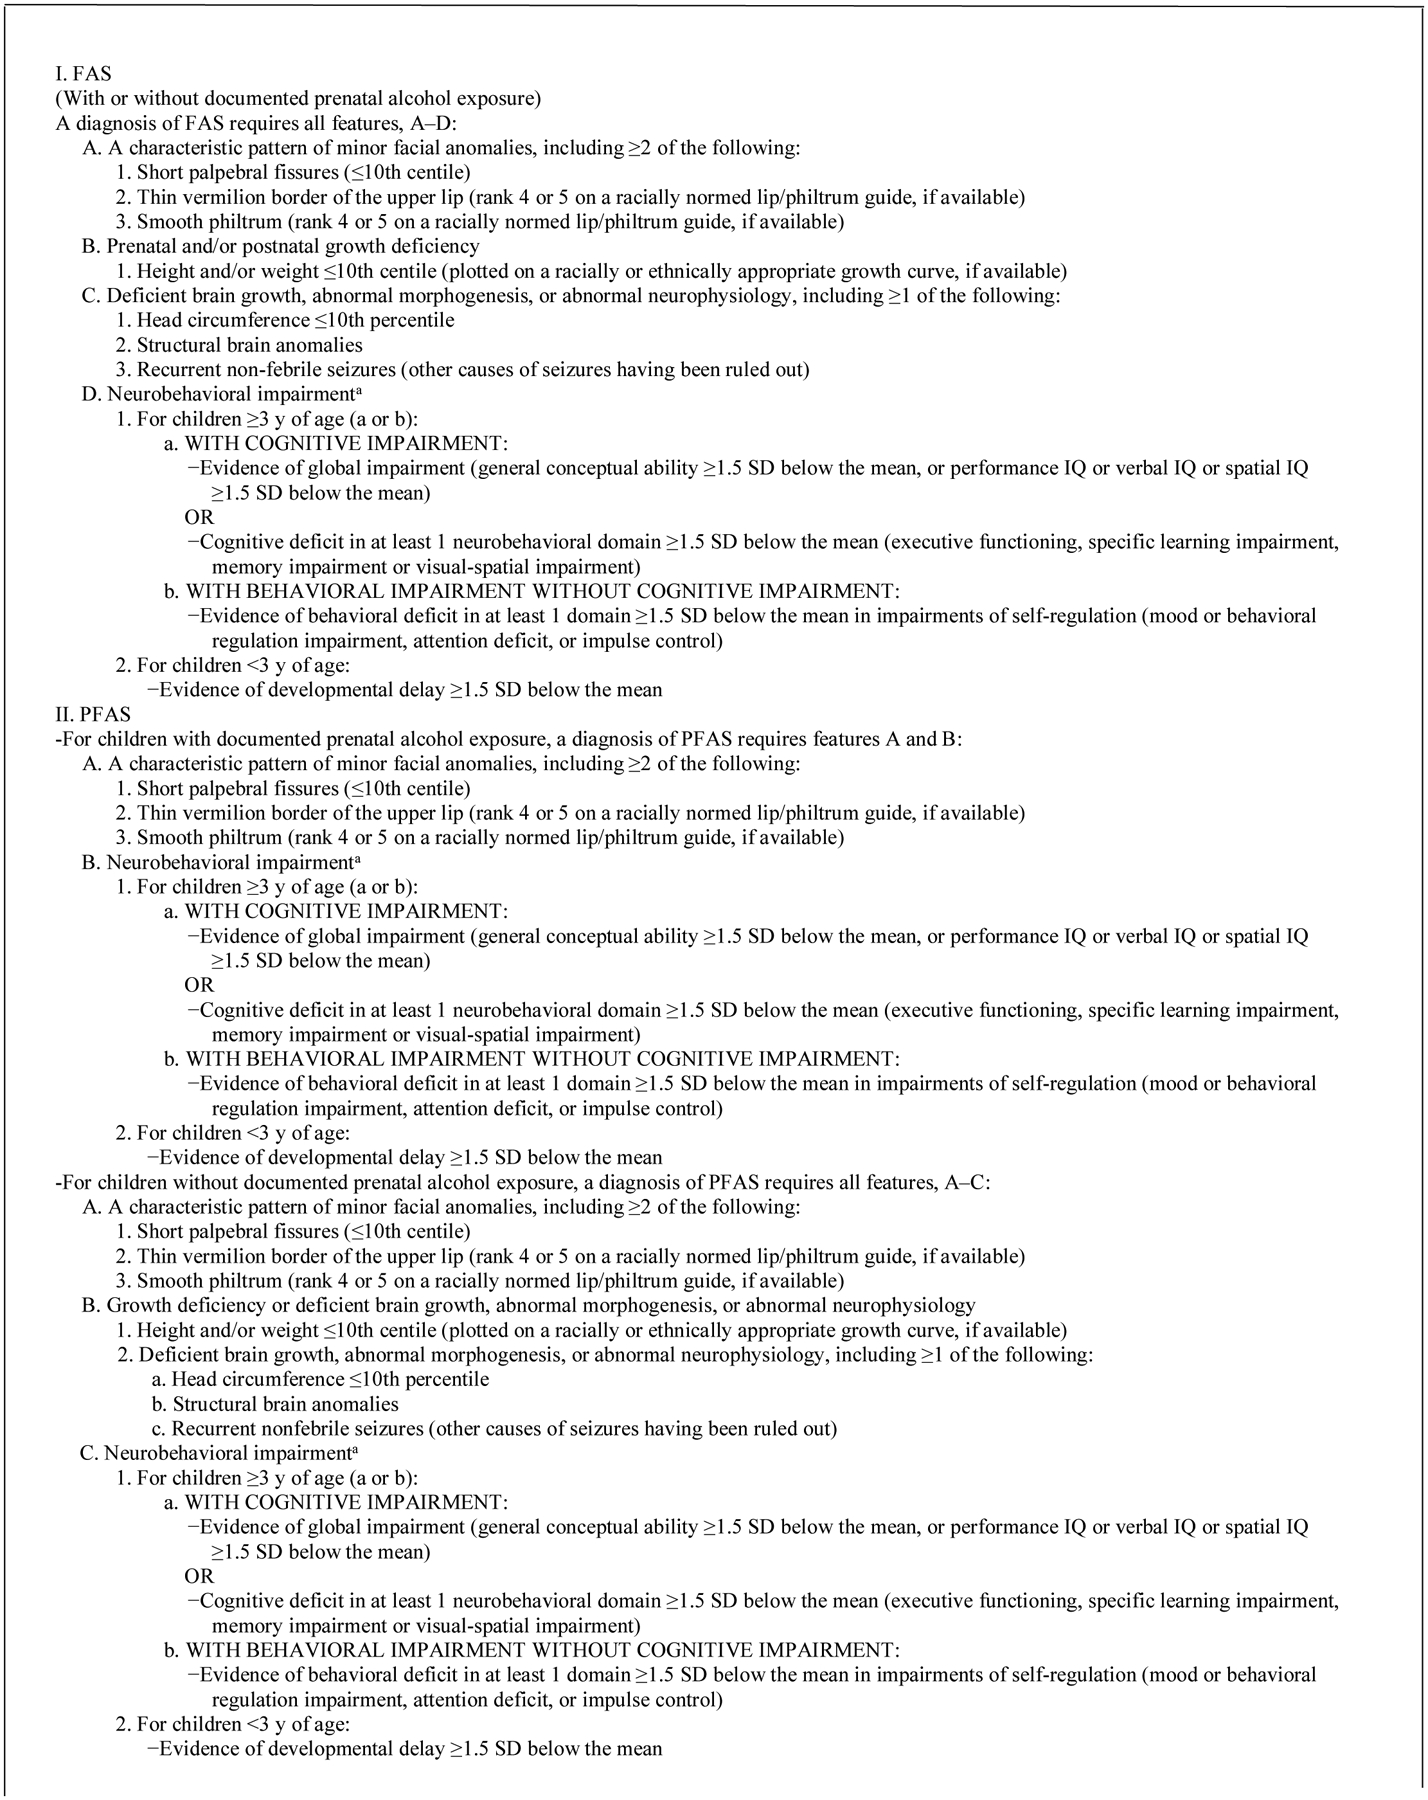
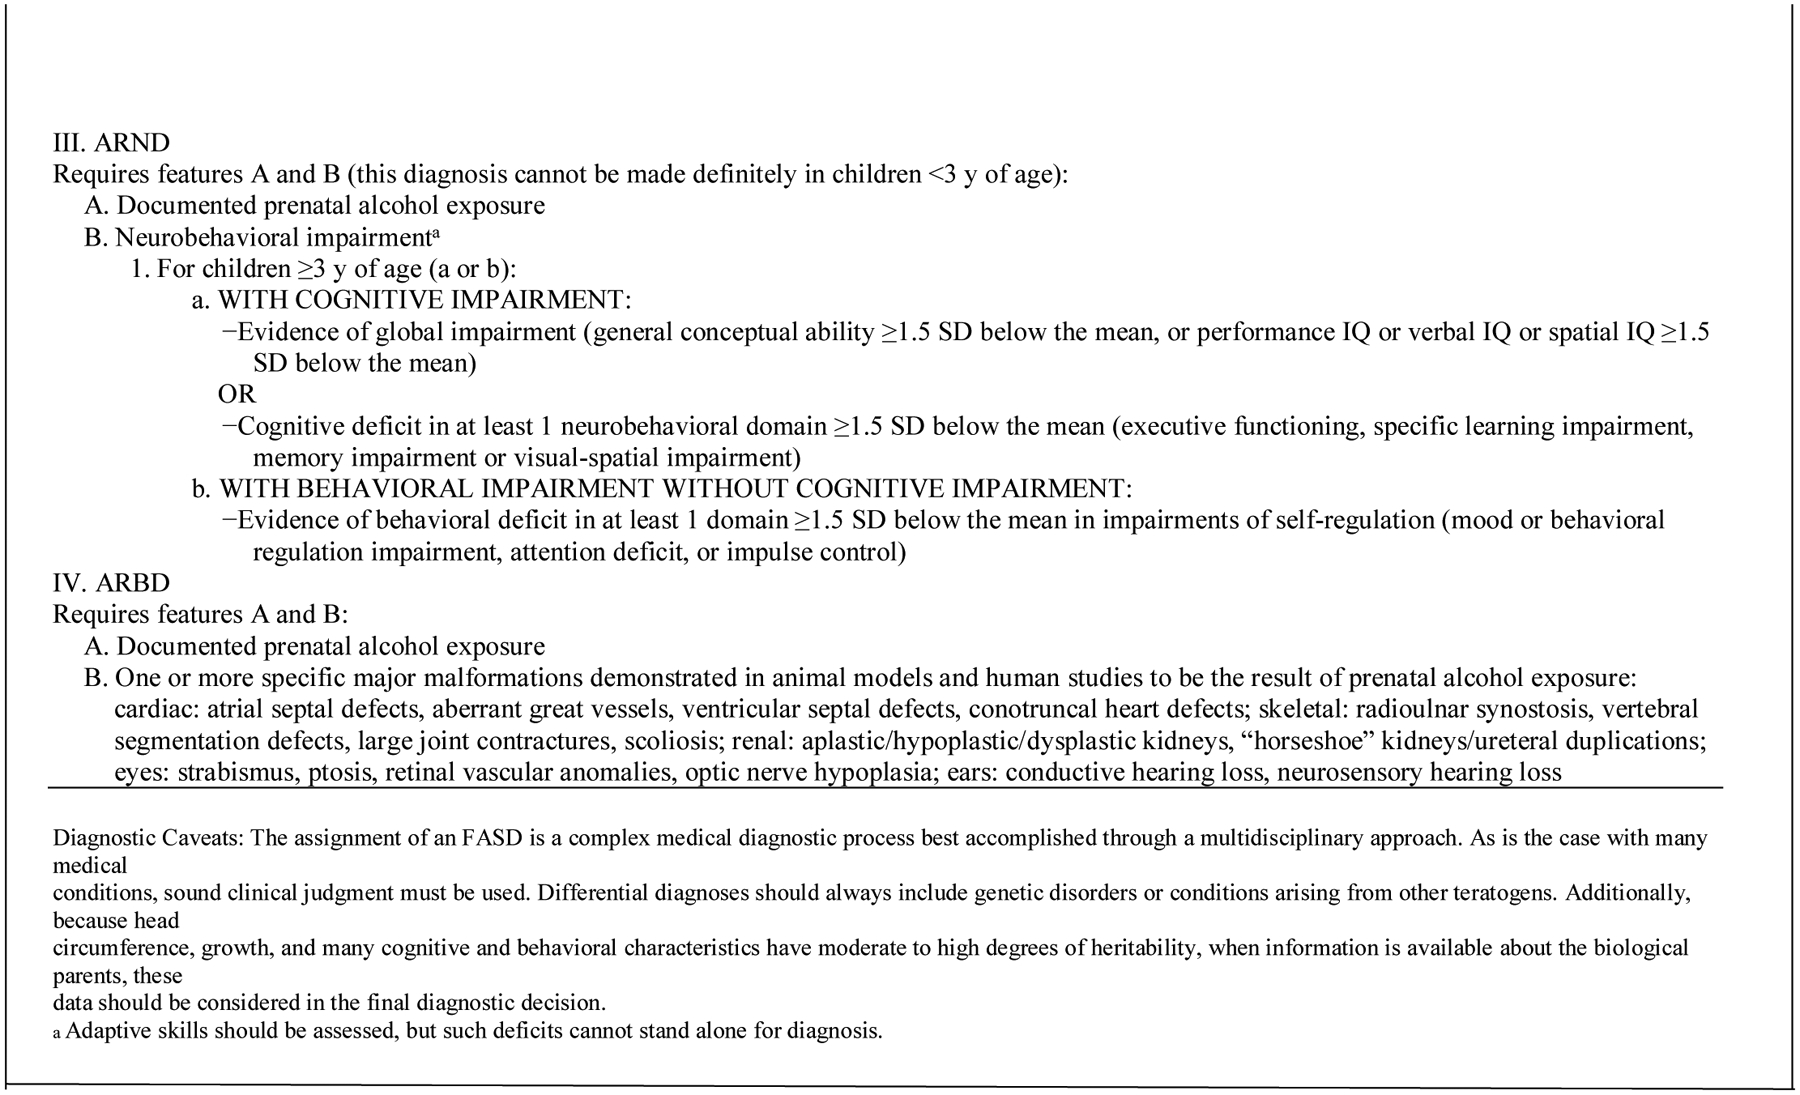
Institute of Medicine Diagnostic Guidelines for Specific Fetal Alcohol Spectrum Disorders (FASD) as clarified by Hoyme et al (2016). Reproduced with permission from Pediatrics, Vol. 138, Pages 3–4, Copyright © 2016 by the AAP
Four specific diagnostic categories comprise FASD; each is highlighted and described in Figure 1: fetal alcohol syndrome (FAS), partial fetal alcohol syndrome (PFAS), alcohol-related neurodevelopmental disorder (ARND), and alcohol-related birth defects (ARBD) (Hoyme et al., 2016). Each diagnostic category was used in this study; yet ARBD has been found to be rare in any population (May et al., 2011, 2014, 2015; May, Marais, et al., 2016). The diagnosis of FAS without a confirmed history of alcohol exposure can be made according to the original IOM criteria (Stratton et al., 1996), and the revised guidelines (Hoyme et al., 2005, 2016). The Revised IOM Diagnostic Guidelines also permit diagnosis of PFAS without directly reported evidence of prenatal drinking; however, the diagnostic criteria are more stringent in these cases (see Figure 1). Some women under-report alcohol use during pregnancy, especially the precise levels and frequencies of consumption (Alvik, Haldorsen, & Lindemann, 2006; Bakhireva et al., 2017; Wurst et al., 2008). Yet in some populations, both alcohol use and levels of drinking are reported quite accurately (Fortin et al., 2017; May, Hasken, et al., 2018). The diagnosis of FASD in epidemiology studies is rarely made without direct maternal reports of alcohol use prior to pregnancy recognition or from collateral reports. An ARND diagnosis always requires direct confirmation of alcohol use in the index pregnancy.
2.2. Sampling in Two Cohorts at Each Site
In all sampling, this was a population-based study which began by sampling all consented children enrolled in first grade in entire school cohorts. There was no pre-screening of maternal history of alcohol exposure. Each consented child was the initial point of contact and each was assessed objectively based on their unique physical and neurobehavioral traits, and their mothers were interviewed about a broad range of proximal and distal maternal risk factors before any diagnosis was assigned in a case conference of the examiners and interviewers using the objective data collected.
Parents and/or guardians were first contacted and provided consent forms through the take-home folder systems used by the schools for routine communications with parents. These communications occurred via each child’s individual classroom backpack. If parents had questions about the study, they could contact school personnel or the research team directly. The overall participation rate in the study was 58.1%.
Two cohorts of 1st grade children attending public elementary schools in each of these three regions of the U.S. were studied, and in two regions private schools were also sampled. Overall, a total of six independent, 1st grade cohorts were studied. See Table A1 in the Appendix. Primarily, entry into the full assessment phases of the study (Tiers II and III) was by random sampling of children from the total enrollment of each school cohort. Additionally, in four of the six samples, all consented children were screened for height, weight, and head circumference. Those screened who were ≤25th centile on any of these measures, and who had not been already picked randomly, were advanced further in the study (to Tier II activities explained below). This census of all consented, small children was to ensure capture of most of the children with FAS and PFAS. The random sample entry was to: 1.) capture a representative proportion of children with ARND, and 2.) to provide a representative comparison (control) sample of typically-developing children (not FASD) of each community population. Additionally, 56 children entered the study because of teacher or parent referrals or because a child picked for the study had a twin who was enrolled in the study. Children who were selected randomly and found not to have a diagnosis within the continuum of FASD constituted the final control group. Children who entered via non-random selection routes and were found not to qualify for a diagnosis within the continuum of FASD, or who demonstrated another known genetic or malformation syndrome, did not default to the control group. All children who participated through all tiers of the study underwent identical exams and testing procedures, unless they moved away from the district, dropped out, or consent was withdrawn at some point during the three tiers of assessment. For some of these children who had incomplete data, enough data had been collected in each domain to make a final diagnosis possible; however, in other cases the data were insufficient to permit assignment of a final diagnosis.
2.3. Diagnostic Process - Three Tiers of Assessment
In four of the six samples, Tier I included prescreening measurement of participants’ height, weight, and OFC; all consented children were measured first by the research team. In these four samples, any consented child ≤ 25th centile on OFC, or height, or weight, a few referred by teachers, and all children selected randomly were included in Tier II physical exams (Figure A1). In two of the six samples, only children who were randomly selected were included in the study, and no Tier 1 assessment of height, weight, and OFC occurred and all children were advanced to Tier II.
In Tier II, research teams recorded final growth measurements of height, weight, and OFC, and the dysmorphologists provided structured dysmorphology examinations assisted by a scribe. Dysmorphology examinations documented: multiple anthropometric facial measurements and minor anomalies of the craniofacies, limbs, skin, hair, and hands. Each child also underwent cardiac auscultation. Using a structured dysmorphology protocol, data were collected on a standardized worksheet, and completed forms for each child were reviewed by each examining dysmorphologist and the exam scribe for accuracy and completeness. Later, on the day of the examination, each dysmorphologist/scribe pair assigned age and sex-specific growth centiles from pediatric growth grids from the Centers for Disease Control and Prevention (CDC) for height, weight, and OFC and from clinical trait distribution for other minor anomalies (Nellhaus, 1968; Rollins et al., 2011; Thomas et al., 1987). After each child’s form was completed for the quantification of growth deficiency and presence of minor anomalies, a standardized dysmorphology score was calculated (see Hoyme et al., 2016). A preliminary diagnosis was assigned: a.) not-FASD, b.) diagnosis deferred – rule out a specific FASD diagnosis or a related disorder (pending the gathering of additional data), or c.) probable FAS or PFAS. Final diagnoses were not assigned until neurobehavioral testing, and maternal risk interview were completed. All randomly-selected children and all children classified in categories b and c advanced to Tier III.
Although the total dysmorphology score is not used directly for assignment of a specific FASD diagnosis, the presence or absence of specific cardinal features of FAS, other minor anomalies, and degrees of growth deficiency provide the physical criteria for final diagnoses (Hoyme et al., 2016). The dysmorphology score correlates well with the extent of maternal drinking and the neurobehavioral difficulties in affected children (Ervalahti et al., 2007). Inter-rater reliability using the Revised IOM Diagnostic Guidelines was assessed in previous studies. The following Cronbach’s alpha coefficients were produced: 0.993 for OFC, 0.957 for inner canthal distance (ICD), 0.951 for palpebral fissure length (PFL), and 0.928 for philtrum length (May, Blankenship, Marais, Gossage, Kalberg, Barnard, et al., 2013). Other association measures of reliability also produced coefficients exceeding 0.80 on most exam variables (May et al., 2000; Viljoen et al., 2005). Exam techniques balance sensitivity and specificity for capturing the complete range of FASD (Hoyme et al., 2016).
2.4. Tier III - Child Testing
Child cognition and behavior were assessed in Tier III with the CoFASP consensus battery (May, Chambers et al., 2018a). Cognition, academic readiness skills, behavior and adaptive skills were assessed with the specific measures and CoFASP consensus cut off points. Each child was tested by school psychologists with: the Differential Abilities Scale (DAS II) (Elliott, 2007) to assess general intelligence; the NEPSY-II (Korkman et al., 2007) to assess executive functioning, memory, and visual-spatial integration; the Developmental Test of Visual-Motor Integration (VMI) (Beery & Beery, 2004) for eye-hand coordination; the Bracken Basic Concepts Scale (Bracken, 1998) for basic concept development in math, reading, and spelling; the Achenbach behavioral assessments (Achenbach & Rescorla, 2001); Child Behavior Checklist (CBCL) completed by the parent and Teacher Report Form (TRF) completed by the teacher; and the Vineland Adaptive Behavior Scales (Sparrow et al., 2005). Combined site neurobehavior results are not presented in this report, but can be accessed in other publications (Coles et al., 2020; May et al., 2020a, 2020b, 2020c; May, Chambers et al., 2018).
2.5. Maternal Health Status and Alcohol and Drug Use Measured
Also in Tier III, consenting mothers of the children advanced to Tier III were contacted for in-person interviews. The sequenced questions were intended to maximize the accurate reporting of: health status, reproduction history, nutrition, alcohol use, socioeconomic status (SES), and the mother’s height, weight, and OFC. Drinking questions used a timeline, followback sequence, (Sobell et al., 2001; Sobell & Sobell, 1992) and Vessels alcohol product methodology for accurate calibration of standard alcohol units (Kaskutas & Graves, 2000; Kaskutas & Kerr, 2008). Current alcohol consumption for the week preceding the interview was embedded into dietary intake questions (King, 1994) to aid accurate reporting and calibration of quantity, frequency, and timing of alcohol use before, during, and after the index pregnancies (May et al., 2005, 2008; May, Blankenship, Marais, Gossage, Kalberg, Joubert, et al., 2013). Retrospective reports of alcohol use have been found to be accurate in a number of populations when designed and administered properly (Czarnecki et al., 1990; Fortin et al., 2017; Hannigan et al., 2010). The accuracy of self-reported data produced by this approach has been confirmed further by two alcohol use biomarkers in a population from several communities in South Africa (May, Hasken, et al., 2018).
Maternal risk data were gathered for 1,026 of the children’s mothers in the three sites. The American definition of a standard drink was used. One standard drink equals 14 grams of absolute alcohol: 12 oz. (350 mL of beer at 5% alcohol by volume); 5 oz. (150 mL) of wine (12% by volume); and 1.5 oz. (44 mL) of liquor (40% by volume) (NIAAA, n.d.). Drinking during pregnancy was confirmed if at least one of the following criteria was met during the index pregnancy: a) six or more standard drinks per week for two or more weeks; b) a binge of 3 or more drinks per occasion on two or more occasions; or c) documentation of social or legal problems in proximity to the index pregnancy (e.g., treatment for alcohol abuse or driving under the influence infractions). These criteria were not intended to reflect a threshold of damage associated with FASD. Rather, these cut-off levels were believed to provide sufficient empirical proof of exposure, were based on previous experience with epidemiologic studies, and were mutually agreed-upon measures by the CoFASP Advisory Committee.
2.6. Multidisciplinary Case Conferences for Final Diagnoses and Assuring Accuracy
Following completion of all data collection and compilation, final diagnoses were assigned in a confidential, structured, multidisciplinary case conference. Findings for each child were discussed after summary results from the three independently-collected domains were presented by research team members who participated in exams, testing or interviews for the particular child and mother. During the presentations, two-dimensional digital photographic images of the child’s face (frontal and profile views) were projected on a screen to contextualize the data. Whether the findings for each child met criteria for a FASD diagnosis (or another condition) was discussed. Final diagnoses were made by consensus, but in the rare cases of disagreement, the final diagnosis was assigned by the examining dysmorphologist.
In the diagnostic process, consistency and quality assurance for the data set were first enhanced by strict initial application of CoFASP criteria when preparing for case conferences. Second, all final diagnoses were double-checked later for consistency and accuracy by the CoFASP data management teams of the CoFASP participating institutions. Third, classifications were checked again by the CoFASP investigative teams via reciprocal exchange of all diagnostic data for all cases and a sample of non-cases. Each team was blinded to the other team’s classifications and was asked to determine whether the criteria had been applied consistently and accurately.
2.7. Statistical Analysis
Data organization and analyses were performed with SPSS version 26 (IBM, 2020). All child and maternal data were compared across diagnostic groups using chi square and one-way analysis of variance (ANOVA) (Tabachnick & Fidell, 2019). Bonferroni adjustments of alpha values were used with the child variables. The alpha level for maternal risk comparisons was fixed at 0.05 due to the more exploratory status of specific risk traits for the US population. With statistically significant ANOVAs, post-hoc analyses were performed using Dunnett’s correction (C) pairwise comparisons (α= .05).
Logistic regression was used to detect associations of child traits with alcohol use measures. Although highly unbalanced, transformations could not be applied to “yes/no” items, maternal reports of drinking during trimesters, and the covariate, “whether mother had used tobacco or illicit drugs during the index pregnancy.” Use of pairwise deletion ensured that all available data were included.
3. Results
Table A1, found in the Appendix, presents the summary demographic indicators for the three regional U.S. research sites studied to determine the characteristic physical traits of children with FASD. These sites, two cities/municipalities and one county with several cities and towns, have populations totaling 437,574 residents of all ages, representing 0.136% of the national population and, on average, they were growing at an average of 7.2% during the study, a rate higher than the average U.S. growth of 4.2%. The racial and Hispanic ethnicity composition of the research sites was somewhat more white-non Hispanic, less Black-non Hispanic, more American Indian, less Asian, and less Hispanic than the general population. The median age was comparable to the U.S. average (36.6 years vs. 37.2) with education also similar (a higher percentage of high school graduates, 88.8% vs. 86.3%) and slightly lower achievement in college graduation (26.7 % vs. 29.3%). Economically, the study communities were not as well off as the U.S. average with a per capita median income of $26,132 vs. that of $28,555 nationally, and a median household income of $47,892 vs. $53,482 for the nation, and 13.4% of persons in poverty vs. 14.8%. The mean health behavior rank of the sample communities was 24th of 50 states, placing the sample right at the median rank (25) for the nation. Finally, alcohol use in these communities was comparable to national averages with 16.6% reporting binge drinking (ranking 28th), and excessive drinking in these states ranked 27th (18.1% vs. 17.4%), each of which was slightly above the U.S. median rank of 25. Somewhat more alcohol was consumed annually at these sites (2.54 gallons/9.63 liters vs. 2.3 gallons/8.1 liters) than the U.S. average. In summary of the demographic data, the research communities were substantially representative of the general U.S. population.
3.1. Demographic Traits, Growth, and Cardinal FAS Features among Children with FASD and Controls
In Table 1, key demographic, growth, cardinal FAS/FASD traits, and other minor anomalies commonly manifested in children with FASD are aggregated by specific FASD diagnosis, and compared to the randomly-selected children who were evaluated and found to be “not-FASD.” The control group are those that were randomly-selected, evaluated fully in all domains, and found to be developing within the typical range in these study communities. None of the control children were deemed to have another, major, recognizable genetic or malformation syndrome. Regarding sex, there was no statistically significant difference across the three FASD groups and the controls. Notable, however, was a deficit of males in the most severely affected (FAS) group. The groups were not statistically different from one another at the Bonferroni-adjusted level (p=0.0036), but were significant different at the less stringent level of p≤.05. Children with FASD were slightly older than the typically-developing controls (83.1 vs. 82.0, p=.010). Height, weight, and body mass index (BMI) were all significantly different among the four groups, with height and weight significantly different in all bivariate comparisons among groups except ARND vs. controls. Bivariate comparisons of BMI were only significant between the children with FAS and the control group. Head circumference (OFC) was, by definition, most suppressed in the children with FAS, and in this study was found to be significantly different in bivariate comparisons among all groups except children with PFAS vs. ARND. While 56.5% of children with FAS had a head circumference of ≤3rd centile, and 100% were ≤10th centile, 9.8% and 17.0% of the children with PFAS and ARND were ≤3rd centile, and 26.2% and 27.7% respectively were ≤10th centile. Six percent of the controls were ≤10th centile on OFC.
Table 1.
Demographic, Growth, Cardinal FAS Features, Other Minor Anomalies and Total Dysmorphology Scores
| All Children1 (n=5073) | Children with FAS (n=23) | Children with PFAS (n=61) | Children with ARND (n=47) | Randomly-Selected Control Children (n=1212) | Test-score | p-value2 | ||||||
|---|---|---|---|---|---|---|---|---|---|---|---|---|
| Growth and Cardinal Features | ||||||||||||
| Sex (% Male) | 50.9 | 30.4 | 54.1 | 59.6 | 52.1 | χ2=5.474 | .140 | |||||
| Current Age (months) - Mean (SD) | (5.6) | (5.6) | (4.9) | F=3.143 | .024 | |||||||
| Height Centile – Mean (SD) | (29.8) | (7.9) | (25.4) | (30.9) | (27.9) | F=35.485 | <.001A,B,C,D,E | |||||
| Weight Percentile – Mean (SD) | (28.9) | (14.0) | (26.7) | (34.2) | (27.5) | F=31.579 | <.001A,B,C,D,E | |||||
| Child's BMI Percentage – Mean (SD) | -- | (30.6) | (30.6) | (33.5) | (27.6) | F=8.005 | <.001C | |||||
| Occipitofrontal Circumference (OFC) Centile – Mean (SD) | (30.6) | (3.5) | (23.9) | (34.8) | (28.5) | F=49.834 | <.001A,B,C,E,F | |||||
| OFC ≤3rd centile | -- | 56.5 | 9.8 | 17.0 | 2.1 | χ2=209.617 | <.001 | |||||
| OFC ≤10th centile | -- | 100.0 | 26.2 | 27.7 | 6.3 | χ2=270.902 | <.001 | |||||
| Palpebral Fissure Length (PFL) Percentile – Mean (SD) | -- | (12.3) | (15.6) | (14.1) | (15.7) | F=32.622 | <.001B,C,D,E | |||||
| PFL ≤3rd centile | -- | 30.4 | 32.8 | 2.1 | 4.2 | χ2=112.024 | <.001 | |||||
| PFL ≤10th centile | -- | 73.9 | 54.1 | 2.1 | 9.1 | χ2=200.000 | <.001 | |||||
| Smooth Philtrum (% Yes) | -- | 82.6 | 78.7 | 17.0 | 14.6 | χ2=218.844 | <.001 | |||||
| Narrow Vermilion (% Yes) | -- | 82.6 | 85.2 | 12.8 | 17.2 | χ2=215.373 | <.001 | |||||
| Total Dysmorphology Score – Mean (SD) | -- | (3.3) | (3.3) | (3.8) | (3.0) | F=196.435 | <.001A,B,C,D,E | |||||
Post-hoc significant difference between:
FAS & PFAS;
FAS & ARND;
FAS & Controls;
PFAS & ARND;
PFAS & Controls;
ARND & Controls
All children consented to initial screening; tests of significance compared only the children with FASD vs. controls.
Bonferroni adjusted significance level for Growth and Cardinal Features = 0.0036
The three cardinal features of FAS are: short palpebral fissure length (PFL), smooth philtrum and narrow vermilion border of the upper lip. In this study, 9 (of 23) or 39% the children with FAS had all 3 facial features. By definition, and among the diagnostic groups in this study, the PFL forms a continuum, with children with FAS having the shortest mean centile: FAS (9.9), PFAS (14.6), and ARND (31.1), vs. controls at 30.6. Bivariate significance on the post-hoc measures was significantly different among all groups except FAS vs. PFAS and ARND vs. controls. Using the North American (white) lip/philtrum guide developed for, and adopted by the CoFASP initiative, a continuum again emerges in the aggregate findings where 82.6% of children with FAS, 78.7% with PFAS, 17.0% with ARND, and 14.6% of controls were rated with a smooth philtrum (rating 4 or 5 on the lip/philtrum guide (Hoyme et al., 2016)). Narrow vermilion on the lip/philtrum guide was recorded for 82.6%, 85.2%, and 12.8% of children with FAS, PFAS, and ARND, respectively vs. 17.2% of normal controls. There was a significant correlation between philtrum ranking and vermilion border ranking among all case and control children in the study (Pearson correlation (r) = .471, p<.001) and a similar correlation among the children with FASD (r = .525, p<.001) among children with FASD.
The distribution of the total dysmorphology scores (Hoyme et al., 2016) of the four diagnostic groups formed a continuum. Children with FAS had the highest scores (15.9, SD=3.3), followed by those diagnosed with PFAS (10.9, SD=3.3), ARND (4.9, SD=3.8), and controls (4.1, SD=3.0). The average total dysmorphology scores significantly differentiated all groups from one another in the bivariate comparisons except for ARND vs. controls.
3.2. Other Minor Anomalies among Children with FASD and Controls
In Table 2, data on other minor anomalies that frequently occur in association with prenatal alcohol exposure are presented. With the exception of the maxillary and mandibular arcs, each of these features is commonly assessed by clinical geneticists as part of a dysmorphology examination. The facial arcs allow for objective assessment of maxillary development in comparison to mandibular development. Using a flexible tape measure ruled in millimeters, the maxillary arc is measured from the anterior notch of one tragus under the nasal septum to the anterior notch of the tragus of the contralateral ear. The mandibular arc is measured similarly; however, the tape measure is passed under the tip of the chin (mental protuberance) (Abell et al., 2016).
Table 2.
Other Minor Anomalies of Children with FASD and Randomly-Selected Control Children
| Children with FAS (n=23) | Children with PFAS (n=61) | Children with ARND (n=47) | Randomly-Selected Control Children (n=1212) | Test-score | p-value1 | |||||
|---|---|---|---|---|---|---|---|---|---|---|
| Inner Canthal Distance (ICD) Centile - Mean (SD) | (21.2) | (22.7) | (24.6) | (22.9) | F=4.134 | <.001B,C | ||||
| Interpupillary Distance (IPD) Centile - Mean (SD) | (21.7) | (23.7) | (24.0) | (26.1) | F=7.145 | <.001B,C | ||||
| Outer Canthal Distance (OCD) Centile - Mean (SD) | (13.3) | (15.5) | (17.7) | (20.3) | F=8.462 | <.001B,C,E | ||||
| Maxillary Arc (in cm) – Mean (SD) | (.9) | (.9) | (1.4) | (1.1) | F=18.133 | <.001A,B,C,E | ||||
| Mandibular Arc (in cm) – Mean (SD) | (1.1) | (1.0) | (1.6) | (1.3) | F=19.045 | <.001A,B,C,E | ||||
| Hypoplastic Midface (% Yes) | 43.5 | 41.0 | 34.0 | 28.5 | χ2=7.089 | .069 | ||||
| “Railroad Track” Ears (% Yes) | 13.0 | 14.8 | 6.4 | 11.7 | χ2=1.879 | .598 | ||||
| Strabismus (% Yes) | 8.7 | 3.3 | 2.1 | 1.8 | χ2=5.954 | .114 | ||||
| Ptosis (% Yes) | 21.7 | 11.5 | 8.5 | 5.9 | χ2=12.446 | .006 | ||||
| Epicanthal Folds (% Yes) | 30.4 | 21.3 | 17.0 | 19.5 | χ2=2.030 | .566 | ||||
| Flat Nasal Bridge (% Yes) | 13.0 | 13.1 | 17.0 | 13.0 | χ2=.629 | .890 | ||||
| Anteverted Nares (% Yes) | 26.1 | 24.6 | 17.0 | 19.2 | χ2=1.884 | .597 | ||||
| Prognathism (% Yes) | 8.7 | 6.6 | 12.8 | 5.8 | χ2=4.148 | .246 | ||||
| Hypoplastic Nails (% Yes) | 8.7 | 6.6 | 2.1 | 1.8 | χ2=10.916 | .012 | ||||
| 5th finger clinodactyly (% Yes) | 56.5 | 39.3 | 31.9 | 27.6 | χ2=13.075 | .004 | ||||
| Camptodactyly (% Yes) | 8.7 | 0.0 | 2.1 | 2.1 | χ2=5.999 | .112 | ||||
| Altered palmar creases (% Yes) | 30.4 | 36.1 | 21.3 | 22.1 | χ2=7.232 | .065 | ||||
| Heart Murmur (% Yes) | 4.3 | 1.6 | 4.3 | 2.1 | χ2=1.630 | .653 | ||||
| Heart Malformation (% Yes) | 0.0 | 1.6 | 0.0 | 0.2 | χ2=4.005 | .261 | ||||
Post-hoc significant difference between:
FAS & PFAS;
FAS & ARND;
FAS & Controls;
PFAS & ARND;
PFAS & Controls;
ARND & Controls
Bonferroni adjusted significance level = .0026
Each of the significant variable averages by diagnostic group at the Bonferroni-adjusted level (p=0.0026) were: inner canthal distance (ICD) centile, interpupillary distance (IPD) centile, outer canthal distance (OCD) centile, and maxillary and mandibular arcs in centimeters. The values of all but one of these variables (ICD) formed a continuum across the study diagnostic groups. The mean ICD centile was largest for the ARND group. Furthermore, the minor anomalies that achieved statistical significance in bivariate comparisons at alpha=.05 were: ptosis, hypoplastic nails, and 5th finger clinodactyly. These assessed features also formed a continuum among all diagnostic groups. Finally, observations of hypoplastic midface and altered palmar creases approached significance, for children with FASD expressed more of each anomaly in a continuous pattern.
3.3. Comparison of the Physical Traits of Children with Alcohol-Related Neurodevelopmental Disorder (ARND) and Controls
Tables 3 and 4 represent bivariate comparisons of the physical growth, cardinal FAS features, and the other minor anomalies found in children diagnosed with ARND and the controls. This comparison was prepared because the diagnostic criteria for ARND are not dependent on overall growth restriction and dysmorphology traits, as are the diagnoses of FAS and PFAS. In fact, some professionals have characterized children with ARND as “without” growth restriction and without identifiable dysmorphology.
Table 3.
Growth, Cardinal FAS Features and Total Dysmorphology Scores for Children with ARND and Controls
| Children with ARND (n=47) | Randomly-Selected Control Children (n=1212) | Test-score | p-value | |||
|---|---|---|---|---|---|---|
| Growth and Cardinal Features | ||||||
| Sex (% Male) | 59.6 | 52.1 | χ2=1.023 | .312 | ||
| Current Age (months) - Mean (SD) | (4.9) | t=.739 | .460 | |||
| Height Centile – Mean (SD) | (30.9) | (27.9) | t=−1.346 | .179 | ||
| Height ≤3rd centile | 10.6 | 1.7 | 17.723 | <.001 | ||
| Height ≤10th centile | 17.0 | 6.2 | χ2=8.623 | .003 | ||
| Weight Percentile – Mean (SD) | (34.2) | (27.5) | t=-1.431 | .159 | ||
| Weight ≤3rd centile | 11.1 | 1.2 | χ2=27.527 | <.001 | ||
| Weight ≤10th centile | 22.2 | 4.1 | χ2=31.110 | <.001 | ||
| Child's BMI Percentage – Mean (SD) | (33.5) | (27.6) | t=−1.418 | .163 | ||
| Occipitofrontal Circumference (OFC) Centile – Mean (SD) | (34.8) | (28.5) | t=3.357 | .002 | ||
| OFC ≤3rd centile | 17.0 | 2.1 | χ2=39.664 | <.001 | ||
| OFC ≤10th centile | 27.7 | 6.3 | χ2=31.509 | <.001 | ||
| Palpebral Fissure Length (PFL) Percentile – Mean (SD) | (14.1) | (15.7) | t=.202 | .840 | ||
| PFL ≤3rd centile | 2.1 | 4.2 | χ2=.496 | .481 | ||
| PFL ≤10th centile | 2.1 | 9.1 | χ2=2.721 | .099 | ||
| Smooth Philtrum (% Yes) | 17.0 | 14.6 | χ2=.209 | .648 | ||
| Narrow Vermilion (% Yes) | 12.8 | 17.2 | χ2=.620 | .431 | ||
| Total Dysmorphology Score – Mean (SD) | (3.8) | (3.0) | t=1.380 | .174 | ||
Bonferroni adjusted significance level = .0028
Table 4.
Other Minor Anomalies of Children with ARND and Randomly-Selected Control Children
| Children with ARND (n=47) | Randomly-Selected Control Children (n=1212) | Test-score | p-value1 | |||
|---|---|---|---|---|---|---|
| Inner Canthal Distance (ICD) Centile - Mean (SD) | (24.6) | (22.9) | t=.483 | .629 | ||
| Interpupillary Distance (IPD) Centile - Mean (SD) | (24.0) | (26.1) | t=−1.034 | .301 | ||
| Outer Canthal Distance (OCD) Centile - Mean (SD) | (17.7) | (20.3) | t=−.328 | .743 | ||
| Maxillary Arc (in cm) – Mean (SD) | (1.4) | (1.1) | t=−1.196 | .238 | ||
| Mandibular Arc (in cm) – Mean (SD) | (1.6) | (1.3) | t=−1.397 | .163 | ||
| Hypoplastic Midface (% Yes) | 34.0 | 28.5 | χ2=.682 | .409 | ||
| “Railroad Track” Ears (% Yes) | 6.4 | 11.7 | χ2=1.263 | .261 | ||
| Strabismus (% Yes) | 2.1 | 1.8 | χ2=.025 | .875 | ||
| Ptosis (% Yes) | 8.5 | 5.9 | χ2=.568 | .451 | ||
| Epicanthal Folds (% Yes) | 17.0 | 19.5 | χ2=.174 | .677 | ||
| Flat Nasal Bridge (% Yes) | 17.0 | 13.0 | χ2=.628 | .428 | ||
| Anteverted Nares (% Yes) | 17.0 | 19.2 | χ2=.142 | .706 | ||
| Prognathism (% Yes) | 12.8 | 5.8 | χ2=3.890 | .049 | ||
| Hypoplastic Nails (% Yes) | 2.1 | 1.8 | χ2=.025 | .875 | ||
| 5th finger clinodactyly (% Yes) | 31.9 | 27.6 | χ2=.429 | .513 | ||
| Camptodactyly (% Yes) | 2.1 | 2.1 | χ2=.00001 | .993 | ||
| Altered palmar creases (% Yes) | 21.3 | 22.1 | χ2=.018 | .892 | ||
| Heart Murmur (% Yes) | 4.3 | 2.1 | χ2=1.037 | .309 | ||
| Heart Malformation (% Yes) | 0.0 | 0.2 | χ2=.117 | .733 | ||
Bonferroni adjusted significance level = .0026
As set forth in Table 3, significantly more children with ARND than controls exhibited height and weight restriction at ≤3rd and ≤10th centile. Comparison of height and weight by average (mean) percentile was not significant. For head circumference (OFC), the mean circumference was significantly depressed in the children with ARND, and there was a significantly higher percentage of children with ARND with OFC ≤3rd and ≤10th centiles. No other features in Table 3 differed significantly between children with ARND and controls including the total dysmorphology score (4.9 (SD=3.8) vs. 4.1 (SD=3.0)).
Table 4 demonstrates that only one of the minor anomalies differs (p≤.05) among children with ARND and controls. Prognathism was more common in children with ARND (12.8% vs. 5.8%). An explanation for the observed increased prevalence of prognathism in children with ARND vs. controls is unclear. However, prognathism is a subjective assessment, defined as anterior protrusion of the mandibular alveolar ridge beyond the plane of the maxillary alveolar ridge. It can be difficult to distinguish a protruding mandible from a retruded midface (Allanson et al., 2009). Animal and human studies have demonstrated midface hypoplasia in alcohol exposed offspring across diagnostic categories (Lipinski et al., 2012; Jacobson et al., 2021; May et al., 2021; Suttie et al., 2018). Therefore, the observed prognathism in children with ARND in the present study may reflect midfacial underdevelopment rather than true prognathism. Measurements of maxillary and mandibular arcs are the closest of any other traits to approaching significance. The arcs were somewhat shorter in children with ARND, likely reflecting the general facial underdevelopment observed in all categories of FASD (Abell K et al., 2016).
3.4. Maternal Risk Factors
In Table 5, the statistically significant, proximal maternal risk factors associated with negative outcomes in FASD are presented. The alcohol use data reported by mothers of the children before pregnancy appear to provide the most useful description of usual drinking practices of most of the women. Nevertheless, all the data presented in this table are statistically significant at the Bonferroni-adjusted level (alpha=0.006).
Table 5.
Proximal Maternal Risk Factors for FASD: Alcohol and Drug Use
| Test score | p-value | |||||
|---|---|---|---|---|---|---|
| (SD) | (SD) | |||||
| Alcohol Use – Before and During Pregnancy | ||||||
| Drank before pregnancy (% Yes) | 84.9 | 56.6 | χ2=30.905 | <.001 | ||
| # of drinks consumed on usual drinking day before pregnancy1 | (2.7) | (2.6) | t=5.857 | <.001 | ||
| Mdn = 4.0 | Mdn = 2.0 | –– | -- | |||
| 1 time per month or less | 14.8 | 43.3 | χ2=34.886 | <.001 | ||
| Days drank more than usual – before pregnancy1 (% Yes) | 33.3 | 17.0 | χ2=15.484 | <.001 | ||
| Drank in 1st trimester (% Yes) | 27.5 | 5.2 | χ2=63.363 | <.001 | ||
| Drank in 2nd trimester (% Yes) | 17.6 | 2.8 | χ2=45.816 | <.001 | ||
| Drank in 3rd trimester (% Yes) | 14.5 | 3.0 | χ2=30.090 | <.001 | ||
| Currently have a drinking problem (% Yes) | 7.3 | 1.7 | χ2=12.892 | <.001 | ||
| Other Drug Use | ||||||
| Used tobacco – during pregnancy (% Yes) | 28.3 | 13.3 | χ2=17.133 | <.001 | ||
| Used cannabis – during pregnancy (% Yes) | 10.6 | 3.9 | χ2=9.647 | .002 | ||
| Used any drugs in pregnancy (% Yes) | 14.2 | 4.7 | χ2=15.588 | <.001 | ||
| Never | 26.5 | 44.9 | χ2=14.816 | .001 | ||
Among women who drank prior to pregnancy.
Bonferroni-adjusted significant levels: alcohol use -before and during pregnancy = 0.006; other drug use = 0.0125.
The mothers of children with FASD reported a higher level of alcohol use than mothers of normal controls prior to pregnancy by prevalence (84.9% vs 56.6%), drinks consumed on a normal drinking day (mean=4.6 vs. 2.7, median 4.0 vs. 2.0), frequency of drinking (1–2 times per week or more: 69.3% vs. 36.6%), and days that they drank more than their usual amount (33.3% vs. 17.0%). Mothers of children with FASD reported more drinking than mothers of controls in each trimester, more of them had a current drinking problem at interview (7.3% vs 1.7%), more of them smoked tobacco (28.3% vs. 13.3%), more of them smoked cannabis (10.6% vs. 3.9%), and more used other drugs (14.2% vs. 4.7%) during the index pregnancy.
3.5. Racial and Ethnic Composition
Table A2 (in the Appendix) presents three different comparisons of the racial and Hispanic ethnicity of the children with that of all children enrolled in the study. In comparison “a”, the racial and ethnic distribution of three specific FASD diagnoses and controls was examined by chi-square, and the results indicated that there was a significant difference (p=0.031) by race/Hispanic ethnicity which primarily reflected an excess of PFAS cases among white-non-Hispanics and fewer cases of any FASD diagnoses among Hispanics. In comparison “b” of total FASD cases to controls, there was no overall significant difference in the distribution of the cases and controls, indicating equal distribution of children with FASD across the racial/ethnic groups. The third set of comparisons were made via z-tests of proportions for each racial/ethnic group between cases and other students enrolled in the study. These indicate that Hispanic children were significantly under-represented among FASD cases overall (p=0.006). Also, these comparisons indicate that there were otherwise no significant differences between the proportion of children in the study and the proportion of FASD cases detected/diagnosed in the other three groups.
3.6. Association Analysis
Results from adjusted binary logistic regression analyses are presented in Table 6 to measure any associations between a diagnosis of an FASD in a child and the usual quantity of alcohol consumed prior to pregnancy by mothers of children with FASD and by mothers of controls on days when they consumed alcohol. Controlling for two confounders, tobacco use and illicit drug use during pregnancy, there was a significant association between drinking 3, 4, or 5 or more drinks per drinking day (DDD) prior to pregnancy and the birth of a child with FASD. The practice of drinking 3 DDD was associated with an approximately 10 times greater odds of a child born with a diagnosable FASD (p<.001, OR=9.915, 95% CI: 4.6–21.5). Usual drinking of 5 or more DDD was associated with an 11 times greater likelihood of the birth of a child with a diagnosis on the continuum of FASD.
Table 6.
Adjusted Binary Logistic Regression Analysis of FASD Diagnosis as a Function of Usual Number of Drinks per Drinking Day 3 Months Prior to Pregnancy
| S.E. | Sig. | Odds Ratio | |||
|---|---|---|---|---|---|
| Lower | Upper | ||||
| .154 | .466 | .742 | 1.166 | .468 | 2.907 |
| .269 | .404 | .505 | 1.309 | .593 | 2.888 |
| 2.294 | .395 | <.001 | 9.915 | 4.574 | 21.494 |
| 2.309 | .396 | <.001 | 10.066 | 4.629 | 21.886 |
| 2.396 | .353 | <.001 | 10.981 | 5.494 | 21.950 |
| .385 | .303 | .204 | 1.469 | .811 | 2.661 |
| −.164 | .491 | .738 | .848 | .324 | 2.220 |
| −3.020 | .259 | <.001 | .049 | -- | -- |
Reference group: non-drinkers
Other regression analysis was performed for this manuscript. When a similar logistic regression was performed controlling only for maternal education, an important socioeconomic (SES) variable, the odds ratios were also equally significant in demonstrating that 3 DDD on usual drinking days was the lowest significant threshold (p<.001, OR=11.5, 95% CI: 4.9–27.1). Maternal education was implicated as a protective factor, for the greater the formal maternal education, the less the risk of an FASD diagnosis (B=−.098, p=.034, OR=.907, 95%CI=.828–.993). Household income, another measure of SES, had no significant protective effect unless tobacco and other drug use were also included as covariates, and then the effect was weak (p=.048). Looking also at association of drinking by each trimester, only first trimester was significant when controlling for drinking in 2nd and 3rd trimester and tobacco and drug use (p<.001, OR=4.50, 95% CI: 2.2–9.3).
4. Discussion
4.1. Using Multiple Physical Measurements and Observations to Identify Children with FASD
Since its original description, characteristic physical findings have been central to the diagnosis of FAS. The active case ascertainment data from children in first grade classrooms in the present study provide additional insight into the range of physical phenotypes observed in children with FASD.
Growth deficiency was a primary differentiator among the diagnostic groups of subjects within this study. Children who met diagnostic criteria for any diagnosis on the continuum of FASD were indeed significantly smaller on height, weight, BMI, and head circumference than typically developing children. Furthermore, children with one of the specific diagnoses within FASD were significantly different in size from one diagnostic group to another (e.g., FAS vs. PFAS, PFAS vs. ARND, etc.). These data confirm the observations of other investigators that validate the use of growth restriction in the diagnosis of FASD (Carter et al., 2016).
The frequency of short palpebral fissures, smooth philtrum, and narrow vermilion border of the upper lip (the cardinal facial features of FAS) also varied significantly among the diagnostic groups, and by definition for FAS and PFAS, was significantly different in their frequency with controls.
Indicators of ocular hypotelorism (decreased inner canthal distance, outer canthal distance and/or interpupillary distance) and objective signs of midfacial hypoplasia (decreased size of maxillary and mandibular arcs) also proved to be predictive of FASD in these American populations. These features can be suggestive of holoprosencephaly (HPE). Defined by incomplete division of the forebrain and characterized by midline forebrain deficiencies, HPE has been documented to result from prenatal ethanol exposure in both humans and animal models (Godin et al., 2010; Sulik & Johnston, 1981).
Overall, the mean total dysmorphology scores of study subjects formed a continuum that was statistically significantly different among each of the FASD diagnostic groups, and all were significantly different from the comparison group of controls (except for children with ARND). Among other features useful in differentiating children with FASD from controls were: ptosis, hypoplastic nails, fifth finger clinodactyly, and altered palmar creases. These observations validate the inclusion of these features in the total dysmorphology scoring system.
4.2. Comparison of Children with ARND vs. Controls
The separate analysis of physical differences among cases of ARND and controls adds additional support to the importance of dysmorphology assessment in diagnosing the full continuum of FASD. Bivariate comparison indicated that some cases of ARND may be indicated by head circumference ≤10th centile as well as height and weight ≤10th centile. An observation of prognathism by age seven also differentiated children with ARND from typically developing children. Furthermore, children with ARND had mean maxillary and mandibular measurements that were shorter than controls, although this only approached statistical significance in the sample. Therefore, while the less dysmorphic nature of children with ARND (in comparison to children in the other diagnostic categories of FASD) was confirmed in this population-based study. A significant number of children with ARND had depressed height, weight, and head circumference and were prognathic at age seven (although, as discussed previously, it is unclear whether the observed relative mandibular protuberance in these children is true prognathism or apparent prognathism because of a retruded midface).
Differences in case prevalence by race and Hispanic ethnicity proved to be relatively minor. Hispanics proved to be underrepresented for FASD cases overall, which fits well with the drinking literature that indicates that recent immigrant Hispanic females to the U.S. tend to drink less and drink less problematically than women of other ethnic groups in the general population (Caetano et al., 2012; Vaeth et al., 2012). And for specific diagnoses, the White-non Hispanic group was found to have an excess of cases of PFAS. Otherwise, no particular race or ethnic group had a higher rate than another.
4.3. Proximal Maternal Risk for an FASD Diagnosis
The maternal risk data, especially the prenatal use of alcohol, are notoriously difficult to collect in the U.S. population and other European cultural heritage populations (Alvik, Haldorsen, Groholt, et al., 2006; Benz et al., 2009; Chasnoff et al., 2015). Our experienced interviewers frequently suspected under-reporting of quantity and frequency of use during pregnancy, but the reporting of any alcohol use (yes/no) for particular trimesters appeared to be more accurate. Reporting of alcohol use prior to pregnancy recognition in this U.S. study, however, provided a useful, and we believe, accurate profile of the usual drinking pattern and quantity of drinking that was associated with severity of teratogenic damage associated with the birth of a child with FASD. The three drinks per drinking day (DDD) associated with a diagnosis of an FASD is the same as reports of drinking during pregnancy that have been verified by two alcohol use biomarkers to be accurate in another population (May, Hasken, et al., 2018). In a number of our other population-based studies in South Africa (May et al., 2021; May, Blankenship, Marais, Gossage, Kalberg, Joubert, et al., 2013; May, Marais, et al., 2016), maternal reports of a typical drinking pattern of at least three DDD twice a week during pregnancy were significantly associated with significant increases in the likelihood of bearing a child diagnosed with an FASD. In this U.S. study there was a 10-fold increase in the likelihood of an FASD diagnosis with maternal reports of usual drinking of three DDD prior to pregnancy recognition (p<.001, OR=9.92). Reporting five or more DDD increased the odds to 11 (p<.001, OR=10.98). Furthermore, first trimester exposures presented the only statistically significant risk for a diagnosis of an FASD (p<.001, OR=4.50). Therefore, the most accurate measures of prenatal drinking reported in these American samples were quantity and frequency of drinking prior to pregnancy recognition and reports of first trimester drinking; reports of drinking during pregnancy in this U.S. sample were most likely accurate only for binary (yes/no) responses, such as, drinking by trimester. This differs substantially from maternal risk data in South Africa where detailed reports of drinking during all trimesters of pregnancy are more common, forthcoming, and accurate.
4.4. What Dysmorphology Adds to the Diagnosis of the Full Continuum of FASD
The mean total dysmorphology scores differentiated all diagnostic groups from one another, except for children with ARND and controls. Furthermore, the independent comparison of ARND and controls indicated that the height, weight, and head circumference of a significant number of the study children with ARND was depressed and fell below the 10th centile, and prognathism differentiated children with ARND for controls. These findings also converge with those of our South African prevalence studies. In five South African population-based samples, the mean total dysmorphology scores differentiated all diagnostic groups from one another, including children with ARND from controls (May et al., 2017, 2021; May, Blankenship, Marais, Gossage, Kalberg, Barnard, et al., 2013; May, de Vries, et al., 2016; May, Marais, et al., 2016). In at least one South African study, maxillary and mandibular arcs also differentiated children with ARND from randomly-selected controls (May et al., 2021). Prognathism was also more common among children with ARND than controls (7.5% vs. 2.9%) in the same South African sample. Therefore, measuring and observing a substantial number of minor anomalies aids in the discovery of not only FAS and PFAS, but other minor anomalies may often represent indicators that can assist in the identification of children with ARND.
4.5. Strengths and Limitations
There were weaknesses in this study. First, we set a goal at the beginning of the study of achieving a 70% consent rate for the overall study. Only in one of the six cohort samples was this rate achieved; however, the mean consent was a respectable 58%. Second, the prospective, objective screening, examinations, testing of all consented children, and in-person maternal interviews were all very time-consuming, expensive, and labor intensive, involving many logistic challenges. The close coordination, cooperation, and commitment of local education personnel, administrators, teachers, parents, and others in the community was required throughout, and each of these communities played a vital and positive role in the study. Third, the reporting of maternal alcohol use during pregnancy by quantity, frequency, and gestational timing was suspiciously low in these populations. However, the reports of alcohol use prior to pregnancy and the binary, yes/no reporting for the first trimester provided useful and likely accurate measures by which to estimate a significant alcohol involvement level, and the trimester of greatest risk in the etiology of a child with FASD. Fourth, the measures of prenatal drug use in addition to alcohol that we used in maternal risk interviews were neither as specific nor quantified as they could have been. This limited our ability to successfully estimate the unique or synergistic contribution of prenatal cannabis use to the severity of FASD traits.
The strengths of this study lie in four areas. First, population-based sampling relied on random sampling for representative proportions of children with each of the specific diagnoses of FASD and a representative comparison group of typically-developing children. Although challenging from start to finish, active case ascertainment made this a powerful, representative, and meaningful study. Second, broad preliminary screening of smaller children on height, weight and head circumference that was highly sensitive (≤ 25th centile) was employed to cast a large net to capture all cases of smaller children in the consented population with known traits of FAS. Third, once the sensitive screening criteria were used to enter as many children who might be suspected to have an FASD, then diagnostic criteria were employed for high clinical specificity. Fourth, the inter-group comparisons of children with ARND vs typically-developing controls was unique and it yielded several physical growth and development measures that clearly distinguished the children with ARND from controls.
5. Conclusion
The results of the current investigation endorse the importance of careful physical assessment in the diagnosis of FASD. Beyond the current three cardinal facial features, further analysis of the pattern of the additional minor anomalies observed in children with FASD in large populations may allow inclusion of the current, or a modified future version, of the total dysmorphology score in the diagnostic criteria for FASD, thus improving the specificity of the diagnosis.
Supplementary Material
Acknowledgements
Our deepest thanks are extended to the field staff, Amy Baete, Jaymi Russo, Jo-Viviane Jones, Rosemary Bozeman, Mary Kay Burns, Joelene Goodover, Heather Mastro, and Julie Stegall who worked to organize, manage the logistics, and in multiple other ways to efficiently and tirelessly to carry out this project.
This project was funded by the National Institutes of Health (NIH), the National Institute on Alcohol Abuse, and Alcoholism (NIAAA), grant UO1 AA019894. The authors have no financial relationship relevant to this article to disclose. The authors have no conflict of interest to declare. Marcia Scott, Ph.D., Kenneth Warren, Ph.D., Faye Calhoun, D.P.A., Enoch Gordis, M.D., and the late T-K Li, M.D. of NIAAA provided intellectual guidance, encouragement, and support for diagnostic, epidemiologic, and prevention studies of FASD for over three decades. We are also grateful for the advice and participation in the planning and implementation of the CoFASP collaboration by the Advisory Committee members who were led by Marcia Scott, Ph.D., NIAAA Project Officer, Judith Arroyo, Ph.D., Michael Charness, M.D., William Dunty, Ph.D., Daniel Falk, Ph.D., Dale Herald, M.D., Ph.D., and Edward Riley, Ph.D.
Funding:
This project was funded by the National Institutes of Health (NIH), the National Institute on Alcohol Abuse, and Alcoholism (NIAAA), grant UO1 AA019894 as part of the Collaboration on Fetal Alcohol Spectrum Disorders Prevalence (CoFASP) consortium.
Data Availability Statement:
The data that support the findings of this study are available from the corresponding author upon reasonable request.
References
- Aase JM (1994). Clinical Recognition of FAS. Alcohol Health and Research World, 18(1), 5–9. [PMC free article] [PubMed] [Google Scholar]
- Abel EL, & Sokol RJ (1987). Incidence of fetal alcohol syndrome and economic impact of FAS-related anomalies. Drug and Alcohol Dependence. 10.1016/0376-8716(87)90087-1 [DOI] [PubMed] [Google Scholar]
- Abell K, May W, May PA, Kalberg W, Hoyme HE, Robinson LK, Manning M, Jones KL, & Abdul-Rahman O (2016). Fetal Alcohol Spectrum Disorders and Assessment of Maxillary and Mandibular Arc Measurements. American Journal of Medical Genetics. Part A, 170(7), 1763–1771. 10.1002/ajmg.a.37656 [DOI] [PubMed] [Google Scholar]
- Achenbach T, & Rescorla L (2001). Manual For The ASEBA School-Age Forms And Profiles. University of Vermont, Research Center for Children, Youth, and Families. [Google Scholar]
- Allanson JE, Cunniff C, Hoyme HE, McGaughran Julie, Muenke M, & Neri G (2009). Elements of morphology: Standard terminology for the head and face. American Journal of Medical Genetics Part A, 149A(1), 6–28. https://doi.org/doi: 10.1002/ajmg.a.32612 [DOI] [PMC free article] [PubMed] [Google Scholar]
- Alvik A, Haldorsen T, Groholt B, & Lindemann R (2006). Alcohol consumption before and during pregnancy comparing concurrent and retrospective reports. Alcoholism: Clinical and Experimental Research, 30(3), 510–515. 10.1111/j.1530-0277.2006.00055.x [DOI] [PubMed] [Google Scholar]
- Alvik A, Haldorsen T, & Lindemann R (2006). Alcohol consumption, smoking and breastfeeding in the first six months after delivery. Acta Paediatrica, 95(6), 686–693. 10.1080/08035250600649266 [DOI] [PubMed] [Google Scholar]
- Astley SJ (2010). Profile of the first 1,400 patients receiving diagnostic evaluations for fetal alcohol spectrum disorder at the Washington State Fetal Alcohol Syndrome Diagnostic & Prevention Network. The Canadian Journal of Clinical Pharmacology, 17(1), e132–64. [PubMed] [Google Scholar]
- Bakhireva LN, Sharkis J, Shrestha S, Miranda-Sohrabji TJ, Williams S, & Miranda RC (2017). Prevalence of Prenatal Alcohol Exposure in the State of Texas as Assessed by Phosphatidylethanol in Newborn Dried Blood Spot Specimens. Alcoholism, Clinical and Experimental Research, 41(5), 1004–1011. 10.1111/acer.13375 [DOI] [PubMed] [Google Scholar]
- Beery KE, & Beery NA (2004). The Beery-Buktenica Development Test of Visual-Motor Integration (5th ed.). Pearson Assessment. [Google Scholar]
- Benz J, Rasmussen C, & Andrew G (2009). Diagnosing fetal alcohol spectrum disorder: History challenges and future directions. Paediatrics and Child Health, 14(4), 231–237. 10.1093/pch/14.4.231 [DOI] [PMC free article] [PubMed] [Google Scholar]
- Bracken BA (1998). Bracken Basic Concept Scale - Revised. Pearson Assessment. [Google Scholar]
- Caetano R, Vaeth PAC, & Rodriguez LA (2012). The Hispanic Americans baseline alcohol survey (HABLAS): Acculturation, birthplace and alcohol-related social problems across Hispanic national groups. Hispanic Journal of Behavioral Sciences, 34(1), 95–117. 10.1177/0739986311424040 [DOI] [PMC free article] [PubMed] [Google Scholar]
- Carter RC, Jacobson JL, Molteno CD, Dodge NC, Meintjes EM, & Jacobson SW (2016). Fetal Alcohol Growth Restriction and Cognitive Impairment. Pediatrics, 138(2), e20160775. 10.1542/peds.2016-0775 [DOI] [PMC free article] [PubMed] [Google Scholar]
- Chambers CD, Coles C, Kable J, Akshoomoff N, Xu R, Zellner JA, Honerkamp-Smith G, Manning MA, Adam MP, & Jones KL (2019). Fetal Alcohol Spectrum Disorders in a Pacific Southwest City: Maternal and Child Characteristics. Alcoholism: Clinical and Experimental Research, 43(12), 2578–2590. 10.1111/acer.14213 [DOI] [PMC free article] [PubMed] [Google Scholar]
- Chasnoff IJ, Wells AM, & King L (2015). Misdiagnosis and Missed Diagnoses in Foster and Adopted Children With Prenatal Alcohol Exposure. Pediatrics, 135(2), 264–270. 10.1542/peds.2014-2171 [DOI] [PubMed] [Google Scholar]
- Clarren SK, & Smith DW (1978). The Fetal Alcohol Syndrome. New England Journal of Medicine, 298(19), 1063–1067. 10.1056/NEJM197805112981906 [DOI] [PubMed] [Google Scholar]
- Coles CD, Kalberg W, Kable JA, Tabachnick B, May PA, & Chambers CD (2020). Characterizing Alcohol-Related Neurodevelopmental Disorder: Prenatal Alcohol Exposure and the Spectrum of Outcomes. Alcoholism: Clinical and Experimental Research, 44(6), 1245–1260. 10.1111/acer.14325 [DOI] [PMC free article] [PubMed] [Google Scholar]
- Czarnecki DM, Russell M, Cooper ML, & Salter D (1990). Five-year reliability of self-reported alcohol consumption. Journal of Studies on Alcohol, 51(1), 68–76. https://doi.org/doi: 10.15288/jsa.1990.51.68 [DOI] [PubMed] [Google Scholar]
- Denny CH, Acero CS, Terplan M, & Kim SY (2020). Trends in Alcohol Use Among Pregnant Women in the U.S., 2011–2018. American Journal of Preventive Medicine, 59(5), 768–769. 10.1016/j.amepre.2020.05.017 [DOI] [PMC free article] [PubMed] [Google Scholar]
- Elliott CD (2007). Differential Ability Scales-II (DAS-II). Pearson Assessment. [Google Scholar]
- Ervalahti N, Korkman M, Fagerlund A, Autti-Ramo I, Loimu L, & Hoyme HE (2007). Relationship between dysmorphic features and general cognitive function in children with fetal alcohol spectrum disorders. American Journal of Medical Geneticsgenetics, 143A(24), 2916–2923. 10.1002/ajmg.a.32009 [DOI] [PubMed] [Google Scholar]
- Fish EW, Murdaugh LB, Zhang C, Boschen KE, Boa-Amponsem O, Mendoza-Romero HN, Tarpley M, Chdid L, Mukhopadhyay S, Cole GJ, Williams KP, & Parnell SE (2019). Cannabinoids Exacerbate Alcohol Teratogenesis by a CB1-Hedgehog Interaction. Scientific Reports, 9, 16057. 10.1038/s41598-019-52336-w [DOI] [PMC free article] [PubMed] [Google Scholar]
- Fortin M, Muckle G, Jacobson SW, Jacobson JL, & Bélanger RE (2017). Alcohol use among Inuit pregnant women: Validity of alcohol ascertainment measures over time. Neurotoxicology and Teratology, 64(May), 73–78. 10.1016/j.ntt.2017.10.007 [DOI] [PubMed] [Google Scholar]
- Godin EA, O’Leary-Moore SK, Khan AA, Parnell SE, Ament JJ, Dehart DB, Johnson BW, Allan Johnson G, Styner MA, & Sulik KK (2010). Magnetic resonance microscopy defines ethanol-induced brain abnormalities in prenatal mice: Effects of acute insult on gestational day 7. Alcoholism: Clinical and Experimental Research, 34(1), 98–111. 10.1111/j.1530-0277.2009.01071.x [DOI] [PMC free article] [PubMed] [Google Scholar]
- Hannigan JH, Chiodo LM, Sokol RJ, Janisse J, Ager JW, Greenwald MK, & Delaney-Black V (2010). A 14-year retrospective maternal report of alcohol consumption in pregnancy predicts pregnancy and teen outcomes. Alcohol, 44(7–8), 583–594. 10.1016/j.alcohol.2009.03.003 [DOI] [PMC free article] [PubMed] [Google Scholar]
- Hanson JW, Jones KL, & Smith DW (1976). Fetal alcohol syndrome. Experience with 41 patients. JAMA, 235(14), 1458–1460. [PubMed] [Google Scholar]
- Hoyme HE, Kalberg WO, Elliott AJ, Blankenship J, Buckley D, Marais A-S, Manning MA, Robinson LK, Adam MP, Abdul-Rahman O, Jewett T, Coles CD, Chambers C, Jones KL, Adnams CM, Shah PE, Riley EP, Charness ME, Warren KR, & May PA (2016). Updated Clinical Guidelines for Diagnosing Fetal Alcohol Spectrum Disorders. Pediatrics, 138(2), e20154256. 10.1542/peds.2015-4256 [DOI] [PMC free article] [PubMed] [Google Scholar]
- Hoyme HE, May PA, Kalberg WO, Kodituwakku PW, Gossage JP, Trujillo PM, Buckley DG, Miller JH, Aragon AS, Khaole N, Viljoen DL, Jones KL, & Robinson LK (2005). A Practical Clinical Approach to Diagnosis of Fetal Alcohol Spectrum Disorders: Clarification of the 1996 Institute of Medicine Criteria. Pediatrics, 115(1), 39–47. 10.1542/peds.2004-0259 [DOI] [PMC free article] [PubMed] [Google Scholar]
- IBM. (2020). IBM SPSS Statistics for Windows.
- Jacobson SW, Hoyme HE, Carter RC, Dodge NC, Molteno CD, Meintjes EM, & Jacobson JL (2021). Evolution of the Physical Phenotype of Fetal Alcohol Spectrum Disorders from Childhood through Adolescence. Alcoholism: Clinical and Experimental Research, 45(2), 395–408. 10.1111/acer.14534 [DOI] [PubMed] [Google Scholar]
- Jones KL, & Smith DW (1973). Recognition of the fetal alcohol syndrome in early infancy. Lancet, 302(7836), 999–1001. [DOI] [PubMed] [Google Scholar]
- Jones KL, & Smith DW (1975). The fetal alcohol syndrome. Teratology, 12(1), 1–10. 10.1002/tera.1420120102 [DOI] [PubMed] [Google Scholar]
- Kaskutas LA, & Graves K (2000). An alternative to standard drinks as a measure of alcohol consumption. Journal of Substance Abuse, 12(1–2), 67–78. 10.1016/s0899-3289(00)00042-0 [DOI] [PubMed] [Google Scholar]
- Kaskutas LA, & Kerr WC (2008). Accuracy of Photographs to Capture Respondent-Defined Drink Size. Journal of Studies on Alcohol and Drugs, 69(4), 605–610. 10.15288/jsad.2008.69.605 [DOI] [PubMed] [Google Scholar]
- King AC (1994). Enhancing the self-report of alcohol consumption in the community: two questionnaire formats. American Journal of Public Health, 84(2), 294–296. https://doi.org/doi: 10.2105/ajph.84.2.294 [DOI] [PMC free article] [PubMed] [Google Scholar]
- Korkman M, Kirk U, & Kemp S (2007). NEPSY (2nd ed.). Pearson Assessment. [Google Scholar]
- Lange S, Probst C, Gmel G, Rehm J, Burd L, & Popova S (2017). Global Prevalence of Fetal Alcohol Spectrum Disorder Among Children and Youth: A Systematic Review and Meta-analysis. JAMA Pediatrics, 171(10), 948–956. 10.1001/jamapediatrics.2017.1919 [DOI] [PMC free article] [PubMed] [Google Scholar]
- Lange S, Rehm J, & Popova S (2018). Implications of Higher Than Expected Prevalence of Fetal Alcohol Spectrum Disorders. JAMA, 319(5), 448–449. 10.1001/jama.2017.21895 [DOI] [PubMed] [Google Scholar]
- Lipinski RJ, Hammond P, O’Leary-Moore SK, Ament JJ, Pecevich SJ, Jiang Y, Budin F, Parnell SE, Suttie M, Godin EA, Everson JL, Dehart DB, Oguz I, Holloway HT, Styner MA, Johnson GA, & Sulik KK (2012). Ethanol-induced face-brain dysmorphology patterns are correlative and exposure-stage dependent. PLoS ONE, 7(8), e43067. 10.1371/journal.pone.0043067 [DOI] [PMC free article] [PubMed] [Google Scholar]
- May PA, Baete A, Russo J, Elliott AJ, Blankenship J, Kalberg WO, Buckley D, Brooks M, Hasken J, Abdul-Rahman O, Adam MP, Robinson LK, Manning M, & Hoyme HE (2014). Prevalence and Characteristics of Fetal Alcohol Spectrum Disorders. Pediatrics, 134(5), 855–866. 10.1542/peds.2013-3319 [DOI] [PMC free article] [PubMed] [Google Scholar]
- May PA, Blankenship J, Marais A-S, Gossage JP, Kalberg WO, Barnard R, De Vries M, Robinson LK, Adnams CM, Buckley D, Manning M, Jones KL, Parry C, Hoyme HE, & Seedat S (2013). Approaching the Prevalence of the Full Spectrum of Fetal Alcohol Spectrum Disorders in a South African Population-Based Study. Alcoholism, Clinical and Experimental Research, 37(5), 818–830. 10.1111/acer.12033 [DOI] [PMC free article] [PubMed] [Google Scholar]
- May PA, Blankenship J, Marais AS, Gossage JP, Kalberg WO, Joubert B, Cloete M, Barnard R, De Vries M, Hasken J, Robinson LK, Adnams CM, Buckley D, Manning M, Parry CDH, Hoyme HE, Tabachnick B, & Seedat S (2013). Maternal Alcohol Consumption Producing Fetal Alcohol Spectrum Disorders (FASD): Quantity, Frequency, and Timing of Drinking. Drug and Alcohol Dependence, 133(2), 502–512. 10.1016/j.drugalcdep.2013.07.013 [DOI] [PMC free article] [PubMed] [Google Scholar]
- May PA, Brooke L, Gossage JP, Croxford J, Adnams C, Jones KL, Robinson L, & Viljoen D (2000). Epidemiology of Fetal Alcohol Syndrome in a South African Community in the Western Cape Province. American Journal of Public Health, 90(12), 1905–1912. https://doi.org/doi: 10.2105/ajph.90.12.1905. [DOI] [PMC free article] [PubMed] [Google Scholar]
- May PA, Chambers CD, Kalberg WO, Zellner J, Feldman H, Buckley D, Kopald D, Hasken JM, Xu R, Honerkamp-Smith G, Taras H, Manning MA, Robinson LK, Adam MP, Abdul-Rahman O, Vaux K, Jewett T, Elliott AJ, Kable JA, … Hoyme HE (2018). Prevalence of Fetal Alcohol Spectrum Disorders in 4 US Communities. Journal of the American Medical Association, 319(5), 474–482. 10.1001/jama.2017.21896 [DOI] [PMC free article] [PubMed] [Google Scholar]
- May PA, de Vries MM, Marais AS, Kalberg WO, Adnams CM, Hasken JM, Tabachnick B, Robinson LK, Manning MA, Jones KL, Hoyme D, Seedat S, Parry CD, & Hoyme HE (2016). The Continuum of Fetal Alcohol Spectrum Disorders in Four Rural Communities in South Africa: Prevalence and Characteristics. Drug and Alcohol Dependence, 159, 207–218. 10.1016/j.drugalcdep.2015.12.023 [DOI] [PMC free article] [PubMed] [Google Scholar]
- May PA, De Vries M, Marais A-S, Kalberg W, Buckley D, Adnams C, Hasken J, Tabachnick B, Robinson L, Manning M, Bezuidenhout H, Adam M, Jones K, Seedat S, Parry C, & Hoyme H (2017). Replication of High Fetal Alcohol Spectrum Disorders Prevalence Rates, Child Characteristics, and Maternal Risk Factors in a Second Sample of Rural Communities in South Africa. International Journal of Environmental Research and Public Health, 14(5), 522. 10.3390/ijerph14050522 [DOI] [PMC free article] [PubMed] [Google Scholar]
- May PA, Fiorentino D, Coriale G, Kalberg WO, Eugene Hoyme H, Aragón AS, Buckley D, Stellavato C, Phillip Gossage J, Robinson LK, Jones KL, Manning M, & Ceccanti M (2011). Prevalence of Children with Severe Fetal Alcohol Spectrum Disorders in Communities Near Rome, Italy: New Estimated Rates Are Higher than Previous Estimates. International Journal of Environmental Research and Public Health, 8(6), 2331–2351. 10.3390/ijerph8062331 [DOI] [PMC free article] [PubMed] [Google Scholar]
- May PA, Fiorentino D, Phillip Gossage J, Kalberg WO, Eugene Hoyme H, Robinson LK, Coriale G, Jones KL, del Campo M, Tarani L, Romeo M, Kodituwakku PW, Deiana L, Buckley D, & Ceccanti M (2006). Epidemiology of FASD in a Province in Italy: Prevalence and Characteristics of Children in a Random Sample of Schools. Alcoholism, Clinical and Experimental Research, 30(9), 1562–1575. 10.1111/j.1530-0277.2006.00188.x [DOI] [PubMed] [Google Scholar]
- May PA, Gossage JP, Brooke LE, Snell CL, Marais A-SS, Hendricks LS, Croxford JA, & Viljoen DL (2005). Maternal Risk Factors for Fetal Alcohol Syndrome in the Western Cape Province of South Africa: A Population-Based Study. American Journal of Public Health, 95(7), 1190–1199. 10.2105/AJPH.2003.037093 [DOI] [PMC free article] [PubMed] [Google Scholar]
- May PA, Gossage JP, Marais A-S, Adnams CM, Hoyme HE, Jones KL, Robinson LK, Khaole NCO, Snell C, Kalberg WO, Hendricks L, Brooke L, Stellavato C, & Viljoen DL (2007). The Epidemiology of Fetal Alcohol Syndrome and Partial FAS in a South African Community. Drug and Alcohol Dependence, 88(2–3), 259–271. 10.1016/j.drugalcdep.2006.11.007 [DOI] [PMC free article] [PubMed] [Google Scholar]
- May PA, Gossage JP, Marais A-S, Hendricks LS, Snell CL, Tabachnick BG, Stellavato C, Buckley DG, Brooke LE, & Viljoen DL (2008). Maternal Risk Ractors for Fetal Alcohol Syndrome and Partial Fetal Alcohol Syndrome in South Africa: A Third Study. Alcoholism, Clinical and Experimental Research, 32(5), 738–753. 10.1111/j.1530-0277.2008.00634.x [DOI] [PubMed] [Google Scholar]
- May PA, Hasken JM, Baete A, Russo J, Elliott AJ, Kalberg WO, Buckley D, Brooks M, Ortega MA, Hedrick DM, Tabachnick BG, Abdul-Rahman O, Adam MP, Jewett T, Robinson LK, Manning MA, & Hoyme HE (2020). Fetal Alcohol Spectrum Disorders in a Midwestern City: Child Characteristics, Maternal Risk Traits, and Prevalence. Alcoholism: Clinical and Experimental Research, 44(4), 919–938. 10.1111/acer.14314 [DOI] [PMC free article] [PubMed] [Google Scholar]
- May PA, Hasken JM, Bozeman R, Jones JV, Burns MK, Goodover J, Kalberg WO, Buckley D, Brooks M, Ortega MA, Elliott AJ, Hedrick DM, Tabachnick BG, Abdul-Rahman O, Adam MP, Jewett T, Robinson LK, Manning MA, & Hoyme HE (2020). Fetal Alcohol Spectrum Disorders in a Rocky Mountain Region City: Child Characteristics, Maternal Risk Traits, and Prevalence. Alcoholism: Clinical and Experimental Research, 44(4), 900–918. 10.1111/acer.14315 [DOI] [PMC free article] [PubMed] [Google Scholar]
- May PA, Hasken JM, De Vries MM, Marais AS, Stegall JM, Marsden D, Parry CDH, Seedat S, & Tabachnick B (2018). A Utilitarian Comparison of Two Alcohol Use Biomarkers With Self-Reported Drinking History Collected in Antenatal CLinics. Reproductive Toxicology, 77, 25–32. 10.1016/j.reprotox.2018.02.002 [DOI] [PMC free article] [PubMed] [Google Scholar]
- May PA, Hasken JM, Stegall JM, Mastro HA, Kalberg WO, Buckley D, Brooks M, Hedrick DM, Ortega MA, Elliott AJ, Tabachnick BG, Abdul-Rahman O, Adam MP, Robinson LK, Manning MA, Jewett T, & Hoyme HE (2020). Fetal Alcohol Spectrum Disorders in a Southeastern County of the United States: Child Characteristics and Maternal Risk Traits. Alcoholism: Clinical and Experimental Research, 44(4), 939–959. 10.1111/acer.14313 [DOI] [PMC free article] [PubMed] [Google Scholar]
- May PA, Keaster C, Bozeman R, Goodover J, Blankenship J, Kalberg WO, Buckley D, Brooks M, Hasken J, Gossage JP, Robinson LK, Manning M, & Hoyme HE (2015). Prevalence and Characteristics of Fetal Alcohol Syndrome and Partial Fetal Alcohol Syndrome in a Rocky Mountain Region City. Drug and Alcohol Dependence, 155, 118–127. 10.1016/j.drugalcdep.2015.08.006 [DOI] [PMC free article] [PubMed] [Google Scholar]
- May PA, Marais AS, De Vries MM, Buckley D, Kalberg WO, Hasken JM, Stegall JM, Hedrick DM, Robinson LK, Manning MA, Tabachnick BG, Seedat S, Parry CD, & Hoyme HE (2021). The Prevalence, Child Characteristics, and Maternal Risk Factors for the Continuum of Fetal Alcohol Spectrum Disorders: A sixth Population-Based Study in the Same South African Community. Drug and Alcohol Dependence, 218, 108408. 10.1016/j.drugalcdep.2020.108408 [DOI] [PMC free article] [PubMed] [Google Scholar]
- May PA, Marais AS, de Vries MM, Kalberg WO, Buckley D, Hasken JM, Adnams CM, Barnard R, Joubert B, Cloete M, Tabachnick B, Robinson LK, Manning MA, Jones KL, Bezuidenhout H, Seedat S, Parry CDH, & Hoyme HE (2016). The Continuum of Fetal Alcohol Spectrum Disorders in a Community in South Africa: Prevalence and Characteristics in a Fifth Sample. Drug and Alcohol Dependence, 168, 274–286. 10.1016/j.drugalcdep.2016.09.025 [DOI] [PMC free article] [PubMed] [Google Scholar]
- National Institute on Alcohol Abuse and Alcoholism (NIAAA). (n.d.). What Is A Standard Drink? https://www.niaaa.nih.gov/alcohols-effects-health/overview-alcohol-consumption/what-standard-drink
- Nellhaus G (1968). Head circumference from birth to eighteen years. Practical composite international and interracial graphs. Pediatrics, 41(1), 106–114. [PubMed] [Google Scholar]
- O’Leary-Moore SK, Parnell SE, Godin EA, Dehart DB, Ament JJ, Khan AA, Johnson GA, Styner MA, & Sulik KK (2010). Magnetic resonance microscopy-based analyses of the brains of normal and ethanol-exposed fetal mice. Birth Defects Research Part A - Clinical and Molecular Teratology, 88(11), 953–964. 10.1002/bdra.20719 [DOI] [PMC free article] [PubMed] [Google Scholar]
- Parnell SE, Holloway HT, O’Leary-Moore SK, Dehart DB, Paniaqua B, Oguz I, Budin F, Styner MA, Johnson GA, & Sulik KK (2013). Magnetic resonance microscopy-based analyses of the neuroanatomical effects of gestational day 9 ethanol exposure in mice. Neurotoxicology and Teratology, 39, 77–83. 10.1016/j.ntt.2013.07.009 [DOI] [PMC free article] [PubMed] [Google Scholar]
- Parnell SE, O’Leary-Moore SK, Godin EA, Dehart DB, Johnson BW, Allan Johnson G, Styner MA, & Sulik KK (2009). Magnetic resonance microscopy defines ethanol-induced brain abnormalities in prenatal mice: Effects of acute insult on gestational day 8. Alcoholism: Clinical and Experimental Research, 33(6), 1001–1111. 10.1111/j.1530-0277.2009.00921.x [DOI] [PMC free article] [PubMed] [Google Scholar]
- Popova S, Lange S, Poznyak V, Chudley AE, Shield KD, Reynolds JN, Murray M, & Rehm J (2019). Population-based prevalence of fetal alcohol spectrum disorder in Canada. BMC Public Health, 19(1), 845. 10.1186/s12889-019-7213-3 [DOI] [PMC free article] [PubMed] [Google Scholar]
- Popova S, Lange S, Probst C, Gmel G, & Rehm J (2018). Global prevalence of alcohol use and binge drinking during pregnancy, and fetal alcohol spectrum disorder. Biochemistry and Cell Biology, 96(2), 237–240. 10.1139/bcb-2017-0077 [DOI] [PubMed] [Google Scholar]
- Rollins J, Tribble L, & Collins J (Eds.). (2011). Growth Reference (3rd ed.). Greenwood Genetic Center. [Google Scholar]
- Roozen S, Peters G-JY, Kok G, Townend D, Nijhuis J, & Curfs L (2016). Worldwide Prevalence of Fetal Alcohol Spectrum Disorders: A Systematic Literature Review Including Meta-Analysis. Alcoholism: Clinical and Experimental Research, 40(1), 18–32. 10.1111/acer.12939 [DOI] [PubMed] [Google Scholar]
- Sobell L, Agrawal S, Annis H, Ayala-Velazquez H, Echeverria L, Leo GI, Rybakowski JK, Sandahl C, Saunders B, Thomas S, & Zioikowski M (2001). Cross-cultural evaluation of two drinking assessment instruments: alcohol timeline followback and inventory of drinking situations. Substance Use & Misuse, 36(3), 313–331. https://doi.org/doi: 10.1081/ja-100102628 [DOI] [PubMed] [Google Scholar]
- Sobell Linda C., & Sobell MB (1992). Timeline follow back. A technique for Assessing self-reported Alcohol Consumption. Measuring Alcohol Consumption: Psychosocial and Biological Methods. 10.1007/978-1-4612-0357-5_3 [DOI] [Google Scholar]
- Sparrow SA, Cicchetti DV, & Balla DA (2005). Vineland Adaptive Behavior Scales (Second).
- Spohr H-L (2018). Fetal Alcohol Syndrom A Lifelong Challenge. Walter de Gruyter GmbH. https://doi.org/doi: 10.1515/9783110436563 [DOI] [Google Scholar]
- Stratton K, Howe C, & Battaglia F (1996). Fetal Alcohol Syndrome: Diagnosis, Epidemiology, Prevention, and Treatment. https://doi.org/doi.org/ 10.17226/4991 [DOI] [Google Scholar]
- Streissguth AP, Barr HM, & Sampson PD (1990). Moderate Prenatal Alcohol Exposure: Effects on Child IQ and Learning Problems at Age 7 1/2 Years. Alcoholism: Clinical and Experimental Research, 14(5), 662–669. 10.1111/j.1530-0277.1990.tb01224.x [DOI] [PubMed] [Google Scholar]
- Sulik KK (2005). Genesis of alcohol-induced craniofacial dysmorphism. Experimental Biology and Medicine, 230(6), 366–375. 10.1177/15353702-0323006-04 [DOI] [PubMed] [Google Scholar]
- Sulik KK, & Johnston MC (1981). Embryonic origin of holoprosencephaly: interrelationship of the developing brain and face. Scanning Electron Microscope, Pt 1, 309–322. [PubMed] [Google Scholar]
- Sulik KK, Johnston MC, & Webb MA (1981). Fetal alcohol syndrome: Embryogenesis in a mouse model. Science, 214(4523), 936–938. 10.1126/science.6795717 [DOI] [PubMed] [Google Scholar]
- Suttie M, Wozniak JR, Parnell SE, Wetherill L, Mattson SN, Sowell ER, Kan E, Riley EP, Jones KL, Coles C, Foroud T, & Hammond P (2018). Combined Face–Brain Morphology and Associated Neurocognitive Correlates in Fetal Alcohol Spectrum Disorders. Alcoholism: Clinical and Experimental Research, 42(9), 1769–1782. 10.1111/acer.13820 [DOI] [PMC free article] [PubMed] [Google Scholar]
- Tabachnick BG, & Fidell LS (2019). Using Mulivariate Statistics (7th ed.). Pearson. [Google Scholar]
- Thomas IT, Gaitantzis YA, & Frias JL (1987). Palpebral fissure length from 29 weeks gestation to 14 years. The Journal of Pediatrics, 111(2), 267–268. 10.1016/S0022-3476(87)80085-9 [DOI] [PubMed] [Google Scholar]
- Vaeth PAC, Caetano R, & Rodriguez LA (2012). The Hispanic Americans Baseline Alcohol Survey (HABLAS): The association between acculturation, birthplace and alcohol consumption across Hispanic national groups. Addictive Behaviors, 37(9), 1029–1037. 10.1016/j.addbeh.2012.04.015 [DOI] [PMC free article] [PubMed] [Google Scholar]
- Viljoen DL, Gossage JP, Brooke L, Adnams CM, Jones KL, Robinson LK, Hoyme HE, Snell C, Khaole NCO, Kodituwakku P, Asante KO, Findlay R, Quinton B, Marais A-S, Kalberg WO, & May PA (2005). Fetal Alcohol Syndrome Epidemiology in a South African Community: A Second Study of a Very High Prevalence Area. Journal of Studies on Alcohol, 66(5), 593–604. https://doi.org/doi: 10.15288/jsa.2005.66.593. [DOI] [PMC free article] [PubMed] [Google Scholar]
- Wurst FM, Kelso E, Weinmann W, Pragst F, Yegles M, & Sundstrom Poromaa I (2008). Measurement of direct ethanol metabolites suggests higher rate of alcohol use among pregnant women than found with the AUDIT-a pilot study in a population-based sample of Swedish women. American Journal of Obstetrics and Gynecology, 198(4), 407.e1–5. 10.1016/j.ajog.2007.10.801 [DOI] [PubMed] [Google Scholar]
Associated Data
This section collects any data citations, data availability statements, or supplementary materials included in this article.
Supplementary Materials
Data Availability Statement
The data that support the findings of this study are available from the corresponding author upon reasonable request.