

Abstract
Background.
Repetitive task practice reduces mean upper extremity motor impairment in populations of patients with chronic stroke, but individual response is highly variable. A method to predict meaningful reduction in impairment in response to training based on biomarkers and other data collected prior to an intervention is needed to establish realistic rehabilitation goals and to effectively allocate resources.
Objectives.
To identify prognostic factors and better understand the biological substrate for reductions in arm impairment in response to repetitive task practice among patients with chronic (≥ 6 months) post-stroke hemiparesis.
Methods.
The intervention is a form of repetitive task practice using a combination of robot-assisted therapy and functional arm use in real-world tasks. Baseline measures include the Fugl-Meyer Assessment, Wolf Motor Function Test, Action Research Arm Test, Stroke Impact Scale, questionnaires on pain and expectancy, MRI, transcranial magnetic stimulation, kinematics, accelerometry, and genomic testing.
Results.
Mean increase in FM-UE was 4.6 ± 1.0 SE, median 2.5. Approximately one-third of participants had a clinically meaningful response to the intervention, defined as an increase in FM ≥5. The selected logistic regression model had a receiver operating curve with AUC=0.988 (Std Error = 0.011, 95% Wald confidence limits: 0.967 – 1) showed little evidence of overfitting. Six variables that predicted response represented impairment, functional, and genomic measures.
Conclusion.
A simple weighted sum of six baseline factors can accurately predict clinically meaningful impairment reduction after outpatient intensive practice intervention in chronic stroke. Reduction of impairment may be a critical first step to functional improvement. Further validation and generalization of this model will increase its utility in clinical decision-making.
MeSH key words: stroke, prognosis, TMS, MRI, robot, rehabilitation
Introduction
Stroke is the third leading cause of adult disability worldwide1. Recent global trends toward stroke onset earlier in the lifespan2, 3, with COVID-194–6 and increased survival result in more individuals living with chronic stroke-related disability7, highlighting the need for effective long-term rehabilitation strategies1. Upper limb motor impairment affects up to 80% of stroke sufferers acutely and persists in 40%8. This impairment in arm function accounts for at least 50% of the decline in quality of life for stroke survivors, even for those who regain the ability to walk and return to work9, 10. Rapid reduction in impairment subacutely is well documented, while measurement of change in the chronic stage can be complicated by changes in overall condition, compensatory movement strategies, and learned non-use11. Some stroke survivors require lengthy rehabilitation to achieve their rehabilitation potential. Intense task repetition12 13, can also occur with less intensive14. Understanding the potential for rehabilitation and prediction of recovery beyond the acute and subacute periods, particularly in response to specific therapeutic interventions, is critical to maximizing the efficiency of care utilization and delivering personalized therapy in the longer term.
In the acute/subacute period after stroke (variably defined as days to 3–6 months after the initial insult), significant work has been done identifying early predictors of short-term recovery, such as motor-evoked potentials (MEPs)15–17. In chronic post-stroke hemiparesis, similar predictors have been studied.18–20. But most of the studies on prediction have looked at overall recovery, rather than response to a particular intervention. So, the extensive explorations of recovery during the acute and sub-acute periods may not tell us about the chances for eliciting improvement in the chronic state in response to a particular therapy.
Studies in chronic stroke have associated baseline measurements with response to intensive task practice, robotic or otherwise, e.g.21, 22, but there is no predictive model that we know of for guidance of patient selection. Factors that have been proposed and studied include imaging and neurophysiology measures of motor system involvement, sensory and motor function itself, and genomics. Some factors that have not been studied, to our knowledge, include pain and expectancy of response to the treatment. While some individual factors may not be significant predictors on their own, taking multiple factors in consideration together has the potential for better predictions or response to treatment.
Objectives and Summary
The purpose of this study is to identify baseline prognostic factors in chronic stroke that influence motor recovery in response to repetitive task practice and to develop a predictive model of response to a standardized intervention for the upper limb. In this manner, we propose to contribute to understanding the mechanisms of recovery; and develop an algorithm to better match patients in the chronic phase to effective therapy based on their individual behavioral, neurophysiological, and genetic composition. In this manuscript we present a planned analysis producing a predictive model using baseline variables to predict response as measured by improvement in Fugl Meyer score above a pre-defined threshold23.
Methods
The rationale, aims, and methods for this study were published23, and are briefly recapitulated here.
Study Design
In this prospective single-group study, participants received 36 one-hour sessions consisting of 45 minutes of robot-assisted therapy and 15 minutes of transition-to-task training (TTT), as was used in our prior trial, which demonstrated improvements in measures of impairment, function, and patient reported outcomes24. Participants were eligible for the study if they presented with mild/moderate to severe arm dysfunction, as assessed by a Fugl-Meyer (FM) baseline score of 10–45 (see Figure 2). Following informed consent, participants began baseline evaluation consisting of clinical arm assessments, brain imaging, saliva collection for DNA testing, robot-derived kinematic assessment, and transcranial magnetic stimulation (TMS) as a measure of corticospinal integrity23. After baseline assessment, participants completed 3 sessions per week for 36 sessions or 18 weeks of robot-assisted therapy, whichever came first, based on an intent-to-treat framework. Participants were re-assessed, by a therapist (LBH) who had no knowledge of treatment details or interim study analysis, every twelve sessions with the final evaluation occurring after 36 sessions or 18 weeks. This was followed by twelve weeks of retention without training and a follow-up assessment at 24 weeks.
Figure 2.
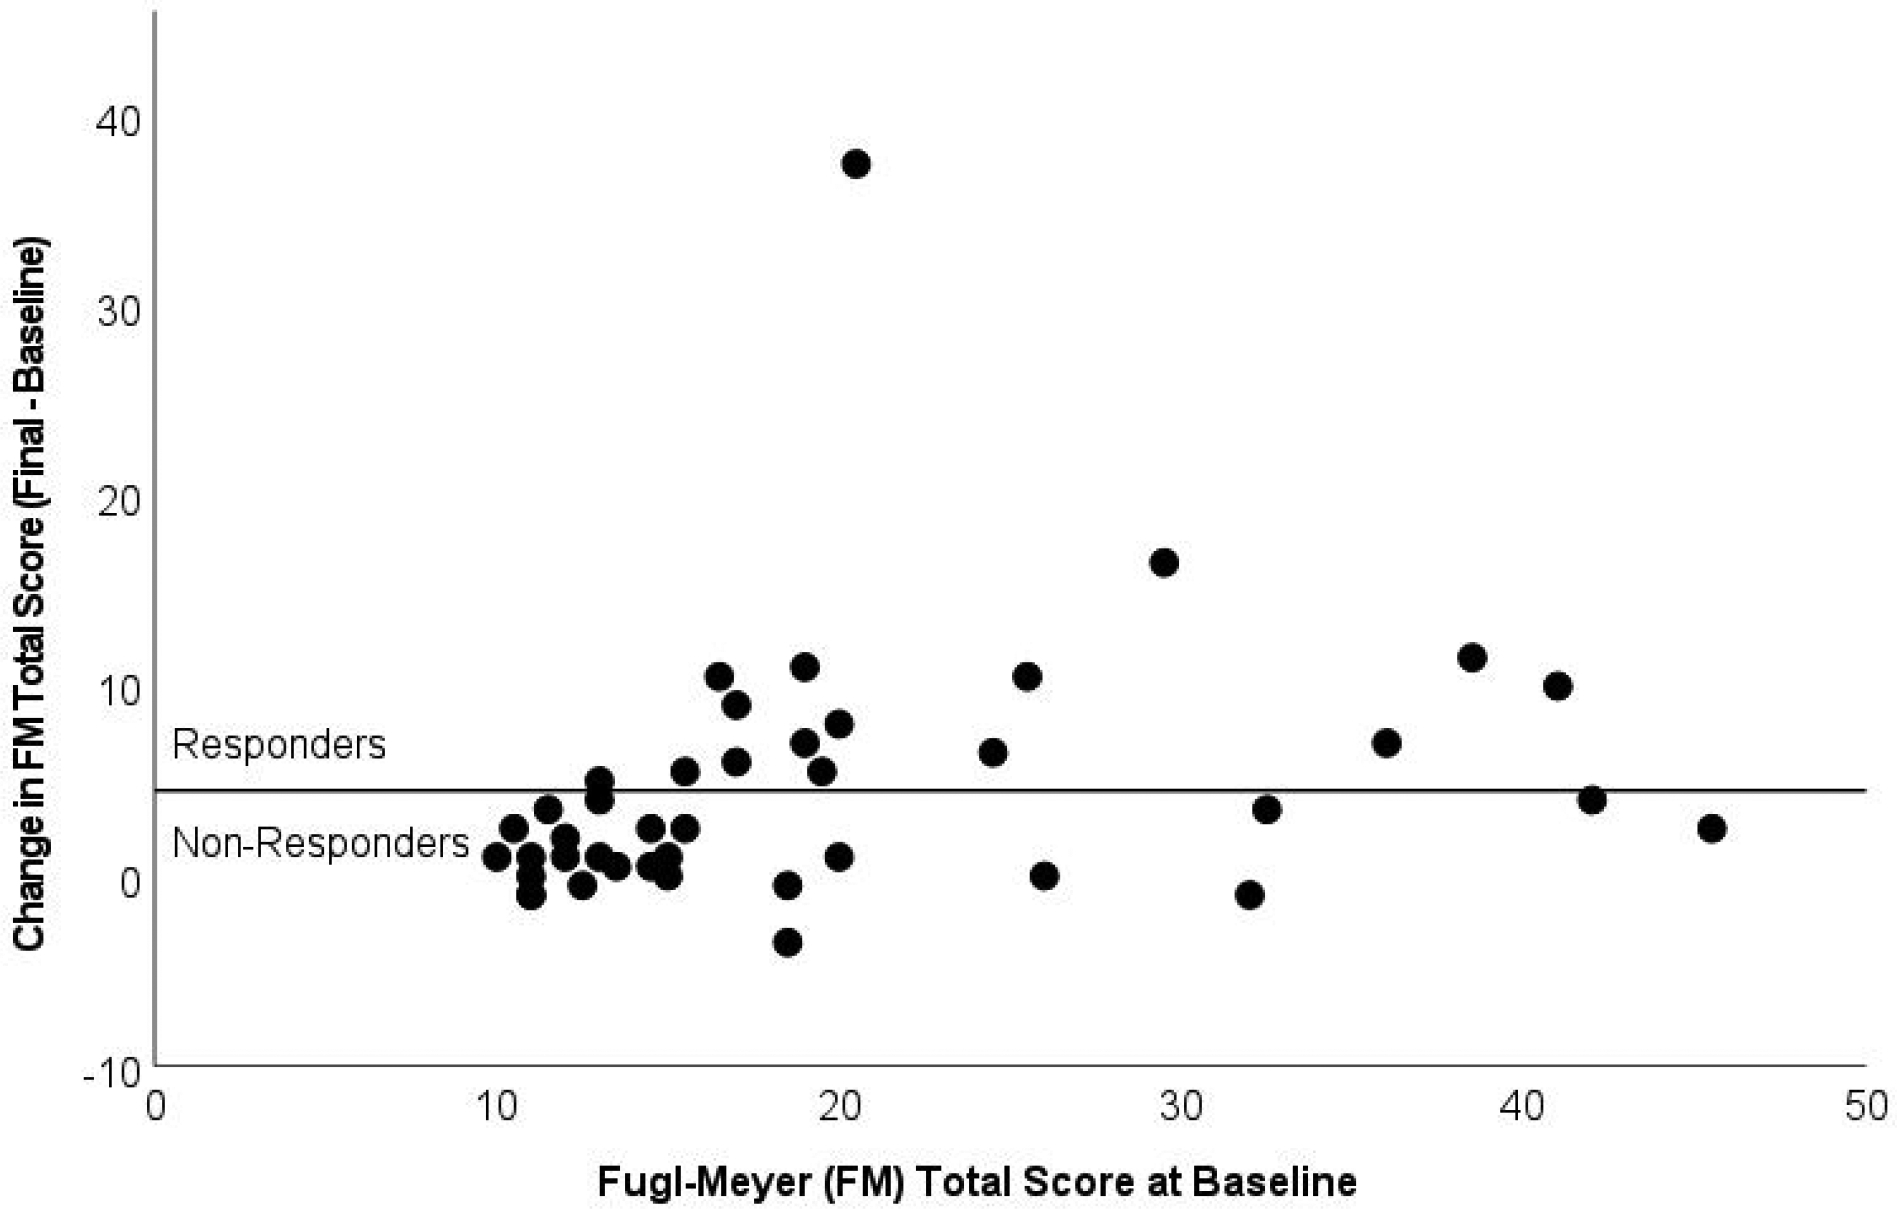
Fugl-Meyer (FM) change scores as a function of total score at Baseline. Points above the horizontal line indicate Responders (n=16) to therapy (change in FM score >= 5 points); points below the line are Non-Responders (n=26).
Assessments
Clinical arm assessments collected were the Upper Extremity Fugl-Meyer, 6-Item Wolf Motor Function Test-Time and Functional Ability, Action Research Arm Test, and strength and range of motion assessment. In addition, we created a proprioception score by summing the proprioception subsection items from the Fugl-Meyer for the paretic limb (range: 0–6). Change in score on the Fugl-Meyer from baseline to final evaluation served as the primary outcome and basis for predictive model development.
Intervention
Details of the robots, TTT, and training regimen can be found in our previous trial and methods papers23, 24. Participants completed one-hour sessions of therapy, with a target of 36 sessions, 3 times per week over 12 weeks. Participants were allowed a maximum of 18 weeks to complete all sessions. Each session had 45 minutes of robot-assisted therapy followed by 15 minutes of transition-to-task (TTT) functional arm use therapy. The first third of sessions focused on distal movements (wrist/forearm), the second on proximal movements (elbow/shoulder), and the last third of sessions alternated. The majority of participants trained on the lnMotion2 wrist robot and lnMotion2 shoulder/elbow robots (Bionik, Watertown, MA, USA), while a subset trained on the Armeo Power (Hocoma, Volketswil, Switzerland).
Neurophysiology
TMS.
As previously detailed23, paretic and non-paretic resting motor thresholds and recruitment curves were assessed for three arm muscles (FDI, ECR, AD), and neurophysiological corticospinal integrity scores (TMS score) were calculated for each side. The TMS score had the full range of values in our study population (0–9). The method by which the TMS score was derived is explained in our methods paper23.
MRI.
Lesion masks were hand-drawn on T1-MPRAGE and/or 3D FLAIR images. All lesion masks were validated by a second researcher. The primary region-of-interest was the corticospinal tract (CST). The T1-MPRAGE, 3D FLAIR, and lesion mask were co-registered using FSL FLIRT to the participant’s T2--weighted image to obtain a co-registered T2 lesion mask. The MNI152 brain and the CST template (bilaterally) from the Johns Hopkins University atlas were co-registered to each participant’s T2-image for percent CST lesion analysis. The inverse FLIRT transformation was used to convert all T2 lesion masks to MNI space for comparison of lesion size and location across participants. Lesion masks were flipped across the x-axis if necessary (n=13) such that all lesions were in the right hemisphere. For the DTI analysis, each participant’s T2 image was co-registered to their DTI b0 image. DTI analysis was performed in DSI Studio. Percent lesioned, fractional anisotropy (FA), and mean diffusivity (MD) of the CST were calculated for each participant for both affected and unaffected sides.
Genetics.
Saliva was collected using saliva collection kits (Oragene OGR-500, Ottawa, ON, Canada) at baseline evaluations. DNA was purified and genetic polymorphisms were determined by polymerase chain reaction and targeted sequencing for following genes: BDNF, COMT, dopamine transporter, and klotho. We chose these particular genetic loci because of previous demonstrations of their importance either in post-stroke recovery or neural plasticity23, 25, 26. Polymorphisms were unable to be determined from two samples; thus, sample sizes for the four genes assessed ranged from n=40 to n=42.
Analytical Plan
Prediction model.
Logistic regression models were developed on the primary binary outcome of an increase in FM of greater than or equal to five points at final evaluation, which is considered the minimal clinically important difference (MCID)27. The models of the form
were constructed where pr(Y=1) equals the probability that participant Y is classified as a Responder and Z = intercept + ∑i wi xi (i.e., Z is a linear sum of a constant intercept and the features (xi, value of the variables) weighted by the parameter estimates (wi, parameter estimates). The prediction rule is therefore defined by the inner sum of the weights wi and features xi. A sample is classified as a Responder if the sum is greater than the threshold. Variables entered into the model selection process were chosen based on prior literature demonstrating their possible relationships to stroke recovery (see Tables 1, and Supplementary Tables 1, 2, 3). Gender, ethnicity, dominant side affected, and genetic variables were dummy-coded. Models with a fixed set of predictors (3–7) were compared. We selected one model for each training set with the highest likelihood score (chi-square) statistic. The individual variables survived in the final model if they survived in 60% – 70% of the models. The individual estimates for each variable did not have to be independently predictive (i.e. p < 0.05.) Leave One Out Cross-Validation (LOOCV) and the best subset selection method in SAS were used to choose the final model. The final model with six predictors was selected based on overall fit (AUC), avoiding overfitting, and lack of significant decrease in AUC with cross validation.
Table 1.
Participant Characteristics and Outcomes
| Characteristic | All Participants (n=42) | Responders (n=16) | Non-Responders (n=26) |
|---|---|---|---|
| Demographics | |||
| Female | 15 (36%) | 8 (50%) | 7 (27%) |
| Race/Ethnicity: White (Non-Hispanic) | 19 (45%) | 4 (25%) | 15 (58%) |
| Race/Ethnicity: African-American | 23 (55%) | 12 (75%) | 11 (42%) |
| Right Hand Dominant | 35 (83%) | 12 (75%) | 23 (88%) |
| Age at Enrollment (years) | 59.8 (11.28) | 59.6 (11.25) | 60.0 (11.52) |
| Stroke Characteristics | |||
| Right Hemisphere Stroke | 26 (62%) | 11 (69%) | 15 (58%) |
| Dominant Side Affected | 21 (50%) | 9 (56%) | 12 (46%) |
| Time Since Stroke (years) | 5.4 (5.32) | 5.7 (6.36) | 5.2 (4.69) |
| Primary Outcome: Fugl-Meyer (FM) Upper Extremity Scores | |||
| FM responder (>=5 points) | 16 (38%) | --- | --- |
| Baseline Total Score | 19.8 (9.62) | 23.2 (8.61) | 17.8 (9.77) |
| Observed Range | 10.0 – 45.5 | 13.0 – 41.0 | 10.0 – 45.5 |
| Final Total Score | 24.4 (13.15) | 33.7 (12.15) | 18.8 (10.34) |
| Observed Range | 10.0 – 58.0 | 18.0 – 58.0 | 10.0 – 48.0 |
| Change Score (Final – Baseline) | +4.6 (6.76) | +10.4 (7.81) | +1.0 (1.80) |
| Observed Range | −3.5 – +37.5 | +5.0 – +37.5 | −3.5 – +4.0 |
| Secondary Outcomes | |||
| ARAT Baseline Total Score – Affected | 14.1 (14.67) | 20.8 (13.01) | 10.0 (14.36) |
| ARAT Final Total Score – Affected | 16.4 (16.57) | 24.5 (16.58) | 11.4 (14.74) |
| ARAT Change (Final – Baseline) | +2.2 (4.29) | +3.8 (5.83) | +1.3 (2.73) |
| Wolf Function Baseline Score | 1.7 (0.89) | 2.2 (0.78) | 1.4 (0.84) |
| Wolf Function Final Score | 2.0 (1.13) | 2.6 (1.12) | 1.6 (0.93) |
| Wolf Change (Final – Baseline) | +0.3 (0.47) | +0.5 (0.60) | +0.1 (0.32) |
Note. Values indicate counts (and percentages) or means (and standard deviations).
There are concerns when fitting a model with a large number of covariates and modest sample size. These concerns include overfitting to the dataset, co-linearity between variables, and limited applicability of the model. By controlling the number of variables selected for the model and employing internal validation, we aim to keep the model manageable so it could be more clinically useful, while also decreasing the potential for overfitting. The Leave One Out Cross-Validation (LOOCV) approach has the advantages of producing model estimates with less bias and more ease in smaller samples28. To create the leave-one-out training sets, the SAS Surveyselect procedure was used for creating 42 independent replicates of the original data set. Individual observations are systematically removed from each of the sets, creating a training set and testing set. There was one missing value of baseline paretic dynamometry, for which we imputed the sample median. We performed the variable selection on training sets 1 through 42, using a logistic model and the best subset selection method in SAS. This selection method allowed us to control the number of variables we wished to include in the model (typically 4–6 variables). The macro was written to select one model for each training set with the highest likelihood score (chi-square) statistic, based on the number of variables. The variables most frequently selected across training sets were then included in the final predictive model; typically, a variable was selected if it was in 60% – 70% of the models. The leave-one-out procedure was repeated for cross-validation of the predictive model, by calculating the individual predicted probability of each response level and re-estimating the parameter estimates. The summary statistics of the area under the receiver operating characteristic curve (AUROC) were calculated to measure prediction performance and to compare the logistic model and that generated by the cross-validation procedure.
Results
Screening and enrollment into the study is shown in Figure 1. The majority of participants were screened and enrolled at the Baltimore site. Of the 68 participants who consented to the study, 42 completed the principal outcome measures, withdrawals being due to either meeting exclusion criteria or scheduling and transportation issues. Thirty-eight participants completed the intervention sessions on the IMT robots, and four participants on the Armeo Power robot with 38 completing the 24-week follow up. Because of additional exclusions for TMS and MRI, or inability to tolerate those methods, not all participants completed those measures and were excluded from analysis that required them. N=37 participants had MRI sessions, n=34 had TMS sessions. Outcome measures showed mean improvement (± standard error) on the FM of 4.6±1.0 (Table 1), on the ARAT of 2.2±0.67, and the Short WMFT-FAS of 0.3±0.05. Thus, the intervention had the expected mean effect, based on our experience with this intervention in a previous study. Of the 42 participants who completed the primary outcome assessments, 16 (38%) were responders by the criterion of at least a 5-point increase in Fugl-Meyer (Table 1), as defined prior to the study23.
Figure 1.
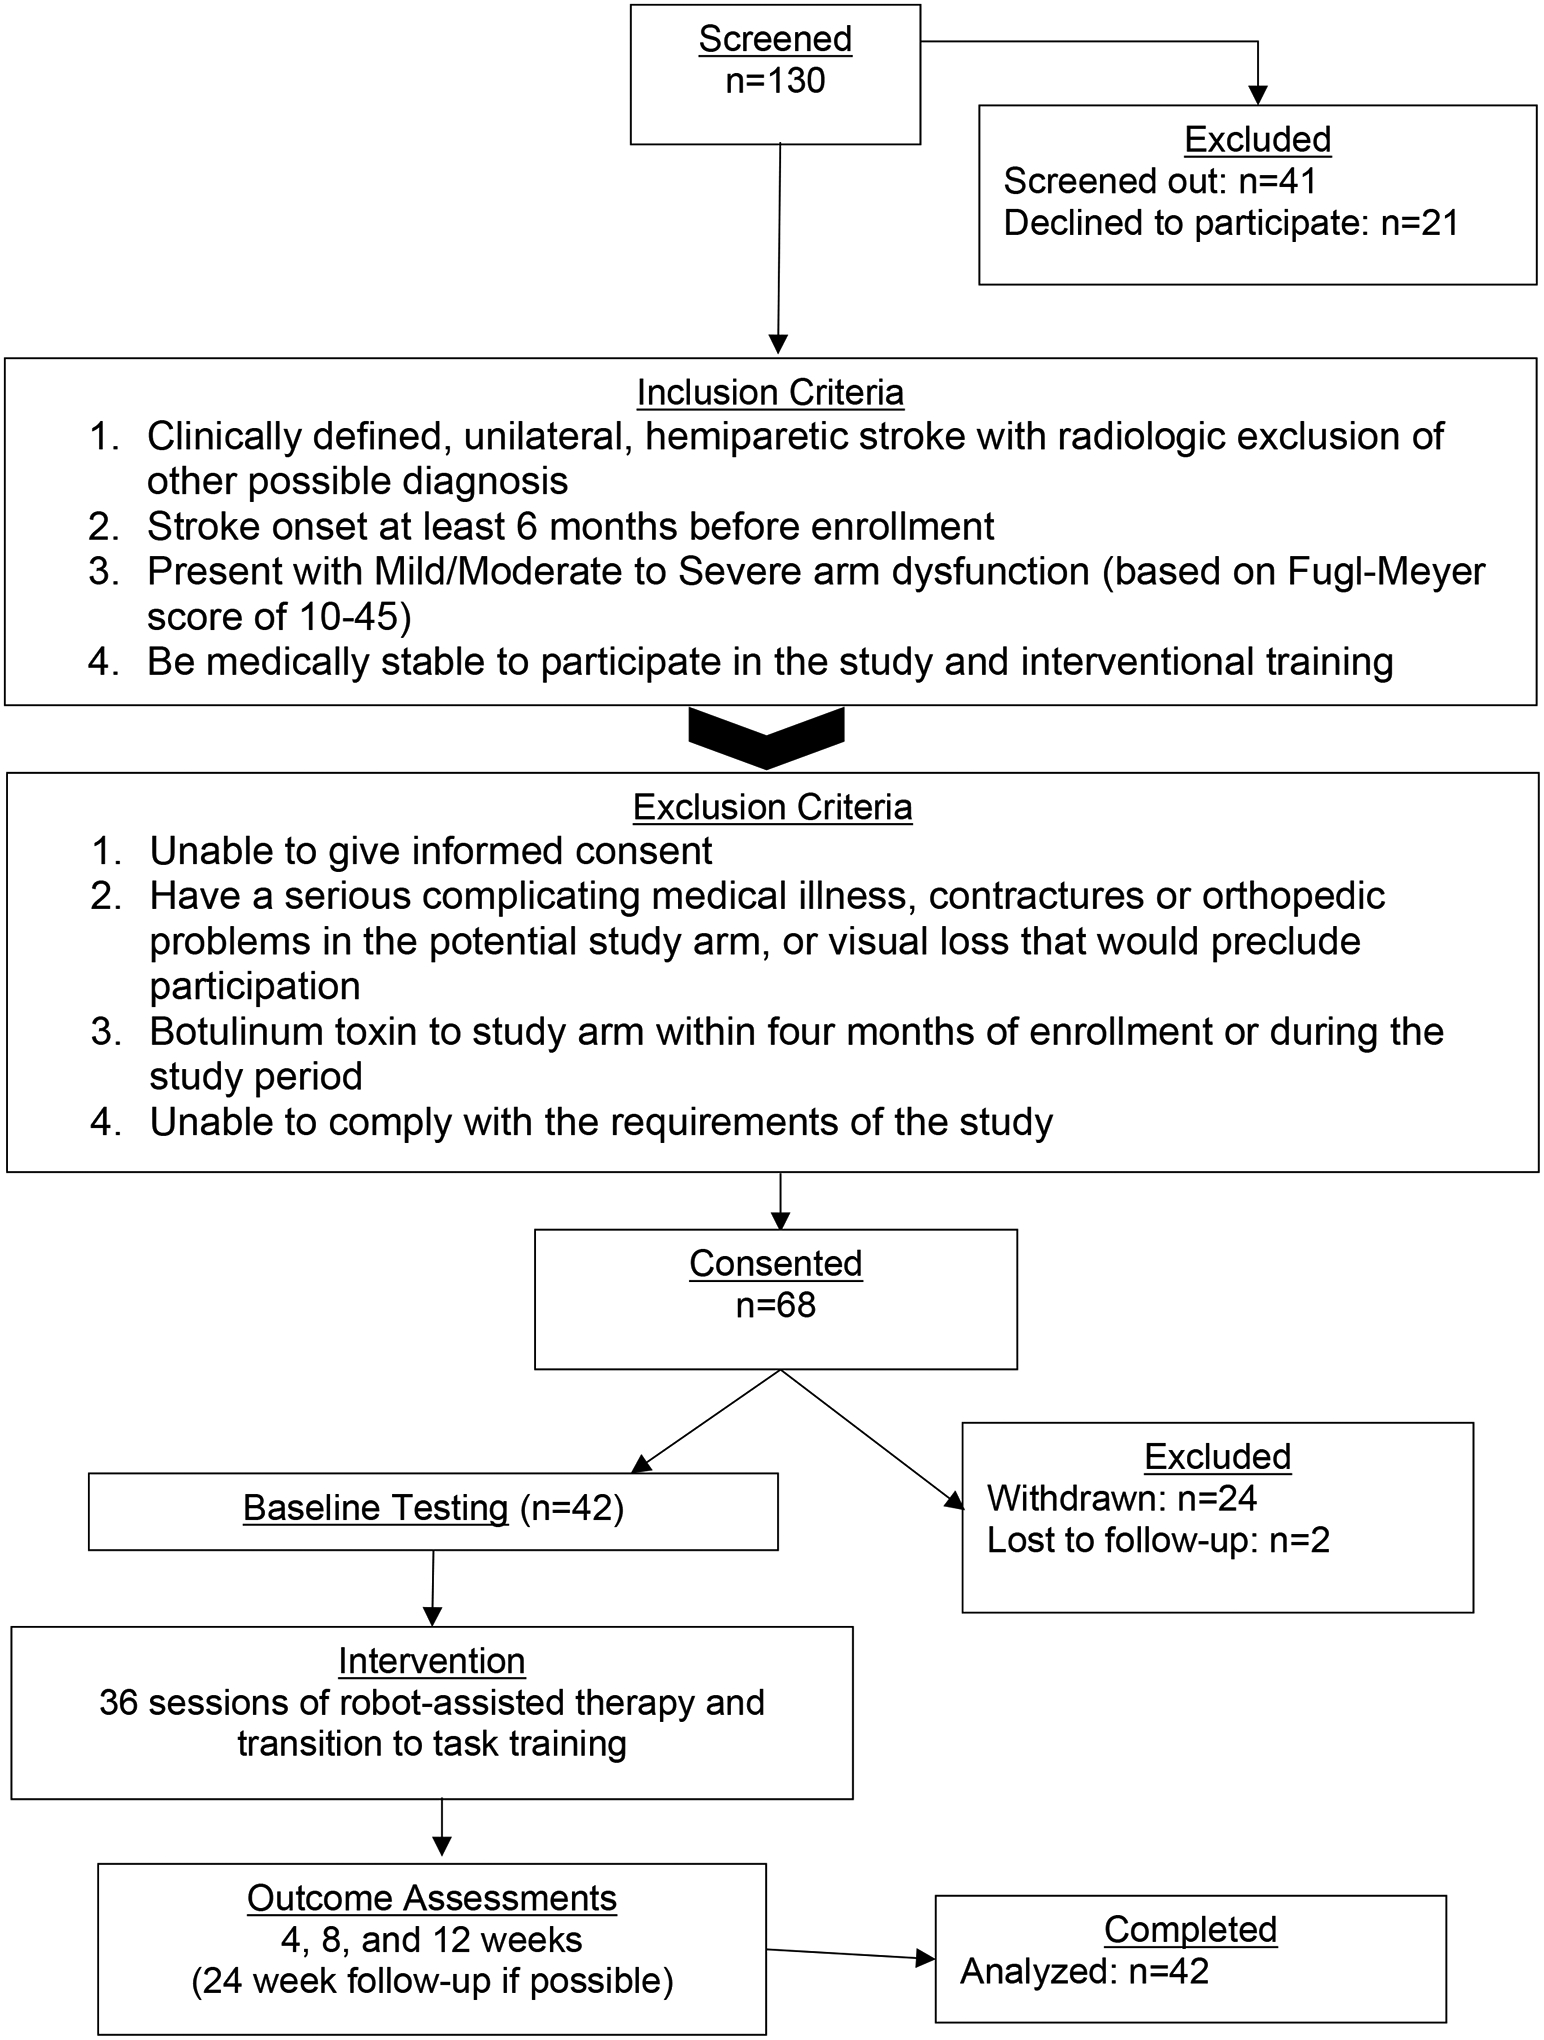
Study flow (consolidated standards of reporting trials diagram).
Predictive Model
Following the predictive model selection process, the final model predicted response to therapy based on the following variables, with the variable followed in parenthesis by the values that predicted response to the intervention: 1. side affected (non-dominant), 2. time since stroke (greater time), 3. FM proprioception score (higher score), 4. Wolf average time (shorter time), 5. paretic hand grip strength (lower strength), and 6. klotho SNP (homozygosity). These variables were consistently selected across a large percentage of the training datasets (see Table 2). The AIC for the model was 24.92 and the −2log likelihood was 10.92. An ROC curve was constructed (Figure 3), resulting in AUC=0.988 (Std Error = 0.011, 95% Wald confidence limits: 0.967 – 1). Parameter estimates for the individual predictors are given in Table 2. Note that the baseline total FM score did not survive the model selection process.
Table 2.
Parameter estimates from the predictive model. The best subset selection method in SAS was used to select predictors using leave-one-out training sets. The final column indicates the percent of training sets in which each predictor was selected. A positive parameter estimate means that a higher value of the variable is associated with response to treatment. Note that parameter estimates are used to weight the baseline parameters, and so can be outside the range of the parameter values. The values of the parameters that predict response are: non-dominant side affected, longer time since stroke, better proprioception, shorter Wolf time, lesser grip strength, and Klotho homozygosity.
| Baseline Parameter | Estimate | Std. Error | Wald X2 | p-value | % Selected |
|---|---|---|---|---|---|
| Intercept | 11.28 | 8.69 | 1.68 | 0.19 | --- |
| Dominant Side Affected (= 1) | −5.26 | 3.10 | 2.88 | 0.09 | 88 |
| Time Since Stroke (yrs) | 0.44 | 0.28 | 2.52 | 0.11 | 90 |
| FM - Proprioception | 2.89 | 1.76 | 2.71 | 0.10 | 100 |
| Wolf Motor Function – Time (s) | −0.22 | 0.09 | 5.11 | 0.02 | 100 |
| Paretic Grip Strength (kgF) | −0.62 | 0.27 | 5.08 | 0.02 | 100 |
| Klotho SNP (heterozygous = 1) | −12.09 | 6.21 | 3.78 | 0.05 | 88 |
Figure 3.
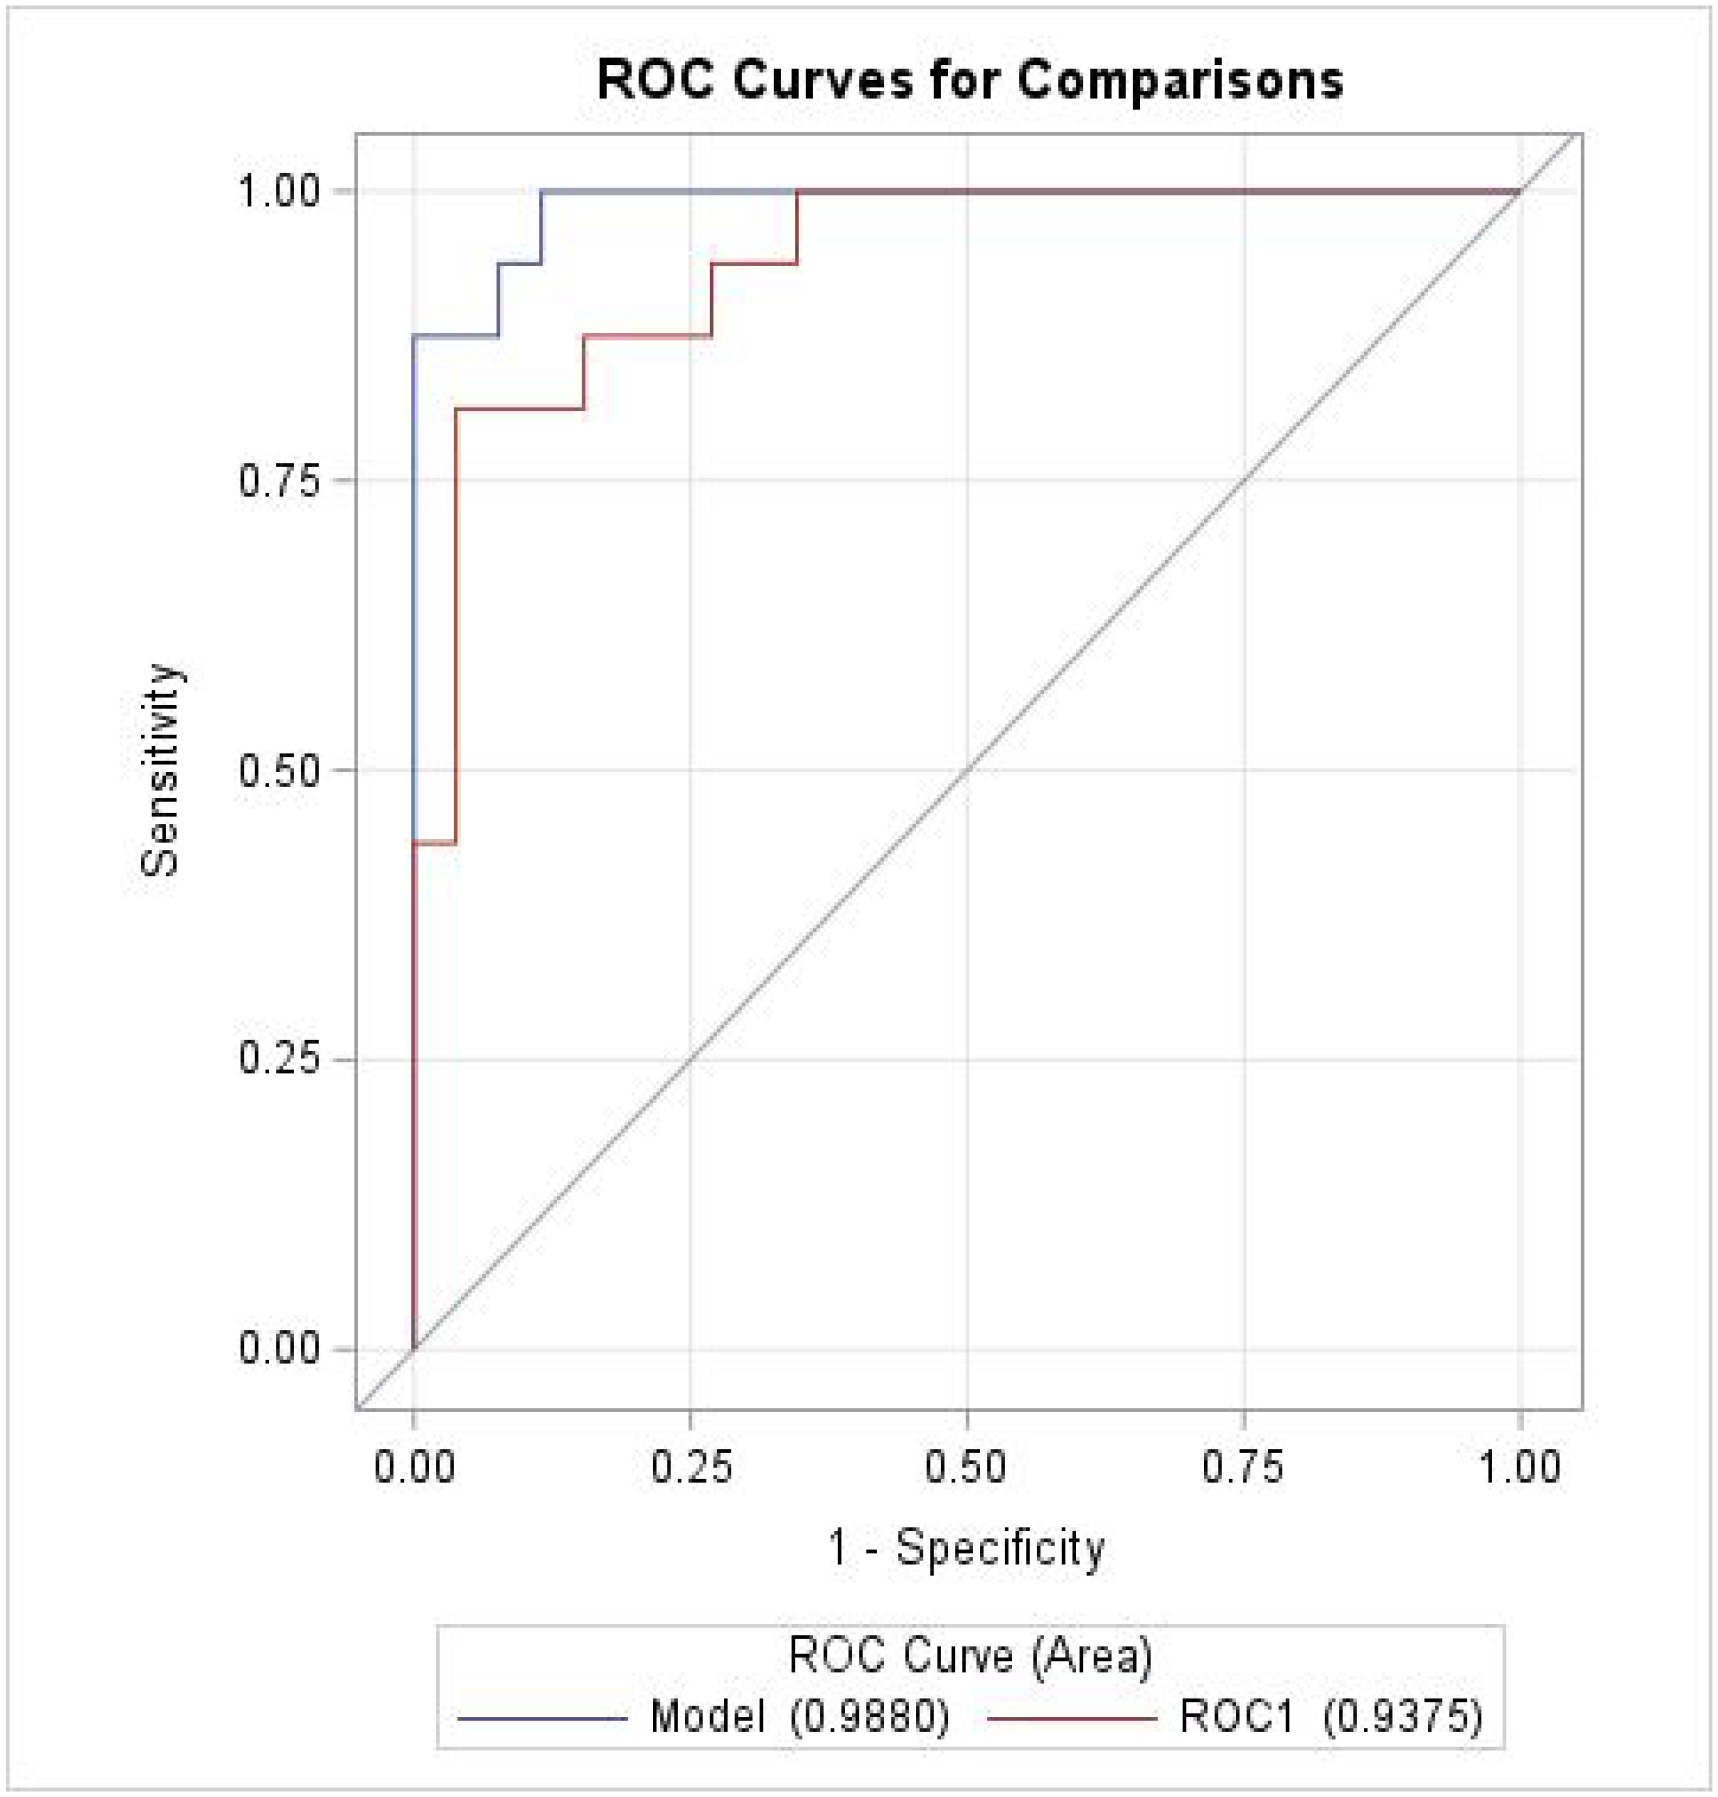
ROC curves for the final predictive model (Model) and cross-validation (ROC1).
The cross validated individual predicted probability of each response level was then derived from the leave-one-out principle—that is, dropping the data of one subject and re-estimating the parameter estimates. AUC estimate based on cross validated predicted probabilities was AUC=0.938 (Std Error = 0.035, 95% Wald confidence limits: 0.868 – 1, see Figure 3). A contrast test comparing the AUCs showed that the AUC drop with cross-validation did not reach statistical significance (difference = 0.050, X2=3.63, p=0.06).
Biological Variables
None of the neurophysiological variables were retained as predictors in the predictive models. Thus, we conducted post hoc investigations of these variables to examine whether there were any differences between responders and non-responders.
TMS and relationship to disability.
The TMS score had a mean value of 2.4 overall and was only slightly higher (3.0) in the responders. The TMS score was correlated with the baseline Fugl-Meyer (r = .81, r2 = 0.65, p < 0.001, n=34) but not the change in Fugl-Meyer (p=.10).
Genotype distribution
There were very few of the BDNF met alleles (T), likely because the Black population was highly represented in this study. The other genotypes had three levels represented. The klotho genotype was selected for the predictive model, as 86% of non-responders, but only 14% of responders, were klotho heterozygotes. This difference was significant (Fisher’s exact test, p = 0.04) and the genotype ended up in the final, selected model.
MRI.
Overall, responders tended to show less structural damage than non-responders (Supplemental Table 3); however, these differences were not significant (lesion volume, p=.17; percent of CST lesioned, p=.22). Lesion overlap maps were constructed separately for responders and non-responders and displayed (Figure 4). While, as expected, the non-responder lesion mask extended further than that for responders, the majority of lesion overlap were similarly located in deep white matter motor tracts.
Figure 4.
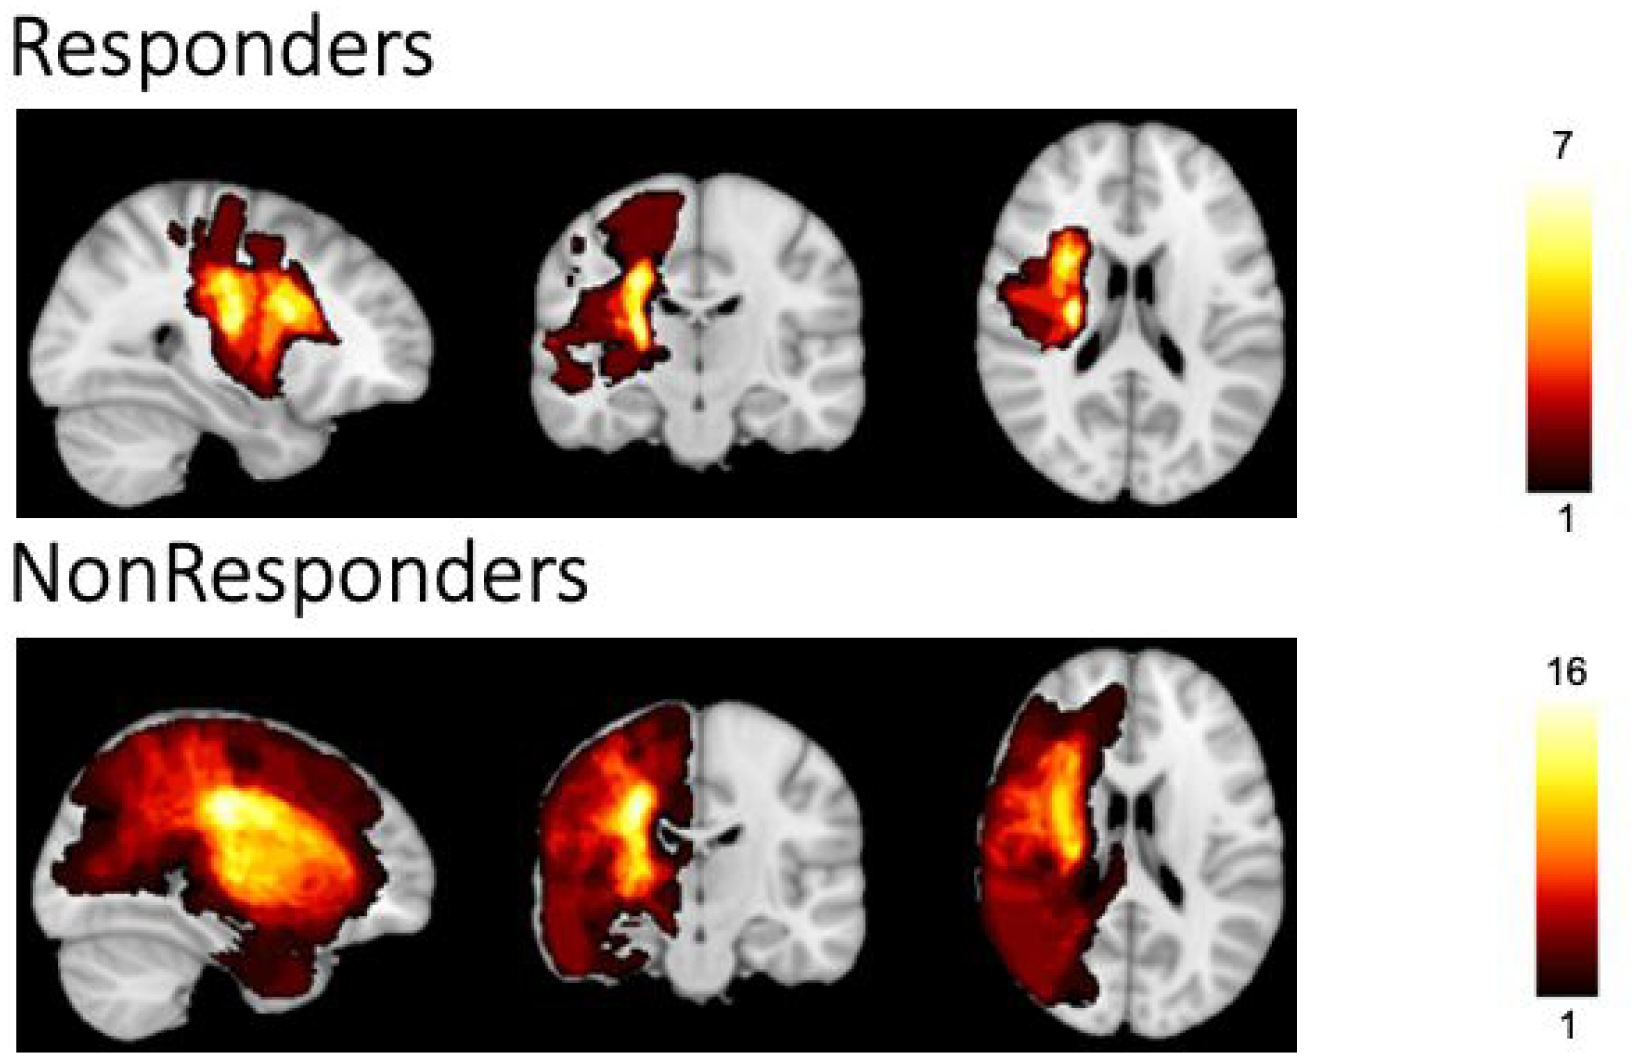
Extent of lesions across participants. Responders (n=14) are displayed on the top, Non-Responders (n=23) on the bottom; all images were flipped to show lesions in the Left hemisphere. The heat map demonstrates lesion-affected-voxels shared in the range from 1 participant to the maximum number of participants that shared that voxel with the range being 1–7 in Responders and 1–16 in Non-Responders. Notably, both groups had significant overlap of lesions within the deep motor white matter of the affected hemisphere.
Pain, Expectancy, and Robot type results
Pain scores revealed only minor levels of pain across the whole population of participants in the trial. Expectancy regarding the likelihood of the intervention being successful was variable, with no significant predictive power regarding the actual outcome in our final models. As only four participants had therapy with a second robot type, there was no statistical power to detect a difference in response to robot type.
Discussion
The goal of the study was to discover baseline factors that predict clinically meaningful improvement in the FM:UE score. We found that baseline values of non-dominant paresis, greater time since stroke, weaker paretic limb strength, homozygous klotho genotype, higher FM proprioception score, and shorter Wolf motor function times, together formed a sensitive and specific predictive model of response to 3 months of combined robot-assisted and repetitive-task-training as measured by improvement in FM score.
Strengths and weaknesses of the model
Our model applies to long-term chronic stroke survivors who are an increasingly larger segment of the population29 and for whom we now know that not only maintenance of function, but actual motor recovery is possible long after the initial insult30. Furthermore, although we do not yet know whether this model would generalize to other types of training, the use of a robot that targeted multiple joint functions in addition to intensive therapist-led functional task training will likely simulate many current training methods that rely on intensive graded training such as the GRASP program31 or Constraint-induced Therapy32.
A major advantage of our specific prediction model is the relative ease with which the factors in the model can be collected. In addition to collecting two personal characteristics and one genomic test, there are only two short motor tests and one sensory test to administer. Even with rest periods the total time for data collection would be less than an hour making this a very efficient method of predicting success for repetitive task training regimens in chronic stroke. The training to administer these tests would be far less time-consuming compared to the training necessary to collect neurophysiological or imaging data. The genomic testing, while not burdensome in terms of sample collection, could present a barrier because of test availability. In preliminary analysis, klotho genotype was correlated with grip strength, which appeared as a predictor in some of our earlier models. Further analysis is required to determine whether genotyping can be replaced with other measures.
In the final model, two factors with positive predictive value were shorter Wolf times and better proprioception. There is evidence of proprioceptive ability as a correlate of outcome in robotic rehabilitation33 and this makes sense as an ability that allows feedback of performance. One would expect that the ability to integrate the combination of self-directed and externally applied forces to achieve motor goals would depend on proprioceptive feedback. Since Wolf Motor Function-Time skews higher when participants cannot perform the tasks at all, the intervention in this study may have a functional threshold above which a patient must start in order to benefit. However, other positive predictive factors such as non-dominant paresis, greater time since stroke, and lower paretic grip strength may indicate that above such a threshold, impairment34 can by reversed by repetitive task practice.
Limitations
Sample size.
We were fortunate in enrolling a diverse population on factors such as initial impairment scores, sex, and age distribution. However, BDNF polymorphism was not well-represented, reducing the power to estimate the effect of this variable in the model. In some cases, our power to detect relationships among the neurophysiological variables was hampered by low variability in our sample. The completed sample size was about half of that which was planned, mainly due to recruitment and capacity issues. This limited our ability to generalize the model outside of the population that was used to estimate model parameters. For example, while Responders were observed across most of the range of baseline FM scores (Table 1, Figure 2, and Sup. Fig. 1), we cannot exclude that the relationship between the baseline and change scores is non-linear.
Risk of Overfitting the data.
The problem of overfitting this modest-sized data set is a concern. Validation and refinement of the models using new populations is critical to the practical application of a predictive method. Other approaches, such as random forest decision trees35, 36 may provide a path to a practical predictive method.
The large variability of recovery in the chronic stroke population poses a challenge to the generalizability of response to any form of rehabilitative therapy, including repetitive task practice. Because the treatment in this study was a hybrid of robotic and therapist-provided treatment, our expectation is that the results are generalizable. There is no reason to expect a special responsiveness to a particular form of robotic task practice.
The role of biomarkers
The examination of biomarkers or surrogate indicators of the post-stroke state should provide a window into recovery potential15–17 but in our study these variables did not make it into the model despite recent advances in neuroimaging and neurophysiology techniques that provide new methods for examining brain structure and connectivity for possible biomarkers. For example, prior work has correlated changes in resting state connectivity on functional magnetic resonance imaging (fMRI) with motor recovery during robot-assisted therapy37, and diffusion tensor imaging (DTI) has been used to demonstrate a relationship between degree of damage in the corticospinal tract and impairment38. In concert with neurophysiology, genetic factors are likely to have an influence on central nervous system responses to motor experience39 and have been suggested to impact recovery after stroke40.. Recently, genetic variants in BDNF were shown to be associated with motor outcomes for the arm and were predictors for patients with severe baseline motor deficits in the sub-acute phase of recovery41. The klotho haplotypes KL and VS represent a set of six polymorphisms in linkage disequilibrium. In numerous studies the heterozygous genotype KL-VS is associated with longer lifespan and higher circulating levels of the gene product. We can only speculate why the homozygous (KL-KL) genotype was associated with response. It could be that the heterozygotes are better able to reduce impairment and maintain that improvement with usual care. Since exercise is related to klotho secretion42 and the heterozygotes have higher baseline levels of secretion, a physical activity intervention such as ours may be more beneficial when baseline secretion is low.
Cramer, et al43 found that greater values of ipsilesional brain activity on functional MRI and baseline Fugl-Meyer score predicted response to standard distal arm therapy combined with brain stimulation. In a study of robot-assisted arm therapy, multiple baseline clinical, demographic, and neuroimaging variables were entered into multivariate modeling and found that baseline primary motor cortical functional connectivity and less cortico-spinal damage predicted response44. In a slightly less chronic sample (2months-1.5years post stroke), Cassidy et al. found less corticospinal damage predicted response to intensive arm training45. These studies all had participants who were, on average, slightly less impaired than ours, and primarily studied single clinical measures of impairment/function alongside neuroimaging markers. Tozlu, et al. used multiple machine learning algorithms and identified baseline impairment and baseline presence of motor evoked potentials to predict response to a rehabilitation and brain stimulation intervention, however again they did not input many baseline clinical characteristics into their model production36. Our final model did not include any biomarkers derived from the neurophysiology or neuroanatomy. This could be partly due to our sample size, but there may be other brain anatomy biomarkers, such as grey matter volume outside of the lesioned area, that have a greater effect on response to the intervention46. It may also be that the biomarkers are correlated with the observational measures but are less accurate regarding prediction. Similarly to our approach, George et al. have used neural networks to examine multiple baseline characteristics to predict response to multiple therapeutic interventions and found that a different dimension of the Wolf Motor Function test (in their case, functional ability score, in ours, time) predicted response to therapy47, 48. We extend upon these findings here using multivariate analysis on multiple clinical measures that are not directly related to each other, to predict response on a different measure, also including biomarkers from imaging, neurophysiology, and genomics.
Pain & Expectancy
Pain is an underrecognized consequence of stroke49, and pain behaviors may limit participation in rehabilitative therapies, suggesting pain’s potential predictive role in outcome and participation. However, pain was not common in this population, potentially because of self-selection for an intensive rehabilitation intervention, and seemingly had no influence on outcome. The expectancy theory of motivation to predict outcomes in stroke rehabilitation is an additional area of increasing interest50. While the final model did not include expectancy, there were more responders than non-responders with high expectancy values and this deserves further exploration.
Future directions: validation and opportunities
Future work should address some limitations discussed here as well as validation of the model developed. Since the prediction model has been cross-validated, the logical next step would be an independent validation. This could be done with some simplification of approach since imaging and TMS parameters were not significant predictors. A validation trial also provides an opportunity to investigate the mechanisms of response and non-response. This would require different approaches for the demographic, stroke-laterality, genetic, and functional measures.
Future directions may explore the utility of improving measures of motor function rather than impairment. We plan to present in future publications the results of planned analyses for predicting function as measured by the Arm Research Action Test and patient reported outcomes, such as recorded by the Stroke Impact Scale. The widespread use of the FM assessment and its position along the continuum between precision of measurement and functional relevance made it the most reasonable starting point for prediction. Although the FM is highly correlated with more functional measures such as the WMFT and ARAT51, other studies have shown that other indicators of motor recovery such as smoothness of movement can improve significantly without recording a change in FM score52. A validation trial would also be an opportunity to increase the sample size, which could offer the power necessary to predict a continuous outcome, rather than a binary one.
Summary
Entering baseline scores into logistic regression testing resulted in a highly accurate, specific, and internally validated mode to predict response to therapy, considering the moderate sample size. Predictors of response to the treatment included stroke demographic factors, functional and ability measures, and genotype. Longer time since stroke, non-dominant side affected, better proprioception, faster timed functional movements, lower grip strength, and klotho homozygosity had positive predictive value. This simple algorithm accurately predicted response to an outpatient intensive practice intervention in chronic stroke and has the potential to better match patients in the chronic phase to effective therapy based on their individual characteristics and behavioral capabilities.
Supplementary Material
Acknowledgements
This study was supported by Merit Review Award I01 RX001667 and RR&D Center Award I50 RX002019 from the United States Department of Veterans Affairs and the Rehabilitation Research and Development Program. The contents do not represent the views of the U.S. Department of Veterans Affairs or the United States Government. We are grateful for the assistance of Jaime Lush, Luana Colloca, Braxton Mitchell, and Gina McKernan.
Footnotes
Clinicaltrials.gov identifier: NCT02658630
Conflict of Interest Statement
The authors declare that there is no conflict of interest. Dr. Wittenberg was on a Clinical Advisory Board for the Battelle Memorial Foundation, and currently for Myomo, Inc. Both companies are involved in rehabilitation technology with general relevance to this study but none of that technology was used.
References
- 1.Benjamin EJ, Blaha MJ, Chiuve SE, et al. Heart Disease and Stroke Statistics-2017 Update: A Report From the American Heart Association. Circulation. Mar 7 2017;135(10):e146–e603. doi: 10.1161/CIR.0000000000000485 [DOI] [PMC free article] [PubMed] [Google Scholar]
- 2.Bejot Y, Delpont B, Giroud M. Rising Stroke Incidence in Young Adults: More Epidemiological Evidence, More Questions to Be Answered. J Am Heart Assoc. May 11 2016;5(5)doi: 10.1161/JAHA.116.003661 [DOI] [PMC free article] [PubMed] [Google Scholar]
- 3.Ramirez L, Kim-Tenser MA, Sanossian N, et al. Trends in Acute Ischemic Stroke Hospitalizations in the United States. J Am Heart Assoc. May 11 2016;5(5)doi: 10.1161/JAHA.116.003233 [DOI] [PMC free article] [PubMed] [Google Scholar]
- 4.Avula A, Nalleballe K, Narula N, et al. COVID-19 presenting as stroke. Brain Behav Immun. Apr 28 2020;doi: 10.1016/j.bbi.2020.04.077 [DOI] [PMC free article] [PubMed] [Google Scholar]
- 5.Hess DC, Eldahshan W, Rutkowski E. COVID-19-Related Stroke. Transl Stroke Res. May 7 2020;doi: 10.1007/s12975-020-00818-9 [DOI] [PMC free article] [PubMed] [Google Scholar]
- 6.Qin C, Zhou L, Hu Z, et al. Clinical Characteristics and Outcomes of COVID-19 Patients With a History of Stroke in Wuhan, China. Stroke. May 29 2020:STROKEAHA120030365. doi: 10.1161/STROKEAHA.120.030365 [DOI] [PMC free article] [PubMed] [Google Scholar]
- 7.Murray CJ, Atkinson C, Bhalla K, et al. The state of US health, 1990–2010: burden of diseases, injuries, and risk factors. JAMA. Aug 14 2013;310(6):591–608. doi: 10.1001/jama.2013.13805 [DOI] [PMC free article] [PubMed] [Google Scholar]
- 8.Hatem SM, Saussez G, Della Faille M, et al. Rehabilitation of Motor Function after Stroke: A Multiple Systematic Review Focused on Techniques to Stimulate Upper Extremity Recovery. Front Hum Neurosci. 2016;10:442. doi: 10.3389/fnhum.2016.00442 [DOI] [PMC free article] [PubMed] [Google Scholar]
- 9.Wyller T, Sveen U, Sodring K, Pettersen A, Bautz-Holter E. Subjective well-being one year after stroke. Clin Rehabil. May 1997;11(2):139–45. [DOI] [PubMed] [Google Scholar]
- 10.Nichols-Larsen DS, Clark PC, Zeringue A, Greenspan A, Blanton S. Factors influencing stroke survivors’ quality of life during subacute recovery. Stroke. Jul 2005;36(7):1480–4. doi: 10.1161/01.STR.0000170706.13595.4f [DOI] [PubMed] [Google Scholar]
- 11.Sterr A, Freivogel S, Schmalohr D. Neurobehavioral aspects of recovery: assessment of the learned nonuse phenomenon in hemiparetic adolescents. Arch Phys Med Rehabil. Dec 2002;83(12):1726–31. doi: 10.1053/apmr.2002.35660 [DOI] [PubMed] [Google Scholar]
- 12.Wolf S, Winstein C, Miller J, et al. Effect of constraint-induced movement therapy on upper extremity function 3 to 9 months after stroke: the EXCITE randomized clinical trial. JAMA. Nov 1 2006;296(17):2095–104. doi: 10.1001/jama.296.17.2095 [DOI] [PubMed] [Google Scholar]
- 13.Lo A, Guarino P, Richards L, et al. Robot-assisted therapy for long-term upper-limb impairment after stroke. N Engl J Med. May 13 2010;362(19):1772–83. doi: 10.1056/NEJMoa0911341 [DOI] [PMC free article] [PubMed] [Google Scholar]
- 14.Winstein CJ, Wolf SL, Dromerick AW, et al. Effect of a Task-Oriented Rehabilitation Program on Upper Extremity Recovery Following Motor Stroke: The ICARE Randomized Clinical Trial. JAMA. Feb 9 2016;315(6):571–81. doi: 10.1001/jama.2016.0276 [DOI] [PMC free article] [PubMed] [Google Scholar]
- 15.Rapisarda G, Bastings E, de Noordhout AM, Pennisi G, Delwaide PJ. Can motor recovery in stroke patients be predicted by early transcranial magnetic stimulation? Stroke. Dec 1996;27(12):2191–6. [DOI] [PubMed] [Google Scholar]
- 16.Escudero JV, Sancho J, Bautista D, Escudero M, Lopez-Trigo J. Prognostic value of motor evoked potential obtained by transcranial magnetic brain stimulation in motor function recovery in patients with acute ischemic stroke. Stroke. Sep 1998;29(9):1854–9. [DOI] [PubMed] [Google Scholar]
- 17.Cruz Martinez A, Tejada J, Diez Tejedor E. Motor hand recovery after stroke. Prognostic yield of early transcranial magnetic stimulation. Electromyogr Clin Neurophysiol. Oct-Dec 1999;39(7):405–10. [PubMed] [Google Scholar]
- 18.Hayward KS, Neva JL, Mang CS, et al. Interhemispheric Pathways Are Important for Motor Outcome in Individuals with Chronic and Severe Upper Limb Impairment Post Stroke. Neural Plast. 2017;2017:4281532. doi: 10.1155/2017/4281532 [DOI] [PMC free article] [PubMed] [Google Scholar]
- 19.Stinear CM, Byblow WD, Ward SH. An update on predicting motor recovery after stroke. Ann Phys Rehabil Med. Nov 2014;57(8):489–498. doi: 10.1016/j.rehab.2014.08.006 [DOI] [PubMed] [Google Scholar]
- 20.Stinear CM, Barber PA, Smale PR, Coxon JP, Fleming MK, Byblow WD. Functional potential in chronic stroke patients depends on corticospinal tract integrity. Brain. Jan 2007;130(Pt 1):170–80. doi: 10.1093/brain/awl333 [DOI] [PubMed] [Google Scholar]
- 21.Ingemanson ML, Rowe JR, Chan V, Wolbrecht ET, Reinkensmeyer DJ, Cramer SC. Somatosensory system integrity explains differences in treatment response after stroke. Neurology. Mar 5 2019;92(10):e1098–e1108. doi: 10.1212/WNL.0000000000007041 [DOI] [PMC free article] [PubMed] [Google Scholar]
- 22.Wu X, Guarino P, Lo AC, Peduzzi P, Wininger M. Long-term Effectiveness of Intensive Therapy in Chronic Stroke. Neurorehabil Neural Repair. Jul 2016;30(6):583–90. doi: 10.1177/1545968315608448 [DOI] [PubMed] [Google Scholar]
- 23.Harcum S, Conroy SS, Boos A, et al. Methods for an Investigation of Neurophysiological and Kinematic Predictors of Response to Upper Extremity Repetitive Task Practice in Chronic Stroke. Arch Rehabil Res Clin Transl. Dec 2019;1(3–4)doi: 10.1016/j.arrct.2019.100024 [DOI] [PMC free article] [PubMed] [Google Scholar]
- 24.Conroy SS, Wittenberg GF, Krebs HI, Zhan M, Bever CT, Whitall J. Robot-Assisted Arm Training in Chronic Stroke: Addition of Transition-to-Task Practice. Neurorehabil Neural Repair. Sep 2019;33(9):751–761. doi: 10.1177/1545968319862558 [DOI] [PubMed] [Google Scholar]
- 25.Cramer SC, Procaccio V. Correlation between genetic polymorphisms and stroke recovery: analysis of the GAIN Americas and GAIN International Studies. European journal of neurology : the official journal of the European Federation of Neurological Societies. May 2012;19(5):718–24. doi: 10.1111/j.1468-1331.2011.03615.x [DOI] [PubMed] [Google Scholar]
- 26.Ho WY, Navakkode S, Liu F, Soong TW, Ling SC. Deregulated expression of a longevity gene, Klotho, in the C9orf72 deletion mice with impaired synaptic plasticity and adult hippocampal neurogenesis. Acta Neuropathol Commun. Sep 4 2020;8(1):155. doi: 10.1186/s40478-020-01030-4 [DOI] [PMC free article] [PubMed] [Google Scholar]
- 27.Page S, Fulk G, Boyne P. Clinically important differences for the upper-extremity Fugl-Meyer Scale in people with minimal to moderate impairment due to chronic stroke. Phys Ther. Jun 2012;92(6):791–8. doi: 10.2522/ptj.20110009 [DOI] [PubMed] [Google Scholar]
- 28.Rushing C, Bulusu A, Hurwitz HI, Nixon AB, Pang H. A leave-one-out cross-validation SAS macro for the identification of markers associated with survival. Comput Biol Med. Feb 2015;57:123–9. doi: 10.1016/j.compbiomed.2014.11.015 [DOI] [PMC free article] [PubMed] [Google Scholar]
- 29.Wafa HA, Wolfe CDA, Emmett E, Roth GA, Johnson CO, Wang Y. Burden of Stroke in Europe: Thirty-Year Projections of Incidence, Prevalence, Deaths, and Disability-Adjusted Life Years. Stroke. Aug 2020;51(8):2418–2427. doi: 10.1161/STROKEAHA.120.029606 [DOI] [PMC free article] [PubMed] [Google Scholar]
- 30.Teasell R, Mehta S, Pereira S, et al. Time to rethink long-term rehabilitation management of stroke patients. Top Stroke Rehabil. Nov-Dec 2012;19(6):457–62. doi: 10.1310/tsr1906-457 [DOI] [PubMed] [Google Scholar]
- 31.Yang CL, Bird ML, Eng JJ. Implementation and Evaluation of the Graded Repetitive Arm Supplementary Program (GRASP) for People With Stroke in a Real World Community Setting: Case Report. Phys Ther. Mar 3 2021;101(3)doi: 10.1093/ptj/pzab008 [DOI] [PMC free article] [PubMed] [Google Scholar]
- 32.Morris DM, Crago JE, DeLuca SC, Pidikiti RD, Taub E. Constraint-induced movement therapy for motor recovery after stroke. Neurorehabilitation. 1997;9(1):29–43. [DOI] [PubMed] [Google Scholar]
- 33.Eliasson A-C, Forssberg H, Ikuta K, Apel I, Westling G, Johansson R. Development of human precision grip. Exp Brain Res. 1995;106:425–433. [DOI] [PubMed] [Google Scholar]
- 34.Sunderland A, Tuke A. Neuroplasticity, learning and recovery after stroke: a critical evaluation of constraint-induced therapy. Neuropsychol Rehabil. May 2005;15(2):81–96. [DOI] [PubMed] [Google Scholar]
- 35.Breiman L Random forests. Mach Learn. Oct 2001;45(1):5–32. doi:Doi 10.1023/A:1010933404324 [DOI] [Google Scholar]
- 36.Tozlu C, Edwards D, Boes A, et al. Machine Learning Methods Predict Individual Upper-Limb Motor Impairment Following Therapy in Chronic Stroke. Neurorehabil Neural Repair. May 2020;34(5):428–439. doi: 10.1177/1545968320909796 [DOI] [PMC free article] [PubMed] [Google Scholar]
- 37.Wittenberg GF, Richards LG, Jones-Lush LM, et al. Predictors and brain connectivity changes associated with arm motor function improvement from intensive practice in chronic stroke. F1000Res. 2016;5:2119. doi: 10.12688/f1000research.8603.2 [DOI] [PMC free article] [PubMed] [Google Scholar]
- 38.Lindenberg R, Renga V, Zhu L, Betzler F, Alsop D, Schlaug G. Structural integrity of corticospinal motor fibers predicts motor impairment in chronic stroke. Neurology. Jan 26 2010;74(4):280–7. doi: 10.1212/WNL.0b013e3181ccc6d9 [DOI] [PMC free article] [PubMed] [Google Scholar]
- 39.McHughen SA, Rodriguez PF, Kleim JA, et al. BDNF val66met polymorphism influences motor system function in the human brain. Cereb Cortex. May 2010;20(5):1254–62. doi: 10.1093/cercor/bhp189 [DOI] [PMC free article] [PubMed] [Google Scholar]
- 40.Pearson-Fuhrhop K, Burke E, Cramer S. The influence of genetic factors on brain plasticity and recovery after neural injury. Curr Opin Neurol. Dec 2012;25(6):682–8. doi: 10.1097/WCO.0b013e32835a360a [DOI] [PubMed] [Google Scholar]
- 41.Chang WH, Park E, Lee J, Lee A, Kim YH. Association Between Brain-Derived Neurotrophic Factor Genotype and Upper Extremity Motor Outcome After Stroke. Stroke. Jun 2017;48(6):1457–1462. doi: 10.1161/STROKEAHA.116.015264 [DOI] [PubMed] [Google Scholar]
- 42.Amaro-Gahete FJ, de la OA, Jurado-Fasoli L, Ruiz JR, Castillo MJ, Gutierrez A. Role of exercise on S-Klotho protein regulation: a systematic review. Curr Aging Sci. Jul 1 2018;doi: 10.2174/1874609811666180702101338 [DOI] [PubMed] [Google Scholar]
- 43.Cramer SC, Parrish TB, Levy RM, et al. Predicting functional gains in a stroke trial. Stroke. 2007;38(7):2108–14. doi: 10.1161/strokeaha.107.485631 [DOI] [PubMed] [Google Scholar]
- 44.Burke Quinlan E, Dodakian L, See J, et al. Neural function, injury, and stroke subtype predict treatment gains after stroke. Ann Neurol. Jan 2015;77(1):132–45. doi: 10.1002/ana.24309 [DOI] [PMC free article] [PubMed] [Google Scholar]
- 45.Cassidy JM, Tran G, Quinlan EB, Cramer SC. Neuroimaging Identifies Patients Most Likely to Respond to a Restorative Stroke Therapy. Stroke. Feb 2018;49(2):433–438. doi: 10.1161/STROKEAHA.117.018844 [DOI] [PMC free article] [PubMed] [Google Scholar]
- 46.Gauthier LV, Taub E, Mark VW, Barghi A, Uswatte G. Atrophy of spared gray matter tissue predicts poorer motor recovery and rehabilitation response in chronic stroke. Stroke. Feb 2012;43(2):453–7. doi: 10.1161/STROKEAHA.111.633255 [DOI] [PMC free article] [PubMed] [Google Scholar]
- 47.George SH, Rafiei MH, Borstad A, Adeli H, Gauthier LV. Gross motor ability predicts response to upper extremity rehabilitation in chronic stroke. Behav Brain Res. Aug 30 2017;333:314–322. doi: 10.1016/j.bbr.2017.07.002 [DOI] [PMC free article] [PubMed] [Google Scholar]
- 48.George SH, Rafiei MH, Gauthier L, Borstad A, Buford JA, Adeli H. Computer-aided prediction of extent of motor recovery following constraint-induced movement therapy in chronic stroke. Behav Brain Res. Jun 30 2017;329:191–199. doi: 10.1016/j.bbr.2017.03.012 [DOI] [PubMed] [Google Scholar]
- 49.Harrison RA, Field TS. Post stroke pain: identification, assessment, and therapy. Cerebrovasc Dis. 2015;39(3–4):190–201. doi: 10.1159/000375397 [DOI] [PubMed] [Google Scholar]
- 50.Groeneveld IF, Goossens PH, van Braak I, et al. Patients’ outcome expectations and their fulfilment in multidisciplinary stroke rehabilitation. Ann Phys Rehabil Med. Jan 2019;62(1):21–27. doi: 10.1016/j.rehab.2018.05.1321 [DOI] [PubMed] [Google Scholar]
- 51.O’Dell MW, Kim G, Rivera L, et al. A psychometric evaluation of the Arm Motor Ability Test. J Rehabil Med. Jun 2013;45(6):519–27. doi: 10.2340/16501977-1138 [DOI] [PMC free article] [PubMed] [Google Scholar]
- 52.Rohrer B, Fasoli S, Krebs HI, et al. Movement smoothness changes during stroke recovery. J Neurosci. Sep 15 2002;22(18):8297–304. [DOI] [PMC free article] [PubMed] [Google Scholar]
Associated Data
This section collects any data citations, data availability statements, or supplementary materials included in this article.