

Abstract
Altered energy metabolism and changes in glycolytic and oxidative phosphorylation pathways are hallmarks of all cancer cells. The expression of select genes associated in the production of various enzymes and proteins involved in glycolysis and oxidative phosphorylation were assessed in the clonal plasma cells derived from patients with newly diagnosed multiple myeloma (NDMM) enrolled in the Multiple Myeloma Research Foundation (MMRF) CoMMpass dataset. A scoring system consisting of assigning a point for every gene where their fragments per kilobase of transcript per million (FPKM) was above the median yielded a minimum of 0 and a maximum of 12 for the set of genes in the glycolytic and oxidative phosphorylation pathways to create a total energy metabolism molecular signature (EMMS) score. This EMMS score was independently associated with worse progression free survival (PFS) and overall survival (OS) outcomes of patients with NDMM. A higher EMMS score was more likely to be present in clonal plasma cells derived from MM patients than those from patients with monoclonal gammopathy of undetermined significance (MGUS). This was functionally confirmed by the clonal plasma cells from MM patients having a higher rate of mitochondrial and glycolysis-derived ATP formation than clonal plasma cells from MGUS patients. Thus, this study provides evidence for the effect of energy metabolism within clonal plasma cells on pathogenesis and outcomes of patients with MM. Exploiting the energy producing metabolic pathways within clonal plasma cells for diagnostic and therapeutic purposes in MM should be explored in the future.
INTRODUCTION
Multiple myeloma (MM) is a plasma cell malignancy with a heterogenous genomic profile leading to a diversity of clinical outcomes such as response to therapies and subsequent overall survival (OS).1 As such, the ability to risk-stratify patients with newly diagnosed multiple myeloma (NDMM) based on their expected OS outcomes and determined by the intrinsic biology of their clonal plasma cells is of utmost clinical importance to both clinicians and patients with MM.2 Advances over the last two decades have led to the development of several gene expression profile (GEP) assays that successfully predict OS outcomes of patients with NDMM.3–5 Many such GEP assays are now available in clinical practice for risk stratification of patients with NDMM. The specific genes included in these GEP assays are primarily selected for the strong associations of their expression levels with OS outcomes of NDMM patients. Not surprisingly, these specific genes reflect several aspects of the described hallmarks of cancer biology6 that may be broadly classified as being related to cell-cycle biology, genomic instability, cellular metabolism, cell migration and adhesion, immune evasion, angiogenesis, etc.
Dysregulated energy metabolism is one part of the altered cellular metabolism required by malignant cells to cope with the increased energy and nutrient demands faced by them due to their uncontrolled proliferation.7 As a result, altered energy metabolism has been linked to the pathogenesis8 and the subsequent development of disease resistance to therapies in various cancers.9 There is a lack of data demonstrating the association of the baseline cellular energy profile of MM cells from patients with NDMM with their subsequent survival outcomes. We hypothesized that the expression levels of genes involved in the cellular energy production in MM cells could serve as a prognostic biomarker of OS outcomes in patients with NDMM. Thus, the mRNA expression of a pre-specified set of genes within the primary MM cells obtained from patients with NDMM and known to be associated with glycolysis and oxidative phosphorylation (i.e., fundamental intracellular energy/ATP producing pathways in eukaryotes) were analyzed to construct an energy metabolism molecular signature (EMMS) score.
METHODS
Patient cohort
We obtained clinical and transcriptomic data on NDMM patients enrolled in the Multiple Myeloma Research Foundation (MMRF) CoMMpass registry (NCT01454297, version IA16) via the online MMRF Researcher Gateway Portal. The CoMMpass study was initiated in 2011 as a large-scale prospective observational study in NDMM. It has collected tissue samples, genetic information, quality of life, and clinical outcomes from 1,117 patients with NDMM at 90 different sites worldwide. Every participating institution had their own institutional review board review and approve this study per the Declaration of Helsinki. All patients provided written consent to have their clinical and genomic data accessible on the MMRF portal. In addition to the MMRF data, gene expression data from a previously published transcriptome dataset (GSE6477) obtained from the Gene Expression Omnibus (GEO) database was analyzed. Patients from this dataset were categorized by the type of plasma cell disorder: monoclonal gammopathy of undetermined significance (MGUS), smoldering multiple myeloma (SMM), multiple myeloma (MM), and included a set of healthy patients with normal polyclonal plasma cells (NPC). The relative mRNA expression levels of the genes included in the EMMS were compared between the different plasma cell disorders.
Transcriptomic assessments
From the CoMMpass cohort, mRNA-seq was performed on CD138-enriched bone marrow cells was performed using Illumina TruSeq RNA library kits. All sequencing was performed by Translational Genomics Research Institute (TGen). We obtained the individual expression levels of all genes involved in the formation of various enzymes and proteins that were part of the two main intracellular energy metabolism pathways, glycolysis and oxidative phosphorylation (which included the tricarboxylic acid (TCA) cycle and electron transport chain (ETC)) for all the patients included in this cohort. The GSE6477 transcriptome dataset was obtained using the Affymetrix U133A gene chip (Affymetrix, Santa Clara, CA) and the relative mRNA expression levels of the genes selected to be of prognostic significance were compared between the different plasma cell disorders.
Extraction of CD138+ and CD138- mononuclear cells for ATP rate assessments
To perform prospective bioenergetic assessments of the clonal CD138+ plasma cells from the bone marrow, freshly obtained bone marrow aspirates from patients underwent Ficoll-Paque gradient separation for plasma processing which was stored for later analysis at – 80 °C. The remnant cellular component of the bone marrow aspirate underwent red cell lysis using ACK lysis buffer. The clonal plasma cells were extracted using positive selection by mixing the cells with a CD138 positive selection cocktail and anti-CD138 magnetic-activated cell separation microbeads (ROBOSEP™ cell separation system, StemCell Technologies Inc.) in an automated RoboSep cell separation system. The purity of the sorted clonal plasma cells was confirmed via light chain restriction using the slide-based immunofluorescent method.
Ex Vivo ATP rate assay
The Agilent Seahorse XF Real-Time ATP Rate Assay Kit (Agilent, Cat. No.: 103592–100) was used to detect the ATP production rates of mitochondrial oxidative phosphorylation and glycolysis, respectively. Before metabolism measurement, the probe plate was hydrated with sterile water in a CO2-free incubator at 37C. The assay phenol red-free solution containing 10 mM glucose, 2 mM glutamine, and 1 mM pyruvate with a pH of 7.4 was kept in a 37 °C CO2-free incubator. The sterile water in the hydration plate was replaced with a calibration solution and kept in a 37 °C CO2-free incubator. Prospective paired samples of CD138+ clonal plasma cells and the remainder of the CD138- bone marrow mononuclear cells obtained from individual MGUS and MM patients were seeded into an XFp cell culture microplate (Seahorse Bioscience) at the density of 100,000 cells/well for measurement of ATP production rates of oxidative phosphorylation and glycolysis), allowed to adhere to plate using CellTak and allowed to rest in the 37 °C CO2-free incubator for up to 1 hour. Finally, ATP production rates of mitochondrial oxidative phosphorylation and glycolysis were determined and analyzed on the Agilent’s Seahorse Bioscience XFp Extracellular Flux Analyzer (Agilent Technologies) according to the manufacturer’s instructions and protocols (Seahorse Bioscience, North Billerica, MA, USA). To determine ATP production rates of mitochondrial-based oxidative phosphorylation and glycolysis, oligomycin and a mix of rotenone and antimycin A were added according to the manufacturer’s instructions and protocols (Seahorse Bioscience, North Billerica, MA, USA).
Statistical analysis
Statistical analysis was performed using the SAS biostatistical software JMP 13.0.1 (SAS Institute Inc., Cary, NC). Differences between subgroups were compared using either the Chi-square test or Fisher exact test. High risk cytogenetics by FISH was defined by the presence of any of the following abnormalities: t(4;14), t(14;16), t(14;20) and deletion 17p/monosomy 17.10 Patients were also classified by the International Staging System (ISS).11 We examined the association between EMMS overexpression scores and progression-free survival (PFS), defined as the time from MM diagnosis to disease relapse/progression or death, and overall survival (OS) using Kaplan-Meier curves and compared using the log-rank method. Finally, a multivariable analysis was performed using the Cox proportions hazards model to assess the influence of various prognostic factors on OS, and PFS was found to be of significance in univariate analyses. Data points from the Seahorse XFp assay were graphically compared between different sub-groups in this analysis using GraphPad Prism version 7.00 for Windows, GraphPad Software, La Jolla California USA, www.graphpad.com.
RESULTS
From the IA16 CoMMpass dataset, 766 patients had RNA sequencing-based gene expression data available for analysis and were included in this study. The clinical characteristics of patients in this cohort are listed in SUPPLEMENTARY TABLE 1. The cohort consisted of a median age of 63 (ranging from 27–93). Most patients were male (59%) and white (65%). There were 28% of patients with ISS III at diagnosis, and 39% were considered high-risk cytogenetics. A total of 403 (53%) patients underwent an autologous stem cell transplant (ASCT). The median OS for those patients younger than 75 years compared to those who were 75 years or older at diagnosis was 94 vs. 39 months (P < 0.001) (SUPPLEMENTARY FIGURE 1A). The median OS for those patients who had an ASCT at any time in their disease course compared to those who did not was 93 vs. 55 months (P < 0.001) (SUPPLEMENTARY FIGURE 1B). Of the 673 patients with cytogenetic data collected, 28% had high-risk cytogenetics, and their median OS was 70 months compared to 94 months for patients with standard-risk cytogenetics (P = 0.0053) (SUPPLEMENTARY FIGURE 1C). Of the 570 patients with cPC data collected, 6% had 1% or more cPCs present, and their median OS was 28 months compared to 94 months for patients with less than 1% cPCs present (P < 0.001) (SUPPLEMENTARY FIGURE 1D). Of the 648 patients who had ISS staging information, the 5-yr OS for those with ISS 1, 2 and 3 disease were 80%, 62% and 44%, respectively (P < 0.001) (SUPPLEMENTARY FIGURE 1E). Finally, among patients whose serum LDH levels were available, those with an elevated serum LDH greater than the median, the 5-yr OS was 58% compared to 73% in those with a serum LDH lower than the median (P = 0.0032) (SUPPLEMENTARY FIGURE 1F). Together, these differences in the OS outcomes based on well-established prognostic factors demonstrate the representative nature of this study cohort.
Generation of a transcriptomic-based energy metabolism score of clonal plasma cells in patients with NDMM
An energy metabolism molecular signature (EMMS) scoring system was generated to categorize NDMM patients according to the cumulative expression levels of select genes associated with the activity of the two major cellular energy metabolism pathways, glycolysis, and oxidative phosphorylation. We selected a total of 152 genes associated with the formation of proteins functioning as transmembrane metabolite transporters or intracellular enzymes involved inactivity of the glycolytic and oxidative phosphorylation pathways. Of these genes, those whose expression levels were associated with an inferior OS of NDMM patients in this cohort were selected and ranked in order of priority. There were 118 genes involved in the oxidative phosphorylation pathway of the mitochondria. Of these genes, only 82 had complete molecular data available at diagnosis. Each of those 82 genes were dichotomized at their median number of fragments per kilobase of transcript per million (FPKM) mapped reads to produce “low” (i.e., bottom 50% percentile) and “high” (i.e., top 50% percentile) classifiers. Of these 82 genes, there were 30 genes with a hazard ratio of > 1.5 and a p-value <0.0001 for negatively affecting OS and each of them were compared individually with the other 29 by chi-squared value (SUPPLEMENTARY FIGURE 2). One gene from each section of the oxidative phosphorylation pathway (i.e., the five-electron transport chain (ETC) complexes and one from the tricarboxylic acid (TCA) cycle) was selected that were the most independent (i.e. largest chi-square values compared to the others), resulting in six total genes. As a result, among genes associated with the oxidative phosphorylation pathway, the top six genes were selected based on 1) their magnitude of their association with an inferior OS, 2) their distribution throughout different parts of the oxidative phosphorylation pathway, i.e., one gene from each of the five electron transport chain complexes (NDUFA1, SDHC, UQCRFS1, COX7A2, ATP5F1E), and one gene from the TCA cycle (SUCLG1) and 3) having a high degree of independence from the other five genes. The top six genes were selected using similar criteria among 34 associated with the glycolytic and lactate fermentation pathways. Of these 34 genes, there were 12 genes with a hazard ratio of > 1.5 and a p-value <0.0001 for negatively affecting OS and each of them were compared individually with the other 11 by chi-squared value (SUPPLEMENTARY FIGURE 3). Finally, six genes were selected that were involved in glucose metabolism to pyruvate (HK2, TPI1, GAPDH, PGK1) and lactate formation and transport (LDHA, SLC16A1).
The expression levels for each of the aforementioned 12 genes (six from each of the glycolytic and oxidative phosphorylation pathways (SUPPLEMENTARY FIGURE 4)) were included as part of the EMMS scoring system of 0 – 12. A point was assigned for every one of the 12 genes where the FPKM was above the median or classified as “high” expression. Thus, each NDMM patient in this cohort could potentially receive a score of 0 −12, which was described as their EMMS score. After patients were assigned an EMMS score, they were categorized into a “low” (0–8) or “high” (9–12) EMMS score. When patients were split into low and high EMMS scores, 32% (N = 248) were determined to have a high EMMS score, leaving 68% (N = 518) with a low EMMS score. Patients with a high EMMS score were more likely to have concurrent poor prognostic factors for OS than patients with low EMMS scores such as: a) 1% or more cPCs in their peripheral blood (12% vs. 4%, P = 0.0004), b) have an elevated LDH (58% vs. 48%, P = 0.016), c) have high risk cytogenetics (32% vs. 24%, P = 0.04) and d) have ISS 3 disease (42% vs. 22%, P < 0.001) at diagnosis. Importantly, the chromosomal locations of all the 12 genes included in the EMMS score were not correlated to chromosome abnormalities associated with HR FISH cytogenetics.
Clinical Outcomes based on EMMS score
The median OS for the patients in the high EMMS group was 55 months and 94 months for the low EMMS group (HR: 2.41; 95% CI: 1.85–3.14, p < 0.0001) FIGURE 1A. The median PFS for the high and low EMMS groups was 24 months and 42 months, respectively (HR: 1.74; 95% CI: 1.42–2.13, p < 0.0001) FIGURE 1B. Among the 741 patients who had information on their ISS stage at diagnosis, those with ISS 2 and ISS 3 were stratified further into low and high EMMS score. The median OS for ISS-2 with a high EMMS score was 40 months compared to not reached for those with ISS-2 with a low EMMS score (P < 0.0001). Similarly, median OS for ISS-3 with a high EMMS score was 34 months compared to 68 months for those with ISS-3 with a low EMMS score (P = 0.003) FIGURE 1C. Correspondingly, the median PFS for ISS-2 with a high EMMS score was 21 months compared to 40 months for those with ISS-2 with a low EMMS score (P = 0. 0007). The median PFS for ISS-3 with a high EMMS score was 19 months compared to 35 months for those with ISS-3 with a low EMMS score (P = 0.0049) FIGURE 1D. Among the 673 patients who had information on their FISH cytogenetics at diagnosis, those with SR and HR FISH were stratified further into low and high EMMS score. The median OS for SR with a high EMMS score was 55 months compared to 94 months for those with SR with low EMMS score (P < 0.001). The median OS for HR with a high EMMS score was 36 months compared to not reached for those with HR with low EMMS score (P < 0.001) FIGURE 1E. Similarly, the median PFS for SR with a high EMMS score was 25 months compared to 51 months for those with SR with low EMMS score (P < 0.001). The median PFS for HR with a high EMMS score was 20 months compared to 30 months for those with HR with low EMMS score (P = 0.014) FIGURE 1F.
FIGURE 1:
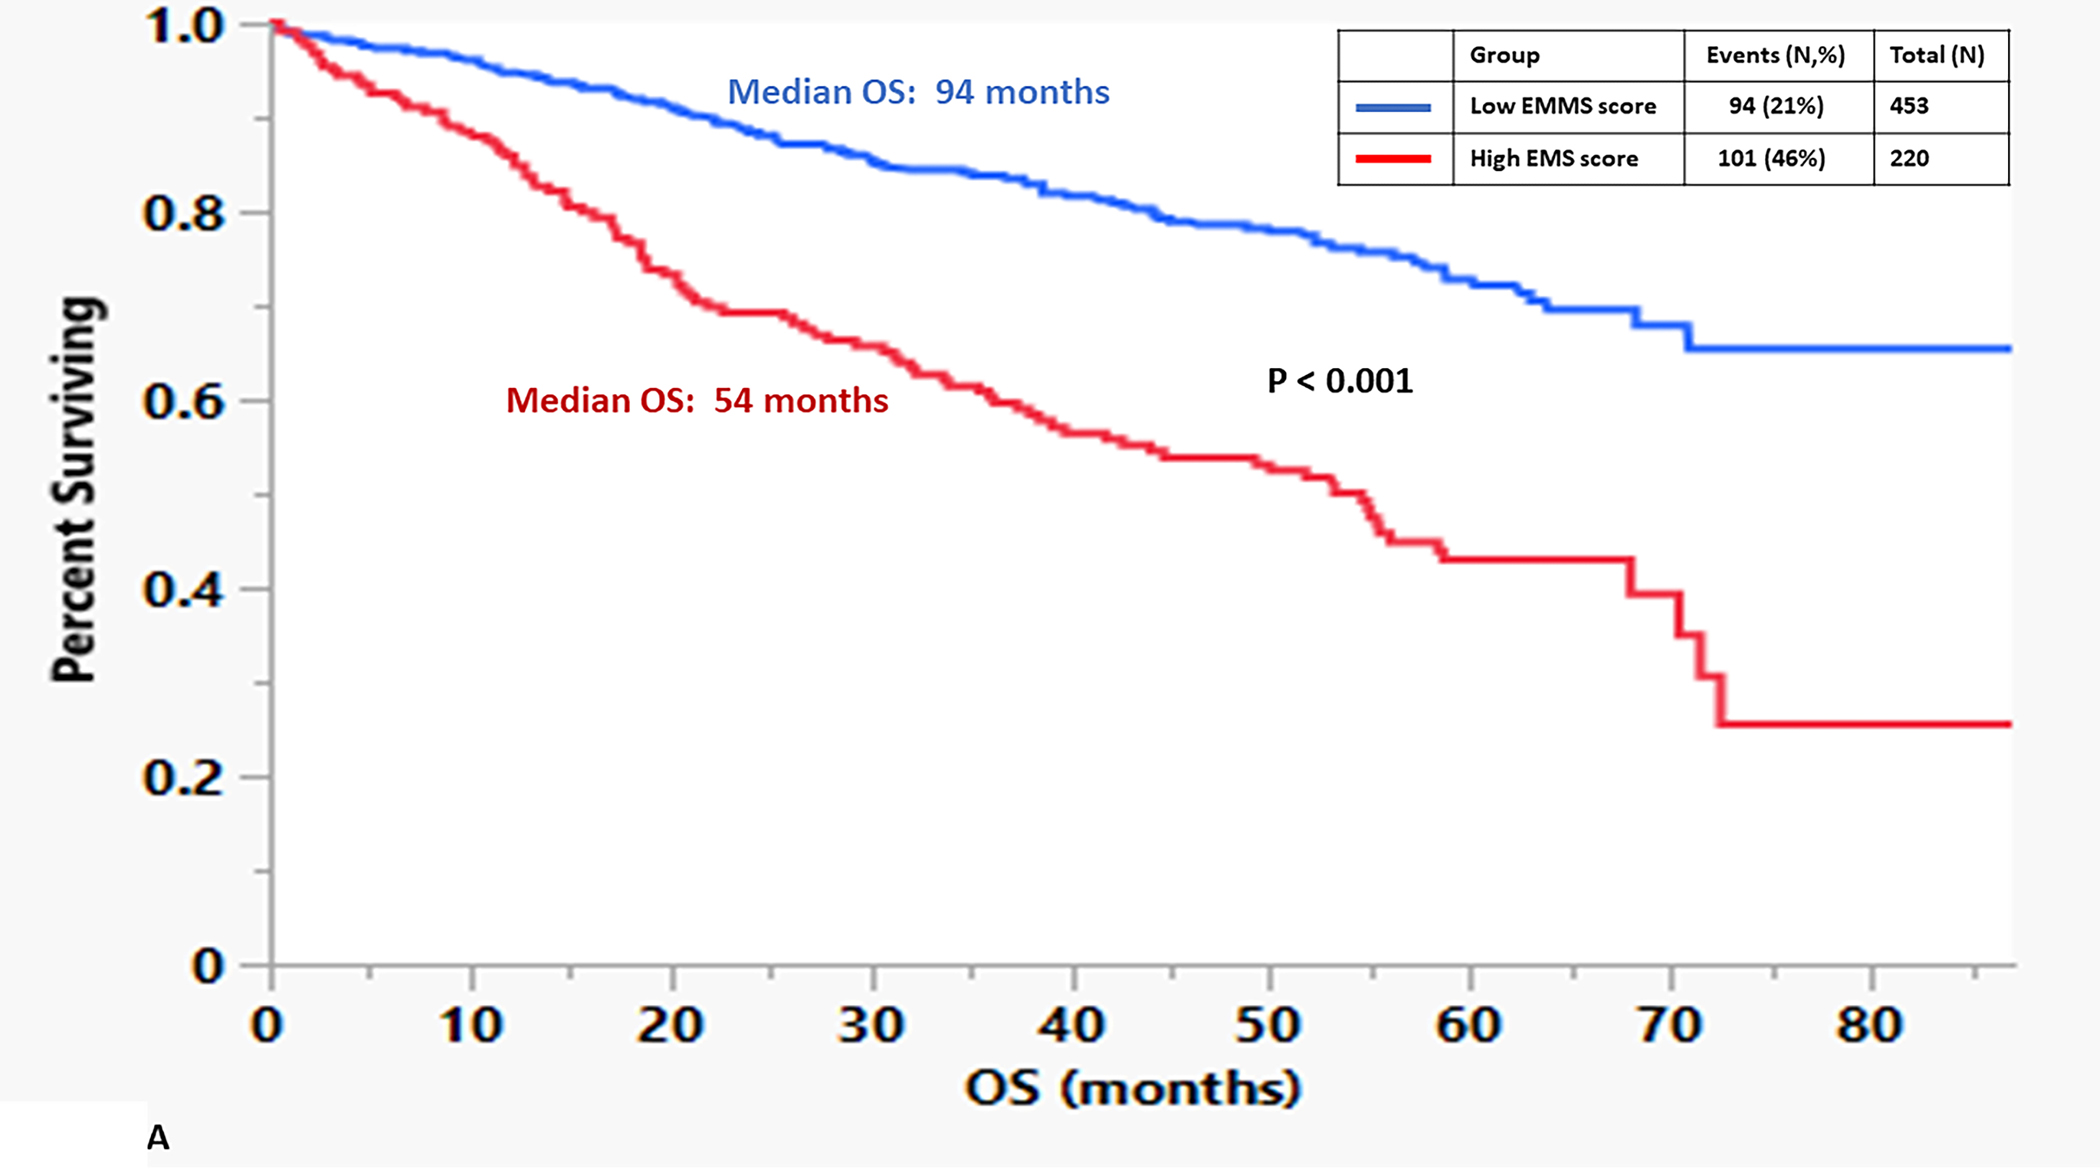
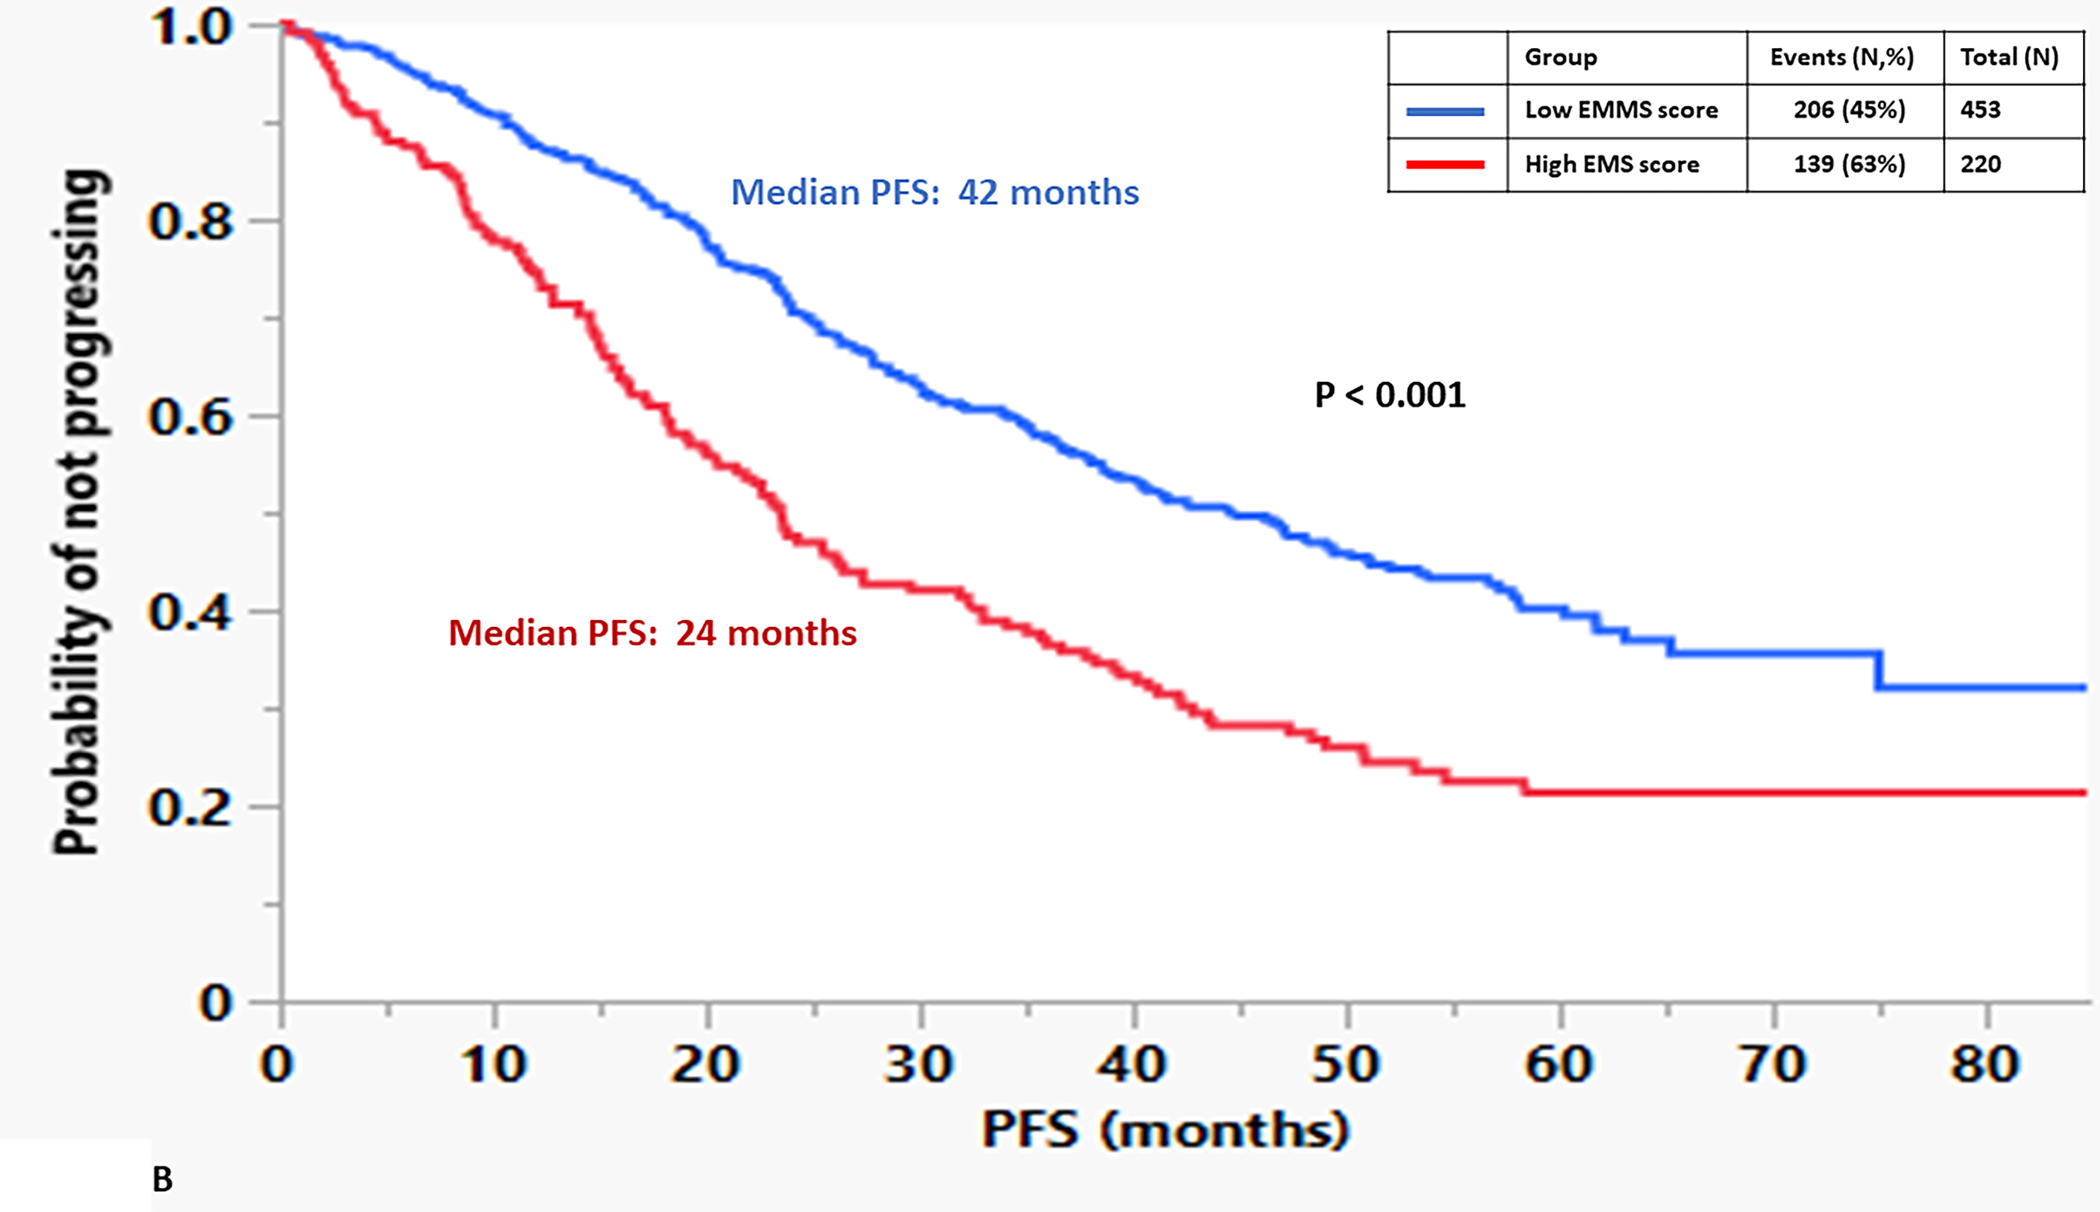
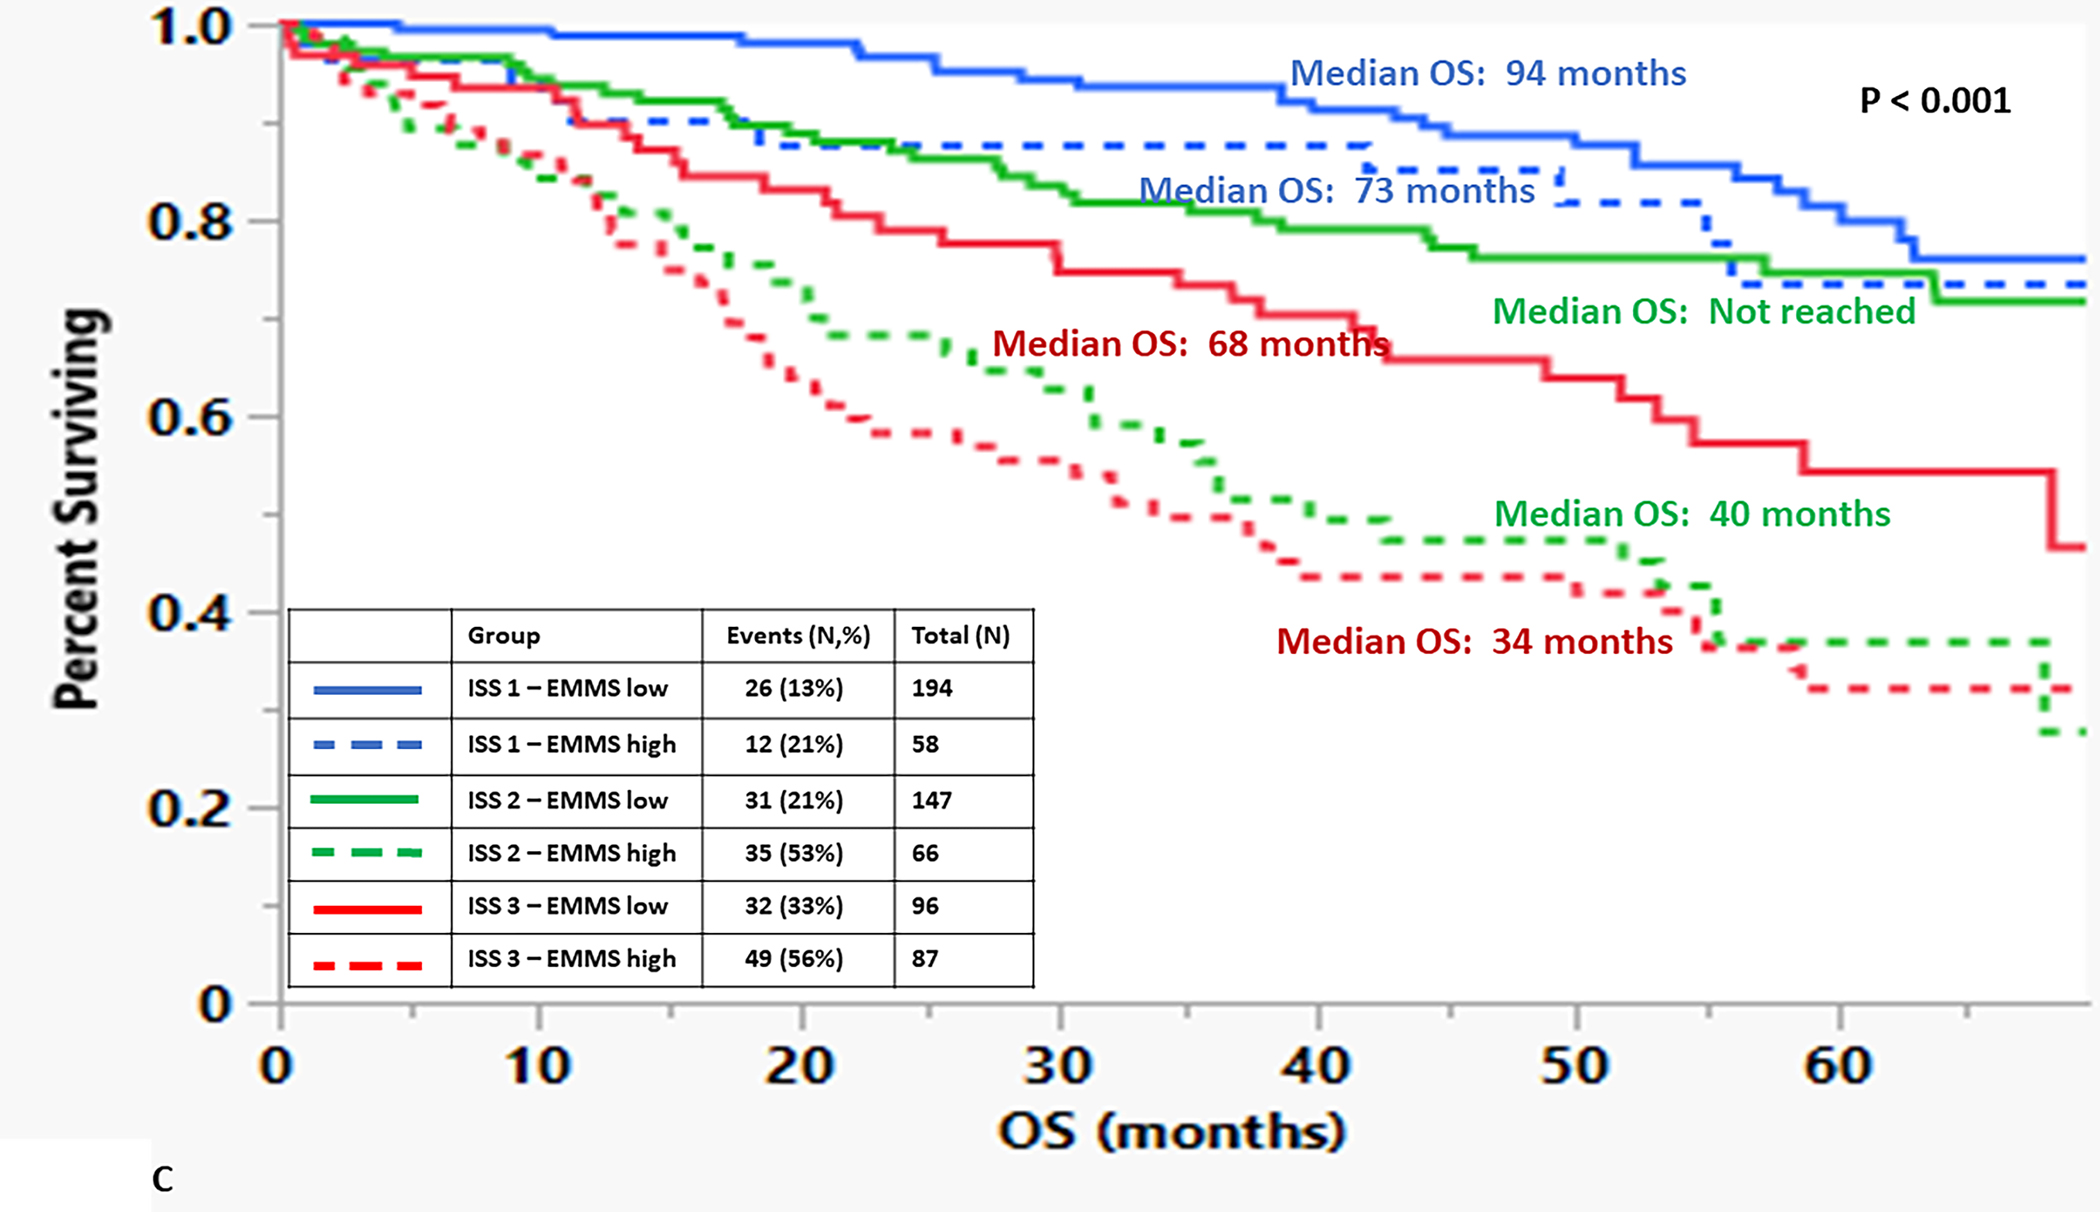
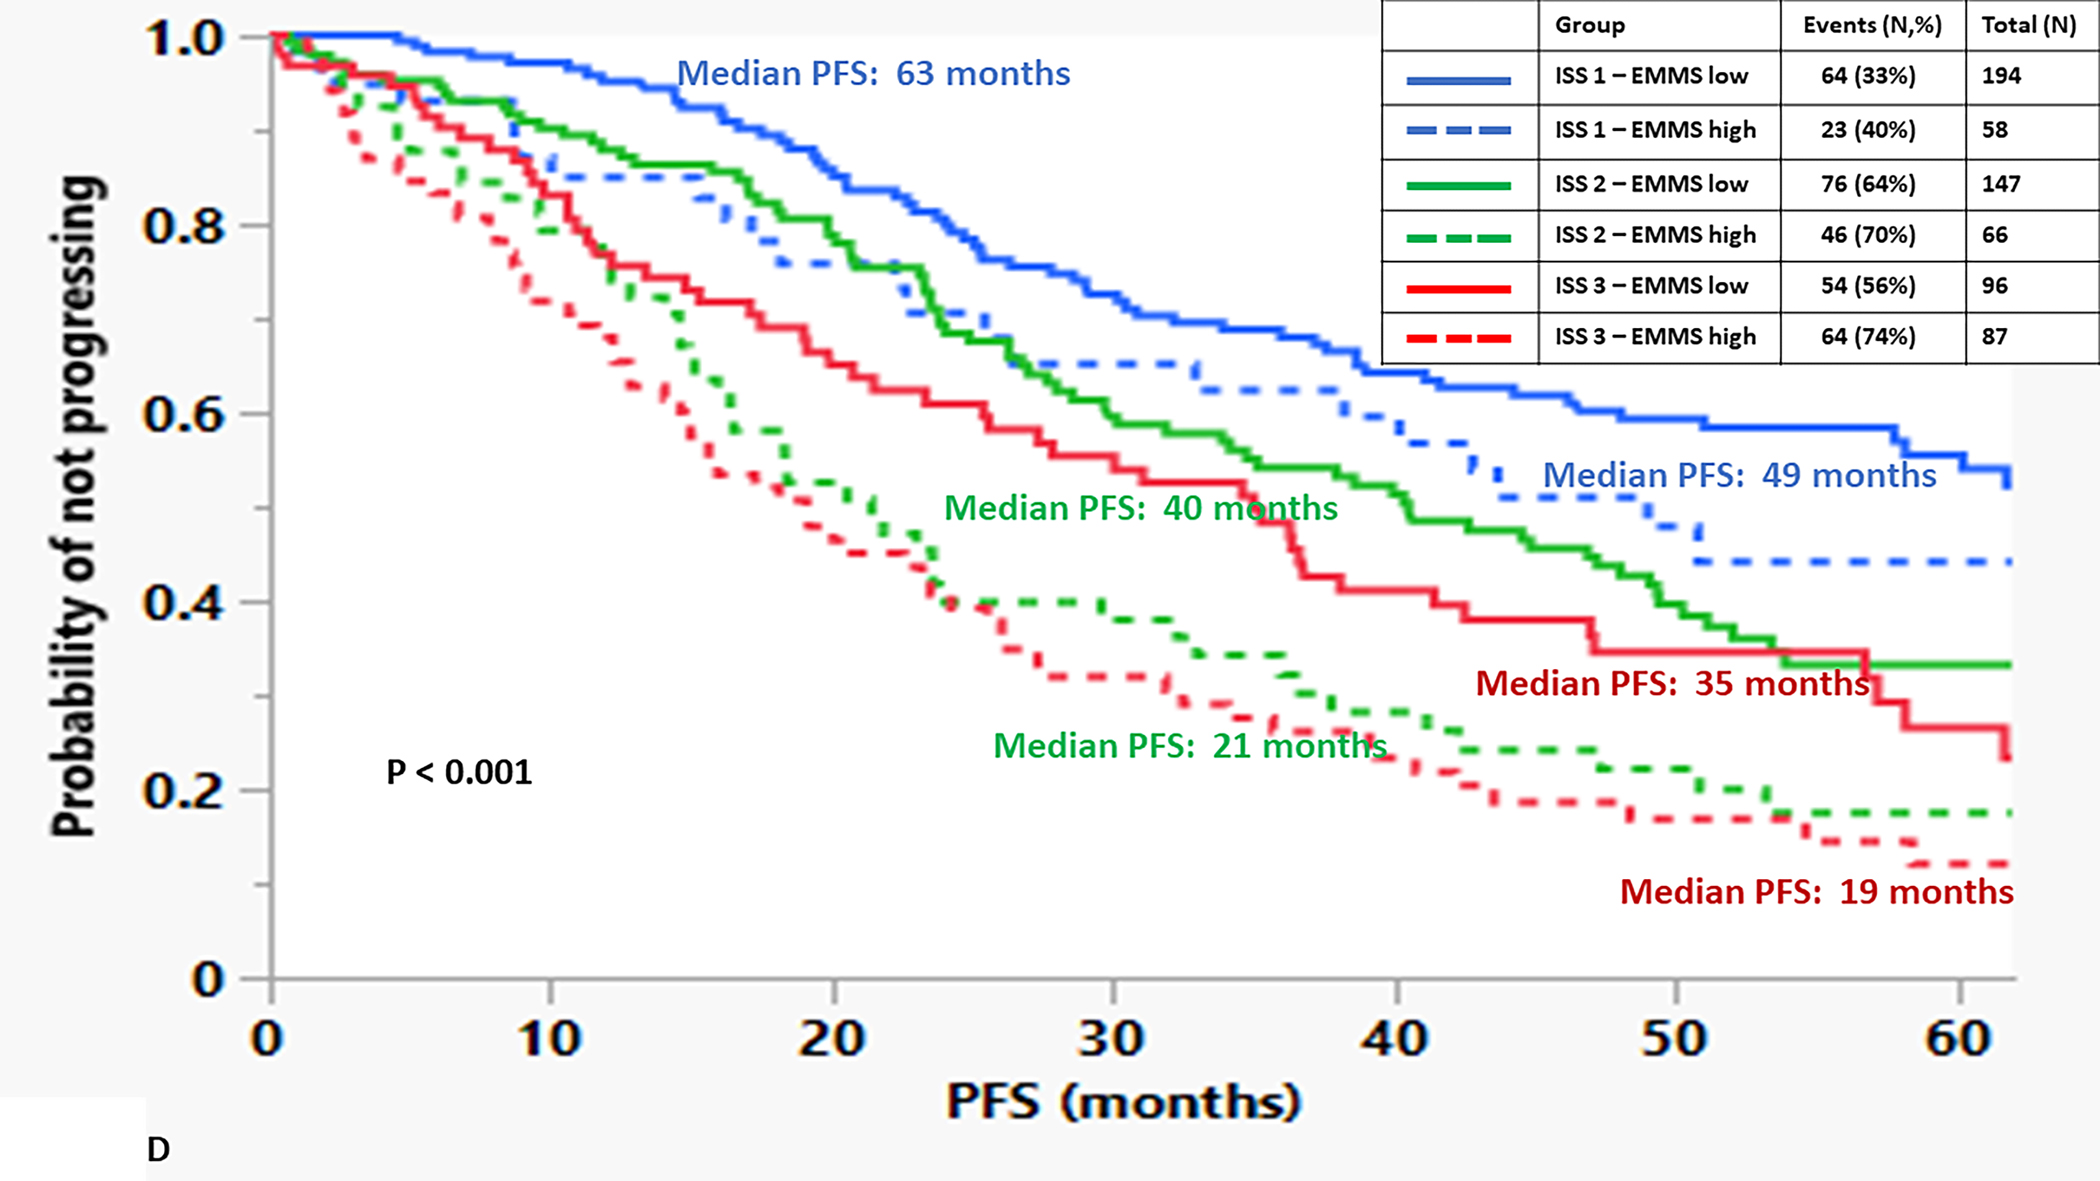
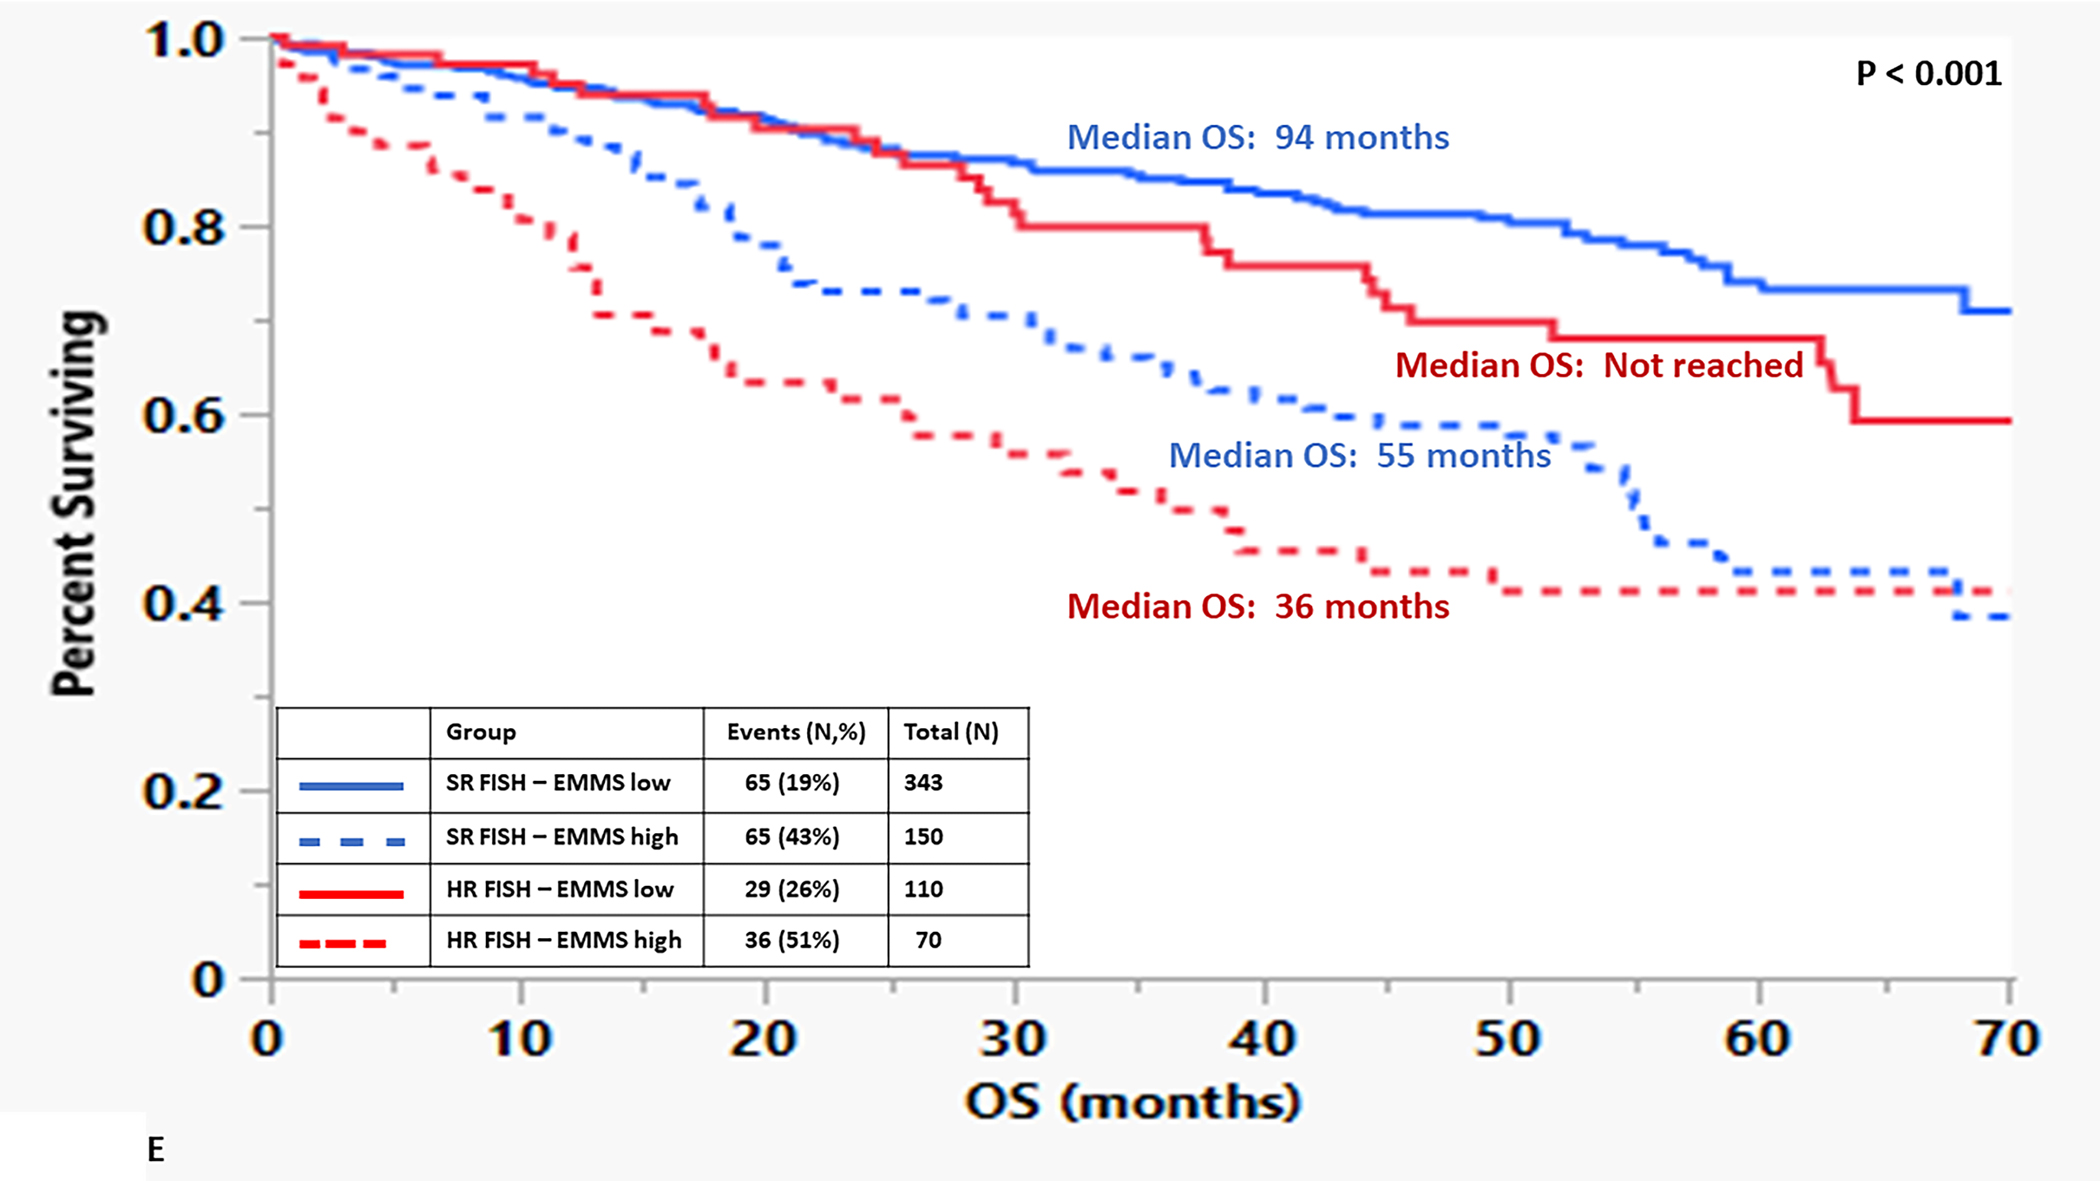
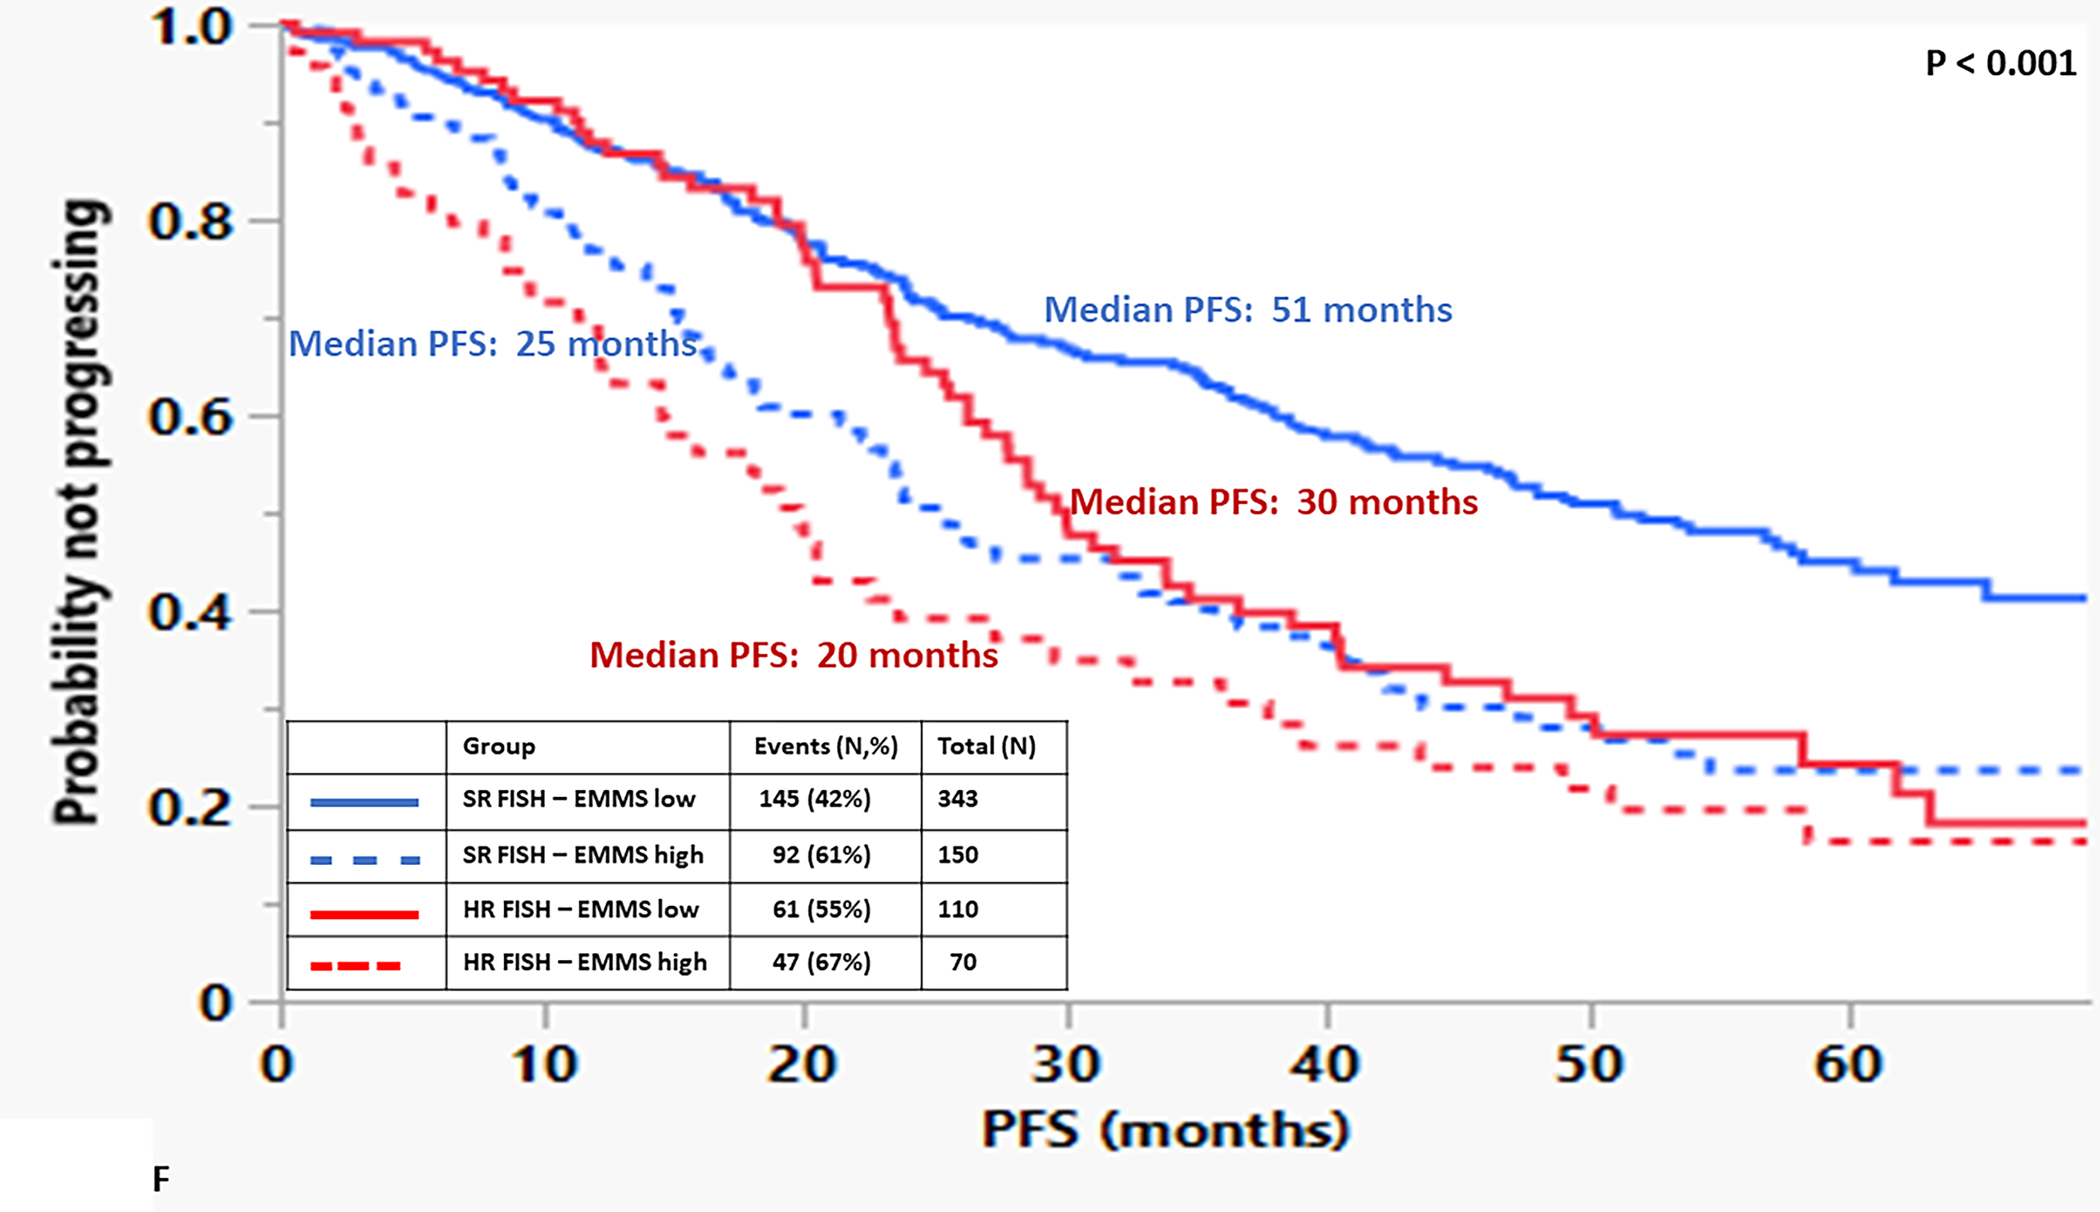
Kapan Meir curves comparing patients based on low and high EMMS score (A: OS and B: PFS), ISS stratified by low and high EMMS score (C: OS and D: PFS) and FISH cytogenetics stratified by low and high EMMS score (E: OS and F: PFS).
The following variables available at diagnosis were assessed in a univariate and multivariate analysis to determine their effects on PFS and OS: the presence of a high EMMS score, age ≥ 75 years, ISS 3, elevated LDH, HR FISH status and presence of ≥1% cPCs (TABLE 1). For both PFS and OS, all the variables were significant on univariate analyses. In addition, all but the elevated LDH and ISS 3 stage in the multivariate model retained statistical significance.
TABLE 1:
Univariable and Multivariable analysis of factors at diagnosis predicting worse 479 PFS and OS.
| Variable | Progression free survival (PFS) | Overall survival (OS) | ||||||
|---|---|---|---|---|---|---|---|---|
| Univariable | Multivariable | Univariable | Multivariable | |||||
| Risk Ratio | p | Risk Ratio | p | Risk Ratio | p | Risk Ratio | p | |
| High EMMS score | 1.84 (1.48–2.28) | < 0.001 | 1.67 (1.24 – 2.25) | 0.001 | 2.67 (2.03–3.56) | < 0.001 | 2.53(1.70–3.76) | < 0.001 |
| Age ≥ 75 | 2.16 (1.64–2.86) | < 0.001 | 2.41 (1.59 – 3.64) | < 0.001 | 2.82 (2.02–3.93) | < 0.001 | 3.52 (2.10–5.88) | < 0.001 |
| ISS 3 | 1.86 (1.48–2.33) | < 0.001 | 1.22 (0.87 – 1.71) | 0.240 | 2.42 (1.81–3.24) | < 0.001 | 1.03 (0.65 – 1.61) | 0.913 |
| Elevated LDH | 1.33 (1.05–1.68) | 0.017 | 1.12 (0.85 – 1.47) | 0.434 | 1.60 (1.17–2.19) | 0.004 | 1.10 (0.75 – 1.61) | 0.619 |
| Presence of cPCs | 3.03 (2.09–4.39) | < 0.001 | 2.47 (1.57 – 3.89) | < 0.001 | 3.13 (2.01–4.88) | < 0.001 | 2.88 (1.66 – 5.00) | < 0.001 |
| High risk status by FISH | 1.56 (1.24–1.96) | < 0.001 | 1.50 (1.11 – 2.02) | 0.009 | 1.52 (1.13–2.05) | 0.006 | 1.65 (1.11 – 2.45) | 0.014 |
Application of the EMMS score to the spectrum of plasma cell disorders
To determine if there were differences in the activity levels of the energy metabolism pathways of clonal plasma cells derived from patients within the spectrum of clonal plasma cell disorders as well as normal health controls, the EMMS scoring system was applied using gene expression levels from a previously published transcriptome dataset (GSE6477). Patients in this dataset included the spectrum of clonal plasma cell disorders: monoclonal gammopathy of undetermined significance (MGUS), smoldering multiple myeloma (SMM), multiple myeloma (MM), as well as normal healthy controls (NPC). The relative expression of several of the 12 select genes included in the EMMS score was higher among patients with MM than the precursor disorders such as MGUS or SMM and normal patients (FIGURE 2A). As a result, clonal plasma cells from patients with MM were more likely to have a high EMMS score than patients with SMM, MGUS and normal healthy participants: (0% of NPC patients, 5% of MGUS, 21% of SMM, and 44% of MM had a high EMS score) (FIGURE 2B). There was a direct correlation of the EMMS score determined for each of the patient’s clonal plasma cells and their corresponding proliferation index as estimated by the labeling index (FIGURE 2C). Upon applying the EMMS scoring system to the NDMM patients (N = 72) in this cohort, the median OS for the patients in the high EMMS group was 22 months and 63 months for the low EMMS group (HR: 3.89; 95% CI: 1.97–7.68, p < 0.0001) (FIGURE 2D).
FIGURE 2:
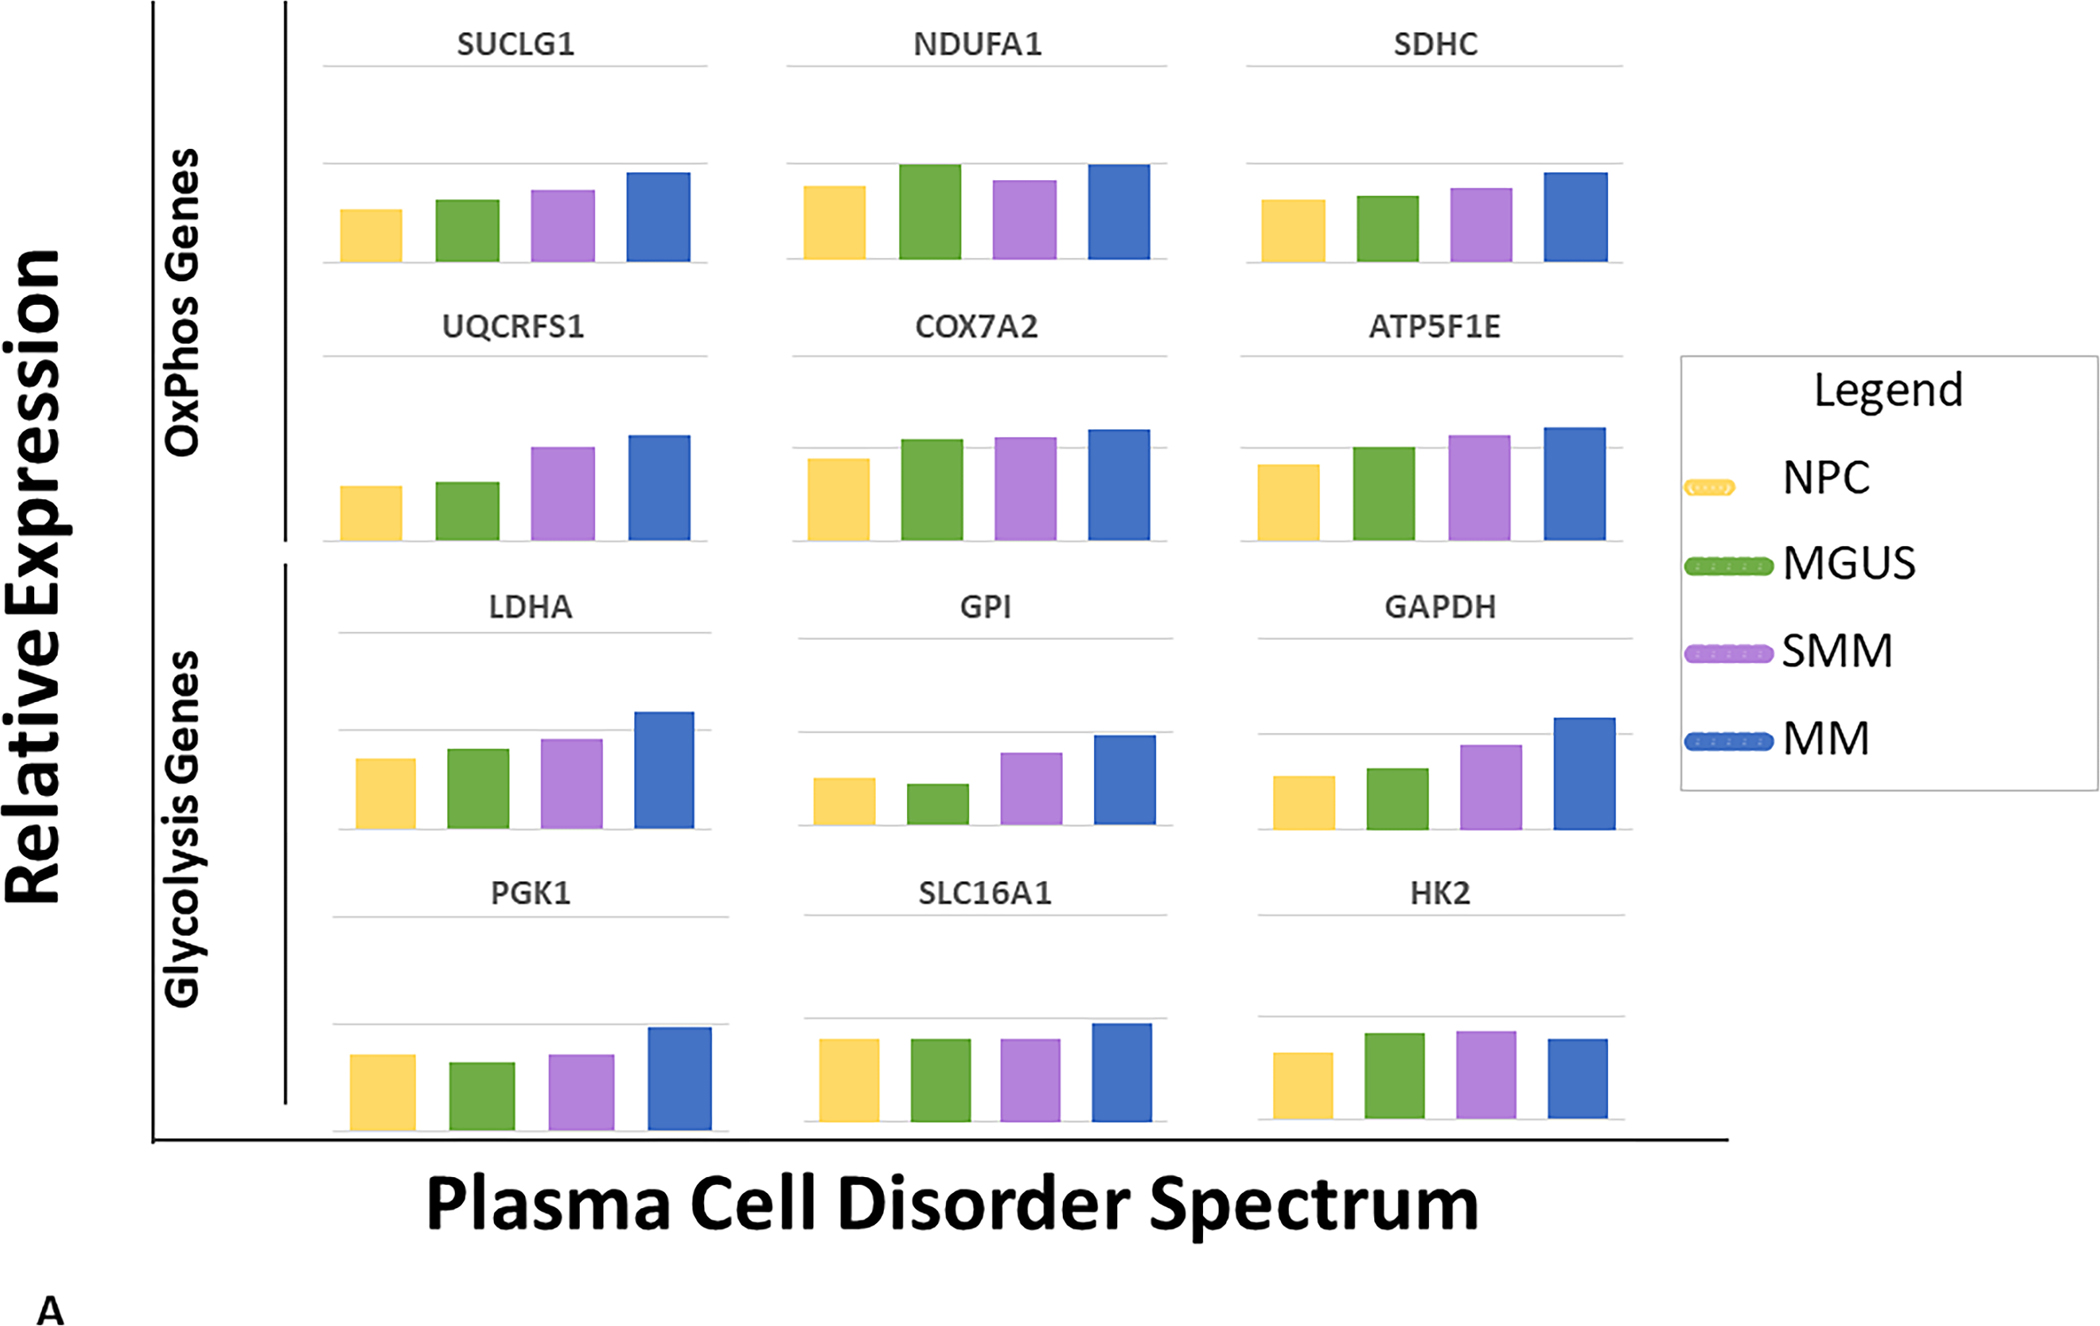
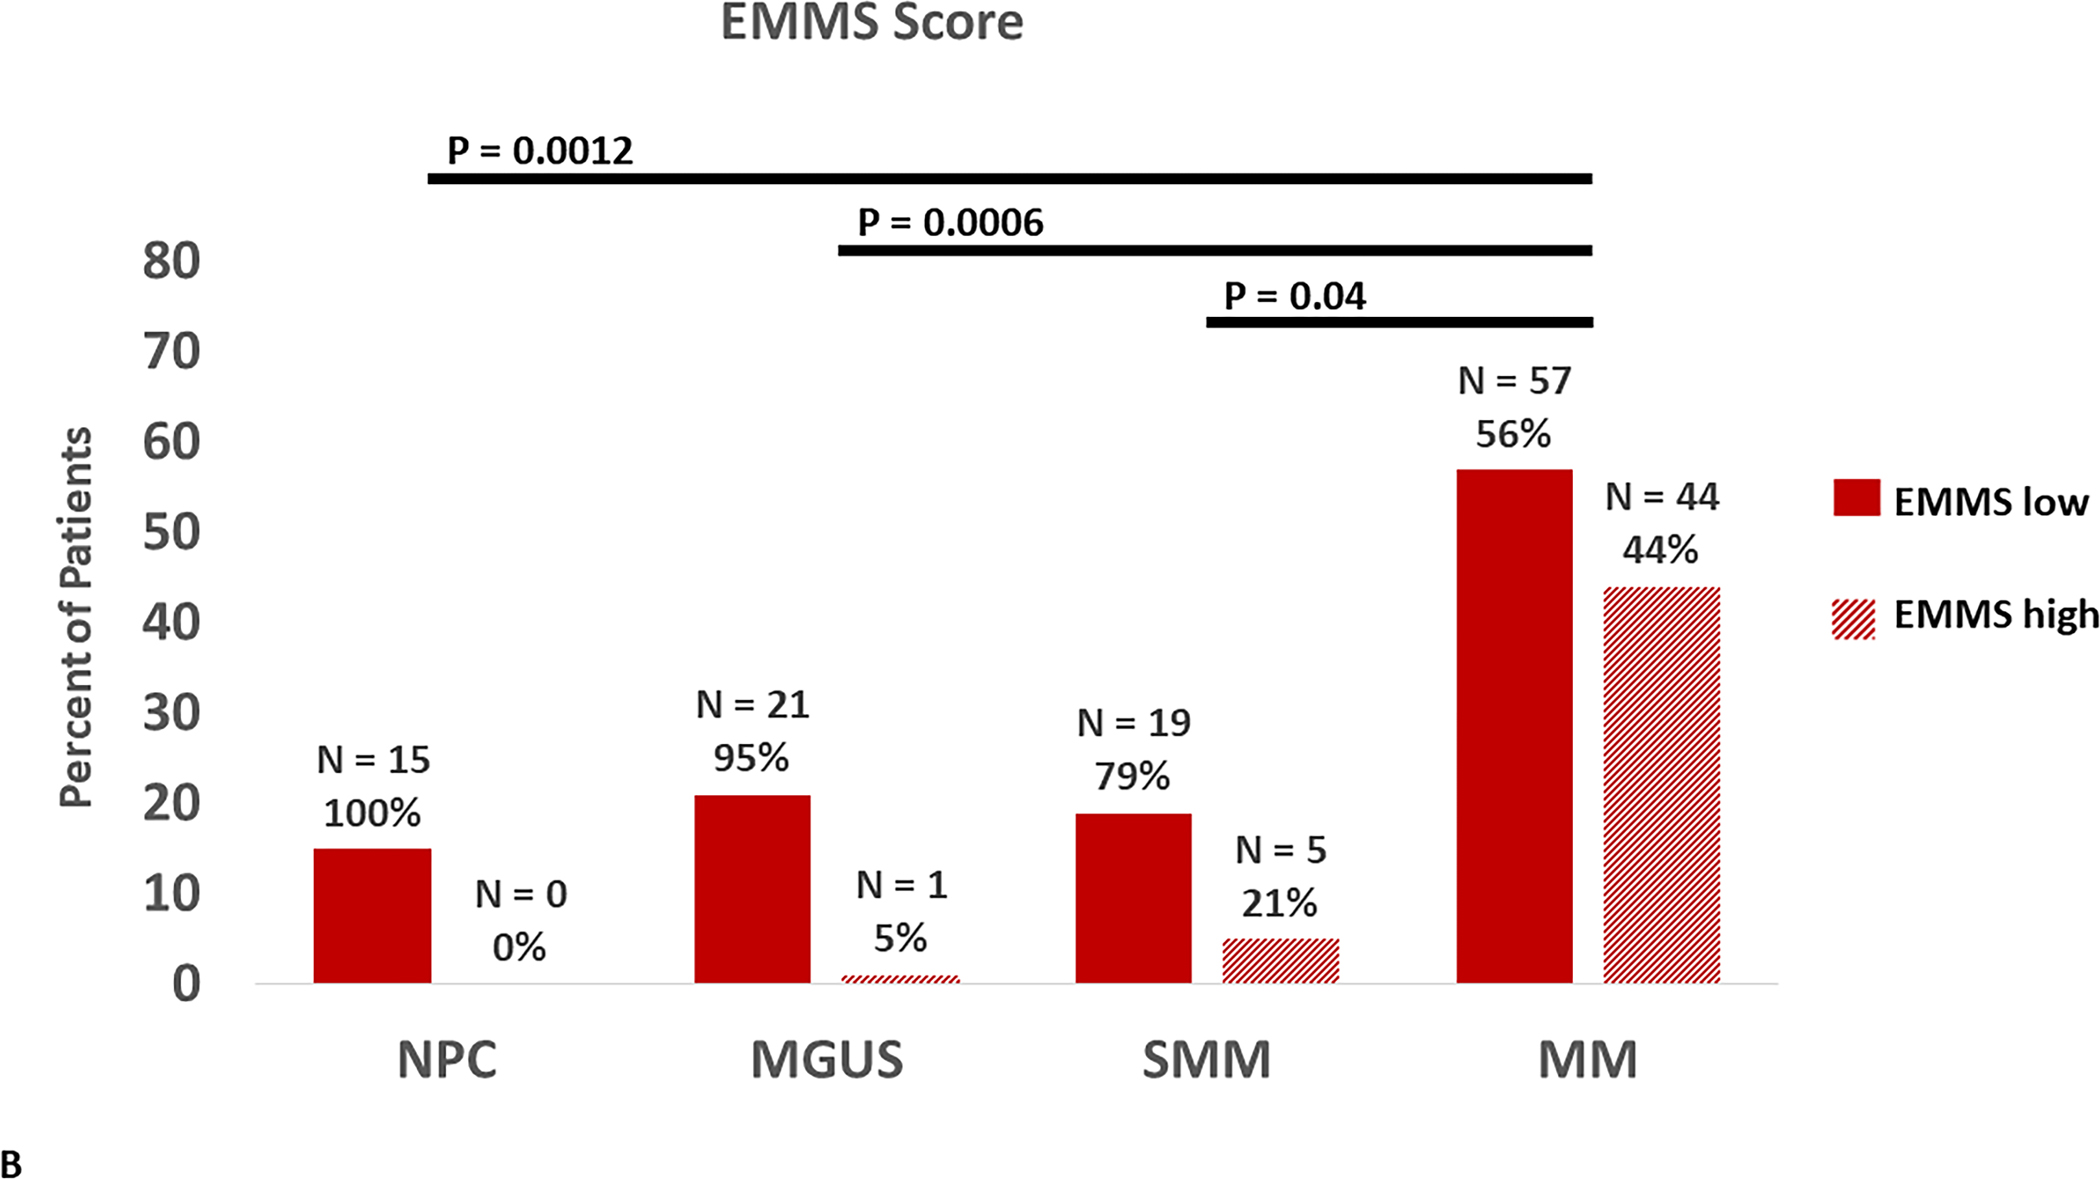
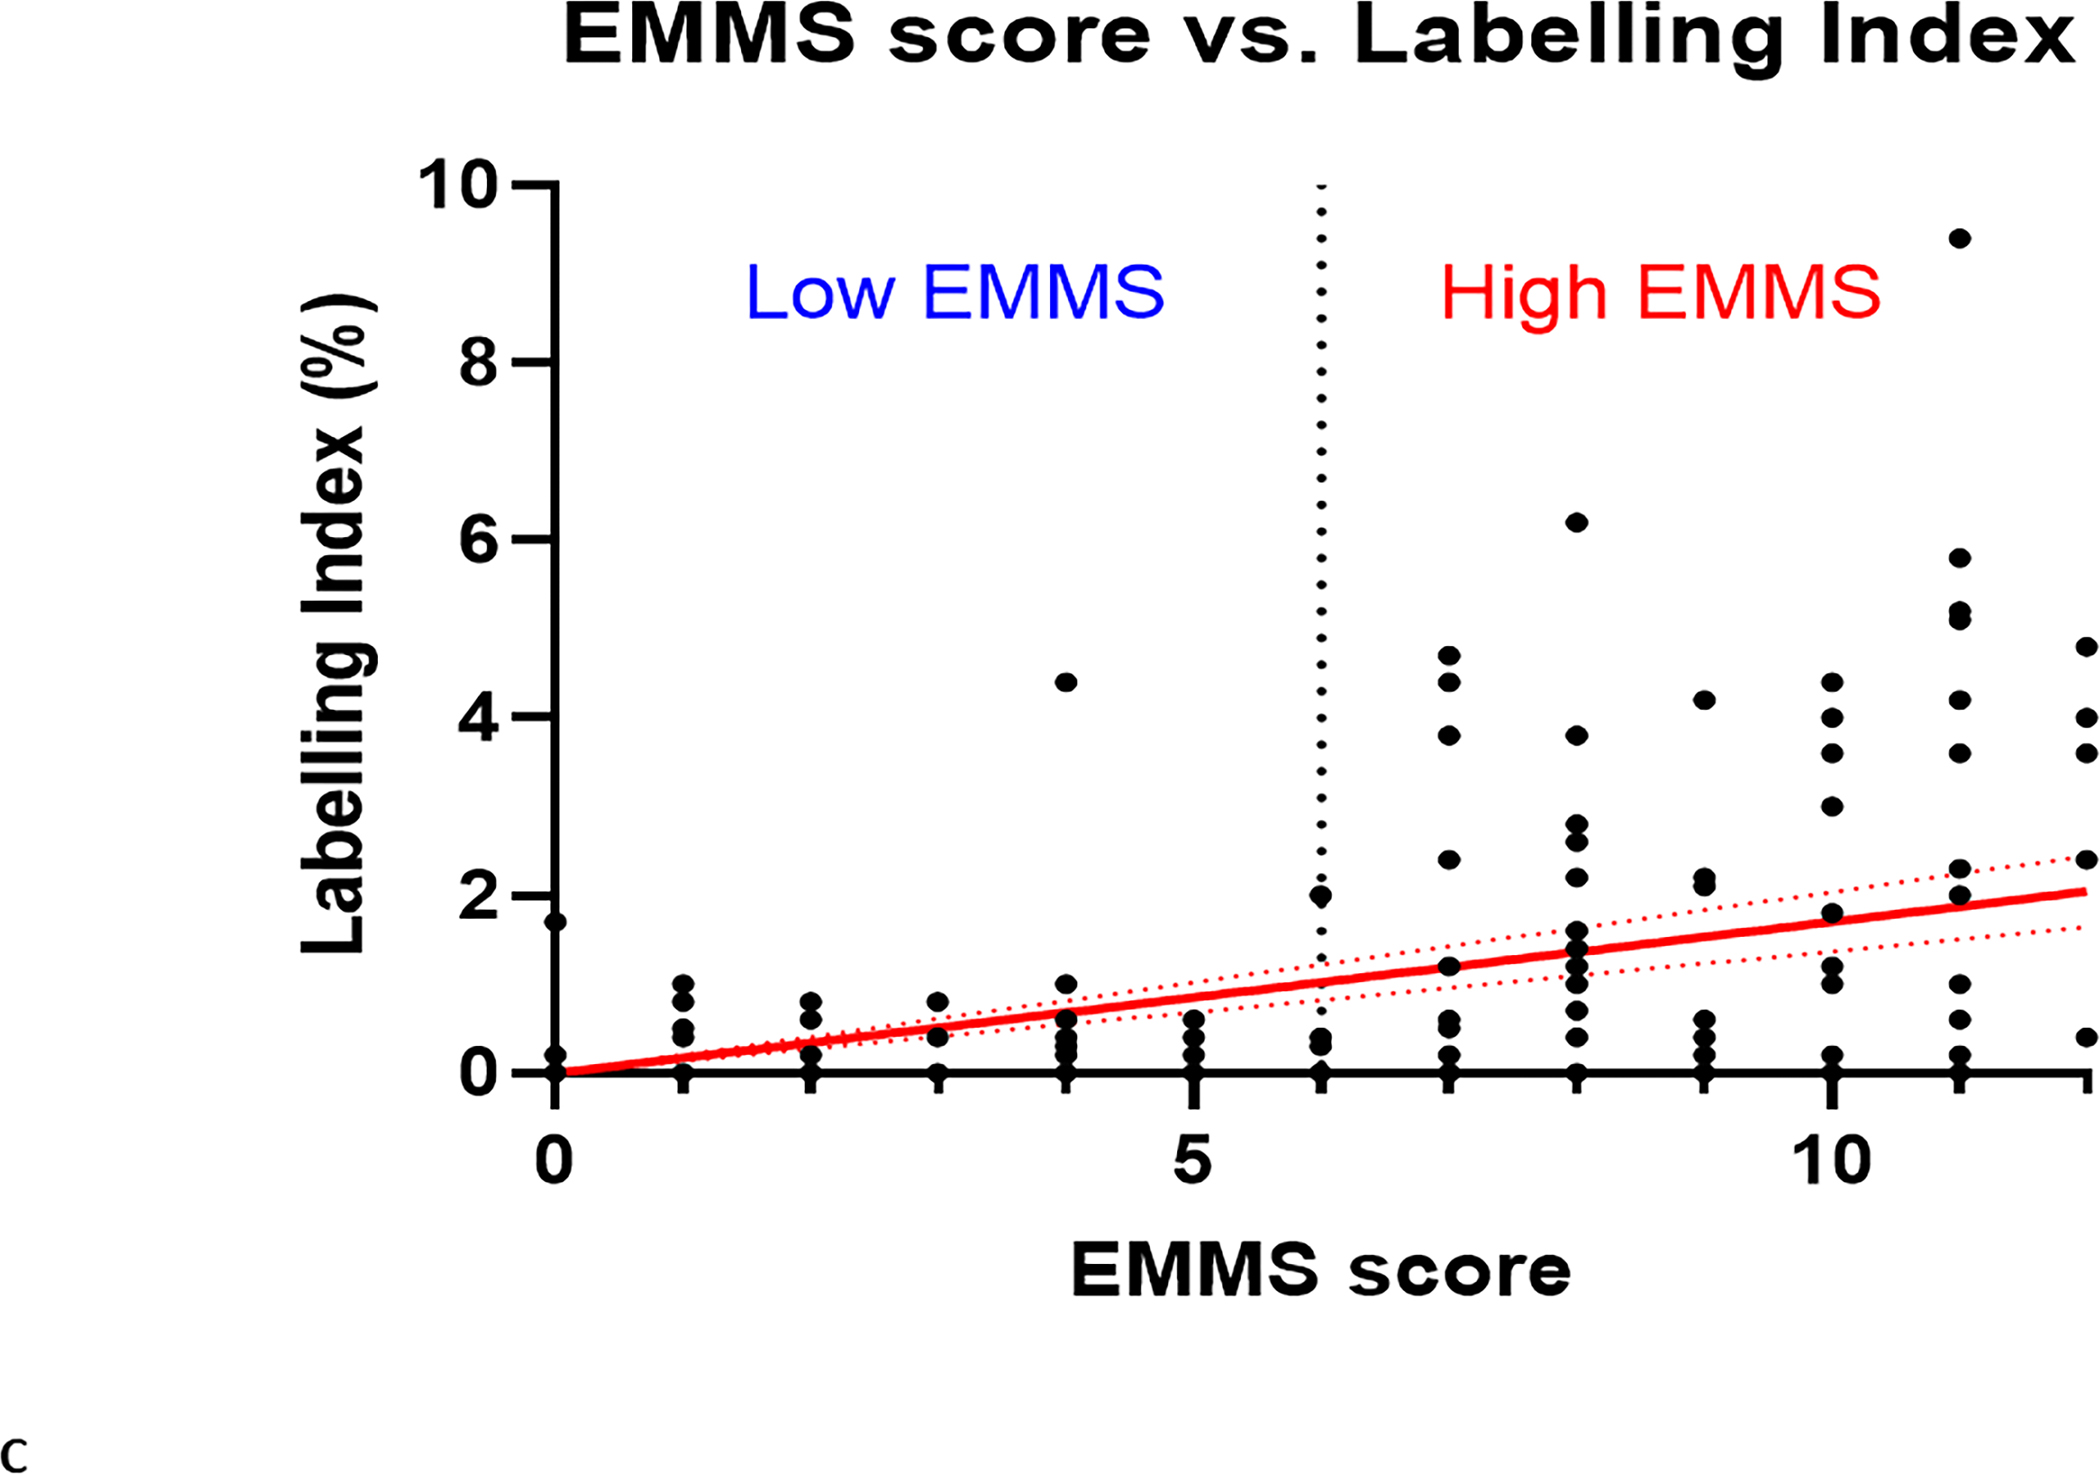
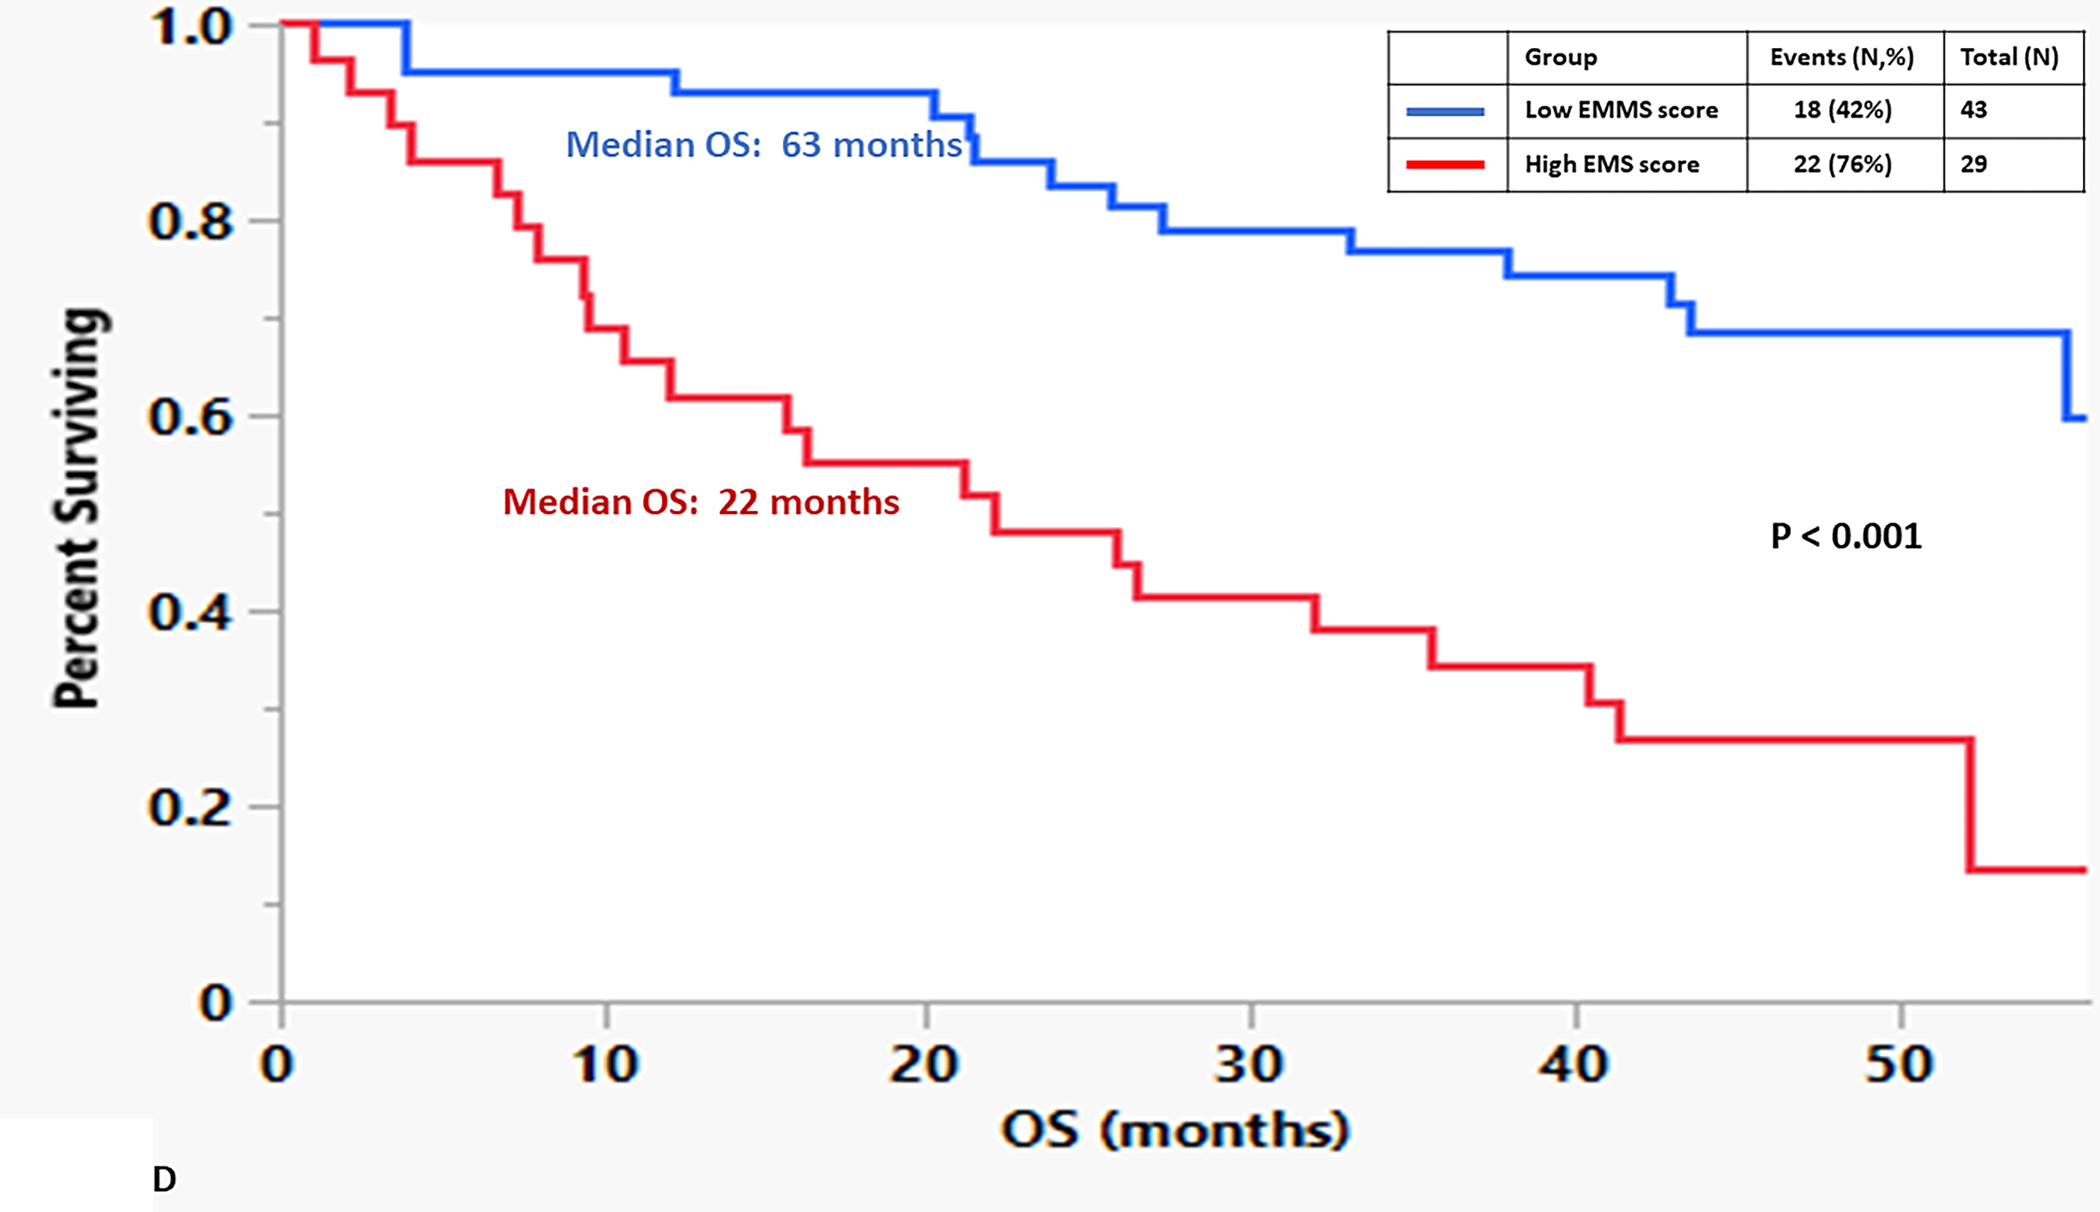
A) Relative expression of the 12 select genes included in the EMMS score among the spectrum of patients with plasma cell disorders (NPC, MGUS, SMM and MM), B) Distribution of high EMMS score among the spectrum of patients with plasma cell disorders, C) Correlation of EMMS score with the labeling index of patients with plasma cell disorders and D) Kapan Meir curves comparing the OS of NDMM from the GSE6477 patients based on low and high EMMS score.
Comparisons of ATP production rates between MGUS and MM
Given the difference between the proportion of patients with MGUS and MM whose clonal plasma cells had a high EMMS score, it was important to evaluate the functional activity of the glycolytic and oxidative phosphorylation metabolic pathways of these clonal plasma cells to validate if a high EMMS score reflected an increase in downstream energy production. An ex vivo, real-time monitoring of the extracellular acidification rate (ECAR) and the oxygen consumption rate (OCR), using a Seahorse extracellular flux analyzer, was performed on CD138+ clonal plasma cells and their paired CD138- mononuclear cell fraction isolated directly from the bone marrow aspirates of prospective patients with MGUS (N = 3) and MM (N = 3). These variables allowed us to estimate the proton efflux rate (PER) and the individual contributions of the glycolytic and oxidative phosphorylation metabolic pathways to ATP formation. The mitochondrial ATP rate was significantly higher in the CD138+ clonal plasma cell fraction from patients with MM and MGUS patients compared to their paired CD138- mononuclear cell fraction. Importantly, the mitochondrial ATP rate of the CD138+ clonal plasma cells from patients with MM was higher than the CD138+ clonal plasma cells from patients with MGUS (P = 0.0007) (FIGURE 3A). In contrast, the glycolytic ATP rate was significantly higher in the CD138- mononuclear cell fraction compared to the CD138+ clonal plasma cell fraction in MGUS patients but in the MM patients, the glycolytic ATP rate was similar in the CD138+ clonal plasma cell fraction compared to the CD138- mononuclear cell fraction. Nevertheless, the glycolytic ATP rate of the CD138+ clonal plasma cells from patients with MM was higher the CD138+ clonal plasma cells from patients with MGUS (P = 0.03) (FIGURE 3B). In summary, these observations of the clonal MM plasma cells having a higher mitochondrial and glycolytic ATP production rates than clonal MGUS plasma cells obtained support the association of higher EMMS scores in clonal CD138+ plasma cells obtained from MM patients compared to those obtained from MGUS patients.
FIGURE 3:

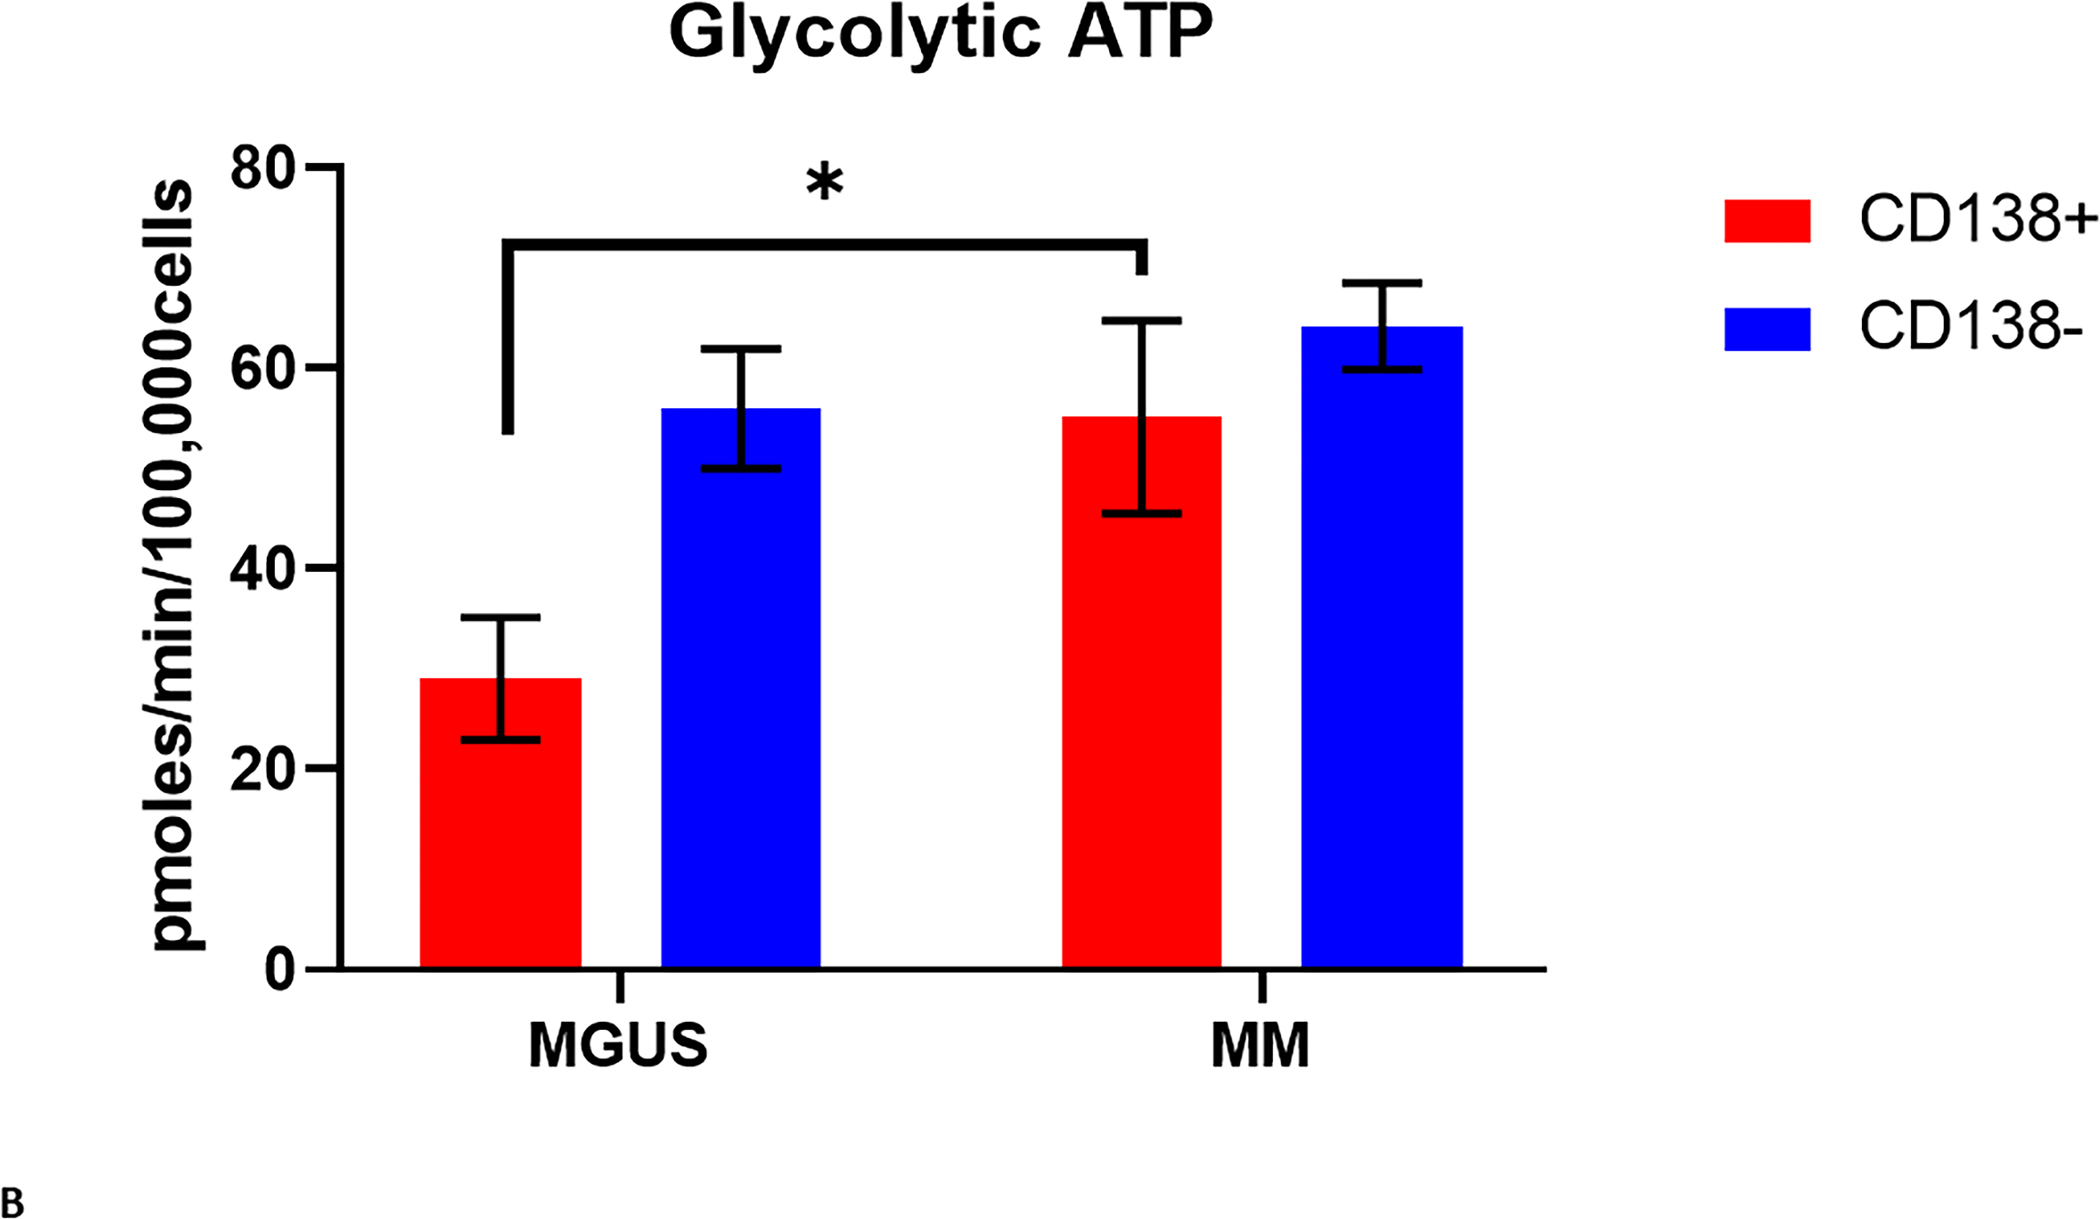
A) Mitochondrial and B) Glycolytic ATP production rate of CD138 (+) and CD138 (−) cells isolated from the bone marrows of patients with MGUS (N = 3) and MM (N = 3).
DISCUSSION
Cancer cells accumulate genetic alterations resulting in uncontrolled proliferation that require increased energy and micromolecule nutrients to support macromolecule synthesis. In addition, several key metabolic reactions critical to tumor cell survival and growth require sources of oxidizing power in the form of electron acceptors such as NAD+ and reducing power acting as electron donors such as NADH and NADPH. To cope with these increased metabolic demands, cancer cells reprogram their intracellular metabolic pathways to generate energy, generate various oxidizing and reducing substrates, and rapidly take up and break down nutrients. Otto Warburg was the first to describe the inherent propensity of all cancer cells to preferentially utilize aerobic glycolysis as the major energy source to form ATP.12 While it is a fact that most cancer cells increase their glucose uptake to support aerobic glycolysis, the role of the TCA cycle in cancer metabolism and tumorigenesis has been overlooked until recently. It is now well accepted that the tricarboxylic acid (TCA) cycle is equally important and remains a central route for oxidative phosphorylation of various fuels other than glucose such as glutamine, fatty acids, and other amino acids to fulfill their heightened bioenergetic, biosynthetic, and redox balance requirements.13 Importantly, various oncogenes and tumor suppressors regulate the uptake and breakdown of fuel sources in the TCA cycle by regulating the expression of fuel transporters and the activity of cycle enzymes in cancer cells. For example, glutamine is an important substrate of the TCA cycle across numerous cancer types, especially for MYC-driven cancers.14,15 In plasma cell malignancies, extracellular glutamine anaplerosis into the TCA cycle was higher in clonal plasma cells derived from patients with MM than those with MGUS, by means of the increased expression of glutamine importers on the cell membrane.16 Thus, cancer cells rely heavily on their energy metabolism pathways, glycolysis, and oxidative phosphorylation via the TCA cycle.
Using transcriptomic data obtained via RNA sequencing from the prospective MMRF CoMMpass dataset, this study identified a molecular signature (i.e., EMMS) score that reflects the increased expression of specific genes responsible for the formation of proteins involved in various steps of the glycolytic and oxidative phosphorylation pathways. Furthermore, this molecular signature impacted both the PFS and OS outcomes for NDMM patients who were treated with current triplet-based induction therapy with or without the use of an ASCT. However, the most striking aspect of this molecular signature was its ability to identify those patients with high-risk cytogenetics by FISH (FIGURE 1E and 1F) and patients with ISS 2 and ISS 3 (FIGURE 1C and 1D) disease at diagnosis who would have disparate outcomes than expected. In the small subset of NDMM patients included in the GSE6477 dataset, the EMMS score was confirmed to be prognostic for OS (Figure 2D). Clinical utility of this molecular signature still needs to be validated in other datasets from larger prospective studies, and ideally in those where the NDMM patients are being treated with current induction regimens. Yet, the increasing rate of high EMMS scores among patients corresponding to the increasing malignant potential of their plasma cell disorders (i.e., NDMM > SMM > MGUS > NPCs) is supportive of its biological relevance. Our prior work has supported this observation by demonstrating that unique metabolites derived from the increased activity of the TCA cycle, such as 2-hydroxyglutarate (2-HG), have been implicated in the pathogenesis of MM.17 It would be noteworthy to see if this molecular signature could improve the identification of those patients with smoldering MM who are at very high risk of progressing to MM.18
Higher EMMS score likely indicates more aggressive disease biology of NDMM by being a transcriptomic-based reflection of the higher proliferative capacity of the MM cells. This is very akin to the historic plasma cell proliferative index produced by Greipp et al.19, where the labeling index or percentages of MM cells in the S-phase, reflects the percentage of MM cells in active cell division at a time point as demonstrated in Figure 2C. It still remains one of the strongest predictors for poor survival outcomes and had a high association with HR cytogenetics.20 However, it’s also intriguing whether pharmacologically disrupting the associated metabolic pathways could be utilized as a therapeutic opportunity for MM or as a preventive option in stopping the progression of precursor disorders like MGUS or SMM from ever progressing to MM.
There are several limitations to this study. To begin with, this was a single cohort study and the results need to be validated in other independent cohorts to confirm the prognostic value of the EMMS score. Second, unlike in the clinical trial settings where there is uniformity in therapies utilized, the therapies used for induction among the patients in the cohort were variable, but most patients received novel agent-based induction therapies. Third, not all patients in the CoMMpass study had mRNA sequencing data readily available in the IA16 release of the data and cytogenetics information on copy number abnormalities involving 1q were not available for several patients included in this cohort. Finally, while this is a prospective collection of real-world patients who chose to participate in this study, it likely does not reflect the various socioeconomic statuses of MM patients around the world, which could have impacted OS outcomes. Despite these various limitations, this study provides strong evidence and rationale for developing future mechanistic studies aimed at understanding the activity of the energy metabolism pathways in clonal plasma cells derived from patients with MM so that they could be exploited for diagnostic and therapeutic purposes in the future.21–23
Supplementary Material
SUPPLEMENTARY FIGURE 1: Kapan Meir curves comparing the OS for patients based on A) age 75 years and older, B) underwent ASCT, C) presence of HR FISH cytogenetics, D) presence of cPCs, E) ISS disease and F) elevated serum LDH level.
SUPPLEMENTARY FIGURE 4: Schematic depiction of the 12 selected genes associated with the glycolytic (glycolysis and lactate fermentation) and mitochondrial energy production (TCA cycle and electron transport chain) pathways and their individual effect on survival in NDMM based on their elevated mRNA expression (greater than median).
SUPPLEMENTARY FIGURE 3: A chart containing the chi-squared values of each gene compared to each other gene. The values of each gene for every patient were compared to the values of each other gene for every patient with a chi-squared test of independence for each of the top 12 glycolytic genes. This chart contains the resulting values, color-coded by significance. A larger number (green) indicates higher independence between the two genes, while a smaller number (red) indicates smaller independence between the two genes.
SUPPLEMENTARY FIGURE 2: A chart containing the chi-squared values of each gene compared to each other gene. The values of each gene for every patient were compared to the values of each other gene for every patient with a chi-squared test of independence for each of the top 30 mitochondrial genes. This chart contains the resulting values, color-coded by significance. A larger number (green) indicates higher independence between the two genes, while a smaller number (red) indicates smaller independence between the two genes.
ACKNOWLEDGEMENTS
Research reported in this publication was supported by Mayo Clinic Hematological Malignancies Program and in part by grants from the National Cancer Institute of the National Institutes of Health under Award Number R01 CA254961 (W.I.G) and the Multiple Myeloma Spore P50 CA186781 (R.F. and S.K.K.). The content is solely the responsibility of the authors and does not necessarily represent the official views of the National Institutes of Health. This research is also supported in part by generous funding from the Paula and Roger Riney Foundation. Finally, this research is also supported by generous funding from additional philanthropic donations to the Mayo Clinic.
Footnotes
Conflict-of-interest disclosure:
These authors declare no competing financial interests.
REFERENCES
- 1.Kumar SK, Rajkumar SV: The multiple myelomas - current concepts in cytogenetic classification and therapy. Nat Rev Clin Oncol 15:409–421, 2018 [DOI] [PubMed] [Google Scholar]
- 2.Rajkumar SV: Multiple myeloma: 2020 update on diagnosis, risk-stratification and management. Am J Hematol 95:548–567, 2020 [DOI] [PubMed] [Google Scholar]
- 3.Zhan F, Huang Y, Colla S, et al. : The molecular classification of multiple myeloma. Blood 108:2020–8, 2006 [DOI] [PMC free article] [PubMed] [Google Scholar]
- 4.Kuiper R, Broyl A, de Knegt Y, et al. : A gene expression signature for high-risk multiple myeloma. Leukemia 26:2406–13, 2012 [DOI] [PubMed] [Google Scholar]
- 5.Decaux O, Lodé L, Magrangeas F, et al. : Prediction of Survival in Multiple Myeloma Based on Gene Expression Profiles Reveals Cell Cycle and Chromosomal Instability Signatures in High-Risk Patients and Hyperdiploid Signatures in Low-Risk Patients: A Study of the Intergroupe Francophone du Myélome. Journal of Clinical Oncology 26:4798–4805, 2008 [DOI] [PubMed] [Google Scholar]
- 6.Hanahan D: Hallmarks of Cancer: New Dimensions. Cancer Discovery 12:31–46, 2022 [DOI] [PubMed] [Google Scholar]
- 7.Pavlova NN, Zhu J, Thompson CB: The hallmarks of cancer metabolism: Still emerging. Cell Metab, 2022 [DOI] [PMC free article] [PubMed] [Google Scholar]
- 8.Dang CV: Links between metabolism and cancer. Genes Dev 26:877–90, 2012 [DOI] [PMC free article] [PubMed] [Google Scholar]
- 9.Desbats MA, Giacomini I, Prayer-Galetti T, et al. : Metabolic Plasticity in Chemotherapy Resistance. Front Oncol 10:281, 2020 [DOI] [PMC free article] [PubMed] [Google Scholar]
- 10.Chng WJ, Dispenzieri A, Chim CS, et al. : IMWG consensus on risk stratification in multiple myeloma. Leukemia 28:269–77, 2014 [DOI] [PubMed] [Google Scholar]
- 11.Greipp PR, San Miguel J, Durie BG, et al. : International staging system for multiple myeloma. J Clin Oncol 23:3412–20, 2005 [DOI] [PubMed] [Google Scholar]
- 12.Warburg O: On respiratory impairment in cancer cells. Science 124:269–70, 1956 [PubMed] [Google Scholar]
- 13.Weinberg F, Chandel NS: Mitochondrial metabolism and cancer. Ann N Y Acad Sci 1177:66–73, 2009 [DOI] [PubMed] [Google Scholar]
- 14.Gao P, Tchernyshyov I, Chang TC, et al. : c-Myc suppression of miR-23a/b enhances mitochondrial glutaminase expression and glutamine metabolism. Nature 458:762–5, 2009 [DOI] [PMC free article] [PubMed] [Google Scholar]
- 15.Dang CV: Rethinking the Warburg effect with Myc micromanaging glutamine metabolism. Cancer Res 70:859–62, 2010 [DOI] [PMC free article] [PubMed] [Google Scholar]
- 16.Gonsalves WI, Jang JS, Jessen E, et al. : In vivo assessment of glutamine anaplerosis into the TCA cycle in human pre-malignant and malignant clonal plasma cells. Cancer Metab 8:29, 2020 [DOI] [PMC free article] [PubMed] [Google Scholar]
- 17.Gonsalves WI, Ramakrishnan V, Hitosugi T, et al. : Glutamine-derived 2-hydroxyglutarate is associated with disease progression in plasma cell malignancies. JCI Insight 3, 2018. [DOI] [PMC free article] [PubMed] [Google Scholar]
- 18.Mateos MV, Kumar S, Dimopoulos MA, et al. : International Myeloma Working Group risk stratification model for smoldering multiple myeloma (SMM). Blood Cancer J 10:102, 2020 [DOI] [PMC free article] [PubMed] [Google Scholar]
- 19.Greipp PR, Kumar S: Plasma cell labeling index. Methods Mol Med 113:25–35, 2005 [DOI] [PubMed] [Google Scholar]
- 20.Trendle MC, Leong T, Kyle RA, et al. : Prognostic significance of the S-phase fraction of light-chain-restricted cytoplasmic immunoglobulin (cIg) positive plasma cells in patients with newly diagnosed multiple myeloma enrolled on Eastern Cooperative Oncology Group treatment trial E9486. Am J Hematol 61:232–7, 1999 [DOI] [PubMed] [Google Scholar]
- 21.Gonsalves WI, Devarakonda S, Baz R, et al. : Trial in Progress: Phase I Dose-Escalation and Dose-Expansion Trial of a Novel Glutaminase Inhibitor (CB-839 HCl) in Combination with Carfilzomib and Dexamethasone in Relapsed and/or Refractory Multiple Myeloma. Blood 134:3160–3160, 2019 [Google Scholar]
- 22.Bajpai R, Sharma A, Achreja A, et al. : Electron transport chain activity is a predictor and target for venetoclax sensitivity in multiple myeloma. Nature Communications 11:1228, 2020 [DOI] [PMC free article] [PubMed] [Google Scholar]
- 23.Gonsalves WI, Kumar S, Perez G, et al. : Trial in Progress: Phase I Open-Label Study of Metformin and Nelfinavir in Combination with Bortezomib in Patients with Relapsed and/or Refractory Multiple Myeloma. Blood 138:2735–2735, 2021 [Google Scholar]
Associated Data
This section collects any data citations, data availability statements, or supplementary materials included in this article.
Supplementary Materials
SUPPLEMENTARY FIGURE 1: Kapan Meir curves comparing the OS for patients based on A) age 75 years and older, B) underwent ASCT, C) presence of HR FISH cytogenetics, D) presence of cPCs, E) ISS disease and F) elevated serum LDH level.
SUPPLEMENTARY FIGURE 4: Schematic depiction of the 12 selected genes associated with the glycolytic (glycolysis and lactate fermentation) and mitochondrial energy production (TCA cycle and electron transport chain) pathways and their individual effect on survival in NDMM based on their elevated mRNA expression (greater than median).
SUPPLEMENTARY FIGURE 3: A chart containing the chi-squared values of each gene compared to each other gene. The values of each gene for every patient were compared to the values of each other gene for every patient with a chi-squared test of independence for each of the top 12 glycolytic genes. This chart contains the resulting values, color-coded by significance. A larger number (green) indicates higher independence between the two genes, while a smaller number (red) indicates smaller independence between the two genes.
SUPPLEMENTARY FIGURE 2: A chart containing the chi-squared values of each gene compared to each other gene. The values of each gene for every patient were compared to the values of each other gene for every patient with a chi-squared test of independence for each of the top 30 mitochondrial genes. This chart contains the resulting values, color-coded by significance. A larger number (green) indicates higher independence between the two genes, while a smaller number (red) indicates smaller independence between the two genes.