

Abstract
Introduction
Carbon monoxide (CO) is a colorless and odorless gas that is a leading cause of environmental poisoning in the USA with substantial mortality and morbidity. The mechanism of CO poisoning is complex and includes hypoxia, inflammation, and leukocyte sequestration in brain microvessel segments leading to increased reactive oxygen species. Another important pathway is the effects of CO on the mitochondria, specifically at cytochrome c oxidase, also known as Complex IV (CIV). The purpose of this ongoing study is the preliminary development of a porcine model of CO poisoning for investigation of alterations in brain mitochondrial physiology.
Methods
Four pigs (10 kg) were divided into two groups: Sham (n = 2) and CO (n = 2). Administration of a dose of CO at 2000 ppm to the CO group over 120 minutes followed by 30 minutes of re-oxygenation at room air. The control group received room air for 150 minutes. Non-invasive optical monitoring was used to measure CIV redox states. Cerebral microdialysis was performed to obtain semi real-time measurements of cerebral metabolic status. At the end of the exposure, fresh brain tissue (cortical and hippocampal) was immediately harvested to measure mitochondrial respiration. Snap frozen cortical tissue was also used for ATP concentrations and western blotting.
Results
While a preliminary ongoing study, animals in the CO group showed possible early decreases in brain mitochondrial respiration, citrate synthase density, CIV redox changes measured with optics, and an increase in the lactate-to-pyruvate ratio.
Conclusions
There is a possible observable phenotype highlighting the important role of mitochondrial function in the injury of CO poisoning.
Supplementary Information
The online version contains supplementary material available at 10.1007/s13181-022-00892-5.
Keywords: Mitochondria, Carbon monoxide, Basic science, Biomarker, Optics
Introduction
Carbon monoxide (CO) is a colorless and odorless gas that is a leading cause of environmental poisoning in the USA with substantial mortality and morbidity [1]. Specifically, there are over 50,000 CO poisoning cases seen in emergency departments in the USA annually, with over half requiring hospitalization [2]. The most serious complications for survivors of consequential CO exposure are neurologic failure with delayed neurological sequelae (DNS) occurring in up to 50% of patients. It is conservatively estimated that CO poisoning results in over $1 billion annually from hospital costs and lost earnings. DNS can be delayed up to weeks after CO exposure and deficits may persist for over a year or longer. At this time, there are no reliable biomarkers to detect who may develop DNS and represents an important area of ongoing research [3].
The mechanism of CO poisoning is complex and includes hypoxia, inflammation, and leukocyte sequestration in brain microvessel segments leading to increased reactive oxygen species [4, 5]. Another important mechanism of injury specifically includes targeted effects at the level of the mitochondria. CO inhibits cytochrome c oxidase, also known as complex IV (CIV) of the mitochondrial electron transport system (ETS), which can result in bioenergetic failure, propagation of reactive oxygen species (ROS) through reverse electron transport (RET), and organ dysfunction [4, 6]. Our previous works have implicated the complex role that the mitochondria may have in CO poisoning from in vitro cell-based work to animal models of CO poisoning and clinical subjects with CO poisoning [7–9].
While the mitochondria perform multiple essential functions, their primary function includes energy production, and they may be the final regulator determining cellular fate following injury and poisoning [10–12]. Mitochondria play a central role in cellular metabolism where consumption of molecular oxygen (O2) through the ETS is tightly coupled to ATP production, regulated by metabolic demand. Failure of the mitochondria to use O2 to sustain ATP production results in an energy deficit that can impair cell function [13, 14]. Decreased ATP production in samples obtained from patients with critical illness has been linked to increased mortality and morbidity [15–17].
The primary objective of this preliminary ongoing study was to use our newly established porcine model of acute CO poisoning to further distinguish between mitochondrial mechanisms of CO poisoning [9]. We targeted the brain using an innovative multimodal platform that combines mitochondrial respirometry, cerebral microdialysis, and broadband diffuse optical spectroscopy techniques to measure the effects of acute CO exposure on cerebral metabolism. Specifically, both phosphorylating and non-phosphorylating respiration shortly after CO exposure were evaluated with respirometry, biomarkers of anaerobic metabolism during exposure were evaluated with microdialysis, and redox changes in CIV during exposure were continuously monitored with broadband diffuse optical spectroscopy.
Material and Methods
Animals and Overall Study Design
All procedures were approved by the Institutional Animal Care and Use Committee at the Children’s Hospital of Philadelphia (CHOP) and performed in accordance with the National Institutes of Health Guide for the Care and Use of Laboratory Animals. Yorkshire pigs (weight ~10 kg and approximately 1–2 months of chronological age) of equal sexes mimicking younger adolescents were used for this preliminary ongoing study [18]. While many experimental models of CO poisoning involve small animals, there are numerous instances where the pig may be considered a translational model of biomedical research because of anatomical, physiological, and biochemical similarity to humans. For example, phase I and phase II biotransformation reactions have been well-studied and is similar between pigs and humans. Pigs are a well-recognized model for cardiovascular and neural disease [19]. All pigs that arrived underwent an entrance exam that included a baseline physical exam and assessment by veterinary staff that include fecal occult testing for parasites and were required to acclimate for a minimum of 1 day prior to any scheduled experiments that is non-survival. All subject animals were randomized 1:1 prior to arrival. All animals were premedicated with 20 mg/kg ketamine, followed by inhaled isoflurane in 100% oxygen though a snout mask. They were then intubated as described below, and oxygen was weaned to room air. The animals were allocated to 2 different treatment groups: Sham (n = 2) and CO (n = 2) for this preliminary ongoing study.
Perioperative Procedures and Monitoring
Ventilator settings were as follows: tidal volume 10–11 mL/kg, positive end-expiratory pressure 5 cm H2O, and respiratory rate titrated to achieve end-tidal CO2 38–42 mmHg to minimize potential confounding changes in cerebral blood flow and acid–base status. The right femoral artery and vein were cannulated for arterial pressure monitoring and central venous access. Isoflurane was weaned to approximately 0.5–1% to simulate human anesthetic protocols and minimize confounding toxicity and cerebral blood flow changes associated with higher doses of isoflurane [20]. A rectal temperature probe was placed. All data were recorded with PowerLab 16/35 LabChart 8 Pro software from ADInstruments (Sydney, Australia).
Carbon Monoxide Experimental Protocol
An endobronchial tube (left) 32 Fr/Ch (10.7 mm) from Covidien (owned by Medtronic in Dublin, Ireland) was used to intubate each animal. The 32 Fr tracheal lumen was connected to the vent and the bronchial lumen was attached to the CO tank described below. Only the tracheal cuff (7 cc) was inflated, and the bronchial cuff was left deflated to allow the passage of CO. CO was administered with a 2000 ppm CO tank 244 cf using a regulator 0–10 L/minute with flow meter from Airgas (Radnor Township, PA, USA). Our prior work utilized 400 ppm and we used 2000 ppm which correlate with severe human exposure. The CO concentration entering the endobronchial tube was monitored using an inspector CO detector with a 0–2000 ppm range (Sensorcon, NY, USA). Animals in the CO group received CO at 2000 ppm for 120 minutes followed by 30 minutes of room air to mimic removal of subjects from a CO exposure. Animals in the Sham group received 150 minutes of room air. Sedation was maintained with the use of fentanyl (5 μg/kg/hour) and dexmedetomidine (2 μg/kg/hour) during the CO gas exposure with discontinuation of isoflurane once the exposure was initiated.
Non-Invasive Optical Monitoring of CIV Redox Changes
We built a broadband diffuse optical spectroscopy (bDOS) instrument to non-invasively monitor changes in mitochondrial CIV (i.e., cytochrome c oxidase) redox state [21]. The instrument uses a broadband lamp (HL-2000_HP-FHSA, Ocean Optics, Dunedin, FL, USA) and a custom f/1.5 high throughput spectrometer (650–1050 nm spectral range, 100 μm slit width, 0.86 nm FWHM resolution, TEC cooled to −15 °C; Wasatch Photonics, Morrisville, NC, USA) to optically monitor cerebral tissues with one source-detector pair. The source and detector were coupled to fiberoptic bundles (Source fiber bundle: 2.5 mm core, 0.55 NA, Fiberoptics Technology Inc, Pomfret, CT; Detector fiber bundle: 1 mm core diameter, 0.44 NA, Fiberoptics Technology Inc, Pomfret, CT) which were placed on the right forehead with a source-detector separation of 3.0 cm. Optical reflectance measurements were acquired between 650 and 1050 nm (spectral resolution of 0.86 nm, with net temporal resolution of 10 s).
The brain’s wavelength-dependent light absorption depends linearly on the concentrations of absorbing chromophores in the brain (e.g., oxy-, deoxy-, and carboxyhemoglobin in blood; oxidized and reduced CIV in mitochondria). Given that each tissue chromophore has a unique wavelength-dependent absorption signature, it is feasible to isolate the CIV influence on the brain’s absorption spectrum from other tissue chromophores. We specifically used the UCLn algorithm to compute changes in cerebral oxidized CIV concentration from the measured wavelength-dependent changes in optical attenuation signals between 780 and 1000 nm wavelengths [22, 23]. Changes are relative to a 5 minutes optical baseline acquired immediately prior to the start of CO exposure. The UCLn algorithm assumes that total cytochrome-c-oxidase concentration remains temporally constant. Hence, changes in oxidized CIV concentration reflect redox changes of CIV.
Of note, the broadband lamp shutter was sequentially opened and closed to take cerebral tissue absorption spectra and “background absorption” spectra measurements. Each of these measurements were taken every second over a period of 5 s (for a total of five spectra) and then averaged. This led to one tissue absorption spectra averaged over 5 s and one background spectra averaged over 5 s. The averaged background absorption measurement was subtracted from its corresponding averaged tissue absorption spectra measurement to correct for room light effects on the optical attenuation signals. After subtraction, the net temporal resolution for the measurement was 10 s [9]. At the conclusion of each experiment, the thickness of the skull was measured post-mortem to correct for the signal and we have validated in other pig models of critical care [22–24].
Measurement of Cerebral Microdialysis
Cerebral microdialysis (cMD) allows bedside semicontinuous monitoring of brain extracellular fluid. cMD was placed in the left frontal cortex using a CMA 70 Elite from mDialysis (Stockholm, Sweden). Probes were placed 0.5–1 cm deep in the brain parenchyma. Sterile saline was perfused at 1 μl/minute, and after a 30 minutes calibration period, samples were collected in 30-minute intervals starting 30 minutes after exposure (room air vs CO) so there is no true “baseline” at T0 as the primary interest was at the end of the exposure. Samples were immediately frozen at −80 °C. Pyruvate, lactate, glycerol, and glucose concentrations were analyzed in a blinded fashion using the automated ISCUS FlexTM Microdialysis Analyzer and data were processed using the ICUpilot software from mDialysis. Lactate and pyruvate values were used to calculate a lactate-to-pyruvate ratio (LPR) to assess for redox balance.
Tissue Extraction and Preparation
Isolated Brain Mitochondria
Upon completion of the protocol described above, animals were euthanized with potassium chloride prior to brain tissue collection with part of the brain tissue snap frozen for later western blotting and ATP analysis. Brain tissue then immediately underwent rapid but gentle dissection (cortical and hippocampal tissue) to specifically obtain isolated mitochondria and was then transferred into ice-cold isolation buffer solution (320 mM sucrose, 2 mM EGTA, 10 mM Trizma base, pH 7.4). Brain tissue was also transferred into ice-cold 1X brain buffer (made from 0.5 L of 2X buffer: 225 mM D-mannitol, 75 mM sucrose, 5 mM HEPES, 1 mM EGTA, and 0.5 L of double deionized water, pH 7.4), manually homogenized in 0.2% BSA buffer (catalog A6003) and centrifuged at 1300g and 4 °C to separate the fatty pellet from supernatant. Consequently, the supernatant was centrifuged for 10 minutes at 21,000g to extract pellet. Brain mitochondria were isolated from the derived pellet by differential centrifugation and application of density gradients using 15%, 23%, and 40% Percoll (GE Healthcare cat. no. 17089101). Protein count for isolated mitochondria was obtained with a Pierce BCA Protein Assay kit (catalog 23227) from Thermo Fisher Scientific (Waltham, MA, USA).
Measurement of Mitochondrial Respiration in Isolated Brain Mitochondria
Mitochondrial respiratory function was analyzed using Oroboros O2k-FluoRespirometers (Oroboros Instruments, Innsbruck, Austria) with a substrate-uncoupler-inhibitor titration (SUIT) protocol as previously described in our work. The SUIT protocol measures oxidative phosphorylation capacity with electron flow through both complex I (CI) and complex II (CII) respectively, as well as the convergent electron input (CI + CII) using the nicotinamide adenine dinucleotide-linked substrates, malate, pyruvate, and glutamate, as well as the flavin adenine dinucleotide-linked substrate succinate, both in the presence of adenosine diphosphate. Oxidative phosphorylation produces adenosine triphosphate (ATP), which is the primary fuel for performing basic function. During times of stress and injury, increased maximal oxidative phosphorylation is necessary for neuronal salvage and repair because of the high energy requirements of neurons. Maximal convergent non-phosphorylating respiration of ETSCI+CII is evaluated by titrating the protonophore, carbonyl cyanide p-(trifluoromethoxy) phenylhydrazone. ETSCI+CII is considered a stress test for mitochondria, as a marker of mitochondrial respiratory reserve. Non-phosphorylating respiration through CII (ETSCII) is achieved through the addition of rotenone. The complex III (CIII) inhibitor antimycin A is added to measure the residual non-mitochondrial oxygen consumption, and this value was subtracted from each of the measured respiratory states to provide only mitochondrial respiration. CIV-linked respiration was measured by the addition of N,N,N,N-tetramethyl-phenylenediamine together with ascorbate. The CIV inhibitor sodium azide was added to reveal the chemical background that is subtracted from the N,N,N,N-tetramethyl-phenylenediamine-induced oxygen consumption rate. Further details such as chamber final concentration can be found in our previous works [8, 12]. All data were acquired using DatLab 7 (Oroboros Instruments, Innsbruck, Austria) and respiration value was normalized to protein count for the brain.
Western Blot Protocol
Western blot was performed on tissue with all reagents and antibodies purchased from Invitrogen (Carlsbad, CA, USA) unless otherwise noted. Brain tissue were incubated on ice in RIPA lysis and extraction buffer (catalog 89900) containing Pierce protease inhibitor (catalog A32963) for 5 minutes. Tissues were homogenized with the electric homogenizer and then subjected to centrifugation at 14,000g at 4 °C for 10 minutes with collection of the supernatant. Protein concentrations of the supernatant were quantified using a Pierce BCA Protein Assay Kit from Thermo Fisher Scientific (Waltham, MA, USA).
Equal protein content was then loaded into each well of 4–12% Bis-Tris gel and separated by sulfate-polyacrylamide gel electrophoresis (SDS-PAGE). Gel proteins were transferred onto a nitrocellulose membrane (catalog IB23001) and then incubated with a citrate synthase (CS) recombinant rabbit monoclonal antibody (catalog 3H8L26) with dilution factor of 1:4000 in the iBind solution (catalog SLF1020). Primary rabbit monoclonal anti-glyceraldehyde 3-phosphate dehydrogenase (GAPDH) antibody conjugated to horseradish peroxidase (HRP) (#3683 Cell Signaling Technology; 1:1000) was used as an internal control. CS levels were detected using goat anti-rabbit IgG secondary antibody conjugated to HRP (catalog A16096; 1:400) and a chemiluminescent substrate reagent kit.
The same method was performed to obtain protein quantification of components of the ETS using a complex IV subunit IV. Gel proteins were transferred onto a PVDF membrane (catalog IB24001) and then incubated with a complex IV monoclonal antibody (catalog #A21348) with a dilution factor of 1:4000 in iBind solution (catalog SLF1020). Primary mouse monoclonal anti-GAPDH antibody (GA1R) conjugated to HRP 1:1333 (MA5-15738) was used as an internal control. Complex IV protein concentrations were detected using rabbit anti-mouse IgG secondary antibody conjugated to HRP (catalog A16160, 1:1600) and a chemiluminescent substrate reagent kit. Immunoblotting steps were done in an iBind Western Device (Invitrogen). iBright Analysis Software (Thermo Scientific) was used in the quantification and densitometric analysis of the blots. All experiments were performed in duplicates and the local background corrected density values were normalized against respective GAPDH (CS) and GA1R (complex IV) values. iBright Analysis Software (Thermo Scientific) was used in the quantification and densitometric analysis of the blots.
ATP Fluorometry
ATP concentrations were obtained in snap frozen brain from the same subject animals using an ATP fluorometric assay kit (Sigma MAK190). Tissue was electrically homogenized in 1.5 mL centrifuge tube to obtain a concentration of 10 mg weight tissue/100 μL ATP assay buffer per well. A 0.1 mM ATP standard was created with an ATP concentration range of 0 to 1000 pmol/μL. Fifty microliters of the homogenized sample and standards was loaded in duplicates in a 96-well opaque well plate. The loaded plate was briefly mixed on a shaker and incubated at room temperature for 30 minutes. ATP fluorometry was measured at excitation and emission values of 535 and 587 nm, respectively. All values were corrected for background and glycerol phosphate (no addition of ATP converter).
Statistics and Data Analysis
Data and figures were analyzed using GraphPad Prism version 8.0.0 for Mac, GraphPad Software (San Diego, CA, USA). Due to the small sample size for this preliminary research, no statistical testing was performed.
Result
Baseline Characteristics, Blood Gas Chemistry, and Hemodynamics variables
The baseline characteristics such as weight between the Sham and CO groups are reported along with the COHb level in Table 1. There were 2 subject animals in each group of equal sexes. The variables reported are at the 150 minutes time point (120 minutes of CO exposure followed by 30 minutes of room air or 150 minutes of room air for the Sham group).
Table 1.
Group characteristics at post 2-hour exposure. PaCO2, partial pressure of arterial carbon dioxide
| Group characteristics | ||
|---|---|---|
| Variable | Sham | CO (2000 ppm) |
| (n = 2) | (n = 2) | |
| Weight (kg) | 10.5 and 10 | 10.8 and 10.4 |
| Blood gases | ||
| pH | 7.41 and 7.45 | 7.55 and 7.45 |
| PaCO2 (mmHg) | 46 and 47 | 48.5 and 49.5 |
| Lactate (mmol/L) | 1.1 and 1.3 | 0.9 and 1 |
| COHb (%) | 1.4 and 1.6 | 44.5 and 46.5 |
| Hemodynamics | ||
| Heart rate (bpm) | 111 and 113 | 111 and 131 |
| Mean arterial pressure (mmHg) | 66 and 68 | 57 ad 59 |
All values are represented as individual values
Mitochondrial Respiration
Respiration was obtained in isolated mitochondria from both cortical and hippocampal tissue obtained after the end of the experiment for immediate high-resolution respirometry to obtain key respiratory states such as CIV respiration (Fig. 1a and b). Individual values for each state can also be found in Table 2.
Fig. 1.

Isolated mitochondrial respiration of cortical and hippocampal tissue. Key respiration states of isolated mitochondria from cortical and hippocampal issue. Values expressed individually also seen in Table 2. OXPHOS, oxidative phosphorylation; ETS, electron transport chain; C, complex
Table 2.
Values for mitochondrial respiration
| Mitochondrial respiration (pmol O2 • s−1 • μg of protein−1) | ||||
|---|---|---|---|---|
| Sham group | CO group | |||
| Respiratory parameters | Cortex | Hippocampus | Cortex | Hippocampus |
| OXPHOS | 1506, 2532 | 1102, 2102 | 1024, 1189 | 650, 542 |
| OXPHOSCI | 2147, 2548 | 1468, 2366 | 1122, 1303 | 704, 587 |
| OXPHOSCI+CII | 4333, 3678 | 3504, 4257 | 2300, 2670 | 2275, 1869 |
| ETSCI+CII | 4261, 3495 | 4145, 3965 | 2150, 2469 | 2269, 1891 |
| ETSCII | 2502, 1855 | 2541, 2615 | 1408, 1634 | 1684, 1404 |
| CIV | 6410, 4757 | 5629, 6069 | 3808, 4420 | 3967, 3306 |
Non-Invasive Neuromonitoring with bDOS
bDOS measurements with adequate signal-to-noise and background correction were acquired for one subject animal in each group (Fig. 2). As expected, oxidized CIV decreased during CO exposure (with a proportional increase in the reduced CIV concentration). There was an increase in the Sham group over time.
Fig. 2.
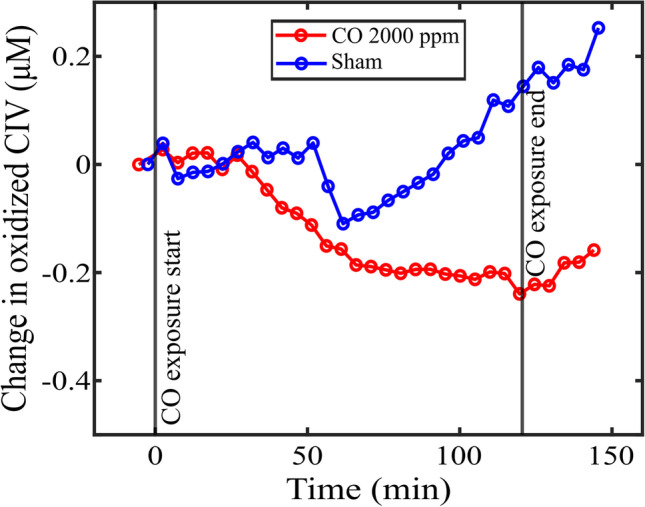
Non-invasive measure of change in oxidized complex IV concentrations. Temporal plots of optically measured changes in oxidized complex IV (CIV) in two pigs. One pig was exposed to 120 minutes of carbon monoxide (CO) at 2000 ppm (COHb of 45.5%; black curve), while the other pig was a sham (red curve). CO binds to CIV, limiting the oxygen coupling to CIV, which in turn leads to a decrease in the total amount of oxidized CIV (with a proportional increase in the reduced CIV concentration). The y-axis is a relative change from baseline: a −4 μM change in oxidized CIV (i.e., oxidized version of the cytochrome C oxidase) at the end of exposure means that the total concentration of the oxidized enzyme was reduced by 4 μM
Cerebral Microdialysis
Cerebral microdialysis (cMD) samples were taken at 30 minutes time points during the 150 minutes period after the start of the exposure so the first measurement is 30 minutes after the start of the experiment. We measured the following substrates to gauge cerebral metabolism: lactate, pyruvate, glycerol, and glucose. We calculated the extracellular cerebral lactate: pyruvate ratio (LPR) which is often used as a marker of metabolic stress and may indicate mitochondrial dysfunction with a high lactate to pyruvate ratio (above 20 indicate defects in the respiratory chain) [25]. The individual LPR values for Sham subject 1 are 12, 11, 11, and 10 and for Sham subject 2 are 17, 17, 16, and 18. The individual LPR values for CO subject 1 are 29, 20, 30, and 35 and for CO subject 2 are 23, 24, 22, and 24 (Fig. 3).
Fig. 3.
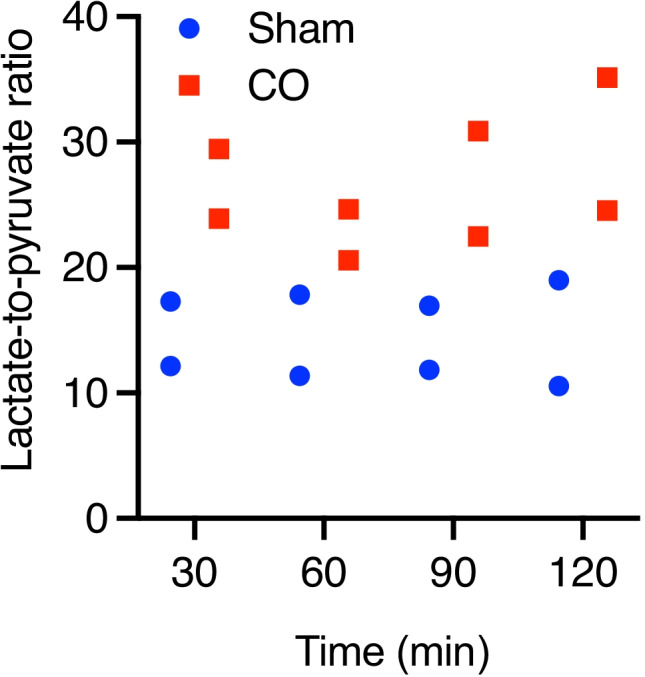
Cerebral microdialysis (cMD) measurements during CO exposure. Semi real-time measurements of cerebral metabolism taken every 30 minutes. Cerebral LPR between the two groups is shown at the specified time point (only LPR ratio shown). Values expressed individually. LPR, lactate/pyruvate ratio
ATP Concentration
ATP concentrations using fluorometric detection corrected for background was obtained in snap frozen brain cortical tissue (not hippocampal due to availability to obtain respirometry data). The individual ATP values for the Sham group are 1268836, 809754, 937514, and 380964 and for CO group are 521819, 961524, 363605, and 550552 (Fig. 4).
Fig. 4.
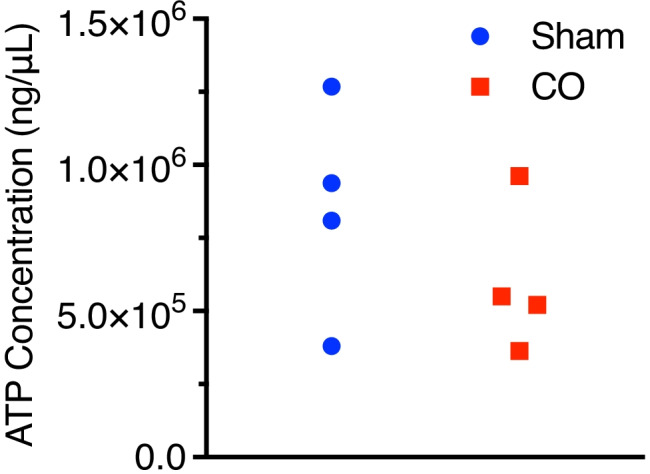
Adenosine triphosphate (ATP) concentrations. ATP concentrations were obtained using an ATP fluorometric assay in snap frozen brain tissue from all subject animals. Values expressed individually. ATP, adenosine triphosphate
Western Blot for Citrate Synthase Content and CIV
Supplementary Fig. 1a illustrates the relative density values for CS and GAPDH used as a housekeeping protein obtained in snap frozen cortical brain tissue in the 2 groups. Supplementary Fig. 1b shows the Western blot image with the ~45kDa band corresponding to the molecular weight of CS protein was detected using a polyclonal secondary antibody against a rabbit monoclonal anti-CS primary that is known to bind human CS. A second band was detected at ~37kDa using a monoclonal rabbit anti-GAPDH antibody known to detect human GAPDH.
Supplementary Fig. 2a illustrates the relative density values for complex IV and GA1R as a housekeeping protein obtained in snap frozen cortical brain tissue in the two groups. Supplementary Fig. 2b shows that the Western blot image with the ~18kDa band corresponding to the molecular weight of complex IV protein was detected using a rabbit anti-mouse IgG secondary antibody. A second band was detected at ~37kDa using a monoclonal mouse anti-GAPDH (GA1R) antibody.
Discussion
The objective was to investigate alterations in mitochondrial function in the brain combining non-invasive optical devices measuring CIV redox states, a key target of CO. We have leveraged our developed porcine model of acute CO poisoning with robust cellular measures of cerebral metabolism for this preliminary ongoing study. We utilized pigs that mimic the adolescent stage of development with respect to neurologic and cardiac growth [18]. We employed innovative non-invasive continuous measurements of cerebral CIV redox states, as well as measures of cerebral metabolism (cMD) and cellular function (respiration and ATP). While we used a high concentration of CO (2000 ppm), the two subject animals survived until the end of the exposure time. It should be noted that our two CO pigs demonstrated a normal lactate and maintained normal blood pressures that highlight a high dose of CO may affect individuals differently. In early testing of this dose for the development of CO delivery, we have found some animals requiring early vasoactive support and some who survived with minimal changes in lactate and vitals although all animals had high COHb (> 45%). Early findings suggest a mitochondrial dysfunction in hippocampal tissue corresponding with an elevated LPR and a decrease in mitochondria content (citrate synthase). These findings correspond to our preliminary data of CIV redox states, as measured with the optical bDOS technique.
We performed an in-depth analysis of mitochondrial respiration in the brain as this is the primary organ affected by CO. While CO has multiple mechanisms of action that includes hypoxia and inflammation, its effect on mitochondrial function and downstream effects is less clear, which we aim to further advance for future diagnostic and therapeutic application. Our prior studies have strongly implicated the effects of CO on cellular respiration, particular at CIV with resultant cellular dysfunction [7–9]., While only a small number of animals are included, there was also reduced respiration with CO exposure at many respiratory states. The hippocampus is in the region of the brain that is associated primarily with memory and the regulation of emotional responses. The hippocampus is sensitive to ischemia and is commonly injured in CO poisoning leading to DNS.
In addition to the measurement of cellular respiration, we also measured ATP concentrations in snap frozen tissue with the use of fluorometric analysis. Failure of the mitochondria to use O2 to sustain ATP production results in an energy deficit that can impair cellular function. Decreased mitochondrial activity and low ATP levels in muscle biopsies have also been linked to death in other forms of shock such as sepsis while survivors demonstrated higher levels of ATP, presumable allowing the cells to meet the bioenergetic demands that occur in sepsis [26]. While our sample size is too small to make any meaningful comparison, ATP measurements is an important biomarker of mitochondrial function. Since the primary function of the mitochondria is to generate ATP for cellular bioenergetic function, having the ability to measure this critical molecule in relation to respiration will be important for future studies.
We also measured CS and CIV protein density in both conditions using western blotting. CS is a pace-maker enzyme in the Krebs cycle with a molecular weight of 85kDa localized in the mitochondrial matrix. Complex IV is part of the electron transport system that accepts electrons from cytochrome c (through complex III) and contributes to the proton gradient in the generation of ATP. CS and CIV are appropriate as quantitative marker enzymes for the content of intact mitochondria since a possible factor in changes in respiration and may be related to a change in the number of mitochondria content measured as CS or functional changes in CIV [9]. While further work in this area is required, CO may result in changes in mitochondrial content measured, and more research can be done to study further the effects of CO poisoning on the other complexes of the electron transport chain.
A novel aspect was the use of noninvasive optical neuromonitoring to monitor CIV redox states in conjunction with our mitochondrial analysis. While only encompassing only one subject from each group, the trends indicate there are changes in CIV redox states in the pig exposed to 2000 ppm when compared to a sham pig. Further studies are required to validate the correlation of optical neuromonitoring of CIV redox states and the downstream cellular changes observed in this preliminary work. One of the strengths of optical monitoring is the potential of future clinical application, currently under investigation for other areas of acute injury including cardiac arrest and traumatic brain injury. It is known that a peripheral COHb is a poor indicator of CO severity with poor prognostic function and an inability to monitor response to treatment. The use of optical devices to measure both CIV redox states and eventually cerebral COHb may address this very important gap in the field of CO research.
We also measured concentrations of glucose, glycerol, lactate, and pyruvate across the exposure period to examine changes in cerebral metabolism related to the CIV inhibition caused by CO. In our prior study, we demonstrated abnormal cerebral metabolism with an LPR that was higher than shams in that study [9]. In general, an LPR of greater than 20 often indicate cellular dysfunction [25]. While only a small number of subject animals, the LPR in the CO group was above 20 the entire exposure period, which further supports the mitochondrial dysfunction observed in the brain.
There are some limitations to consider aside from the small subject numbers. One limitation is we used only one dose of CO exposure (2000 ppm versus 400 ppm from our previous study) and future studies should ideally employ a varying dose of CO to evaluate for a dose-dependent effect on cellular function and optical measurements. The same limitation also applies to the duration of CO exposure, which needs to be varied in future studies. We arbitrarily choose a duration of 120 minutes followed by 30 minutes of room air to best mimic an acute CO exposure as opposed to a longer time that may be more consistent with chronic CO poisoning. The optical CIV measurements also assumed that total CIV concentration (i.e., the sum of oxidized and reduced CIV) remained constant during CO exposure. The effects of COHb on the CIV measurements were also neglected. The effects of COHb on absorption spectra within the 780–1000 nm wavelength range used for analysis are expected to be small [6]. In future work, as we noted above, we will investigate the feasibility of direct optical measurements of COHb in cerebral tissues. Finally, while most clinically significant CO poisoning occurs in adults, the area of CO poisoning in the pediatric population is limited which this ongoing study seeks to address.
In conclusion, our preliminary work reveals that even with our small group sizes, there were potential early changes in cellular function that includes CIV inhibition of hippocampal tissue (the tissue most sensitive to CO) along with potential changes in cerebral metabolism. This preliminary research does highlight the complex mitochondrial mechanism that warrant further investigation and may represent an important pathway for therapy at the level of the mitochondria.
Supplementary Information
Below is the link to the electronic supplementary material.
Supplementary Figure 1a– Citrate synthase relative density value for brain tissue. Relative density value for citrate synthase corrected for glyceraldehyde-3-phosphate dehydrogenase (GAPDH) used as a housekeeping protein obtained in snap frozen brain tissue. Values expressed individually with replicates done as described in methods. (PNG 87 kb)
Supplementary Figure 1b– Western Blot Image of Citrate Synthase. Citrate synthase and glyceraldehyde-3-phosphate dehydrogenase (GAPDH) used as a housekeeping protein demonstrating the protein signal in the two groups in from snap frozen brain tissue. (PNG 21 kb)
Supplementary Figure 2a– Complex IV antibody relative density value for brain tissue. Relative density value for Complex IV corrected for anti-GAPDH antibody (GA1R) loading control used as a housekeeping protein obtained in snap frozen brain tissue. Values expressed individually with replicates done as described in methods. (PNG 80 kb)
Supplementary Figure 2b– Western Blot Image of Complex IV subunit antibody. Complex IV and anti-GAPDH antibody (GA1R) used as a housekeeping protein demonstrating the protein signal in the two groups in from snap frozen brain tissue. (PNG 165 kb)
Funding
1. K08HL136858 (DJ)
2. R21ES031243 (DJ)
3. R03HL154232 (DJ)
4. R56HL158696 (DJ)
5. R01HL141386 (TK)
6. R01NS113945 (WB)
7. P30ES013508
Declarations
Conflict of Interest
None
Footnotes
The original version of this article was revised: The name of coauthor Alistair Lewis was presented incorrectly (as “Alistair T. Lewis”) in this article as originally published.
Publisher’s Note
Springer Nature remains neutral with regard to jurisdictional claims in published maps and institutional affiliations.
Change history
12/12/2022
A Correction to this paper has been published: 10.1007/s13181-022-00913-3
Contributor Information
Alistair Lewis, Email: lewisa13@chop.edu.
David H. Jang, Email: david.jang@pennmedicine.uphs.edu
References
- 1.Yoon SS, Macdonald SC, Parrish RG. Deaths from unintentional carbon monoxide poisoning and potential for prevention with carbon monoxide detectors. JAMA. 1998;279(9):685–687. doi: 10.1001/jama.279.9.685. [DOI] [PubMed] [Google Scholar]
- 2.Rose JJ, Wang L, Xu Q, McTiernan CF, Shiva S, Tejero J, et al. Carbon monoxide poisoning: pathogenesis, management, and future directions of therapy. Am J Respir Crit Care Med. 2017;195(5):596–606. doi: 10.1164/rccm.201606-1275CI. [DOI] [PMC free article] [PubMed] [Google Scholar]
- 3.Pepe G, Castelli M, Nazerian P, Vanni S, Del Panta M, Gambassi F, et al. Delayed neuropsychological sequelae after carbon monoxide poisoning: predictive risk factors in the Emergency Department. A retrospective study. Scand J Trauma Resusc Emerg Med. 2011;19:16. doi: 10.1186/1757-7241-19-16. [DOI] [PMC free article] [PubMed] [Google Scholar]
- 4.Taskiran D, Kutay FZ, Pogun S. Effect of carbon monoxide on dopamine and glutamate uptake and cGMP levels in rat brain. Neuropsychopharmacology. 2003;28(6):1176–1181. doi: 10.1038/sj.npp.1300132. [DOI] [PubMed] [Google Scholar]
- 5.Thom SR. Leukocytes in carbon monoxide-mediated brain oxidative injury. Toxicol Appl Pharmacol. 1993;123(2):234–247. doi: 10.1006/taap.1993.1242. [DOI] [PubMed] [Google Scholar]
- 6.Akyol S, Erdogan S, Idiz N, Celik S, Kaya M, Ucar F, et al. The role of reactive oxygen species and oxidative stress in carbon monoxide toxicity: an in-depth analysis. Redox Rep. 2014;19(5):180–189. doi: 10.1179/1351000214Y.0000000094. [DOI] [PMC free article] [PubMed] [Google Scholar]
- 7.Jang DH, Kelly M, Hardy K, Lambert DS, Shofer FS, Eckmann DM. A preliminary study in the alterations of mitochondrial respiration in patients with carbon monoxide poisoning measured in blood cells. Clin Toxicol (Phila) 2017;55(6):579–584. doi: 10.1080/15563650.2017.1288912. [DOI] [PMC free article] [PubMed] [Google Scholar]
- 8.Jang DH, Khatri UG, Shortal BP, Kelly M, Hardy K, Lambart DS, Eckmann DM. Alterations in mitochondrial respiration and reactive oxygen species in patients poisoned with carbon monoxide treated with hyperbaric oxygen. Intensive Care Med Exp. 2018;6(1):4. doi: 10.1186/s40635-018-0169-2. [DOI] [PMC free article] [PubMed] [Google Scholar]
- 9.Jang DH, Piel S, Greenwood JC, Kelly M, Mazandi VM, Ranganathan A, et al. Alterations in cerebral and cardiac mitochondrial function in a porcine model of acute carbon monoxide poisoning. Clin Toxicol (Phila). 2021;1-14 10.1080/15563650.2020.1870691. [DOI] [PMC free article] [PubMed]
- 10.Cadenas E, Davies KJ. Mitochondrial free radical generation, oxidative stress, and aging. Free Radic Biol Med. 2000;29(3-4):222–230. doi: 10.1016/s0891-5849(00)00317-8. [DOI] [PubMed] [Google Scholar]
- 11.Wallace DC, Fan W, Procaccio V. Mitochondrial energetics and therapeutics. Annu Rev Pathol. 2010;5:297–348. doi: 10.1146/annurev.pathol.4.110807.092314. [DOI] [PMC free article] [PubMed] [Google Scholar]
- 12.Jang DH, Greenwood JC, Spyres MB, Eckmann DM. Measurement of mitochondrial respiration and motility in acute care: sepsis, trauma, and poisoning. J Intensive Care Med. 2017;32(1):86–94. doi: 10.1177/0885066616658449. [DOI] [PMC free article] [PubMed] [Google Scholar]
- 13.Chance B, Williams GR, Holmes WF, Higgins J. Respiratory enzymes in oxidative phosphorylation. V. A mechanism for oxidative phosphorylation. J Biol Chem. 1955;217(1):439–451. doi: 10.1016/S0021-9258(19)57193-9. [DOI] [PubMed] [Google Scholar]
- 14.Chance B, Williams GR. Respiratory enzymes in oxidative phosphorylation. VI. The effects of adenosine diphosphate on azide-treated mitochondria. J Biol Chem. 1956;221(1):477–489. doi: 10.1016/S0021-9258(18)65266-4. [DOI] [PubMed] [Google Scholar]
- 15.Fredriksson K, Rooyackers O. Mitochondrial function in sepsis: respiratory versus leg muscle. Crit Care Med. 2007;35(9 Suppl):S449–S453. doi: 10.1097/01.ccm.0000278048.00896.4b. [DOI] [PubMed] [Google Scholar]
- 16.Gorenkova N, Robinson E, Grieve DJ, Galkin A. Conformational change of mitochondrial complex I increases ROS sensitivity during ischemia. Antioxid Redox Signal. 2013;19(13):1459–1468. doi: 10.1089/ars.2012.4698. [DOI] [PMC free article] [PubMed] [Google Scholar]
- 17.Brealey D, Karyampudi S, Jacques TS, Novelli M, Stidwill R, Taylor V, et al. Mitochondrial dysfunction in a long-term rodent model of sepsis and organ failure. Am J Phys Regul Integr Comp Phys. 2004;286(3):R491–R497. doi: 10.1152/ajpregu.00432.2003. [DOI] [PubMed] [Google Scholar]
- 18.Tohyama S, Kobayashi E. Age-appropriateness of porcine models used for cell transplantation. Cell Transplant. 2019;28(2):224–228. doi: 10.1177/0963689718817477. [DOI] [PMC free article] [PubMed] [Google Scholar]
- 19.Helke KL, Swindle MM. Animal models of toxicology testing: the role of pigs. Expert Opin Drug Metab Toxicol. 2013;9(2):127–139. doi: 10.1517/17425255.2013.739607. [DOI] [PubMed] [Google Scholar]
- 20.Kishikawa JI, Inoue Y, Fujikawa M, Nishimura K, Nakanishi A, Tanabe T, et al. General anesthetics cause mitochondrial dysfunction and reduction of intracellular ATP levels. PLoS One. 2018;13(1):e0190213. doi: 10.1371/journal.pone.0190213. [DOI] [PMC free article] [PubMed] [Google Scholar]
- 21.Forti RM, Favilla CG, Cochran JM, Baker WB, Detre JA, Kasner SE, et al. Transcranial optical monitoring of cerebral hemodynamics in acute stroke patients during mechanical thrombectomy. J Stroke Cerebrovasc Dis. 2019;28(6):1483–1494. doi: 10.1016/j.jstrokecerebrovasdis.2019.03.019. [DOI] [PMC free article] [PubMed] [Google Scholar]
- 22.Wang D, Baker WB, He H, Gao P, Zhu L, Peng Q, et al. Influence of probe pressure on the pulsatile diffuse correlation spectroscopy blood flow signal on the forearm and forehead regions. Neurophotonics. 2019;6(3):035013. doi: 10.1117/1.NPh.6.3.035013. [DOI] [PMC free article] [PubMed] [Google Scholar]
- 23.Busch DR, Baker WB, Mavroudis CD, Ko TS, Lynch JM, McCarthy AL, et al. Noninvasive optical measurement of microvascular cerebral hemodynamics and autoregulation in the neonatal ECMO patient. Pediatr Res. 2020;88(6):925–933. doi: 10.1038/s41390-020-0841-6. [DOI] [PMC free article] [PubMed] [Google Scholar]
- 24.Mullen MT, Parthasarathy AB, Zandieh A, Baker WB, Mesquita RC, Loomis C, et al. Cerebral blood flow response during bolus normal saline infusion after ischemic stroke. J Stroke Cerebrovasc Dis. 2019;28(11):104294. doi: 10.1016/j.jstrokecerebrovasdis.2019.07.010. [DOI] [PMC free article] [PubMed] [Google Scholar]
- 25.Rimachi R, Bruzzi de Carvahlo F, Orellano-Jimenez C, Cotton F, Vincent JL, De Backer D. Lactate/pyruvate ratio as a marker of tissue hypoxia in circulatory and septic shock. Anaesth Intensive Care. 2012;40(3):427–432. doi: 10.1177/0310057X1204000307. [DOI] [PubMed] [Google Scholar]
- 26.Tyrrell DJ, Bharadwaj MS, Jorgensen MJ, Register TC, Molina AJ. Blood cell respirometry is associated with skeletal and cardiac muscle bioenergetics: implications for a minimally invasive biomarker of mitochondrial health. Redox Biol. 2016;10:65–77. doi: 10.1016/j.redox.2016.09.009. [DOI] [PMC free article] [PubMed] [Google Scholar]
Associated Data
This section collects any data citations, data availability statements, or supplementary materials included in this article.
Supplementary Materials
Supplementary Figure 1a– Citrate synthase relative density value for brain tissue. Relative density value for citrate synthase corrected for glyceraldehyde-3-phosphate dehydrogenase (GAPDH) used as a housekeeping protein obtained in snap frozen brain tissue. Values expressed individually with replicates done as described in methods. (PNG 87 kb)
Supplementary Figure 1b– Western Blot Image of Citrate Synthase. Citrate synthase and glyceraldehyde-3-phosphate dehydrogenase (GAPDH) used as a housekeeping protein demonstrating the protein signal in the two groups in from snap frozen brain tissue. (PNG 21 kb)
Supplementary Figure 2a– Complex IV antibody relative density value for brain tissue. Relative density value for Complex IV corrected for anti-GAPDH antibody (GA1R) loading control used as a housekeeping protein obtained in snap frozen brain tissue. Values expressed individually with replicates done as described in methods. (PNG 80 kb)
Supplementary Figure 2b– Western Blot Image of Complex IV subunit antibody. Complex IV and anti-GAPDH antibody (GA1R) used as a housekeeping protein demonstrating the protein signal in the two groups in from snap frozen brain tissue. (PNG 165 kb)