

Abstract
Background
Aggregation, fragmentation, and low yield are issues frequently found during the cell culture process of bispecific antibodies (bsAbs), whose inherent complexity likely plays a role in causing these issues.
Methods
In this study, we made a head-to-head comparison between fed-batch cell culture and intensified perfusion cell culture with a symmetric bsAb case.
Results
In comparison with the fed-batch culture, a 6.6-fold improvement in integrated viable cell density and a 10.9-fold improvement in volumetric productivity were achieved with the intensified perfusion mode. In addition, a significant decrease in aggregation and fragmentation was observed with the intensified perfusion cell culture. Furthermore, product homogeneity was improved, which was reflected by the increased percentage of capillary isoelectric focusing main group. The quality improvement with intensified perfusion cell culture can be attributed to the shortened product retention in the bioreactor.
Conclusions
These findings suggest that intensified perfusion cell culture could be a better choice than traditional fed-batch especially for complex molecules like bsAbs. As this is a single case report, future studies on other cases are needed to further confirm the general applicability of this strategy.
Keywords: aggregation, bispecific antibody (bsAb), fragmentation, intensified perfusion, volumetric productivity (Pv)
Statement of Significance: CHO cells expressing a symmetric bsAb were cultured using intensified perfusion. Compared with the traditional fed-batch model, the 23-day intensified perfusion process resulted in dramatically improved productivity and product quality.
INTRODUCTION
Monoclonal antibody (mAb) has achieved great clinical and commercial success as a class of therapeutic proteins in the past several decades [1]. More recently, bispecific antibodies (bsAbs) have become increasingly popular for therapeutic applications. According to a recent report, close to 90 bsAbs are currently under clinical development [2]. However, owing to the inherent complexity/diversity of their structures, bsAbs are usually difficult to express and prone to form aggregates, undergo fragmentation, and generate various charge variants. Therefore, the process development and manufacturing of bsAbs can be much more challenging than that of mAbs. Conventional fed-batch cell culture has been a dominant mode for the production of mAs and other biopharmaceutical proteins [3, 4]. However, several reports have documented that, when manufactured using fed-batch process, certain bsAbs suffer low productivity, high aggregation, high fragmentation, and low capillary isoelectric focusing (cIEF) main species [5–10]. Thus, improving productivity and product quality is a big challenge to overcome during the cell culture process development for bsAbs.
Perfusion cell culture is a continuous culture mode, where fresh media is constantly pumped into the bioreactor and the product is continuously harvested. Compared with fed-batch culture, perfusion culture is a relatively new technology, which is considered capable of promoting cell growth/protein expression and improving product quality [11–13]. The improvement is generally attributed to fresh nutrients perfusion, removal of cell metabolic waste, and shortened product retention time in the bioreactor [9, 11, 12]. In fed-batch culture, metabolic waste remains in the culture during the entire cultivation and growth-inhibitory compounds accumulate with time, leading to ceased cell division, which limits the final productivity [12]. Perfusion culture, on the other hand, by avoiding the accumulation of growth-inhibitory metabolites allows much higher cell mass and consequent higher productivity to be achieved. In addition, in perfusion culture shortened bioreactor residence time reduces the exposure of product to host cell proteases that may cause damages [10]. Distinct from the traditional perfusion cell culture, which maintains a steady state by cell bleeding and usually has a long period of culture time (i.e., 30–90 days), the intensified perfusion cell culture process WuXiUP has a much shorter culture duration (usually 18–25 days) and requires a simpler operation (i.e., no cell bleeding [14]). With the help of process intensification, intensified perfusion culture decreases the operational complexity associated with the traditional perfusion culture and at the same time delivers similar high productivity [14, 15].
Recently several groups demonstrated that perfusion cell culture exhibited great advantages over fed-batch culture in terms of productivity and product quality when applied to bsAb manufacturing. For example, Gomez et al. reported that perfusion cell culture significantly reduced protein aggregation and increased monomer content by 4–5-fold for a bispecific recombinant protein [7]. In another study, Gomez et al. reported that for six bispecific constructs expressed in individual CHO cell lines, on average the perfusion process increased the integral viable cell density (VCD) and the total harvested product by 15-fold compared with fed-batch culture. In addition, product quality was improved [8]. For instance, aggregates level, content of clipped species, and acidic charge variants were reduced by 72, 75, and 76%, respectively. In yet another example, Bielser et al. reported that perfusion cell culture, when adopted for the production of a conjugated recombinant fusion protein, increased the volumetric productivity (Pv) and significantly minimized protein aggregation, clipping and heterogeneity compared with the fed-batch mode [9]. A study by Pritam et al. also showed that bsAb aggregate level was much lower in the perfusion cell culture compared with that in the fed-batch culture [10]. Overall, these previous researches demonstrated that perfusion cell culture can be a better alternative for the expression of challenging molecules like bsAbs.
To further explore the potential benefits of continuous culture for bsAb manufacturing, in this study, we made a head-to-head comparison between fed-batch culture and intensified perfusion culture (WuXiUP) with a symmetric bsAb (a human IgG1 antibody with an extra functional domain linked to the C-terminal of the heavy chain). Consistent with previous reports, it was found that much higher cell mass and accumulated harvest productivity were achieved with intensified perfusion. Besides, protein aggregation, fragmentation, and charge heterogeneity were also mitigated significantly. Although this is a single case report, it clearly demonstrates that intensified perfusion cell culture has the potential to be a better choice than traditional fed-batch for complex molecules like bsAbs. Hopefully future studies on other cases will further confirm the general applicability of this strategy.
MATERIALS AND METHODS
Materials
Sodium bicarbonate was purchased from J.T. Baker (Phillipsburg, NJ, USA), L-glutamine, hypoxanthine monosodium, thymidine, and blasticidin were purchased from Sigma-Aldrich (St. Louis, MO, USA). Zeocin was purchased from Invitrogen (Waltham, MA, USA), Antifoam was obtained from HyClone (Marlborough, MA, USA). Agilent AdvancedBio column (4.6 × 150 mm) for size-exclusion chromatography–high performance liquid chromatography (SEC–HPLC) analysis was purchased from Agilent (Santa Clara, CA, USA). High-throughput Protein Express LabChip and High-throughput Protein Express Reagent Kit were purchased from PerkinElmer (Waltham, MA, USA). Cartridge-FC coated advanced electrophoresis solution column was obtained from Advanced Electrophoresis Solutions (Cambridge, Ontario, Canada). Glycoprotein amide column (2.1 × 150 mm) was obtained from Waters (Milford, MA, USA).
Equipment
Thermo Fisher TruBio bioreactor control system and Applikon 3 L bioreactor were used in this study. Repligen alternating tangential flow-2 (ATF-2) filtration system was used for 3 L perfusion system set-up. VCD and cell viability were measured by Beckman Vi-Cell cell counter. Glucose, lactate, ammonium, and titer were measured by Roche Cedex BioHT. pH, pCO2, pO2, Na+ ions, and K+ ions were analyzed by Siemens Blood Gas Analyzer (BGA348). Osmolality was measured by Osmometer (Model 2020, Advanced Instruments). An Agilent 1260 liquid chromatography instrument (Agilent Technologies, Santa Clara, CA, USA) was used for SEC–HPLC. A LabChip GXII Touch HT instrument (PerkinElmer, Waltham, MA, USA) was used for non-reduced Caliper analysis. A iCE3 Capillary Isoelectric Focusing Analyzer from ProteinSimple (San Jose, CA, USA) was used for cIEF. A UPLC H-Class Bio instrument with FLD from Waters (Milford, MA, USA) was used for N-glycan analysis.
Methods
Molecule, cell line, and cell culture design
The target protein was a symmetric bsAb, which was expressed using WuXia 3.0 CHO-K1 cell line. A 14-days seed train using basal medium with 4 mM L-glutamine, 1% (w/w) hypoxanthine monosodium, and 1% (w/w) thymidine was conducted before inoculation using 250 mL and 1 L shake flasks.
Fed-batch cell culture was run in a 3 L bench-top bioreactor with an initial working volume of ~1.8 L. The bioreactor was inoculated at the cell density of 0.4 × 10⁶ cells/mL. Dissolved oxygen was controlled at 40.0% and pH was controlled within the range of 6.80–7.20. Initial culture temperature was 36.5°C and it was then shifted to 33.0°C when VCD exceeded 10.0 × 10⁶ cells/mL. Feed medium was administrated on days 3, 5, 7, 9, and 11 with 3.0% feed medium A and 0.3% feed medium B. The culture was harvested on day 14.
Intensified perfusion cell culture (WuXiUP) was run in a 3 L bioreactor with constant working volume of 1.8 L. The bioreactor was inoculated at the VCD of approximately 0.8 × 10⁶ cells/mL. Dissolved oxygen and pH were control to the same level/range as those in the fed-batch mode. Basal and feed media perfusion were started on day 2 when VCD reached ~5.0 × 10⁶ cells/mL. Initial culture temperature was 36.5°C and it was then shifted to 31.0°C when VCD exceeded 38.0 × 10⁶ cells/mL. The perfusion culture was operated using the ATF2 cell retention system with polyethersulfone filters (pore size: 0.2 μm, membrane area: 0.47 m2). Feed medium B was pre-mixed with the basal medium at a concentration of 0.5% (v/v). And for basal medium feeding, the perfusion rate varied between 1.0 and 1.2 fresh medium volume/bioreactor working volume per day (VVD). And for feed medium A, the perfusion rate varied between 0.04 and 0.10 VVD via semi-continuous dosing at an interval of 14.4 min/dose.
Bioreactor runs were sterilely sampled every day for off-line analysis. After sampling, 2 mL of sterile cell culture fluid was directly sent to Blood Gas Analyzer for pH, pCO2, pO2, Na+, and K+ measurements. Cell density, viability, and cell diameter were measured using Vi-Cell. The supernatant post centrifugation (14 000 relative centrifugal force [RCF], 5 min) was subjected to osmolality, glucose, lactate, NH4+, and titer analysis/measurements. Cell culture supernatant from fed-batch run and filtrated samples by ATF cell retention device from intensified perfusion run were purified using Protein A affinity chromatography. Protein A-purified samples were then used for product quality analysis. Titer retention rate in the intensified perfusion run was calculated using the following equation:
 |
(1) |
where Cb is the protein concentration in bioreactor, Ch is the protein concentration of filtrate from the harvest end of the ATF column.
Principal component analysis (PCA) was utilized to visualize and understand cell culture systems in many studies [6, 16]. In this study, PCA was conducted by using the singular value decomposition method of the covariance matrix [17].
SEC–HPLC
SEC–HPLC analysis was performed on an Agilent 1260 liquid chromatography instrument using an Agilent AdvancedBio column (4.6 × 150 mm). Hundred-microgram sample (the sample will be diluted with mobile phase if its concentration is above 10 mg/mL) was injected per run. Mobile phase consisted of 50-mM sodium phosphate, 300-mM sodium chloride at pH 6.8. Each sample was eluted isocratically for 20 min at a flow rate of 1.0 mL/min. Protein elution was monitored by UV absorbance at 280 nm. The peaks corresponding to aggregates and monomer were integrated to calculate the percentage of each species.
Non-reduced Caliper (deglycosylated)
Samples subjected to analysis were first deglycosylated by mixing with Gly-X denaturant, N-Ethylmaleimide and pure water. The mixture was incubated at 90°C for 3 min, after which the sample was further incubated at room temperature for 2 min. Then after N-glycanase working solution was added, the mixture was incubated at 50°C for 5 min. Next, samples were further prepared for non-reduced Caliper analysis by mixing with High-throughput Protein Express Sample Buffer, SDS, NEM, and pure water. The mixture was incubated at 70°C for 10 min and then performed on LabChip (2 μg of sample was injected per run).
cIEF
Twenty-microgram sample was mixed with 80-μL master mix. The mixture was then analyzed with the iCE3 Capillary Isoelectric Focusing Analyzer equipped with a fluorocarbon (FC)-coated whole-column detection capillary. Isoelectric point values and relative abundance of the resolved peaks are calculated using chromatographic software (ProteinSimple iCE3).
N-glycan profiling analysis
The bsAb was first treated with Gly-X denaturant at 90°C for 3 min, followed by N-glycanase incubation at 50°C for 5 min, and then the supernatant was incubated for InstantPC labeling at 50°C for another 5 min. Then the labeled N-glycans are captured using Gly-X 96 vials clean-up plate. The labeled N-glycans were separated and detected with HILIC-FLD on an UPLC system. Finally, each individual N-glycans was quantified by integration of the corresponding peak area.
RESULTS
Improved biomass and cell metabolism by intensified perfusion culture
Both biomass and cell viability are crucial for the productivity and product quality. In general, high integral VCD benefits yielding high titer. Also, high cell viability means few dead cells and leaked proteases. The comparison between fed-batch and intensified perfusion culture on cell growth performance is shown in Fig. 1. As indicated in Fig. 1a, the fed-batch culture lasted 14 days and reached a peak VCD of 18.61 × 10⁶ cells/mL on day 5, whereas the peak VCD of the 23-day intensified perfusion run was 75.61 × 10⁶ cells/mL (achieved on day 13), which was four times higher than that of the fed-batch run as a result of much higher cell growth rate under media perfusion after day 3. Furthermore, boosted cell growth of intensified perfusion let the integral VCD reach approximately 1178 × 106 cells·day/mL, whereas the corresponding value for the fed-batch run is approximately 177 × 106 cells·day/mL (Fig. 1b).
Figure 1.

Cell growth profiles. (a) VCD, (b) integral VCD, (c) cell viability, and (d) average cell diameter profiles vs. elapsed culture time for traditional fed-batch (dark blue diamond and dashed line) and intensified perfusion (red circle and line).
As shown in Fig. 1c, cell viability of the intensified perfusion run was comparable with that of the fed-batch run from day 0 to day 10, and after day 10 it was ~1–5% higher than that of the fed-batch run on the same culture day. The end cell viability of the intensified perfusion run was 75.7% on day 23, whereas the end cell viability of the fed-batch run was 89.4% on day 14. Average cell diameter can usually provide information on cell culture conditions and cell metabolic state [18–21]. The curve shown in Fig. 1d suggests that, similar with observations made in other studies using CHO-K1 cell line [22], the cells became larger after inoculation as the average cell diameter increased from 15.6 to 18.5 μm until day 12 under both culture modes. The cell size continued to increase in the intensified perfusion culture until day 14 and then maintained at 19.5 μm although the intensified perfusion does not pursue a steady state like the traditional perfusion process. On the contrary, the cells in the fed-batch culture shrank during the last 2 days, indicating that the cells underwent metabolic shift and started to crash.
Differences in cell metabolism between these two culture modes are reflected by the corresponding profiles, which can also be used as an indicator for nutrients consumption rate, the reactive oxygen species level, potential detrimental effect to the cell, productivity, and product quality variation. As suggested by glucose and lactate profiles in Fig. 2a and b, respectively, residual glucose was maintained between 2 and 6 g/L, which would not introduce any glucose deficiency, and consequently the lactate accumulated and reached a peak value of ~2 g/L during the exponential phase. The culture then switched to the lactate consumption stage and maintained at a relatively low level (i.e., < 0.5 g/L) for both modes. It is worth noting that the lactate level is ~0.2–0.3 g/L higher for the intensified perfusion run after day 8 as a result of higher cell proliferation rate. The osmolality profiles are comparable between these two modes (Fig. 2c). As suggested by the off-line measured pH curve shown in Fig. 2d, for the fed-batch run pH dropped from 7.10 on day 11 to 6.95 on day 14, whereas the lactate concentration was kept at a low level at the late culture stage, suggesting that some other acidic compounds were generated in the metabolic pathway. This phenomenon was consistent with the cell shrinking and viability drop observed for this 3 L fed-batch run. Comparing with the fed-batch run, the intensified perfusion culture showed improved robustness in terms of osmolality and pH profiles.
Figure 2.

Cell metabolic component profiles. (a) Glucose, (b) lactate, (c) osmolality, and (d) off-line measured pH vs. elapsed culture time for traditional fed-batch (dark blue diamond and dashed line) and intensified perfusion (red circle and line).
To get a comprehensive understanding in this head-to-head comparison, PCA was conducted to analyze the cell culture related high dimensional data. In total, 12 variables, which cover the cell growth (VCD, viability, average cell diameter, and O2 supply rate), cell metabolism (glucose, lactate, NH4+, specific consumption rate of glucose [qGlucose], and specific production rate of lactate [qLactate]), and external environment (pH, pCO2, and osmolality) were used in the PCA analysis (pCO2 profiles were shown in Supplementary Fig. S3). For better understanding of the PCA results, the loading of PC1 and PC2 on these 12 factors were plotted in Supplementary Fig. S1. Daily measurements of these variables were projected on the 2-dimensional principal component space with the explainable variables larger than 70% (threshold). The time-dependent cell culture related trajectories of these two runs are shown in Fig. 3 (red points represent the perfusion run, whereas the blue points represent the fed-batch run; the data points on the PCA plot were labelled with culture time, from day 1 to the harvest day for both culture modes). With increased culture time, the two trajectories move from bottom left to top right in the PCA plot (Fig. 3). As shown in Supplementary Fig. S1, considering the loading of PC1, the left-to-right movement of these trajectories could be mainly attributed to decreased lactate level, lower qGlucose, and accumulated NH4+ concentration at the late culture stage. Besides, the gradually increased average cell diameters mainly contribute to the down-to-up movement of these trajectories. It is worth noting that after day 12, the trajectory of intensified perfusion culture is stuck in the vicinity of the day 12 data point until the end of the perfusion culture. Further analysis on the loading of PC1 and PC2 (Supplementary Fig. S1) revealed that the stable performance of intensified perfusion run on the PCA plot from day 12 to day 23 is likely a reflection of the stable cell metabolism (stable glucose consumption rate, lactate, and NH4+ level), stable external environment (pCO2 level, pH, and osmolality), and stable cell size (average cell diameter; data not shown). To further evaluate the gap between these two culture modes, Euclidean distances of the intensified perfusion culture to the fed-batch culture on the PCA plot were calculated using the equation below,
 |
(2) |
where dn is the Euclidean distance between these two runs on culture day n, x represents the projected value on PC1 axis, y represents the projected value on PC2 axis. Subscription p and f represent the intensified perfusion run and fed-batch run, respectively. The results of the Euclidean distance (dn) are shown in Supplementary Fig. S2. The data suggest that dn values fluctuate from day 1 to day 9 and gradually increase from 1.6 on day 9 to 4.0 on day 14, indicating that the gap between these two runs becomes larger with time, besides, the increased dn could mainly be attributed to the Euclidean distance on y-axis on PCA plot because whereas the intensified perfusion run yields a more stable cell size and better cell viability maintenance from day 9 to day 14, the fed-batch run undergoes decreased pH, dropped cell viability, and declined cell diameters during this period. After day 14, dn keeps relatively stable due to the stable performance of intensified perfusion as shown in the PCA plot.
Figure 3.
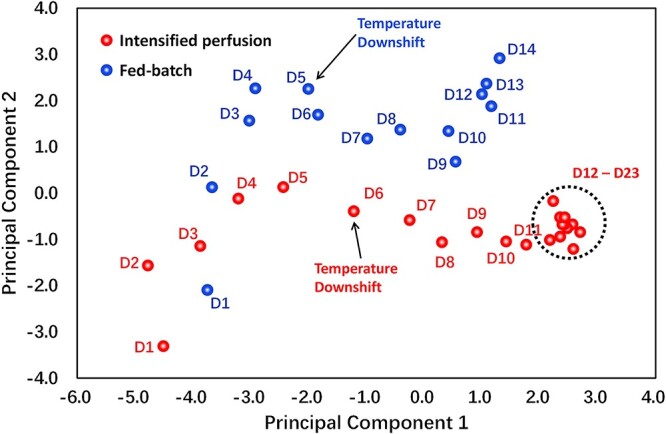
Cell culture related data visualization by PCA. In total, 12 variables including VCD, viability, average cell diameter, O2 supply rate, glucose, lactate, NH4+, qGlucose, qLactate, pH, and pCO2, osmolality were used in the PCA analysis for traditional fed-batch (blue) and intensified perfusion (red). The percentage of explained variance for PC1 and PC2 is 49.09% and 17.19%, respectively (cumulatively, these two components explained 66.28% of the total variance).
Improved productivity and product quality by intensified perfusion culture
Productivity data of the intensified perfusion are summarized in Fig. 4. Firstly, as shown in Fig. 4a, with the rapid cell mass accumulation at the exponential growth phase and relatively slowly increased perfusion rate at the initial culture stage, the cell-specific perfusion rate decreased from approximately 130 pL/cell/day on day 2 to ~20 pL/cell/day on day 6, and after day 6 the cell-specific perfusion rate was well controlled between 20 and 40 pL/cell/day. It is worth noting that the cell-specific perfusion increased from 14.7 pL/cell/day to 27.0 pL/cell/day on day 23 due to the decline of VCD starting from day 14. Harvest started being collected for the intensified perfusion run from day 7. As shown in Fig. 4b, the bsAb retention rate gradually increased from 20 to 60%, which was consistent with that reported in other perfusion studies for bsAbs [23]. The accumulative Pv of the intensified perfusion run grew linearly from 0.1 g/L on day 7 to 35.0 g/L on day 23, which was 10.9-fold higher than that of the fed-batch harvest titer (i.e., 3.2 g/L; Fig. 4c), which demonstrated the capability of the intensified perfusion mode on improving productivity. As suggested in Fig. 4d, the improvement on productivity by perfusion culture can be attributed to high integral VCD (6.67-fold higher than that of fed-batch) as well as higher accumulative cell-specific productivity (Qp, 33 pg/cell/day).
Figure 4.

Perfusion-specific information and productivity of both culture modes. (a) Perfusion rate and cell-specific perfusion rate, (b) titer retention rate, (c) accumulative harvest volumetric productivity, and (d) accumulative Qp vs. elapsed culture time for traditional fed-batch (dark blue diamond and dashed line) and intensified perfusion (red circle and line).
As mentioned in the introduction, several previous works have demonstrated that perfusion cell culture can improve product quality for both mAb and bsAbs [6, 7, 10, 11]. We were wondering whether the same quality improvement can be achieved by intensified perfusion culture process, which has much shorter duration and no operation of cell bleeding. To answer this question, levels of aggregates (measured by SEC–HPLC), fragments (measured by non-reduced Caliper), and charge variants (measured by cIEF) were monitored, and the data are shown in Figs 5 and 6. For the intensified perfusion culture process, samples were taken for analysis every 4 days until the end of the culture. All intensified perfusion samples were compared with the sample on harvest day of the fed-batch run. It was found that SEC monomer of the fed-batch harvest was 86.9%, whereas the monomer percentage of all samples from the intensified perfusion run was above 95.0% (Fig. 5a). For aggregates level, SEC high-molecule-weight (HMW) species of the fed-batch harvest was 2.7%, whereas the HMW percentage of the intensified perfusion run ranged from 1.4 to 2.1%. Thus, for intensified perfusion the percentage of HMW species was at least decreased by ~22% (the highest percentage of the intensified perfusion run was used for the calculation; Fig. 5b). Also, Caliper main peak for the fed-batch sample was 93.8%, and the corresponding value increased to >97.0% for intensified perfusion samples (Fig. 5c); and Caliper pre-peaks for the fed-batch sample was 6.2%, whereas the highest value of the intensified perfusion run was 2.6%, which decreased by ~58% (Fig. 5d). Furthermore, charge variants distribution was also improved by intensified perfusion culture. Percentage of cIEF main group for the fed-batch sample and the intensified perfusion samples were 40.4% and 74.9–79.7%, respectively (Fig. 6); percentage of cIEF acidic group for the fed-batch sample and the intensified perfusion samples were 44.5% and 12.8–20.8%, respectively; and percentage of cIEF basic group for the fed-batch sample and the intensified perfusion samples were 15.1% and 3.3–11.0%, respectively (Fig. 6). cIEF acidic and basic groups decreased at least by 53 and 27%, respectively, for the intensified perfusion run.
Figure 5.

Quality data of a bsAb expressed in CHO cells under traditional fed-batch and intensified perfusion modes. For perfusion culture, samples were collected on day 10, 14, 18, 20, and 23. (a) SEC–HPLC main peak, (b) SEC–HPLC HMW, (c) non-reduced Caliper purity, and (d) non-reduced Caliper pre-peaks.
Figure 6.

cIEF data of a bsAb expressed in CHO cells under traditional fed-batch and intensified perfusion modes. For perfusion culture, samples were collected on day 10, 14, 18, 20, and 23.
Comparison of the selected important N-glycan species between the two culture modes is shown in Fig. 7. As indicated in Fig. 7a, for fed-batch mannose-5 (Man5) content on day 14 was 3.7%, whereas for the intensified perfusion run Man5 content increased from 1.3 to 5.5% from day 10 to day 23. After day 18 Man5 content of the intensified perfusion run began to exceed that of the fed-batch run on day 14. For afucosylated glycoforms (Fig. 7b), on day 10, afucosylated content of the intensified perfusion run was slightly lower than that of the fed-batch sample, while starting from day 14 afucosylated content of the intensified perfusion samples was increased and slightly higher than that of the fed-batch run. As shown in Fig. 7c and d, galactosylated and sialylated species showed similar trend over culture time for the intensified perfusion mode. Galactosylated species decreased significantly from 59.0% on day 10 to 38.9% on day 14 for the intensified perfusion run, whereas from day 14 to day 23 this species increased slightly and kept ~40.0%. Sialylated species also decreased significantly from 41.9% on day 10 to 27.1% on day 14 for the intensified perfusion run and kept ~29.1% from day 14 to day 23. Compared with the fed-batch run, harvested products from the intensified perfusion run displayed higher galactosylation and sialylation level on day 10, but comparable level of galactosylation and sialylation starting from day 14. Taken together, these data suggest that, in comparison with the fed-batch culture, the intensified perfusion cell culture process can minimize aggregation (aggregates decreased by at least 22%), protease triggered clipping (truncated species decreased by at least 58%), and product heterogeneity (acidic and basic contents decreased by at least 53 and 27%, respectively) just with a 23-day process. Besides, glycosylation distribution could also be affected by intensified perfusion mode.
Figure 7.

N-glycan profiles of a bsAb expressed in CHO cells under traditional fed-batch and intensified perfusion modes. For perfusion culture, samples were collected on day 10, 14, 18, 20, and 23. (a) Mannose 5, (b) afucosylated percentage, (c) galactosylated percentage, and (d) Sialylated N-glycans percentage.
DISCUSSION
In this study, using a symmetric bsAb case, a head-to-head comparison between fed-batch and intensified perfusion culture mode was conducted on cell culture performance and product quality. In comparison with the former, the latter achieved significantly increased biomass in just a 23-day cultivation, resulting in greatly improved Pv. It is worth noting that the improvement on productivity was not only attributed to the high integral VCD, but also was a result of the 1.77-fold increase in accumulative Qp. It is believed that in intensified perfusion the fast supplement of nutrients and quick removal of cell toxic components improved cell status (better cell viability and more stable metabolic profiles as summarized in Figs 1–3), which in turn contributed to the higher Qp.
In addition to productivity improvement, product quality was significantly improved under the intensified perfusion mode. For example, the percentage of SEC main peak was increased by >10% and the content of clipping species was decreased by at least 58%. Mitigated aggregation and fragmentation is considered as a result of shortened retention of the product inside the bioreactor, which reduced product accumulation and exposure to detrimental host cell proteases [6–9]. Another improvement was the increased cIEF main species along with reduced acidic and basic charge variants. Again, increased main cIEF species can also be attributed to shortened retention and reduced exposure, which can minimize some potential post translational modifications (e.g., deamidation, glutamine cyclization, and C-terminal lysine removal, etc.) that could result in the generation of acidic and basic charge variants. Extra experiments were conducted to verify that short bioreactor residence time benefits the product quality, so harvest cell culture fluid samples on day 23 from WuXiUP run were taken outside of the bioreactor and incubated at 31.0°C with 0, 12, and 48 h, respectively. Caliper main peak for the control sample (0 hour incubation time) was 95.4%, and the corresponding value decreased to 94.8%, 92.8% with incubation time of 12 h, and 48 h at 31°C, respectively (Supplementary Fig. S4a). And the cIEF acidic group increased from 13.9 to 34.5% with incubation time of 0, 48 h, respectively (Supplementary Fig. S4c). Therefore, this sample incubation experiment addressed the effects of bioreactor residence time on product quality.
It is noticeable that glycosylation distribution was appreciably different between the two culture modes and glycosylation varies over the culture duration under the intensified perfusion mode. Man5 content increased gradually as the intensified perfusion run proceeded and finally exceeded that of the fed-batch day 14. A possible explanation is that the enzymatic activity of Man5 related glycosides decreased gradually with elongated cultivation. Besides, higher Qp of the intensified perfusion mode may also contribute to the increased Man5 level. An interesting observation was made on the content of afucosylated, galactosylated, and sialylated species for the intensified perfusion run: there is a big variation of their levels between harvest products of days 10 and 14. In particular, afucosylated species increased, whereas galactosylated and sialylated species decreased from day 10 to day 14. Furthermore, the contents became stable from day 14 onward. The observation that levels of afucosylation, galactosylation, and sialylation are only stable after day 14 in the intensified perfusion run was consistent with the findings made by Bielser et al. [9] and Karst et al. [16], who had documented that the glycosylation level became stable from the medium phase of perfusion culture. Although the underlying mechanism is not clear, it is speculated that starting from the medium culture phase relatively stable cellular environment was established as indicated by PCA results (Fig. 3) and therefore steady glycosylation was reached. And less complex glycans (galactosylated and sialylated species) formed at the late culture phase after day 14 is likely due to decreased activities of galactose and sialic acid related enzymes, which leads to the release of non-fully glycosylated species.
It is worth noting that the intensified perfusion culture mode (WuXiUP) adopted in this study is different from the perfusion culture used in several previous studies [6–10]. Compared with traditional perfusion culture, WuXiUP shows great advantages such as operation simplicity and improved efficiency. Unlike traditional perfusion culture, WuXiUP does not require cell bleeding, which would introduce extra process complexity. For example, the calculation and control of cell bleeding rate, the installation of extra device for cell bleeding such as a biomass probe and a bleeding pump, and the storage of bled cells shall all be considered in developing a traditional perfusion process. Cell bleeding will also lead to waste of biomass and loss of productivity. Another advantage of WuXiUP run is its relatively short culture duration. We accomplished the improvements of productivity and product quality within just 23 days, whereas for traditional perfusion the culture duration can be 40 days or even longer [6, 8]. Therefore, the current case study not only provides a successful example of improving bsAb productivity and product quality by adopting perfusion culture, but also provides a different perfusion culture mode that is operation-friendly (no cell bleeding and extra device) and timesaving (culture duration within 20–25 days). Both operation simplicity and time efficiency are of significance in process development, process characterization, and large scale commercial manufacturing of biopharmaceuticals in industrial field.
In conclusion, our findings are consistent with several previous reports and further confirm that the cell culture mode (fed-batch vs. intensified perfusion) can make a difference not only on productivity but also on product quality. In particular, the quality improvement is especially remarkable for complex molecules like bsAbs, which are prone to aggregation and fragmentation. Thus, intensified perfusion offers a better alternative to traditional fed-batch culture for manufacturing challenging bsAbs.
Supplementary Material
ACKNOWLEDGEMENTS
The authors would like to thank analytical team of Technology and Process Development for their assistance with SEC–HPLC, non-reduced Caliper, cIEF, and N-glycan profiling analysis.
Contributor Information
Yongjun Qin, Technology and Process Development (TPD), WuXi Biologics, 288 Fute Zhong Road, Waigaoqiao Free Trade Zone, Shanghai 200131, China.
Rongmei Ma, Technology and Process Development (TPD), WuXi Biologics, 288 Fute Zhong Road, Waigaoqiao Free Trade Zone, Shanghai 200131, China.
Yang Li, Technology and Process Development (TPD), WuXi Biologics, 288 Fute Zhong Road, Waigaoqiao Free Trade Zone, Shanghai 200131, China.
Yifeng Li, Technology and Process Development (TPD), WuXi Biologics, 288 Fute Zhong Road, Waigaoqiao Free Trade Zone, Shanghai 200131, China.
Gong Chen, Technology and Process Development (TPD), WuXi Biologics, 288 Fute Zhong Road, Waigaoqiao Free Trade Zone, Shanghai 200131, China.
Weichang Zhou, Biologics Development, WuXi Biologics, 288 Fute Zhong Road, Waigaoqiao Free Trade Zone, Shanghai 200131, China.
AUTHORS’ CONTRIBUTIONS
Yongjun Qin: methodology, data curation, formal analysis, writing—original drafting, review and editing. Rongmei Ma: data curation, formal analysis, Yang Li: data curation, formal analysis. Yifeng Li: conceptualization, writing—original drafting, reviewing and editing. Gong Chen: methodology, data curation, formal analysis, writing—original drafting, review and editing. Weichang Zhou: conceptualization, writing—reviewing and editing.
FUNDING
None declared.
CONFLICT OF INTEREST STATEMENT
None declared.
DATA AVAILABILITY STATEMENT
Data contained within the article can be available online.
ETHICS AND CONSENT STATEMENT
Consent was not required.
ANIMAL RESEARCH STATEMENT
Not applicable.
References
- 1. Reichert, JM, Rosensweig, CJ, Faden, LBet al. Monoclonal antibody successes in the clinic. Nat Biotechnol 2005; 23: 1073–8. [DOI] [PubMed] [Google Scholar]
- 2. Hosseini, SS, Khalili, S, Baradaran, Bet al. Bispecific monoclonal antibodies for targeted immunotherapy of solid tumors: Recent advances and clinical trials. Int J Biol Macromol 2021; 167: 1030–47. [DOI] [PubMed] [Google Scholar]
- 3. Bibila, TA, Robinson, DK. In pursuit of the optimal fed-batch process for monoclonal antibody production. Biotechnol Prog 1995; 11: 1–13. [DOI] [PubMed] [Google Scholar]
- 4. Yang, JD, Lu, C, Stasny, Bet al. others, Fed-batch bioreactor process scale-up from 3-L to 2,500-L scale for monoclonal antibody production from cell culture. Biotechnol Bioeng 2007; 98: 141–54. [DOI] [PubMed] [Google Scholar]
- 5. Li, Y. A brief introduction of IgG-like bispecific antibody purification: Methods for removing product-related impurities. Protein Expr Purif 2019; 155: 112–9. [DOI] [PubMed] [Google Scholar]
- 6. Walther, J, Lu, J, Hollenbach, Met al. Perfusion cell culture decreases process and product heterogeneity in a head-to-head comparison with fed-batch. Biotechnol J 2019; 14: 1700733. [DOI] [PubMed] [Google Scholar]
- 7. Gomez, N, Barkhordarian, H, Lull, Jet al. Perfusion CHO cell culture applied to lower aggregation and increase volumetric productivity for a bispecific recombinant protein. J Biotechnol 2019; 304: 70–7. [DOI] [PubMed] [Google Scholar]
- 8. Gomez, N, Lull, J, Yang, Xet al. others, Improving product quality and productivity of bispecific molecules through the application of continuous perfusion principles. Biotechnol Prog 2020; 36: e2973. [DOI] [PubMed] [Google Scholar]
- 9. Bielser, JM, Chappuis, L, Xiao, Yet al. Perfusion cell culture for the production of conjugated recombinant fusion proteins reduces clipping and quality heterogeneity compared to batch-mode processes. J Biotechnol 2019; 302: 26–31. [DOI] [PubMed] [Google Scholar]
- 10. Sinharoy, P, Aziz, AH, Majewska, NIet al. Perfusion reduces bispecific antibody aggregation via mitigating mitochondrial dysfunction-induced glutathione oxidation and ER stress in CHO cells. Sci Rep 2020; 10: 1–12. [DOI] [PMC free article] [PubMed] [Google Scholar]
- 11. Bielser, JM, Wolf, M, Souquet, Jet al. Perfusion mammalian cell culture for recombinant protein manufacturing–A critical review. Biotechnol Adv 2018; 36: 1328–40. [DOI] [PubMed] [Google Scholar]
- 12. Shukla, AA, Wolfe, LS, Mostafa, SSet al. Evolving trends in mAb production processes. Bioeng Transl Med 2017; 2: 58–69. [DOI] [PMC free article] [PubMed] [Google Scholar]
- 13. Chen, G, Hu, J, Qin, Yet al. Viable cell density on-line auto-control in perfusion cell culture aided by in-situ Raman spectroscopy. Biochem Eng J 2021; 172: 108063. [Google Scholar]
- 14. Zhou, H, Fang, M, Zheng, Xet al. Improving an Intensified and integrated continuous bioprocess platform for biologics manufacturing. Biotechnol Bioeng 2021; 118: 3618–23. [DOI] [PubMed] [Google Scholar]
- 15. Liu, Z, Zhang, Z, Qin, Yet al. The application of Raman spectroscopy for monitoring product quality attributes in perfusion cell culture. Biochem Eng J 2021; 173: 108064. [Google Scholar]
- 16. Karst, DJ, Steinhoff, RF, Kopp, MRet al. Intracellular CHO cell metabolite profiling reveals steady-state dependent metabolic fingerprints in perfusion culture. Biotechnol Prog 2017; 33: 879–90. [DOI] [PubMed] [Google Scholar]
- 17. de Souza, CR. A tutorial on principal component analysis with the accord. net framework, ArXiv Prepr. ArXiv12107463 2012. https://arxiv.org/abs/1210.7463. [Google Scholar]
- 18. Bi, JX, Shuttleworth, J, Al-Rubeai, M. Uncoupling of cell growth and proliferation results in enhancement of productivity in p21CIP1-arrested CHO cells. Biotechnol Bioeng 2004; 85: 741–9. [DOI] [PubMed] [Google Scholar]
- 19. Edros, R, McDonnell, S, Al-Rubeai, M. The relationship between mTOR signalling pathway and recombinant antibody productivity in CHO cell lines. BMC Biotechnol 2014; 14: 1–10. [DOI] [PMC free article] [PubMed] [Google Scholar]
- 20. Pan, X, Dalm, C, Wijffels, RHet al. Metabolic characterization of a CHO cell size increase phase in fed-batch cultures. Appl Microbiol Biotechnol 2017; 101: 8101–13. [DOI] [PMC free article] [PubMed] [Google Scholar]
- 21. Blackiston, DJ, McLaughlin, KA, Levin, M. Bioelectric controls of cell proliferation: ion channels, membrane voltage and the cell cycle. Cell Cycle 2009; 8: 3527–36. [DOI] [PMC free article] [PubMed] [Google Scholar]
- 22. Madabhushi, SR, Podtelezhnikov, AA, Murgolo, Net al. Understanding the effect of increased cell specific productivity on galactosylation of monoclonal antibodies produced using Chinese hamster ovary cells. J Biotechnol 2021; 329: 92–103. [DOI] [PubMed] [Google Scholar]
- 23. Wang, SB, Godfrey, S, Radoniqi, Fet al. Larger pore size hollow fiber membranes as a solution to the product retention issue in filtration-based perfusion bioreactors. Biotechnol J 2019; 14: 1800137. [DOI] [PubMed] [Google Scholar]
Associated Data
This section collects any data citations, data availability statements, or supplementary materials included in this article.
Supplementary Materials
Data Availability Statement
Data contained within the article can be available online.