

Abstract
Background:
This study characterized alcohol consumption behaviors among adult cancer survivors and determined how these behaviors compared with cancer-free individuals using NHANES data (1999–2016).
Methods:
Adjusted odds ratios (aOR) and 95% confidence intervals (CI) were estimated using multinomial logistic regression for the association between cancer survivors vs cancer-free individuals and odds of drinking status (former/current/never drinkers), accounting for demographic and socioeconomic factors. Among current drinkers, multivariable logistic regression was used to calculate the aORs for binge drinking and exceeding moderate drinking.
Results:
A total of 3113 survivors and 39,527 cancer-free individuals were included. Cancer survivors were less likely to be current drinkers (63.4% vs. 72.6% in cancer-free) and were more likely to be former drinkers (24.4% vs. 15.5% in cancer-free). Cancer survivors had significant lower odds of being current vs. never drinkers (aOR, 0.84, 95% CI: 0.71–0.99). By cancer types, cervical cancer survivors were more likely to be binge drinkers (aOR, 2.51, 95% CI: 1.27–4.92), particularly among women aged ≥ 55 years (aOR, 6.90, 95% CI: 1.28–37.3).
Conclusion:
Given the high odds of binge drinking among cervical cancer survivors, public health strategies are needed to reduce alcohol consumption in this group.
Keywords: Cancer survivorship, Lifestyle factors, Alcohol, Binge drinking
1. Introduction
Cancer is one of the most commonly diagnosed diseases in the United States. According to data from the National Cancer Institute (NCI), almost 40% of men and women living in the U.S. will have at least one cancer diagnosis in their lifetime [1]. The mortality rates for all cancers have been declining since the 1990s because of improvements in cancer screening and treatment [1]. As a result, the number of cancer survivors in the United States has rapidly expanded. The number of cancer survivors grew from 11.9 million in 2011 to 15.5 million in 2016, and researchers have projected its continuous growth to 26 million by 2040 [2–4]. Thus, it is important to assess factors that could promote cancer-free survival and improve quality of life throughout survivorship.
Alcohol consumption has been identified as a Group I carcinogen to humans and has been widely accepted as a modifiable risk factor for numerous cancers [5–10]. Recently, emerging evidence has also suggested that among those diagnosed with cancer, lower alcohol consumption is associated with higher survival [11–14]. Li et al. suggested in their 2013 review that the risk of upper aerodigestive tract cancer mortality increased significantly for current alcohol drinkers compared to never drinker, and their dose-response analysis suggested that increasing daily alcohol consumption was associated with increased risk of cancer mortality after cancer treatment [15]. Some studies have reported observing a positive association between moderate to heavy alcohol use and the risk of breast cancer recurrence and mortality while no association was detected among light alcohol drinkers [16–20]. Heavy drinking in cancer survivors has also been associated with symptoms of depression, anxiety, and distress and reduction in the quality-of-life score regardless of ages at diagnoses and types of cancers [21–23]. Besides its direct association with cancer outcomes and quality-of-life after cancer, alcohol is also considered a risk factor for high blood pressure, diabetes, liver disease, and many other diseases [24]. Many studies have suggested that non-cancer deaths are accountable for more than half of the total deaths among cancer patients and survivors, and an estimated 50% of the non-cancer deaths are due to cardiovascular disease [25–27]. Although the evidence of any consumption of alcohol being a risk factor for CVD is mixed, alcohol consumption correlates with both weight gain and cigarette smoking [28, 29]. In this case, alcohol consumption among cancer survivors is potentially associated with an increased risk of CVD and could jeopardize the survivorship after cancer diagnoses.
Given the essential role that alcohol consumption plays in cancer, it is important and necessary to consider alcohol control in cancer survivorship strategies. The Centers for Disease Control and Prevention (CDC) has suggested both community strategies such as increasing alcohol taxes and regulations for alcohol store density, and clinical strategies to reduce alcohol consumption burden in the general public [30,31]. The American Cancer Society has recommended that all cancer survivors should have no more than 1 drink per day for women and no more than 2 drinks per day for men [32–34]. Survivors of head and neck cancers are advised to avoid alcohol consumption at all levels [35]. Although such recommendations have been made, the associations between drinking behaviors among cancer survivors compared to individuals without cancer have not been well studied, and more research is needed to determine whether these patterns differ across cancer types.
Published studies have suggested that majority of individuals who have a previous cancer diagnosis identified themselves as current drinkers and among current drinkers, around 20% reportedly engage in binge drinking [36,37], however, it is still unclear how these proportions compare to the prevalence of current drinkers and binge drinkers in the general population. Therefore, the purpose of our analysis was to characterize the alcohol consumption patterns among cancer survivors and to compare them to cancer-free individuals.
2. Methods
2.1. Data source and study population
This cross-sectional study combined data from 9 continuous National Health and Nutrition Examination Survey (NHANES) from 1999 to 2016 (N = 92,062) [38]. Since 1999, NHANES became a continuous, ongoing, biannual national survey to assess various health-related conditions of the U.S. population using national representative samples recruited by a complex, multistage, probability sampling design [39]. NHANES collects data using both in-person interviews and physician examination. This analysis used information from the interview questionnaires. The study population included all adults (18 years of age and older) who had answered questions regarding prior cancer diagnosis and alcohol consumptions. After exclusion, the study population included 42,460 participants (cancer survivors=3113; cancer-free individuals=39,527).
2.2. Cancer characteristics
In our study, we used the phrase “cancer survivors” to refer anyone who had at least one cancer diagnosis prior to NHANES interviews. The primary independent variable of interest is cancer status, which we determined via the question: “Have you ever been told by a doctor or other health professional that you had cancer or a malignancy of any kind?” We also included type of first cancer diagnosed, whether the cancer can be attributed by alcohol, the number of cancers diagnosed, and the years since first cancer diagnosis as our secondary independent variables.
We assessed the types of cancers diagnosed in these individuals with the following question: “What kind of cancer was it?” For people who were only diagnosed with non-melanoma or unknown skin cancer, we recoded them as cancer-free individuals; however, we included people who were diagnosed with melanoma skin cancer due to evidence from previous literature [40]. If individuals reported non-melanoma or unknown skin cancer as their first cancer diagnosis and also reported having diagnoses of other types of cancers as their second cancer diagnosis, we used their second cancer diagnosis as their first cancer diagnosis and kept them as cancer survivors. Because of the small number of some cancer cases (those had the weighted percentage less than 5% of the total cancer cases), we grouped cancers other than breast, prostate, colorectal, cervical, melanoma, and uterine cancer into one group as “other cancers” (see Supple. Table 1). Additionally, we created a variable called “alcohol-attributable cancer” based on the first type of cancer diagnosed. We included head and neck cancer, esophageal cancer, liver cancer, breast cancer, and colorectal cancer as alcohol-attributable cancer [7].
NHANES asks about types of cancer diagnosed three times to capture multiple cancer diagnoses within the same individual. Based on the responses, we categorized cancer survivors to individuals with single cancer or with multiple cancers (had cancer >1 time). We also collected information on the age at cancer diagnosis using the question: “How old were you when {type of cancer} was diagnosed?” We subtracted the age at cancer diagnosis from the age at interview to calculate years since diagnosis. We then divided cancer survivors into two groups: short-term survivors (diagnosed 0–5 years) and long-term survivors (diagnosed over 5 years). All adults 85 years or older were all coded as “85” in NHANES, in this case, we excluded individuals who had 85 for their age at interview or had 85 for their age at first cancer diagnosis (n = 106 excluded) and individuals had missing information on age at cancer diagnosis (n = 22 excluded) for the analyses examining years since cancer diagnosis as the predictor.
2.3. Outcomes of alcohol consumption
We categorized study participants as never drinkers, former drinkers, and current drinkers in this study. We coded individuals who reported having < 12 drinks over lifetime as never drinkers; individuals who reported having > 12 drinks over lifetime or having > 12 drinks in any given year in life but without alcohol consumption in the past 12 months as former drinkers; individuals who reported having at least one drink in the past 12 months as current drinkers. We determined alcohol consumption among current drinkers by the question, “in the past 12 months, on those days that you drank alcoholic beverages, on the average, how many drinks did you have?” Based on the response, we defined exceeding moderate drinkers as males who drink more than 2 drinks per day or females who drink more than 1 drink per day; and we defined binge drinkers as males who drank more than 5 drinks per day or females who drank more than 4 drinks per day, based on the Dietary Guidelines for American 2020–2025 [41]. For the purpose of this paper, we defined people engaged in risky drinking behavior as people who exceeded moderate drinking and/or binge drinking limits (N = 27,934).
2.4. Other covariates and potential confounders
We included information on age, gender, race, annual family income, education level and marital status from the demographic questionnaire. We categorized age at interview as “34 and Under”, “35–54” and “55 and above” based on tertiles of the age distribution in the total study sample. For race, we categorized participants as “non-Hispanic white (NH white)” “non-Hispanic black (NH black)” “Hispanic” and “other race”. We combined the input of “other Hispanic” and “Mexican American” in NHANES as “Hispanic” because of the small number of participants who identified them as “other Hispanics”. We divided annual family income as “Under $ 20,000”, “$20,000–54,999”, and “over 54,999”. In the NHANES surveys, individuals were also allowed to respond their annual family income as “above $20,000”. We grouped these individuals into the subgroup of “$20,000–54,999” for the analyses (N = 2300). We divided the education level of participants as “less than 9th grade,” “grade 9–11 (not yet graduate from high school),” “high school graduate,” “some college,” and “college graduate or above”.
Smoking status were determined via the question: “Have you smoked at least 100 cigarettes in your entire life?” Individuals who answered “No” were coded as never smokers. Among individuals who answered “Yes”, the distinguish between current and former smokers were made via the question, “Do you now smoke cigarettes?” Individuals reported “Yes” were coded as current smokers, and the rest were coded as former smokers. The following question was used to determine insurance status: “Are you covered by health insurance or some kind of health care plan?”.
2.5. Statistical methods
Sampling weights, primary sampling units (PSUs) and strata information were provided by NHANES and accounted for in all analyses. Baseline characteristic of the study population by cancer status were reported as the weighted mean or weighted proportion. To assess the collinearity among covariates, we regressed each covariate on all others and manually calculated the variance inflation factor [42]. The indication of collinearity is having a VIF greater than 10. None of the covariates included in the models had a VIF greater than 10.
The primary outcome of interest was the odds of drinking status among cancer survivors compared to cancer-free individuals. Weighted multinomial logistic regressions were used to calculate the adjusted odds ratios (aOR) and the 95% confidence intervals (CI) of being current drinkers vs never drinkers and being former drinkers vs never drinkers comparing survivors to cancer-free individuals. We were also interested in the odds of risky drinking behaviors among current drinkers comparing cancer survivors to cancer-free individuals. Among current drinkers, weighted multivariable logistic regression models were performed to calculate the aOR of exceeding moderate and binge drinking. Age, gender, race, education level, marital status and smoking status were adjusted in the model as confounders based on information from previous literatures [36]. We also examined whether these covariates were confounders in our data by running the crude model and several adjusted and observed greater than 10% change in the measure of association in all adjusted models, confirming that these covariates were also confounders in our study.
Stratified analyses were also performed by age group, race, and gender to investigate whether associated differed across these subgroups. The race categories were NH whites vs. all other races (NH black, Hispanics, and others) to achieve model convergence. For this study, we defined statistically significant results as having p-value no greater than 0.05 for 2-sided tests. All statistical analyses were performed using Stata/IC 16.0 (StataCorp LLC, College Station, TX).
3. Results
3.1. Baseline characteristics
A total of 3113 cancer survivors and 39,527 cancer-free individuals were included in the study population. The baseline characteristics are presented in Table 1. The median age of cancer survivors was 65 (IQR:52–74) which is 20 years older than the median age of cancer-free individuals (median age: 45 IQR:32–58). Compared with cancer-free individuals, a larger proportion of cancer survivors were female (62.32% vs 50.55% in cancer-free individuals). Most of the cancer survivors and cancer-free individuals included in the study were NH white. The proportion of NH whites was larger in cancer survivors (83.66%) when compared with cancer-free individuals (68.82%). The education levels among cancer survivors and cancer-free individuals were similar; most of both groups held a college degree or above. The annual family income was slightly lower among survivors than it was among cancer-free individuals. Cancer survivors were also more likely to have health insurance (93.05% vs. 82.1% in cancer-free individuals). As for the modifiable lifestyle factors, cancer survivors were more likely to be a former smoker (38.72% vs. 24.07% in cancer-free individuals) and were less likely to be a never smoker (42.83% vs. 53.73% in cancer-free individuals) and a current smoker (18.45% vs. 22.2% in cancer-free individuals). All distributions of covariates among survivors were significantly different compared to the distribution among cancer-free individuals (p-value < 0.05), except for education level. Cancer survivors were less likely to be current drinkers (63.4% vs. 72.6% in) and were more likely to be former drinkers (24.4% vs. 15.5% in cancer-free individuals). Within a subgroup of current drinkers, cancer survivors were less likely to exceed moderate drinking (38.04% vs. 51.41% in cancer-free individuals) or to binge drink (5.6% vs. 12.17% in cancer-free individuals).
Table 1.
Baseline Characteristics of Study Population by Cancer Status Using 9 continuous NHANES dataset.
| Characteristics | Cancer Survivors (N = 3113) | Cancer-Free Population (N = 39,527) | Total Study Population (N = 42,640) | |||
|---|---|---|---|---|---|---|
| For Continuous Variables | ||||||
| Weighted Mean (SE) | Weighted Median (Q1–Q3) | Weighted Mean (SE) | Weighted Median (Q1–Q3) | Weighted Mean (SE) | Weighted Median (Q1–Q3)) | |
| Age(years) | 62.02 (0.369) | 65 (52–74) | 45.81 (0.19) | 45 (32–58) | 46.91 (0.192) | 46 (33–59) |
| For Categorical Variables | ||||||
| Unweighted Count | Weighted Percentage | Unweighted Count | Weighted Percentage | Unweighted Count | Weighted Percentage | |
| Gender | ||||||
| Male | 1388 | 37.68% | 19,4138 | 49.45% | 20,801 | 48.64% |
| Female | 1725 | 62.32% | 20,114 | 50.55% | 21,839 | 51.36% |
| Age Categories | ||||||
| 34 and Under | 144 | 5.76% | 12,983 | 29.69% | 11,079 | 28.05% |
| 35–54 | 528 | 24.54% | 11,585 | 40.29% | 14.161 | 39.21% |
| 55 and Above | 2441 | 69.70% | 14,959 | 30.02% | 17,400 | 32.73% |
| Race/Ethnicity | ||||||
| Non-Hispanic White | 2022 | 83.66% | 17,649 | 68.82% | 19,671 | 69.84% |
| Non-Hispanic Black | 529 | 7.14% | 8181 | 11.12% | 8710 | 10.85% |
| Hispanics | 427 | 5.49% | 10,627 | 13.77% | 11.054 | 13.20% |
| Others | 135 | 3.70% | 3070 | 6.28% | 3205 | 6.11% |
| Education Level | ||||||
| Less than 9th grade: | 367 | 6.35% | 4818 | 5.88% | 5185 | 5.92% |
| Grade 9–11: | 434 | 10.76% | 6081 | 11.85% | 6515 | 11.77% |
| High School Graduate | 721 | 23.19% | 9137 | 23.73% | 9858 | 23.69% |
| College Degree | 873 | 31.46% | 11,058 | 31.04% | 11,931 | 31.06% |
| College Graduate or above | 714 | 28.24% | 8390 | 27.51% | 9104 | 27.56% |
| Missing | 4 | 43 | 47 | |||
| Marital Status | ||||||
| Ever Married: | 2792 | 89.91% | 29,052 | 73.88% | 31,844 | 74.98% |
| Never Married: | 295 | 10.09% | 10,029 | 26.12% | 10,324 | 25.02% |
| Missing | 26 | 446 | 472 | |||
| Annual Family Income | ||||||
| Under $20,000 | 872 | 21.47% | 10,395 | 19.74% | 11,267 | 19.85% |
| $20,000 – $54,999 | 1323 | 41.53% | 15,567 | 38.58% | 16,890 | 38.79% |
| Over $54,999 | 810 | 37.00% | 11,945 | 41.68% | 12,755 | 41.36% |
| Missing | 108 | 1620 | 1728 | |||
| Health insurance | ||||||
| Yes | 2896 | 93.15% | 30,564 | 81.36% | 33,460 | 82.17% |
| No | 208 | 6.85% | 8796 | 18.64% | 9004 | 17.83% |
| Missing | 9 | 167 | 176 | |||
| Survey Period: | ||||||
| 1999–2000 | 272 | 8.55% | 3880 | 10.41% | 4152 | 10.29% |
| 2001–2002 | 316 | 9.14% | 4294 | 10.57% | 4610 | 11.47% |
| 2003–2004 | 318 | 10.03% | 3977 | 10.59% | 4295 | 10.55% |
| 2005–2006 | 276 | 9.83% | 4065 | 11.05% | 4341 | 10.96% |
| 2007–2008 | 412 | 11.10% | 4791 | 11.09% | 5203 | 11.09% |
| 2009–2010 | 409 | 11.22% | 4912 | 10.95% | 5321 | 10.97% |
| 2011–2012 | 346 | 12.11% | 4329 | 11.37% | 4675 | 11.42% |
| 2013–2014 | 368 | 13.18% | 4726 | 11.97% | 5094 | 12.05% |
| 2015–2016 | 396 | 14.84% | 4553 | 11.99% | 4949 | 12.19% |
| Smoking Status | ||||||
| Never Smoker | 1340 | 42.83% | 21,446 | 53.73% | 22,786 | 52.98% |
| Former Smoker | 1252 | 38.72% | 9552 | 24.07% | 10,804 | 25.07% |
| Current Smoker | 518 | 18.45% | 8495 | 22.20% | 9013 | 21.94% |
| Missing | 34 | 3 | 37 | |||
| Alcohol Status: | ||||||
| Never Drinker | 453 | 12.20% | 5939 | 11.89% | 6392 | 11.91% |
| Former Drinker | 889 | 24.39% | 7425 | 15.47% | 8314 | 16.08% |
| Current Drinker | 1771 | 63.41% | 26,163 | 72.64% | 27,934 | 72.01% |
| Exceeding Moderate Drinking among Current Drinker (N = 27,934): | ||||||
| Yes | 604 | 38.04% | 13,660 | 52.27% | 14,264 | 51.41% |
| No | 1167 | 61.96% | 12,503 | 47.73% | 13,670 | 48.59% |
| Binge Drinking among Current Drinker (N = 27,934): | ||||||
| Yes | 97 | 5.60% | 3587 | 12.59% | 3684 | 12.17% |
| No | 1674 | 94.40% | 22,576 | 87.41% | 24,250 | 87.83% |
Among 3113 cancer survivors (shown in Table 2), the most common first cancer diagnosis was breast cancer (20.53%), followed by prostate cancer (13.13%), cervical cancer (11.30%), melanoma (10.65%), colorectal cancer (7.11%), and uterine cancer (5.31%) with the remaining 31.97% having other types of cancer. Majority of the cancer survivors had cancers that were not attributed by alcohol (69.53%, n=2135). Most of the survivors had only one cancer diagnosis in the past (90.13%). Among of the 2985 cancer survivors who have available data on time since cancer diagnoses, the median time since diagnoses were 8 years. 61.03% of survivors had their cancer diagnosis more than 5 years ago.
Table 2.
Baseline Cancer Characteristics of Cancer Survivors Using 9 continuous NHANES dataset (N = 3113).
| Cancer characteristics | ||
|---|---|---|
| For Continuous Variables | ||
| Weighted Mean (SE) | Weighted Median (Q1–Q3) | |
| Years since Cancer Diagnosis | 11.09 (0.25) | 8 (3–16) |
| For Categorical Variables | ||
| Interval since cancer Diagnosis (N = 2985) | ||
| 0–5 yrs | 1216 | 38.97% |
| 6 yrs and beyond | 1769 | 61.03% |
| Missing | 128 | |
| Single vs. Multiple Cancers: | ||
| Single | 2807 | 90.13% |
| Multiple | 306 | 9.87% |
| First Cancer Types: | ||
| Breast | 613 | 20.53% |
| Prostate | 607 | 13.13% |
| Cervical | 268 | 11.30% |
| Melanoma | 236 | 10.65% |
| Colorectal | 281 | 7.11% |
| Uterine | 171 | 5.31% |
| Others a | 937 | 31.97% |
| Alcohol-attributable cancer | ||
| Alcohol-attributable cancer | 978 | 30.47% |
| Non-alcohol-attributable cancer | 2135 | 69.53% |
Other cancers include bladder cancer, blood cancer, bone cancer, brain cancer, esophagus cancer, gallbladder cancer, kidney cancer, larynx/windpipe cancer, liver cancer, lung cancer, lymphoma/Hodgkin’s disease, mouth/tongue/lip cancer, nervous system cancer, ovarian cancer, pancreas cancer, soft tissue cancer, stomach cancer, testicular cancer, and other non-specified cancer
The drinking patterns within cancer survivors by age group were similar to cancer-free individuals (Fig. 1.a). In both populations, as age increased, the proportion of current drinkers and the proportion of people engaging in exceeding moderate drinking and/or binge drinking decreased. When assessing drinking patterns by cancer type, compared with cancer-free individuals, cancer survivors of most cancer types had lower proportion of people engaged in risky drinking behaviors, except for cervical cancer survivors (Fig. 1.b). The specific count of individuals within each drinking categories can be found in Supp. Table 2.
Fig. 1.
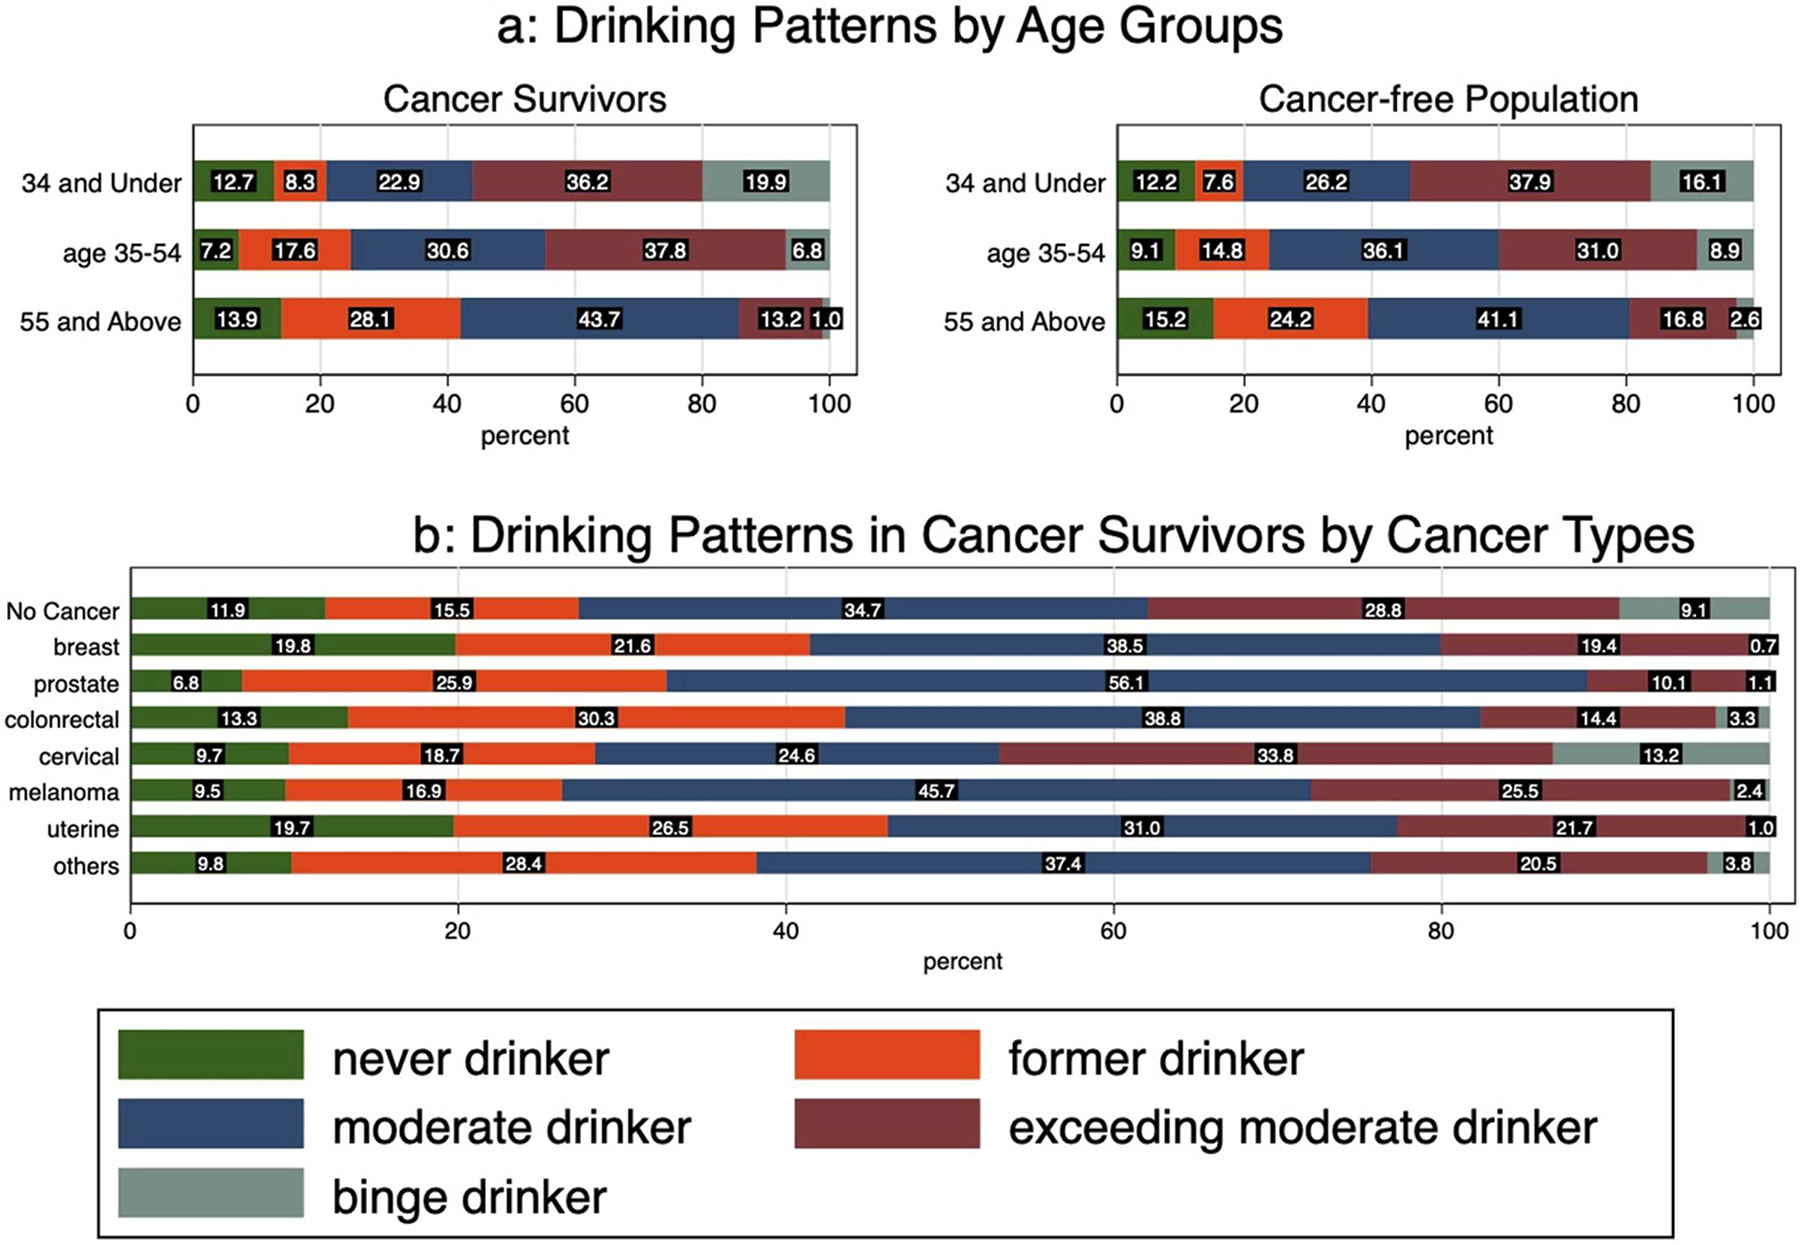
a Drinking Patterns by Age Groups, (b) Drinking Patterns in Cancer Survivors by Cancer Types.
3.2. Cancer characteristics and drinking status
After adjusting for continuous age, gender, educational level, marital status and smoking status in the multinomial regression models (shown in Table 3), the adjusted odds of being a former vs. never drinker was no different in survivors compared with cancer-free individuals (aOR: 1.09, 95% CI: 0.93–1.28). However, the adjusted odds of being a current vs. never drinker comparing survivors to cancer-free individuals was 0.84 (95% CI: 0.71–0.99).
Table 3.
Multivariable adjusteda odds ratio of drinking behaviors comparing cancer survivors to cancer-free individuals using 9 continuous NHANES datasets.
| Drinking Status | Risky Drinking Behaviors | |||||||
|---|---|---|---|---|---|---|---|---|
| Former Drinker (N = 8314) Vs. Never Drinkers (N = 6392) | Current Drinker (N = 27,934) Vs. Never Drinkers (N = 6392) | Exceeding Moderate Drinkers (N = 13,670) Vs. Moderate drinkers (N = 14,264) | Binge Drinkers (N = 3684) Vs. Non-Binge Drinkers (N = 24,250) | |||||
| Cancer status: | ||||||||
| Cancer Free Individuals | REF | |||||||
| Cancer survivors | 1.09 | 0.93–1.28 | 0.84 | 0.71–0.99 | 0.92 | 0.79–1.07 | 0.98 | 0.69–1.39 |
factors being adjusted include age, gender, race, education level, marital status and smoking status.
By cancer types, no significant associations were detected with being former vs. never drinkers (Table 4). The adjusted odds of being current drinkers vs. never drinker were significantly lower among breast cancer survivors (aOR: 0.67, 95% CI: 0.51–0.88) compared with cancer-free individuals. There were also reduced odds of being a current drinker vs a never drinker for melanoma, colorectal, and uterine cancer survivors compared with population cancer-free individuals; however, these associations were not statistically significant. The adjusted odds of being current vs. never drinkers among prostate cancer survivors was higher than odds among cancer-free individuals; but this association was not statistically significant. Additionally, we also observed a significant lower odds of being current vs. never drinkers among those who had cancers that could be attributable to alcohol consumption.
Table 4.
Multivariable adjusteda odds ratio of drinking behaviors comparing survivors with different cancer characteristics to cancer-free individuals using 9 continuous NHANES datesets.
| Drinking Status | Risky Drinking Behaviors | |||||||
|---|---|---|---|---|---|---|---|---|
| Former Drinker (N = 8314) Vs. Never Drinkers (N = 6392) | Current Drinker (N = 27,934) Vs. Never Drinkers (N = 6392) | Exceeding Moderate Drinkers (N = 13,670) Vs. Moderate drinkers (N = 14,264) | Binge Drinkers (N = 3684) Vs. Non-Binge Drinkers (N = 24,250) | |||||
| variables | Odds Ratio | 95% CI | Odds Ratio | 95% CI | Odds Ratio | 95% CI | Odds Ratio | 95% CI |
| Cancer type: | ||||||||
| Cancer Free Individuals | REF | |||||||
| Breast (female only) | 0.86 | 0.67–1.11 | 0.67 | 0.51–0.88 | 0.84 | 0.59–1.20 | 0.43 | 0.19–0.95 |
| Prostate (male only) | 1.21 | 0.78–1.89 | 1.33 | 0.87–2.02 | 0.71 | 0.50–1.00 | 0.35 | 0.16–0.74 |
| Cervical (female only) | 1.33 | 0.75–2.33 | 0.98 | 0.56–1.71 | 1.15 | 0.74–1.78 | 2.50 | 1.27–4.92 |
| Melanoma | 0.73 | 0.41–1.30 | 0.93 | 0.54–1.57 | 0.99 | 0.65–1.51 | 0.54 | 0.12–2.36 |
| Colorectal | 1.12 | 0.68–1.82 | 0.77 | 0.46–1.27 | 0.86 | 0.53–1.40 | 0.98 | 0.41–2.30 |
| Uterine (female only) | 1.09 | 0.60–1.98 | 0.63 | 0.37–1.08 | 0.65 | 0.35–1.19 | 0.24 | 0.07–0.90 |
| Others b | 1.44 | 1.08–1.92 | 0.90 | 0.66–1.21 | 0.98 | 0.78–1.24 | 0.91 | 0.57–1.46 |
| Alcohol-attributable cancer | ||||||||
| Cancer Free Individuals | REF | |||||||
| Alcohol-attributable cancer | 1.02 | 0.83–1.27 | 0.73 | 0.57–0.93 | 0.88 | 0.64–1.19 | 0.65 | 0.36–1.16 |
| Non-alcohol-attributable cancer | 1.14 | 0.94–1.39 | 0.91 | 0.75–1.11 | 0.94 | 0.79–1.11 | 1.06 | 0.70–1.60 |
| Number of Cancers: | ||||||||
| Cancer Free Individuals | REF | |||||||
| Single cancer | 1.05 | 0.90–1.24 | 0.83 | 0.70–0.99 | 0.87 | 0.75–1.02 | 0.94 | 0.65–1.34 |
| Multiple cancer | 1.52 | 0.86–2.68 | 1.00 | 0.59–1.68 | 1.49 | 0.98–2.25 | 1.51 | 0.58–3.92 |
| Survivorship: | ||||||||
| Cancer Free Individuals | REF | |||||||
| Short-term survivor (0–5 yrs) | 1.10 | 0.87–1.41 | 0.86 | 0.68–1.10 | 0.94 | 0.76–1.17 | 0.98 | 0.59–1.63 |
| Long-term survivor (>5 yrs) | 1.11 | 0.91–1.36 | 0.85 | 0.69–1.03 | 0.91 | 0.75–1.09 | 0.98 | 0.63–1.51 |
Factors being adjusted include age, gender, race, education level, marital status and smoking status.
Other cancers include bladder cancer, blood cancer, bone cancer, brain cancer, esophagus cancer, gallbladder cancer, kidney cancer, larynx/windpipe cancer, liver cancer, lung cancer, lymphoma/Hodgkin’s disease, mouth/tongue/lip cancer, nervous system cancer, ovarian cancer, pancreas cancer, soft tissue cancer, stomach cancer, testicular cancer, and other non-specified cancer.
By number of cancers diagnosed, we observed significant lower odds of being current drinkers vs. never drinker comparing single-cancer survivors to controls (aOR: 0.83, 95% CI: 0.70–0.99) (Table 4). But the odds of current drinking status did not significantly differ between multiple cancer survivors and cancer-free individuals. The associations with short- and long-term cancer survivorship and current drinking status were not significant (Table 4).
3.3. Cancer characteristics and risky drinking behavior within current drinkers
Adjusted odds ratios from the multivariable logistic models by risky drinking behaviors are shown in Tables 3 and 4. By cancer types, most cancers survivors were less likely to exceed moderate drinking compared with cancer-free individuals, but the results were not statistically significant. Cervical cancer survivors had 1.15 times the odds of exceeding moderate drinking compared to cancer-free individuals, but this result was not statistically significant (95% CI: 0.74–1.78). As for the association between type of cancer and the odds of being a binge drinker, we observed significant higher odds of binge drinking compared with cancer-free individuals among cervical cancer survivors (aOR 2.50, 95% CI: 1.27–4.92). Survivors with cancers other than cervical cancer were shown to have lower odds of binge drinking compared with cancer-free individuals, and the associations among breast cancer survivors (aOR: 0.43, 95% CI: 0.19–0.95), prostate cancer survivors (aOR: 0.35, 95% CI: 0.16–0.74), and uterine cancer survivors (aOR: 0.24, 95% CI: 0.07–0.90) were statistically significant.
Associations between single-cancer survivors and multiple-cancer survivors with the odds of exceeding moderate drinking and binge drinking were not statistically significant. Results were also not significant by time since cancer diagnosis (Table 4).
3.4. Odds of risky drinking behaviors within subgroups
The results from stratified analysis by age groups and by gender did not show significant differences in the odds of drinking status comparing survivors to cancer-free individuals (Supp. Table 3 , Supp. Table 4a).
When evaluating the odds of risky drinking behaviors, cancer survivors had significant lower odds of exceeding moderate drinking (aOR: 0.70, 95% CI: 0.58–0.85) and being binge drinker (aOR: 0.47, 95% CI: 0.26–0.86) compared with cancer-free individuals among people who were aged ≥ 55 years, whereas no significant association were observed between overall cancer status and risky behaviors in the other age groups (Table 5). By cancer type, among people aged < 35 years, the odds of binge drinking among colorectal cancer survivors was 5.11 times the odds among cancer-free individuals in the same age group (95% CI: 1.00–26.21). We also observed significant increase in the odds of engaging in binge drinking among cervical cancer survivors aged ≥ 55 years (aOR: 6.90, 95% CI: 1.27–37.3), whereas no significant associations were detected among other age groups. By gender, we found significant lower odds of exceeding moderate drinking (aOR: 0.66, 95% CI: 0.52–0.83) and binge drinking (aOR: 0.57, 95% CI: 0.36–0.88) when compared survivors to cancer-free individuals among males. By number of cancers diagnosed, we observed significant reduced odds of exceeding moderate drinking (aOR: 0.66, 95% CI: 0.52–0.84) compared with cancer-free individuals among males whereas no other association was detected between number of cancers diagnoses and risky drinking behaviors in this group. Among females, having multiple-cancer diagnoses were associated with a cancer-free individuals increase in the odds of exceeding moderate drinking behaviors compared to controls (aOR: 2.11, 95% CI: 1.24–3.56). Additionally, multiple-cancer diagnoses in survivors were related with an increase in the odds of binge drinking behaviors compared to cancer-free individuals, but the association was not significant (aOR: 3.13, 95% CI: 0.96–10.2). We did not observe a significant association between single cancer diagnosis and risky drinking behaviors among females.
Table 5.
Adjusteda odds of risky drinking behavior stratified by age group.
| Age ≤ 34 years | Age 35–54 years | Age ≥ 55 years | ||||||||||
|---|---|---|---|---|---|---|---|---|---|---|---|---|
| Exceeding Moderate Drinkers (N = 5649) Vs. Moderate Drinkers (N = 2819) | Binge Drinkers (N = 1697) Vs. Non-Binge Drinkers (N = 6771) | Exceeding Moderate Drinkers (N = 5602) Vs. Moderate Drinkers (N = 4587) | Binge Drinkers (N = 1471) Vs. Non-Binge Drinkers (N = 8718) | Exceeding Moderate Drinkers (N = 3013) Vs. Moderate Drinkers (N = 6264) | Binge Drinkers (N = 516) Vs. Non-Binge Drinkers (N = 8761) | |||||||
| variables | Odds Ratio | 95% CI | Odds Ratio | 95% CI | Odds Ratio | 95% CI | Odds Ratio | 95% CI | Odds Ratio | 95% CI | Odds Ratio | 95% CI |
| Cancer status: | ||||||||||||
| Cancer Free Individuals | REF | |||||||||||
| Cancer survivors | 0.81 | 0.49–1.34 | 1.51 | 0.72–3.18 | 1.08 | 0.80–1.44 | 1.09 | 0.69–1.72 | 0.70 | 0.58–0.85 | 0.47 | 0.26–0.86 |
| Cancer type: | ||||||||||||
| Cancer Free Individuals | REF | |||||||||||
| Breast (female only) b | / | / | 2.42 | 0.28–20.78 | 0.91 | 0.40–2.03 | 0.56 | 0.20–1.63 | 0.69 | 0.47–1.00 | 0.12 | 0.02–0.90 |
| Prostate (male only) c | / | / | / | / | 1.00 | 0.21–4.83 | 0.48 | 0.04–6.56 | 0.52 | 0.36–0.73 | 0.23 | 0.10–0.53 |
| Cervical (female only) | 1.17 | 0.46–2.96 | 2.36 | 0.91–6.17 | 1.22 | 0.66–2.27 | 2.23 | 0.97–5.12 | 1.12 | 0.5–2.51 | 6.90 | 1.27–37.3 |
| Melanoma d | 0.30 | 0.05–1.78 | / | / | 1.07 | 0.51–2.26 | 1.07 | 0.20–5.74 | 0.83 | 0.52–1.32 | 0.03 | 0.004–0.25 |
| Colorectal | 1.19 | 0.11–13.15 | 5.11 | 1.00–26.21 | 0.86 | 0.30–2.41 | 0.40 | 0.09–1.78 | 0.68 | 0.39–1.18 | 0.71 | 0.20–2.57 |
| Uterine (female only) | 0.51 | 0.12–2.24 | 0.05 | 0.002–0.92 | 0.36 | 0.14–0.92 | 0.41 | 0.09–1.83 | 0.89 | 0.42–1.89 | 1.07 | 0.14–7.96 |
| Others e | 0.75 | 0.34–1.65 | 1.42 | 0.58–3.52 | 1.26 | 0.79–2.00 | 0.94 | 0.48–1.81 | 0.70 | 0.50–0.99 | 0.46 | 0.18–1.15 |
| Alcohol-attributable cancer | ||||||||||||
| Cancer Free Individuals | REF | |||||||||||
| Alcohol-attributable cancer | 4.17 | 0.39–44.8 | 3.17 | 0.90–11.1 | 1.01 | 0.53–1.93 | 0.61 | 0.26–1.43 | 0.66 | 0.46–0.96 | 0.39 | 0.13–1.13 |
| Non-alcohol-attributable cancer | 0.74 | 0.45–1.21 | 1.43 | 0.65–3.16 | 1.10 | 0.79–1.53 | 1.24 | 0.74–2.10 | 0.72 | 0.58–0.89 | 0.50 | 0.24–1.03 |
| Number of Cancers: | ||||||||||||
| Cancer Free Individuals | REF | |||||||||||
| Single cancer | 0.83 | 0.50–1.39 | 1.53 | 0.71–3.27 | 1.01 | 0.75–1.38 | 1.00 | 0.62–1.62 | 0.80 | 0.61–1.05 | 0.44 | 0.24–0.82 |
| Multiple cancer | 0.38 | 0.07–2.18 | 1.18 | 0.14–9.73 | 2.24 | 0.91–5.50 | 2.32 | 0.52–10.35 | 0.65 | 0.52–0.83 | 0.75 | 0.16–3.56 |
| Survivorship: | ||||||||||||
| Cancer Free Individuals | REF | |||||||||||
| Short-term survivor (0–5 yrs) | 0.65 | 0.31–1.36 | 1.58 | 0.59–4.24 | 1.03 | 0.66–1.60 | 1.29 | 0.59–2.82 | 0.80 | 0.61–1.05 | 0.33 | 0.14–0.83 |
| Long-term survivor (>5 yrs) | 1.01 | 0.49–2.08 | 1.47 | 0.69–3.13 | 1.11 | 0.76–1.60 | 0.94 | 0.53–1.68 | 0.65 | 0.52–0.83 | 0.62 | 0.28–1.39 |
Factors being adjusted include age, gender, race, education level, marital status and smoking status.
2 breast cancer survivors under the age of 35 were exceeding moderate drinker and no breast cancer survivors in this age group were moderate drinker.
No prostate cancer survivors were 37 and under.
6 melanoma survivors under the age of 35 were no binge drinkers and no melanoma survivors in this age group were binge drinker.
Other cancers include bladder cancer, blood cancer, bone cancer, brain cancer, esophagus cancer, gallbladder cancer, kidney cancer, larynx/windpipe cancer, liver cancer, lung cancer, lymphoma/Hodgkin’s disease, mouth/tongue/lip cancer, nervous system cancer, ovarian cancer, pancreas cancer, soft tissue cancer, stomach cancer, testicular cancer, and other non-specified cancer
Stratified analyses by race were also performed, but associations were not statistically significant (data not shown).
4. Discussion
In this population-based cross-sectional study on alcohol consumption, we observed that the majority of cancer survivors self-reported to be current drinkers and majority of these current drinkers met the alcohol consumption recommendations for cancer survivors by American Cancer Society [32–35]. Our findings were consistent with a prior study using the National Health Interview Survey (NHIS) [36]. However, unlike the NHIS study, our study included a cancer-free population as our comparison group and concluded that although majority of the cancer survivors self-reported to be current drinkers, they were still less likely to be current drinkers compared to the cancer-free individuals. Similar with the NHIS study, we also observed that alcohol consumption behaviors differed by first cancer diagnosed. By cancer type, the only significant association was observed among breast cancer survivors. Additionally, we observed that cancer survivors have a higher odds of binge drinking compared to cancer-free individuals among those in the youngest age group, particularly for colorectal cancers survivors aged 18–37 who had 5-fold the odds of binge drinking when compared with cancer-free individuals from the same age group. The odds of consuming high amounts of alcohol were significantly lower among prostate cancer survivors compared to the general population. Our results showed that majority of the prostate cancer survivors followed the alcohol recommendation in the Prostate Survivorship Care Guideline by ACS [33], and it should not raise any urging concerns regarding alcohol consumption within this group.
The alcohol consumption patterns we observed among cervical cancer survivors compared to cancer-free individuals merit further discussion. We observed higher odds of engaging in binge drinking among cervical cancer survivors. Although a previous study suggested that the observed higher odds were most likely due to younger age, rather than being associated with cancer diagnosis [36], our stratified analyses by age indicated that such higher odds were presented in all age groups, especially among women who were 55 years and older. The higher adjusted odds of binge drinking in this population can also explain the observed higher odds of binge drinking among overall female cancer survivors. When we excluded cervical cancer survivors from the stratified analyses by gender, having a cancer diagnosis was associated with a reduction in the odds of binge drinking among women. Meanwhile, when we looked at time since diagnosis, among 267 cervical cancer survivors with available data on time since cancer diagnoses, only 23 of them reported having their cancer diagnosis no more than one year ago. This result suggested that majority of current drinkers in this population were drinking after their cancer diagnosis. Results from previous studies have shown that heavy alcohol use among cervical cancer survivors is associated with reductions in both cancer-free survival and overall survival [20], as well as reduction in quality of life after completion of cancer treatment [23]. While our study results among cervical cancer survivors highlight the need of implementing appropriate screenings and/or consultations to control alcohol use in this group, our results should be interpreted with caution due to smaller sample sizes in stratified groups.
Notably, we observed higher odds of risky drinking behaviors (exceeding moderate drinking and/or binge drinking) among survivors diagnosed with multiple cancers compared with cancer-free individuals in many of the subgroups. Statistically significant associations were not detected in many of the analyses potentially due to the limited number of multiple-cancer survivors captured in the study population. We suspect that the higher odds could be partially explained by mental health status as cancer diagnoses can bring anxiety and stress which could increase the risk of alcohol use disorders [43]. However, because mental health status was not captured by our analyses, future studies are needed to assess the effect of mental health on the association between cancer status and alcohol consumption. Meanwhile, our study results suggested potential positive association between multiple cancer diagnoses and heavy alcohol use and suggested a need to further evaluate potential risk factors for this association.
We used data from national populational-based surveys sample and compared alcohol consumption patterns among cancer survivors to cancer-free individuals in the general population. We evaluated cancer types to detect the cancer-specific drinking behaviors and provided evidence for cancer-specific alcohol control strategies. At the same time, our study had limitations. The alcohol consumption used in the study was captured through survey interviews, in which the prior literature has shown a significant under-reporting of alcohol consumed compared with other methods [44]. Future studies with better measurements of alcohol consumption are needed to confirm our study findings. Additionally, due to the limited number of young cancer survivors captured in NHANES, the stratified analysis using first diagnosed cancer type as the main predictor did not converge among some of the younger age groups. Therefore, we should be cautious when generalizing our study findings to younger populations. Also, this type of study design is subject to several potential biases. Survival bias may occur as cancer survivors are needed to survive until the time of the interview conducted to be included in the study sample. We may also have recall bias as cancer survivors may pay more attention on their daily lives and recall alcohol consumptions more accurately than those without the cancer diagnosis. Cancer survivors may also be less willing to admit to behaviors they may recognize are associated with cancer risk. Finally, due to the data source, we did not have information on the mental health status, tumor clinical characteristics, insurance information at the time of cancer diagnosis, the cancer treatment received and whether or not short-term survivors were still completing cancer treatments which could affect their current alcohol consumption. In this case, future studies are needed to further confirm our results.
5. Conclusions
Our findings suggest that the majority of cancer survivors are current drinkers. However, our findings also suggest that cancer survivors have lower odds of being current drinkers when compared with cancer-free individuals. Our study also provides evidence that survivors with different types of cancers have different alcohol consumption patterns which suggests that it may be useful to consider cancer type for future alcohol consumption recommendations. Given the high odds of binge drinking among cervical cancer survivors, public health strategies are needed to reduce alcohol consumption in this group.
Supplementary Material
Funding
This research did not receive any specific grant from funding agencies in the public, commercial, or not-for-profit sectors.
Footnotes
Appendix A. Supporting information
Supplementary data associated with this article can be found in the online version at doi:10.1016/j.canep.2022.102101.
Ethics approval
This study was reviewed by the Johns Hopkins School of Public Health Institutional Review Board and was deemed exempt from IRB oversight because it was a secondary analysis of existing, de-identified, publicly available data.
Declaration of conflicts of interests
The authors have no relevant financial or non-financial interest to disclose.
CRediT authorship contribution statement
Junrui Lyu: Conceptualization, Data curation, Formal analysis, Investigation, Methodology, Writing – original draft. Kate Dibble: Writing – original draft, Writing – review & editing. Maneet Kaur: Investigation, Writing – original draft, Writing – review & editing. Avonne Connor: Conceptualization, Methodology, Formal analysis, Investigation, Resources, Data curation, Writing – original draft, Writing – review & editing, Visualization, Supervision, Project administration.
Data Availability
The datasets analyzed during the current study are available from the National Health and Nutrition Examination Survey. The full datasets and documentations can be downloaded from https://www.cdc.gov/nchs/nhanes/index.htm.
References
- [1].Cancer Statistics. National Cancer Institute. 2021. 〈https://www.cancer.gov/about-cancer/understanding/statistics〉. (Accessed 15 March 2021). [Google Scholar]
- [2].Bluethmann SM, Mariotto AB, Rowland JH, Anticipating the ‘Silver Tsunami’: prevalence trajectories and co-morbidity burden among older cancer survivors in the United States, Cancer Epidemiol. Biomarkers Prevent 25 (2016) 1029–1036. [DOI] [PMC free article] [PubMed] [Google Scholar]
- [3].Parry C, Kent EE, Mariotto AB, Alfano CM, Rowland JH, Cancer survivors: a booming population, Cancer Epidemiol. Biomarkers Prevent 20 (2011) 1996–2005. [DOI] [PMC free article] [PubMed] [Google Scholar]
- [4].de Moor JS, Mariotto AB, Parry C, Alfano CM, Padgett L, Kent EE, et al. , Cancer survivors in the United States: prevalence across the survivorship trajectory and implications for care, Cancer Epidemiol. Biomarkers Prevent 22 (2013) 561–570. [DOI] [PMC free article] [PubMed] [Google Scholar]
- [5].Alcohol consumption and ethyl carbamate. IARC monographs on the evaluation of carcinogenic risks to humans 2010; 96:3–1383. [PMC free article] [PubMed] [Google Scholar]
- [6].Personal habits and indoor combustions. Volume 100 E. A review of human carcinogens. IARC monographs on the evaluation of carcinogenic risks to humans 2012; 100:1–538. [PMC free article] [PubMed] [Google Scholar]
- [7].Alcohol Use and Cancer. American Cancer Society, 2021. 〈https://www.cancer.org/cancer/cancer-causes/diet-physical-activity/alcohol-use-and-cancer.html〉. Accessed 11 Jan 2021. [Google Scholar]
- [8].Smith-Warner SA, Spiegelman D, Yaun S, van den Brandt A. Piet, Folsom AR, Goldbohm RA, et al. , Alcohol and breast cancer in women: a pooled analysis of cohort studies, JAMA J. Am. Med. Assoc 279 (1998) 535–540. [DOI] [PubMed] [Google Scholar]
- [9].Purohit V, Khalsa J, Serrano J, Mechanisms of alcohol-associated cancers: introduction and summary of the symposium, Alcohol 35 (2005) 155–160. [DOI] [PubMed] [Google Scholar]
- [10].Boffetta P, Hashibe M, Alcohol and cancer, Lancet Oncol. 7 (2006) 149–156. [DOI] [PubMed] [Google Scholar]
- [11].Jerjes W, Upile T, Radhi H, Petrie A, Abiola J, Adams A, et al. , The effect of tobacco and alcohol and their reduction/cessation on mortality in oral cancer patients: short communication, Head Neck Oncol. 4 (2012) 6. [DOI] [PMC free article] [PubMed] [Google Scholar]
- [12].Park SM, Lim MK, Shin SA, Yun YH, Impact of prediagnosis smoking, alcohol, obesity, and insulin resistance on survival in male cancer patients: national health insurance corporation study, J. Clin. Oncol 24 (2006) 5017–5024. [DOI] [PubMed] [Google Scholar]
- [13].Mayne ST, Cartmel B, Kirsh V, Goodwin WJ, Alcohol and tobacco use prediagnosis and postdiagnosis, and survival in a cohort of patients with early stage cancers of the oral cavity, pharynx, and larynx, Cancer Epidemiol. Biomarkers Prevent 18 (2009) 3368–3374. [DOI] [PMC free article] [PubMed] [Google Scholar]
- [14].Wu I, Wu C, Lu C, Hsu W, Wu M, Lee J, et al. , Substance use (alcohol, areca nut and cigarette) is associated with poor prognosis of esophageal squamous cell carcinoma, PLoS one 8 (2013), e55834. [DOI] [PMC free article] [PubMed] [Google Scholar]
- [15].Li Y, Mao Y, Zhang Y, Cai S, Chen G, Ding Y, et al. , Alcohol drinking and upper aerodigestive tract cancer mortality: a systematic review and meta-analysis, Oral Oncol. 50 (2013) 269–275. [DOI] [PubMed] [Google Scholar]
- [16].Holm M, Olsen A, Christensen J, Kroman NT, Bidstrup PE, Johansen C, et al. , Pre-diagnostic alcohol consumption and breast cancer recurrence and mortality: results from a prospective cohort with a wide range of variation in alcohol intake, Int. J. Cancer 132 (2013) 686–694. [DOI] [PubMed] [Google Scholar]
- [17].Knight JA, Bernstein L, Haile RW, Boice JD, Bernstein JL, Largent J, et al. , Alcohol intake and cigarette smoking and risk of a contralateral breast cancer: the women’s environmental cancer and radiation epidemiology study, Am. J. Epidemiol 169 (2009) 962–968. [DOI] [PMC free article] [PubMed] [Google Scholar]
- [18].Kwan ML, Kushi LH, Weltzien E, Tam EK, Castillo A, Sweeney C, et al. , Alcohol consumption and breast cancer recurrence and survival among women with early-stage breast cancer: the life after cancer epidemiology study, J. Clin. Oncol 28 (2010) 4410–4416. [DOI] [PMC free article] [PubMed] [Google Scholar]
- [19].Weaver A, McCann S, Nie J, Edge S, Nochajski T, Russell M, et al. , Alcohol intake over the life course and breast cancer survival in Western New York exposures and breast cancer (WEB) study: quantity and intensity of intake, Breast Cancer Res. Treat 139 (2013) 245–253. [DOI] [PMC free article] [PubMed] [Google Scholar]
- [20].Mayadev J, Li C, Lim J, Valicenti R, Alvarez EA, Alcohol abuse decreases pelvic control and survival in cervical cancer: an opportunity of lifestyle intervention for outcome improvement, Am. J. Clin. Oncol 40 (2017) 451–457. [DOI] [PMC free article] [PubMed] [Google Scholar]
- [21].Lown EA, Goldsby R, Mertens AC, Greenfield T, Bond J, Whitton J, et al. , Alcohol consumption patterns and risk factors among childhood cancer survivors compared to siblings and general population peers, Addiction 103 (2008) 1139–1148. [DOI] [PMC free article] [PubMed] [Google Scholar]
- [22].So WKW, Chan RJ, Chan DNS, Hughes BGM, Chair SY, Choi KC, et al. , Quality-of-life among head and neck cancer survivors at one year after treatment – a systematic review, Eur. J. Cancer 2012 (48) (1990) 2391–2408. [DOI] [PubMed] [Google Scholar]
- [23].Iyer NS, Osann KMPH, Hsieh S, Tucker JA, Monk BJ, Nelson EL, et al. , Health behaviors in cervical cancer survivors and associations with quality of life, Clin. Therapeut 38 (2016) 467–475. [DOI] [PMC free article] [PubMed] [Google Scholar]
- [24].Rehm J, The risks associated with alcohol use and alcoholism, Alcohol Res. Health 34 (2) (2011) 135–143. [PMC free article] [PubMed] [Google Scholar]
- [25].Lajous M, Mozaffarian D, Mozaffarian R, Schrag D, Adami H, Lifestyle prescriptions for cancer survivors and their communities, J. Int. Med 269 (2011) 88–93. [DOI] [PubMed] [Google Scholar]
- [26].Oh C, Lee D, Kong H, Lee S, Won Y, Jung K, et al. , Causes of death among cancer patients in the era of cancer survivorship in Korea: Attention to the suicide and cardiovascular mortality, Cancer Med. 9 (2020) 1741–1752. [DOI] [PMC free article] [PubMed] [Google Scholar]
- [27].Zaorsky NG, Churilla TM, Egleston BL, Fisher SG, Ridge JA, Horwitz EM, et al. , Causes of death among cancer patients, Ann. Oncol 28 (2017) 400–407. [DOI] [PMC free article] [PubMed] [Google Scholar]
- [28].Sayon-Orea C, Martinez-Gonzalez MA, Bes-Rastrollo M, Alcohol consumption and body weight: a systematic review, Nutr. Rev 69 (2011) 419–431. [DOI] [PubMed] [Google Scholar]
- [29].Beard E, West R, Michie S, Brown J, Association between smoking and alcohol-related behaviours: a time–series analysis of population trends in England, Addiction 112 (2017) 1832–1841. [DOI] [PMC free article] [PubMed] [Google Scholar]
- [30].Community Strategies to Reduce Excessive Alcohol Use. Center for Disease Control and Prevention. 2020. 〈https://www.cdc.gov/cancer/alcohol/reducing-excessive-alcohol-use/community-strategies.htm〉 (Accessed 17 December 2020). [Google Scholar]
- [31].Clinical Strategies to Reduce Excessive Alcohol Use. Center for Disease Control and Prevention. 2020. 〈https://www.cdc.gov/cancer/alcohol/reducing-excessive-alcohol-use/clinical-strategies.htm〉. (Accessed 17 December 2020. [Google Scholar]
- [32].Runowicz CD, Leach CR, Henry NL, Henry KS, Mackey HT, Cowens-Alvarado RL, et al. , American Cancer Society/American Society of clinical oncology breast cancer survivorship care guideline, J. Clin. Oncol 34 (2016) 611–635. [DOI] [PubMed] [Google Scholar]
- [33].Skolarus TA, Wolf AMD, Erb NL, Brooks DD, Rivers BM, Underwood W, et al. , American Cancer Society prostate cancer survivorship care guidelines, CA Cancer J. Clien 64 (2014) 225–249. [DOI] [PubMed] [Google Scholar]
- [34].El-Shami K, Oeffinger KC, Erb NL, Willis A, Bretsch JK, Pratt-Chapman ML, et al. , American Cancer Society colorectal cancer survivorship care guidelines, CA Cancer J. Clien 65 (2015) 427–455. [DOI] [PMC free article] [PubMed] [Google Scholar]
- [35].Cohen EEW, LaMonte SJ, Erb NL, Beckman KL, Sadeghi N, Hutcheson KA, et al. , American Cancer Society head and neck cancer survivorship care guideline, CA Cancer J. Clien 66 (2016) 203–239. [DOI] [PubMed] [Google Scholar]
- [36].Sanford NN, Sher DJ, Xu X, Ahn C, D’Amico AV, Aizer AA, et al. , Alcohol Use among patients with cancer and survivors in the United States, 2000–2017, J. Nat. Compr. Cancer Network 18 (2020) 69–79. [DOI] [PubMed] [Google Scholar]
- [37].LoConte NK, Brewster AM, Kaur JS, Merrill JK, Alberg AJ, Alcohol and cancer: a statement of the American Society of Clinical Oncology, J. Clin. Oncol 36 (2018) 83–93. [DOI] [PubMed] [Google Scholar]
- [38].Centers for Disease Control and Prevention (CDC). National Center for Health Statistics (NCHS). National Health and Nutrtion Examination Survey Data. Hyattsvile, MD: U.S. Department of Health and Human Services, Centers for Disease Control and Prevention, Year 1999–2016.〈https://www.cdc.gov/nchs/nhanes/index.htm〉. [Google Scholar]
- [39].Zipf G, Chiappa M, Porter KS, Ostchega Y, Lewis BG, Dostal J National health and nutrition examination survey: plan and operations, 1999–2010. Vital and health statistics. Series 1. Programs and collection procedures 2013:1–37. [PubMed] [Google Scholar]
- [40].Rivera A, Nan H, Li T, Qureshi A, Cho E, Alcohol intake and risk of incident melanoma: a pooled analysis of three prospective studies in the U.S, Cancer Epidemiol. Biomarkers Prevent 25 (2016) 1550–1558. [DOI] [PMC free article] [PubMed] [Google Scholar]
- [41].Dietary Guidelines for Americans, 2020–2025. 9th Edition. U.S. Department of Agriculture and U.S. Department of Health and Human Service. 2020. 〈https://www.dietaryguidelines.gov/resources/2020-2025-dietary-guidelines-online-materials〉. (Accessed 12 February 2021). [Google Scholar]
- [42].How can I check for collinearity in survey regression? UCLA: Statistical Consulting Group. 〈https://stats.idre.ucla.edu/stata/faq/how-can-i-check-for-collinearity-in-survey-regression/〉. Accessed 20 Oct 2020. [Google Scholar]
- [43].Keyes KM, Hatzenbuehler ML, Grant BF, Hasin DS, Stress and alcohol: epidemiologic evidence, Alcohol Res. 34 (2012) 391–400. [PMC free article] [PubMed] [Google Scholar]
- [44].Boniface S, Kneale J, Shelton N, Shelton N Drinking pattern is more strongly associated with under-reporting of alcohol consumption than socio-demographic factors: evidence from a mixed-methods study, BMC public health 14 (2014) 1297. [DOI] [PMC free article] [PubMed] [Google Scholar]
Associated Data
This section collects any data citations, data availability statements, or supplementary materials included in this article.
Supplementary Materials
Data Availability Statement
The datasets analyzed during the current study are available from the National Health and Nutrition Examination Survey. The full datasets and documentations can be downloaded from https://www.cdc.gov/nchs/nhanes/index.htm.