

SUMMARY
Arid ecosystems cover ∼40% of the Earth’s terrestrial surface and store a high proportion of the global nitrogen (N) pool. They are low-productivity, low-biomass, and polyextreme ecosystems, i.e., with (hyper)arid and (hyper)oligotrophic conditions and high surface UV irradiation and evapotranspiration. These polyextreme conditions severely limit the presence of macrofauna and -flora and, particularly, the growth and productivity of plant species. Therefore, it is generally recognized that much of the primary production (including N-input processes) and nutrient biogeochemical cycling (particularly N cycling) in these ecosystems are microbially mediated. Consequently, we present a comprehensive survey of the current state of knowledge of biotic and abiotic N-cycling processes of edaphic (i.e., open soil, biological soil crust, or plant-associated rhizosphere and rhizosheath) and hypo/endolithic refuge niches from drylands in general, including hot, cold, and polar desert ecosystems. We particularly focused on the microbially mediated biological nitrogen fixation, N mineralization, assimilatory and dissimilatory nitrate reduction, and nitrification N-input processes and the denitrification and anaerobic ammonium oxidation (anammox) N-loss processes. We note that the application of modern meta-omics and related methods has generated comprehensive data sets on the abundance, diversity, and ecology of the different N-cycling microbial guilds. However, it is worth mentioning that microbial N-cycling data from important deserts (e.g., Sahara) and quantitative rate data on N transformation processes from various desert niches are lacking or sparse. Filling this knowledge gap is particularly important, as climate change models often lack data on microbial activity and environmental microbial N-cycling communities can be key actors of climate change by producing or consuming nitrous oxide (N2O), a potent greenhouse gas.
KEYWORDS: biogeochemistry, desert, drylands, soils, biological soil crusts, lithobiont, diazotrophy, nitrogen cycling
INTRODUCTION
Drylands represent ∼40% of the Earth’s terrestrial surface, occur on all continents, and are expanding with climate change (1). Drylands are arid environments, i.e., they present an overall deficiency in water availability. The aridity index (AI), which is the ratio of precipitation (P) to potential evapotranspiration (PET), is used to subcategorize them into hyperarid (AI < 0.05), arid (0.05 < AI < 0.2), semiarid (0.2 < AI < 0.5), and dry subhumid (0.5 < AI < 0.65) drylands (Fig. 1). Drylands with an AI of <0.65 encompass various ecosystems such as scrublands, shrublands, grasslands, savannas, semideserts, and true deserts. In this context, it must be noted that most of the studies used in this review were conducted in environments ranging from semiarid to hyperarid zones. Deserts further can be subdivided into three distinct categories depending on their global climatic conditions: hot (mean annual temperature > 18°C), cold (mean annual temperature < 18°C), or polar (warmest month mean temperature < 10°C) deserts.
FIG 1.

Global aridity index (AI) map and microbial N-cycling gene abundances in various desert niches. The AI map (Esri grid) was obtained from the Food and Agriculture Organization of the United Nations (FAO, 10 arc min; https://data.apps.fao.org/map/catalog/srv/eng/catalog.search#/metadata/221072ae-2090-48a1-be6f-5a88f061431a) and was visually represented with ArcGIS Pro. The AI classification is shown in the key on the figure. Hot, cold, and polar deserts where quantification of microbial cycling genes has been performed are indicated by numbers. Quantitative expression (qPCR) levels of functional genes involved in N cycling were collected from available sources (Table 3), and the average expression per gene (as copies g−1 dry/crusted soil) was calculated for each desert. Note that the y axes of the bar plots present different scales. “D” indicates genes detected by metagenomic and/or metatranscriptomic data without available quantitative expressions levels. N.E., not evaluated; BSC, biological soil crusts. References are given in Tables 1, 2, and 3.
Drylands are typically characterized by (i) low water availability, (ii) extreme diel and seasonal temperature ranges and fluctuations, (iii) high UV radiation, and (iv) low nutrient status (i.e., oligotrophy) (2). Due to these polyextreme conditions, microbial communities are most prevalent in islands of fertility, i.e., in specialized shielded niches such as biological soil crusts (BSCs), plant-associated environments (e.g., rhizospheres and rhizosheath/root systems), and lithic habitats, i.e., hypoliths and (chasmo/crypto)endoliths, which are microbial communities found under the ventral surface of translucent rocks or within the fissures and pores of rocks, respectively (3–6). Furthermore, since plant productivity is both temporally and spatially limited in arid ecosystems, microbial communities are the principal drivers of primary production and nutrient cycling (4, 5, 7, 8).
Nitrogen (N) is an element essential for life. Yet, despite amounting to some 4 × 10¹⁸ kg N in the form of dinitrogen (N2) in the atmosphere (i.e., 78% of the total mean mass of the atmosphere, which has been estimated to represent 5.148 × 10¹⁸ kg) (9), nitrogen is often a limiting factor for terrestrial and aquatic ecosystem productivity (10, 11). Oceans contain approximately 1 Tg (1 × 10⁹ kg) of N, 94% as biounavailable N2 and much of the rest as bioavailable nitrate (NO3−) (12). The N lithospheric content has been estimated to range between 133 × 103 and 140 × 103 Tg N in the top 100 cm of the terrestrial surface (13). Deserts have been estimated to store 95 × 103 Tg of N (14), i.e., more than half of the terrestrial N pool. Recent evidence suggests that drylands store an even greater amount of N in large subterranean nitrate (NO3−) pools, representing ∼104 kg N ha−1 (15, 16). Extrapolated to the global desert pavement surface area, this would represent a 5-fold increase in total N storage in desert soils. Consequently, models suggest that 80% of the global nitrate pool (i.e., 460 Tg) is stored in deserts (17). However, due to the combination of water scarcity and high soil salinity, much of this pool is unavailable to productive guilds, i.e., plants and microbial communities (16). In drylands, N is considered the second most important limiting factor after water; i.e., it is the most limiting nutrient (18–20).
As in other environments, the arid land microbial communities are critical for the completion of the biogeochemical N cycle, as specific taxa are the sole mediators of key processes that control the quantities of bioavailable ammonium/ammonia (NH4+/NH3) and nitrate (NO3−). These include biological N fixation (BNF) and nitrification, which are processes by which N is added to the environment (Fig. 2), and denitrification, a process by which N is lost and which can lead to the production of the greenhouse gas nitrous oxide (N2O) (Fig. 2). Global annual terrestrial microbial production of N2O has been estimated to amount to 7.2 to 13.2 Tg N year−1, of which drylands contribute 3 × 10⁻¹² to 49 × 10−12 Tg N ha−1 year−1 (21). With drylands covering ∼6 billion hectares globally (22), this represents 1.8 × 10⁻⁵ to 2.94 × 10⁻³ Tg N year−1.
FIG 2.

Biogeochemical cycle of nitrogen. Denitrification encompasses the nitrate, nitrite, nitric oxide, and nitrous oxide reduction reactions, and nitrification encompasses the aerobic ammonia, hydroxylamine, and nitrite oxidation reactions. Amm., ammonification; AO, ammonia oxidation; BNF, biological nitrogen fixation; DNRA, dissimilatory nitrate reduction to ammonium; HO, hydroxylamine oxidation; NO, nitrate oxidation; anammox, anaerobic ammonium oxidation; comammox, complete ammonia oxidation; Damo, denitrifying anaerobic methane oxidation. Microbial genes relevant to each process are indicated. N-Org, organic nitrogen. The NH4+/NH3 equilibrium in the environment is controlled by many parameters. Ammonia volatilization has notably been positively correlated to soil pH, CaCO3, and salt contents and negatively to soil cation exchange capacity, organic matter, and clay contents (323).
The inherent oligotrophy of dryland ecosystems makes them particularly vulnerable to the alterations of the global N cycle by anthropogenic activities and global climate change (23). As the acceleration of desertification processes is an inevitable consequence of current anthropogenic activities (24), it becomes increasingly important to understand the global functioning of arid ecosystems. Here, we describe and discuss the abiotic and microbial processes that contribute to N cycling in the various niches of arid environments.
NITROGEN INPUT PROCESSES IN ARID ENVIRONMENTS
Nitrogen is the principal limiting factor in the net primary productivity (NPP) of most terrestrial ecosystems (19), the exception being arid ecosystems, where water availability is the dominant driver of NPP (18–20). In natural ecosystems, as opposed to engineered/man-made ecosystems like wastewater treatment plants or fertilized fields, three processes are responsible for de novo nitrogen inputs: (i) atmospheric wet (precipitation) as well as dry gaseous (NOx, HNO3, and NH3) and dust sources, (ii) lightning, and (iii) biological nitrogen fixation (BNF) (Fig. 2) (25–29).
BNF is by far the most dominant process, estimated to be responsible for over 97% of the terrestrial N input in pristine terrestrial systems (27), representing at a global scale from 52 to ∼195 Tg N year−1 (30, 31). This proportion is also observed in drylands, even though barren lands have the lowest terrestrial BNF globally (31, 32). In desert and arid shrubland ecosystems, BNF has been estimated to contribute 4.8 to 10.8 kg N ha−1 year−1 and 9.4 to 33.9 kg N ha−1 year−1, respectively (30). This is significantly higher than BNF in cold boreal forest ecosystems (i.e., 1.5 to 2.0 kg N ha−1 year−1) (30). This suggests that polar and cold desert BNF is rather low due to lower biological activities (33). Furthermore, it indicates that in dryland ecosystems, BNF is favored in less arid drylands, i.e., increases with vegetation cover. A recent meta-analysis at the Latin American scale confirms this view (34).
Other microbially mediated processes also participate in the input of bioavailable N, particularly through the recycling of the soil N pool via various biogeochemical transformations: ammonification, nitrification, and dissimilatory and assimilatory nitrate reduction (Fig. 2). These are particularly important, as organic N represents over 99% of the total N in most environments, including drylands (35).
Abiotic Nitrogen Deposition and Fixation
Atmospheric nitrogen deposition results from three abiotic processes: gaseous (NOx, NO2, HNO3, and NH3) and dust deposition (dry process), precipitation (wet process), and nitrogen fixation by lightning (30, 36, 37). On a global scale, lightning-derived N fixation, in the form of nitrogen oxides (NOx), is estimated to be ∼7 Tg N year−1. This is particularly important around the tropics (36, 38, 39), where most deserts are located. However, satellite data clearly demonstrate that for most deserts, particularly the Sahara and Central Australian deserts, this form of N input is negligible, most probably due to the rarity of storms in such environments (38, 40). For the same reason, atmospheric (wet) N deposition—in the reduced ammonium NH4+ and/or oxidized nitrate (NO3−) forms—is also temporally limited in drylands but, in contrast to lightning-based N fixation, is not negligible. The wet deposition of ammonium (NH4+) in drylands is highly correlated with the magnitude of precipitation events, with concentrations often exceeding those of nitrate (NO3−) by up to 50% (41–43). In dryland soils, NH4+, rather than being directly taken up by plants, is usually nitrified into nitrate, which can decrease soil pH (44). Ultimately, a large percentage (>40%) of the wet deposited ammonium/nitrate is retained by the vegetation and therefore improves plant biomass production in drylands (43).
Globally, the total N deposition is estimated to range between 125 and 132 Tg N year−1 (45) and varies between ∼0.5 and ∼7.5 kg N ha−1 year−1 in most drylands (46). However, it is desert/dryland dependent. In the Chihuahan Desert (USA), between 1989 and 2004, atmospheric ammonium and nitrate deposition were positively correlated to precipitation and estimated to represent 1.2 kg ha−1 year−1 and 0.9 kg ha−1 year−1, respectively (37). In contrast, in an area spanning the Sonoran and Mojave Deserts (USA), total atmospheric N deposition, which ranged from 2.8 to 14.4 kg N ha−1 year−1, was not correlated with annual precipitation (47). This apparent dichotomy was also observed at two sites in the Negev Desert (less than 50 km apart) which received similar total N atmospheric inputs (∼0.84 kg N ha−1 year−1). However, one received more atmospheric N deposition during the dry season and the other during the rainy season (48). Together, this clearly demonstrates that local climatic regimes should be monitored when assessing abiotic nitrogen deposition in deserts. For example, the coastal regions of the Atacama (Chile) and Namib (Namibia) Deserts are subjected to regular fog events, with fog water nitrate concentrations ranging from 17.8 to 27.8 mg L−1 and 36.2 to 71.2 mg L−1, respectively (46, 49, 50). In the Namib Desert, fog water deposition can range from 3 mm (112 km from the coast) to 184 mm (33 km inland) annually (51). In the Atacama Desert, fog water deposition is particularly important in the first 10 km from the Pacific Ocean and has been estimated to represent ∼25 L m−2 (52). Consequently, this provides a significant N input in the form of nitrate deposition, ranging from 1.1 to 2.1 kg ha−1 year−1 to 66.6 to 131.0 kg ha−1 year−1 and from 0.5 to 0.7 kg ha−1 year−1 in the Namib and Atacama Deserts, respectively. As nitrate is deposited with water, it becomes immediately bioavailable, which explains the rather important microbial and vegetation life in the fog-influenced zones of these deserts (53–56).
Human activities have increased the atmospheric N pool by particularly intensifying atmospheric N deposition, thus altering the global N biogeochemical cycle (57). In the Chihuahan Desert, N deposition rates have increased between 1989 and 2004 by 0.049 kg ha−1 year−1 (37). In this context, the expansion of urban areas in the vicinity of drylands will also locally impact atmospheric N deposition (47, 58). In the Sonoran Desert, atmospheric N deposition rates within metropolitan Phoenix and in the nearby desert have been shown to represent 7.2 (±0.4) and 6.1 (±0.3) kg N ha−1 year−1, respectively, over a 9-year period (2006 to 2015). It is difficult to predict how this increase in N deposition will influence local productivity and microbially mediated N cycling in drylands, since the potential use of N is ultimately linked to the availability of water, which is predicted to remain a scarce resource in most drylands with global climate change (59). Nevertheless, precipitation increases the availability of N in these environments (60, 61). This has been shown to decrease plant community diversity and favor nonnative grass growth (57, 61). Similarly, it certainly will impact the structure and function of dryland (N-cycling) microbial communities, particularly of those interacting with the native plants. This is further supported by a meta-analysis, based on 454 experiments, which suggests edaphic microbial biomass increases in grasslands and decreases in deserts after N addition, whereas fungal biomass decreases in both arid biomes (62). In the Gurbantünggüt Desert (northwestern China), surface soil enzyme activities also varied after N addition (63). Together, this clearly shows that increasing atmospheric N deposition will modify dryland ecosystems’ functioning and their N biogeochemical cycling.
Biological Nitrogen Fixation
Prokaryotic N fixers in drylands.
The phylogenetic affiliations and abundances of environmental diazotrophic taxa are generally evaluated using the nitrogenase nifH gene (Fig. 1 and 2) (64–68). However, for accurate diversity analyses of N-fixing taxa, the use of multiple primer sets and/or a combination of approaches is recommended (68, 69). For example, in a global survey of hypolithic communities, diazotrophic cyanobacteria (e.g., Nostoc spp.) were detected using the 16S rRNA gene but not with nifH PCR primers known to amplify cyanobacterial nifH genes (68). Similarly, nitrogen-fixing genes were marginally detected in shotgun metagenomes from hypolithic and endolithic communities (70, 71), whereas microscopic observations (72) and stable isotope analyses (73) clearly supported the presence of diazotrophic microorganisms in these niche communities.
The capacity for diazotrophy is present in various branches of the bacterial and archaeal domains, particularly within the bacterial phyla Cyanobacteria, Actinomycetota, Bacillota, and Pseudomonadota and the Euryarchaeota archaeal phylum (30, 74–77). Despite being a highly energy-demanding process (16 ATP molecules and 8 electrons per N2 molecule reduced) (64), N-fixing representatives from all of these phyla have been detected in hot and cold desert edaphic and cryptic niche communities (Fig. 3; Table 1) (6, 65, 67, 68, 70, 78–84). Environmental N fixation is most commonly quantified using the acetylene reduction assay (ARA), which measures nitrogenase activity via the reduction of acetylene to ethylene (85), and 15N2 incorporation rate measurements (86) (Table 1).
FIG 3.
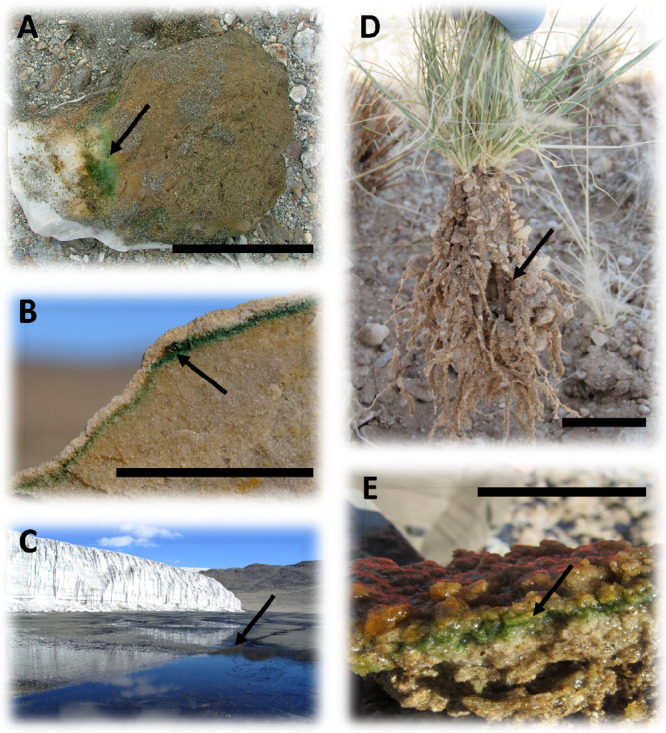
Cryptic and productive desert niches colonized by free-living and symbiotic N fixers. (A) Large quartz hypolith from the McMurdo Dry Valleys (East Antarctica). The ventral surface of the quartz rock shows extensive hypolithic biomass. (B) Cryptoendolithic community in Antarctic Beacon sandstone. The green layer is dominated by Cyanobacteria. (C) Antarctic glacial runoff pan with extensive Nostoc species growth. (D) Rhizosheath-root structure of Stipagrostis ciliata (Namib Desert). (E) Namib Desert stratified salt pan microbial mat. Black bars, 3 cm. Black arrows indicate the productive and N-fixing zone.
TABLE 1.
Microbial nitrogen fixation in hot and cold dryland/desert habitatsa
| Habitat type | Desert | Reference | Acetylene reduction assay rates | nifH detection and/or abundances | Diversity of diazotrophs |
|---|---|---|---|---|---|
| Biological soil crust | Canyonlands, Utah | 280 | Light crust: 0.13 ± 0.05 μmol m−2 h−1 | NE | NE |
| Dark crust: 0.86 ± 0.26 μmol m−2 h−1 | NE | NE | |||
| Chihuahuan Desert | 309 | ∼40–100 μmol m−2 h−1 | NE | Scytonema sp., Microcoleus steenstrupii, Microcoleus vaginatus, Pseudanabaena sp. | |
| 324 | Early successional crust: ∼3–20 μmol C2H4 m−2 day−1 | NE | NE | ||
| Late successional crust: ∼10–100 μmol C2H4 m−2 day−1 | NE | NE | |||
| 130 | 0.04–12.69 nmol C2H4 m−2 h−1 | NE | NE | ||
| 20 nmol C2H4 cm−2 h−1 | NE | NE | |||
| 131 | Lichen crust: ∼0–100 μmol N m−2 h−1 | 5.13 × 10¹² copies g−1 | Nostoc spp., Tolypothrix spp., Scytonema spp. | ||
| Light crust: ∼0–50 μmol N m−2 h−1 | 2.52 × 10¹² copies g−1 | Nostoc spp., Tolypothrix spp., Scytonema spp. | |||
| 106 | Poorly developed crust (Microcoleus spp. dominated): ∼5 μmol m−2 h−1 | 1.8 × 10⁶ copies g−1 soil | Microcoleus steenstrupii, Microcoleus vaginatus | ||
| Mature crust (mixed cyanobacteria, lichen, and moss): ∼12 μmol m−2 h−1 | 3.4 × 10⁷ copies g−1 soil | Microcoleus steenstrupii, Chrococcidiopsis sp., Scytonema sp. | |||
| 103 | NE | D | nifH clusters S1 (29/121; Scytonema sp.), S2 (7/121; Scytonema hyalinum), T2 (4/121; Tolypothrix sp.), U1 (13/121), and U2 (52/121), other cyanobacterial nifH sequences (8/121), other bacterial nifH sequences (8/121) | ||
| 131 | Lichen crust: ∼0–100 μmol N m−2 h−1 | 5.13 × 10¹² copies g−1 | Nostoc spp., Tolypothrix spp., Scytonema spp. | ||
| Light crust: ∼0–60 μmol N m−2 h−1 | 2.52 × 10¹² copies g−1 | Nostoc spp., Tolypothrix spp., Scytonema spp. | |||
| Colorado Plateau | 309 | ∼30–50 μmol m−2 h−1 | NE | Scytonema sp., Microcoleus steenstrupii, Microcoleus vaginatus, Pseudanabaena sp. | |
| 324 | Early successional crust: ∼3–76 μmol C2H4 m−2 day−1 | NE | NE | ||
| Late successional crust: ∼18–107 μmol C2H4 m−2 day−1 | NE | NE | |||
| 325 | Lichen crust: 11.0 ± 5.7–57.9 nmol C2H4 cm−2 h−1 | NE | NE | ||
| 326 | Cyanobacteria-dominated crust: ∼15–30 nmol C2H4 m−2 h−1 | NE | Microcoleus vaginatus, Scytonema myochrous | ||
| Lichen crust: ∼10–90 nmol C2H4 m−2 h−1 | NE | Collema tenax (Nostoc sp. as N-fixing phycobiont) | |||
| 91 | Light cyanobacterial crust: 0–0.80 nmol cm−2 h−1 | NE | Microcoleus vaginatus | ||
| Dark cyanobacterial crust: 0–5 nmol cm−2 h−1 | NE | Nostoc commune, Scytonema myochrous | |||
| Colema crust: 0–13 nmol cm−2 h−1 | NE | Collema sp. | |||
| 103 | NE | D | nifH clusters S1 (69/473; Scytonema sp.), S2 (62/473; Scytonema hyalinum), N1 (134/473; Nostoc sp.), N2 (28/473; Nostoc commune), and T1 (128/473; Spirirestis sp.), other cyanobacterial nifH sequences (17/473), other bacterial nifH sequences (83/473) | ||
| 106 | Poorly developed crust (Microcoleus spp. dominated): ∼2.5 μmol m−2 h−1 | 1.1 × 10⁶ copies g−1 soil | Microcoleus steenstrupii, Phormidium murrayii, Phormodium sp., Microcoleus vaginatus | ||
| Mature crust (mixed cyanobacteria, lichen, and moss): ∼20 μmol m−2 h−1 | 2.0 × 10⁷ copies g−1 soil | Microcoleus steenstrupii, Microcoleus sociatus, Phormidium spp., Scytonema sp. | |||
| 178 | Dark crust: 48.00 ± 9.31 μmol C2H2 reduced m−2 h−1 | NE | NE | ||
| Light crust: 6.53 ± 1.87 μmol C2H4 m−2 h−1 | NE | NE | |||
| 98 | Collema-dominated biocrusts: 1.6 nmol C2H2 cm−2 h−1 | NE | Collema spp. | ||
| Squamarina lentigera-dominated biocrust: 0.2 nmol C2H2 cm−2 h−1 | NE | Squamarina lentigera | |||
| Gyalolechia desertorum-dominated biocrust: 0.4 nmol C2H2 cm−2 h−1 | NE | Gyalolechia desertorum | |||
| Great Basin Desert | 326 | ∼15–90 nmol C2H4 cm−2 h−1 | NE | NE | |
| 327 | Ungrazed: 0.37–2.54 g N ha−1 h−1 | NE | NE | ||
| 132 | 4.3–72.2 nmol C2H4 m−2 s−1 | NE | NE | ||
| 328 | 10.5–84.0 nmol C2H4 m−2 s−1 | NE | NE | ||
| 131 | Light crust: ∼0–200 μmol N m−2 h−1 | 3.94 × 10¹² copies g−1 | Nostoc spp., Tolypothrix spp., Scytonema spp. | ||
| Dark crust: ∼0–370 μmol N m−2 h−1 | 2.63 × 10¹³ copies g−1 | Nostoc spp., Tolypothrix spp., Scytonema spp. | |||
| Gurbantunggut Desert | 110 | Cyanobacterial crust: 2.26–9.81 × 10³ nmol C2H4 m−2 h−1 | NE | NE | |
| Lichen crust: 6.54 × 10²–9.06 × 10³ nmol C2H4 m−2 h−1 | NE | NE | |||
| Moss crust: 6.38 × 10²–2.03 × 10³ nmol C2H4 m−2 h−1 | NE | NE | |||
| Kalahari Desert | 329 | 0.6–6.8 nmol C2H4 nmol m−2 h−1 | NE | NE | |
| Mojave Desert | 309 | ∼30–200 μmol m−2 h−1 | NE | Scytonema sp., Microcoleus steenstrupii, Microcoleus vaginatus, Pseudanabaena sp. | |
| 135 | Lichen crust: 11.3 ± 7.7–25.2 ± 11.7 μmol C2H4 m−2 h−1 | NE | NE | ||
| Nonlichen crust: 0–27.0 ± 26.3 μmol C2H4 m−2 h−1 | NE | NE | |||
| Negev Desert | 330 | 34 nmol C2H4 cm−2 h−1 | NE | NE | |
| 331 | Cyanobacterial crust: 1.0–1.2 g N m−2 yr−1 | NE | NE | ||
| 332 | Cyanobacterial crust (n = 4): NE | 6.7 × 10⁷–3.4 × 10⁸ copies cm−2 | Microcoleus vaginatus (4/4), Scytonema sp. (3/4), Phormidium sp. (1/4), Nostoc sp. (1/4) | ||
| Moss crust (n = 1): NE | 1.6 × 10⁸ copies cm−2 | Microcoleus vaginatus, Nostoc sp. | |||
| Omani Desert | 104 | 58.5 ± 2.6 mmol C2H4 reduced m−2 h−1 (or 183–258 mg N m−2 h−1) | NE | Microcoleus vaginatus, Nostoc sp., Scytonema sp., Brasilonema sp., Petalonema sp. | |
| Sahel Desert | 133 | 0.001–4.2 nmol C2H4 cm−2 h−1 | NE | Nostoc sp., Scytonema javancum | |
| Sonoran Desert | 309 | ∼50–100 μmol m−2 h−1 | NE | Scytonema sp., Microcoleus steenstrupii, Microcoleus vaginatus, Pseudanabaena sp. | |
| 333 | 78 nmol C2H4 cm−2 h−1 | NE | NE | ||
| 107 | NE | NE | Synechococcus sp., Microcoleus vaginatus, Microcoleus steenstrupi, Chroococcidiopsis sp., Cylindrospermum sp., Scytonema hyalinum | ||
| Tengger Desert | 111 | Cyanobacterial-algal crust: 16.6 mmol C2H4 m−2 h−1 | NE | NE | |
| Lichen crust: 6.9 mmol C2H4 m−2 h−1 | NE | NE | |||
| Moss crust: 2.6 mmol C2H4 m−2 h−1 | NE | NE | |||
| 334 | Moss and bacterial BSC: NE | Moss (n = 6): 0.0021 ± 0.0007 | NE | ||
| Bacterial (n = 6): 0.0060 ± 0.0031 | NE | ||||
| Soil | Roxby Downs, Australia | 125 | NE | 6.4% (±1.2%) total predicted genes in metagenomes (n = 8) and 3.4% (±2.5%) in metatranscriptomes (n = 2) | Archaea (“Candidatus Methanoperedens sp.,” Methanobacterium sp., Methanolobus sp., Methanosarcina spp.); Bacillota (Sporobacer sp., Clostridum spp., Eubacterium sp., Marvinbryantia spp., Lachnoclostridium spp., Paenibacillus sp., Carboxydocella spp., Desulfotomaculum sp., Propionispira sp., Desulfitobacterium spp., Butyrivibrio spp.); Spirochaetota (Treponema sp.); Alphaproteobacteria (Skermanella sp., Neorhizobium sp., Azospirillum spp., Phaeospirillum sp., Bradyrhizobium sp., Rhizobium spp., Nitrospirillum sp., Sphingomonas sp., Methylocapsa sp., Rhodopila sp., Rhodovulum sp., Rhodopseudomonas sp., Aurantimonas sp., Komagataeibacter sp., Methylocella sp.); Betaproteobacteria (Derxia sp., Dechloromonas sp., Rubrivivax sp., Herbaspirillum spp.), Gammaproteobacteria (Alteromonadales, Beggiatoa sp., Neiella sp., Halorhodospira sp., Methylovulum sp., Agarivorans sp., Pseudomonas sp., Solimonas sp.); Deltaproteobacteria (Geothermobacter sp., Desulfuromusa sp., Dissulfuribacter sp., Anaeromyxobacter sp.); Bacteroidota (Draconibacterium sp., Labilibacter sp.); Chloroflexota (Oscillochloris sp., Roseiflexus sp.); Cyanobacteria (Trichormus sp., Nostoc spp., Calothrix sp., Chlorogloeopsis sp., Cylindrospermum sp., Fischerella spp., Cylindrospermopsis sp., Nodularia sp., Tolypothrix sp., Kamptonema sp.); Actinomycetota (Propionibacterium sp.) |
| Gobi Desert | NE | 1.8% total predicted genes | Archaea (“Candidatus Methanoperedens sp.”); Bacillota (Sporobacer sp., Clostridum spp., Eubacterium sp., Marvinbryantia sp., Lachnoclostridium spp., Carboxydocella spp., Moorella sp., Megasphaera sp., Butyrivibrio spp., Acetobacterium sp.); Alphaproteobacteria (Rhodoblastus sp., Cohaesibacter sp.), Betaproteobacteria (Rhodocyclales spp.); Gammaproteobacteria (Succinivibrio sp., “Candidatus Contendobacter sp.,” Ectothiorhodospira sp., Halorhodospira sp.) | ||
| Mojave Desert | NE | 2.4% total predicted genes | Bacillota (Sporobacer sp., Clostridum spp., Eubacterium sp., Marvinbryantia sp., Lachnoclostridium spp.); Planctomycetota (Blastopirellula sp.); Gammaproteobacteria (Allochromatium sp., Ectothiorhodospira sp., Halorhodospira sp.) | ||
| Northeastern desert region of Egypt | 335 | NE | 2.51 × 10⁴ copies g−1 soil | Alphaproteobacteria (Rhizobium sp., Bradyrhizobium sp.), Betaproteobacteria (Ideonella sp., Derxia sp., Dechloromonas sp., Zoogloea sp.), Gammaproteobacteria (Azomonas sp.), Bacilli (Paenibacillus sp.) | |
| Gurbantunggut Desert | 171 | NE | NE | Microcoleus sp., Chroococcidiopsis sp., Phormidium sp., Nostoc spp. | |
| Namib Desert | 79 | NE | D | Pseudomonadota | |
| 123 | NE | NE | Nostocales | ||
| 124 | NE | D | NE | ||
| 125 | NE | 2.9% total predicted genes | Archaea (“Candidatus Methanoperedens sp.,” Methanobacterium sp.); Bacillota (Clostridum spp., Eubacterium sp., Marvinbryantia sp., Lachnoclostridium spp., Carboxydocella spp., Dethiosulfatibacter sp., Butyrivibrio sp.); Spirochaetota (Treponema sp.); Alphaproteobacteria (Sphingomonas sp.); Betaproteobacteria (Rhodocyclales spp.), Gammaproteobacteria (Marichromatium sp., Nitrincola sp., Agarivorans sp., Thiorhodospira sp.); Cyanobacteria (Trichormus sp.) | ||
| Mu Us Desert | 336 | NE | 1.3 × 10⁷–2.0 × 10⁸ copies g−1 soil | NE | |
| Sonoran Desert | 337 | Undisturbed site: 2.4 ± 0.05 nmol C2H4 soil g−1 day−1 | 3.02 × 10⁵ copies g−1 soil | Azospirillum sp., Rhizobium sp., Pseudomonas sp. | |
| Tengger Desert | 67 | Control site: 0.025 ± 0.008 mmol C2H4 m−2 h−1 | NE | Alphaproteobacteria (Mesorhizobium sp.), Epsilonproteobacteria (Arcobacter sp.), Cyanobacteria (Plectonema sp.), Verrucomicrobiota, Bacillota | |
| King Sejong Station and Cape Burk area (Antarctica) | 257 | NE | 4.0 × 10⁴–1.4 × 10⁵ copies g−1 soil | NE | |
| Miers Valley (Antarctica) | 65 | ND (0/14) | NE | NE | |
| 83 | NE | D | Archaea, Actinomycetota, Alpha-, Beta-, Delta-, Gamma-, and Epsilonproteobacteria, Chlorobiota, Chloroflexota, Cyanobacteria, Bacillota, Spirochaetota, Bacteroidota, Fusobacteriota | ||
| Anchorage Islands (Antarctica) | 103 | NE | D | NE | |
| Anvers Island (Antarctica) | 338 | 12.31–59.32 μmol N m−2 h−1 | NE | NE | |
| McKelvey Valley (Antarctica) | 78 | NE | D | Archaea, Actinomycetota, Cyanobacteria, Bacillota, Alpha-, Beta-, Delta-, Gamma-, and Epsilonproteobacteria, Spirochaetota | |
| 18 Antarctica soils | 120 | NE | 6 nif hits in 3/18 shotgun metagenomes | Cyanobacteria | |
| Hypolith | Namib Desert | 71 | NE | D | Cyanobacteria, Alphaproteobacteria |
| Qaidam Basin | 114 | NE | ND | Chroococcidiopsis sp., Phormidium sp., Micrococcus sp. | |
| Taklimakan Desert | 114 | NE | ND | Chroococcidiopsis sp., Phormidium sp. | |
| 68 | NE | D | nifH: Alphaproteobacteria (Rhodospirillales, Rhizobiales), Gammaproteobacteria (Pseudomonadales)/16S rRNA: 14.6% of the sequences, including Chroococcidopsis sp. and Phormidium sp. | ||
| Tibetan Plateau | 68 | NE | D | nifH: Alphaproteobacteria (Rhodospirillales, Rhizobiales), Betaproteobacteria (Burkholderiales)/16S rRNA: 18.4% of the sequences, including Chroococcidopsis sp. and Phormidium sp. | |
| Turpan Depression | 114 | NE | Chroococcidiopsis sp. | ||
| McKelvey Valley (Antarctica) | 78 | NE | D | Archaea, Actinomycetota, Cyanobacteria, Bacillota, Nitrospirota, Alpha-, Beta-, Delta-, Gamma-, and Epsilonproteobacteria, Spirochaetota | |
| Miers Dry Valley (Antarctica) | 65 | 0.02–0.174 nmol N g−1 h−1 (6/12) | D | Cyanobacteria, Pseudomonadota | |
| 83 | NE | D | Archaea, Actinomycetota, Alpha-, Beta-, Delta-, Gamma-, and Epsilonproteobacteria, Chlorobiota, Chloroflexota, Cyanobacteria, Bacillota, Spirochaetota, Verrucomicrobiota | ||
| McMurdo Dry Valleys (Antarctica) | 68 | NE | D | nifH: Alphaproteobacteria (Rhizobiales), Betaproteobacteria (Burkholderiales)/16S rRNA: 5.3% of the sequences, including Phormidium sp. | |
| Arctic | 68 | NE | ND | 16S rRNA: 13.8% of the sequences, including Chroococcidopsis sp. and Phormidium sp. | |
| Endolith | 7 hot and 41 cold deserts | 112 | Detected (1 Antarctic/48) | NE | NE |
| Al-Jafr Basin Desert | 113 | NE | NE | Chroococcidiopsis sp. | |
| Mojave Desert | 113 | NE | NE | Chroococcidiopsis sp. | |
| Atacama Desert | 113 | NE | NE | Chroococcidiopsis sp. | |
| 70 | NE | ND | |||
| 119 | ND | NE | |||
| 339 | NE | Chroococcidiopsis sp. | |||
| McKelvey Valley | 78 | NE | D | Archaea, Actinomycetota, Cyanobacteria, Bacillota, Nitrospirota, Alpha-, Beta-, Delta-, Gamma-, and Epsilonproteobacteria, Spirochaetota | |
| McMurdo Dry Valleys | 88 | Aerobic 20°C: 0.095–1.2 mol C2H4 μg Chla−1 g rock−1 h−1 | NE | Chroococcidiopsis sp. | |
| Aerobic 5°C: 0.099–2.1 mol C2H4 μg Chla−1 g rock−1 h−1 | NE | Chroococcidiopsis sp. | |||
| Anaerobic 20°C: 1.07–2.24 mol C2H4 μg Chla−1 g rock−1 h−1 | NE | Chroococcidiopsis sp. | |||
| Anaerobic 5°C: 1.5-2.95 mol C2H4 μg Chla−1 g rock−1 h−1 | NE | Chroococcidiopsis sp. |
D, detected; ND, not detected; NE, not evaluated.
Given the strictly anaerobic requirements for nitrogenase functioning, N-fixing bacteria are mainly obligate anaerobes or microaerophilic (i.e., able to live in environments with very low oxygen levels). Multicellular filamentous cyanobacteria have, however, evolved specific cells (heterocysts) which provide the anaerobic conditions suitable for nitrogenase activity in an otherwise aerobic system (87, 88). Over 100 heterocystous cyanobacterial genera have already been described (89). The heterocystous cyanobacteria Nostoc spp. have been detected in desert niches globally (Fig. 3C; Table 1). Nonheterocystous aerobic cyanobacteria also contribute significantly to N fixation (90). Among these, Microcoleus spp., Chroococcidiopsis spp., and Synechococcus spp. have been shown to be common in hot, cold, and polar desert microbial communities (68, 83, 91, 92) (Table 1). These N-fixing bacteria can be free-living (e.g., Microvirga spp.) or symbiotically associated with desert plants such as Acacia spp. and Stipagrostis spp. (e.g., Rhizobia, Bradyrhizobium, Frankia, and Azospirillum spp.) (6, 93). Other symbiotic associations with N-fixing microorganisms found in deserts include cyanolichens and chlorolichens which are obligate symbioses between cyanobacteria and fungi and between green algae and fungi, respectively (94–98) (Table 1).
Biological nitrogen fixation (BNF) in the different dryland niches. (i) Biological soil crusts (BSCs).
BSCs are complex microbial assemblages that can cover up to 70% of cold and hot desert soil surfaces (4, 99, 100). Diazotrophic communities associated with BSCs in desert ecosystems have been well characterized (Table 1). BSCs are typically dominated by cyanobacteria, most commonly by members of the diazotrophic genus Microcoleus, and include chlorophyte algae, heterotrophic bacteria, fungi, mosses, and lichens (4, 100, 101). BSCs may also contain N-fixing cyanolichens (e.g., Collema), chlorolichens (e.g., Gymnosoma desertorum), filamentous heterocystous (e.g., Anabaena spp., Nostoc spp., Scytonema spp.) and nonheterocystous (e.g., Microcoleus spp., Chroococcidiopsis spp.) cyanobacteria, as well as heterotrophic N-fixing bacteria (e.g., Azospirillum spp.) (91, 98, 102–105) (Table 1). BSC microbial assemblages and diazotrophic communities have been shown to vary spatially and temporally, depending on aridity and their developmental stages (100, 105–107). BSCs in hyperarid desert regions, which are characterized by very high evapotranspiration rates, typically do not contain either mosses or lichens (100, 106).
With both photosynthetic and diazotrophic capacities, BSCs constitute the dominant primary producers in plant-free desert ecosystems (108). Globally, desert BSCs show one of the highest N fixation rates of all terrestrial ecosystems, at around 7.6 kg N ha−1 year−1 and representing a global total of 107 Tg N year−1 (108, 109). As shown in Table 1, desert BSC N-fixing capacities vary widely, depending on location, developmental stage, and composition (91, 110, 111). This is particularly exemplified by a study on lichen-dominated Colorado Plateau BSCs, which have even been found to fix N2 at different rates depending on the dominant lichen (98). Using surface coverage metrics, the annual N fixation flux contributions for each lichen-dominated BSC species in the Colorado Plateau were estimated to be 1.17, 0.08, 0.06, and 0.04 kg ha−1 year−1 for Collema spp., Psora decipiens, Gyalolechia desertorum, and Squamarina lentigera, respectively (98).
(ii) Lithic communities.
In arid environments, diazotrophic microbial communities colonizing lithic environments, such as hypoliths and endoliths, are dominated by cyanobacteria (particularly Chroococcidiopsis) but also contain alpha-, beta-, and gammaproteobacterial diazotrophs (4, 5, 68, 70, 84, 92, 112–116) (Table 1). GeoChip microarray analyses have indicated that N-fixing phylotypes of Antarctic lithic communities included Delta-, Epsilon-, and Gammaproteobacteria, Chlorobiota, Chloroflexota, Spirochaetota, Bacillota, Verrumicrobiota, and Nitrospirota (78, 83) (Table 1). Interestingly, metatranscriptomics data from Namib Desert hypoliths, analyzed using cooccurrence networks, demonstrated that low-abundance alphaproteobacterial taxa of the N-fixing Rhizobiales order were central to the community structure, as indicated by their module hub and module connector positions in the network topology (117).
Perhaps because of their visible dominance as macroscopic biological assemblages (Fig. 3), these cryptic refuge lithic niches are widely assumed to act as productivity hot spots in otherwise depauperate desert soil ecosystems (4, 92). Stable isotope analyses have clearly demonstrated that hypoliths are positioned at the base of the N productivity web in the hyperarid central Namib Desert and are therefore considered to be critical elements of NPP in this desert ecosystem (73). However, very few quantitative data are available to support this conclusion, with ARA data available only from Antarctic Dry Valley hypoliths (0.02 to 0.174 nmol N g−1 h−1) (65) and endoliths (0.097 to 2.95 mol C2H4 produced μg chlorophyll a (Chla)−1 g rock−1 h−1) (Table 1) (88). This highlights a substantial knowledge gap in global desert nitrogen biogeochemistry, as hypoliths may cover up to 50% of dryland surfaces (2) and quartz rock colonization rates can reach ∼100% in hot desert pavements (118). There are suggestions that diazotrophy may be absent from the most hyperarid deserts. No nitrogenase-encoding genes were detected in shotgun metagenomes of Atacama Desert halite endolithic communities (70, 119), suggesting that these communities may obtain sufficient bioavailable N via nitrate reduction (see “Assimilatory and Dissimilatory Nitrate Reduction” below) and/or from atmospheric wet deposition (i.e., fog).
(iii) Soils and plant-associated environments.
Desert diazotrophic communities and N-fixing capacities from open soils have been little studied, compared to those of BSCs and lithic communities (Table 1). Antarctic Dry Valley soils have been shown to present diverse, but rare, nifH gene sequences (78, 83, 120). In contrast, the isolation of desert soil diazotrophs (e.g., see references 121 and 122) and their detection in metatranscriptomes and metaproteomes from hyperarid Namib Desert soils and the metatranscriptomes of Australian desert soils (79, 123–125) suggest that desert soil communities contribute to the N fixation budget of hot deserts. Recent shotgun metagenomics even suggest a very high diversity of diazotrophs in desert soils globally (125) (Table 1).
Given the hyperoligotrophy of many desert soils and the sessile nature of plants, plant growth-promoting bacteria (PGPB), which increase nutrient acquisition, are thought to be crucial for desert plant growth and fitness (126). These microorganisms are recruited from the surrounding soils and colonize structures such as root nodules and rhizosheaths (127). Rhizosheaths are specialized structures coating the roots of xerophytic grasses from the Poaceae and Haemodoraceae families (Fig. 3D) (6, 127). Several N fixers have been isolated from rhizosheaths, including Bacillus spp., Enterobacter spp., Serratia spp., Pseudomonas spp., Klebsiella spp., Agrobacterium radiobacter, and Gluconacetobacter diazotrophicus (128). An in-depth analysis of rhizosheath microbial communities associated with three Namib Desert dune grass species (Stipagrostis sabulicola, Stipagrostis seelyae, and Cladoraphis spinosa) showed that a sequence variant (SV) affiliated with the N-fixing Microvarga genus was abundant and was identified as a keystone taxon in the cooccurrence networks from the three grass species studied (6). This indicates that microbial N fixation represents a key metabolic capacity recruited by desert plants to improve their fitness.
(iv) Factors controlling BNF in dryland ecosystems.
Both the duration and rate of nitrogenase activity in desert soil communities are largely controlled by the availability of water (91, 129–131). Under hyperarid conditions, soil diazotrophs are mainly inactive (124), but nitrogenase activity is initiated within a few hours of a wetting event (104, 132, 133). Diazotrophy may also be stimulated by increased net primary production after wetting, which provides organic substrates (used as energy sources) for the energy-expensive N fixation process (134). This suggestion is corroborated by the observation that the addition of external carbon sources (e.g., readily available sugars) enhances nitrogenase activity in soils (130, 135). However, prolonged wetting, despite increasing microbial community biomass, may reduce N fixation rates due to a shift from water to nutrient limitation (130, 136). An excess of bioavailable N, such as solubilized nitrate and/or ammonium ions, reduces biological N fixation but without limiting the growth of diazotrophic microorganisms (121).
N fixation rates in desert soils are temperature dependent and optimal between 20°C and 30°C (7, 91, 110). Consequently, BNF shows seasonal maxima and is limited by low temperatures in desert BSCs (91, 110, 131, 137). Furthermore, BNF is favored during daylight hours, although it has been shown in BSCs to persist for 4 to 6 h in the dark if sufficient C is available (91). The temperature dependence of BNF in the hottest hyperarid desert soils is largely unknown. Given that surface soils in hot hyperarid deserts (such as the Namib Desert) exceed 50°C on a daily basis for much of each year (138) and wetting periods are restricted to a few days per annum, an integrated annual value of soil N fixation is not a simple estimation. Nevertheless, the determination of such values is particularly important, given projected climate change-related increases in both mean temperatures and temperature maxima (139). With the current paucity of quantitative N fixation data and the limited information on temperature and water availability dependence, it is currently not possible to predict how biological nitrogen fixation processes may be affected by future climate change effects in arid ecosystems.
Nitrogen Mineralization
Nitrogen mineralization encompasses all the processes converting organic nitrogen to assimilable inorganic nitrogen (N-org → NH4+, NO3−) (Fig. 2). It therefore comprises ammonification, which leads only to the formation of ammonium (N-org → NH4+) (Fig. 2). This process is carried out by a cohort of heterotrophic prokaryotes and microeukaryotes (78, 83, 140) and is particularly important, as organic N can represent over 99% of total N in desert soils (35). In a cross-biome analysis, soil N mineralization was positively correlated with soil moisture (primary factor) and negatively with soil C/N ratio (secondary factor) (141). The overall lack of water therefore explained why drylands displayed the lowest N mineralization rates (141).
Soil leucine aminopeptidase (LAP; which degrades peptides) and β-N-acetylglucosaminidase (NAG; which degrades chitin) activities have been used as proxies for soil N mineralization capacity in various desert soils (142–146). Soil N mineralization in Antarctic Dry Valley soils was found to be either undetectable (when measuring NAG activity as a proxy for N mineralization) or strongly influenced by temperatures (when measuring LAP activity), ranging from 0 to 15 nmol h−1 g−1 at 0°C to 15 to 50 nmol h−1 g−1 at 15°C (146). Hot desert microbial ammonification varied according to soil type (143), vegetation cover (144), and precipitation (145). By using GeoChip technologies, diverse ammonifying microbial communities were detected in Antarctic Dry Valley edaphic, hypolithic, and endolithic communities, comprising numerous archaeal, bacterial, and fungal taxa (78, 83). In contrast, shotgun metagenomic analyses suggested that N mineralization in Namib Desert hypolithic communities involved only Actinobacteria and Deltaproteobacteria, based on metabolic pathway reconstructions (71). These apparently inconsistent results are probably the result of the different methodologies used and/or are related to the environment studied (hot versus polar desert).
Assimilatory and Dissimilatory Nitrate Reduction
Assimilatory and dissimilatory nitrate reductions are biological processes by which nitrate is reduced, via a nitrite intermediate, to the more assimilable ammonium ions, which are either excreted (dissimilatory nitrate reduction to ammonium [DNRA]) or incorporated into biomass (assimilatory nitrate reduction [ANR]) (Fig. 2). DNRA and ANR processes have been largely unstudied in arid environments, despite the existence of phylogenetic markers that can be used to infer the relative abundances of the key genes and the phylogenetic affiliations of the host taxa (Fig. 2) (78, 83, 125). DNRA is controlled mainly by the C/N and NO2−/NO3− ratios (147), i.e., is favored in nitrate-limited and high-C-content soils. Furthermore, this process has been shown to rather occur in soils in anoxic (when nitrate and nitrite are used as terminal electron acceptors rather than oxygen) and flooded states (148). These do not correspond to typical desert conditions and therefore may explain why this process remains understudied. Nevertheless, cross-biome comparative analyses clearly showed that DNRA is a ubiquitous terrestrial process, even occurring, but at the lowest rates, in desert soils (141). This strongly suggests that DNRA is generally an overlooked terrestrial process in studies of the fate of environmental N.
In Antarctica, DNRA and ANR communities have been ubiquitously detected, i.e., observed in edaphic, hypolithic, and chasmo- and crypotendolic niches (78), and have displayed niche differentiation, with, for example, soil communities showing significantly higher ANR and DNRA gene abundances than hypolithons (83). Furthermore, in all these niches, the DNRA- and ANR-performing taxa were very diverse and belonged to numerous prokaryotic and some fungal phyla (78, 83). More specifically, Halobacteria, Betaproteobacteria, and Deltaproteobacteria with the capacity to perform ANR were more abundant in Antarctic soils than in hypolithons, while hypolithic ANR communities were enriched in Bacteroidota, Bacillota, Planctomycetota, and Verrumicrobiota in comparison to edaphic samples. The Antarctic DNRA community was also found to be niche dependent, as soil communities were richer in Actinobacteria, Alphaproteobacteria, and Deferribacterota and hypolithic communities were richer in Bacteroidota, Deltaproteobacteria, and Bacillota (83).
The detection of nrfA genes in shotgun metagenomes from Namib Desert, Mojave Desert, and Australian hot desert soils and in the cold Gobi Desert (125) further suggests that all desert edaphic communities can perform DNRA. This is further emphasized by their detection in Australian desert soil metatranscriptomes (125) and the detection of DNRA activity in Californian desert soils (141). It was particularly noted that the Australian and Mojave Desert soil metagenomes showed significantly more nrfA read hits than those of the Namib and Gobi Deserts, which may suggest that temperature and/or aridity may positively select for DNRA (125). However, more studies are necessary to confirm this. Furthermore, as for Antarctic soils, DNRA community members from hot desert soils belonged to many prokaryotic groups and essentially to the Deltaproteobacteria (Archangium spp., Myxococcus spp., Sorangium spp., Vulgatibacter spp., Anaeromyxobacter spp., Bdellovibrio spp., Geobacter spp.), Nitrospirota (“Candidatus Nitrospira inopinata”), Verrumicrobiota (Chthoniobacter spp., Lacunisphaera spp.), Planctomycetota (“Candidatus Brocadia sínica,” “Candidatus Jettenia caeni,” Rhodopirellula spp.), and Acidobacteriota (Geothrix spp., Propionibacterium spp.) phyla.
It is worth noting that “Candidatus Brocadia sínica” and “Candidatus Jettenia caeni,” which have been detected in Gobi, Namib, Mojave, and Australian desert soils (125), are also capable of the anaerobic ammonium oxidation (anammox) reaction (Fig. 2). Similarly, reads assigned to the nrfA genes of the euryarchaeote “Candidatus Methanoperedens nitroreducens,” which is capable of the denitrifying anaerobic methane oxidation process (149), were detected in soils from the Gobi, Mojave, and Australian deserts (Fig. 1) (125). Together, this suggests that certain microorganisms, depending on substrate availability, may participate in both N-input and N-loss processes. The threshold(s) governing how and when these switch to the one or the other process remains a knowledge gap to be filled to improve arid land N biogeochemical cycling models.
Nitrification
Nitrification (Fig. 2) (NH3/NH4+ → NO3−) is the principal process determining the fate of biologically fixed N in the environment (150). While both NH3 and NH4+ can be oxidized to nitrate, NH4+ predominates the inorganic forms of N in soil and is rapidly converted to NO3− (151, 152). Also, NH4+ exists as exchangeable and soluble cations and does not easily leach from soil (151). In contrast, NH3 exists in gas form, which can easily escape from soil surfaces to the air, especially at higher pH range (151). The effect of substrate availability supply on nitrification can be found elsewhere (152, 153).
Nitrification is performed by a group of chemolithoautotrophic prokaryotes and by chemoorganoheterotrophic bacteria and fungi, all of which oxidize various N compounds (e.g., ammonia, hydroxylamine, N organics, and/or nitrite) (154, 155). Despite being a critical component of N biogeochemical cycling (154), to the best of our knowledge, heterotrophic nitrification has never been quantified in arid soil environments. The detection of methanotrophs (i.e., presence of the pmoA gene marker sequence) in soil metagenomes from the Negev, Gobi, Mojave, Namib, and Australian deserts and in soil metatranscriptomes of Australian desert soils (125, 156) suggests that this guild may compete with chemoautotrophic nitrifiers and therefore may influence the fate of N in desert ecosystems (154).
Aerobic ammonia oxidation.
Aerobic ammonia oxidation consists of three sequential aerobic microbially mediated steps: (i) ammonia oxidation, (ii) hydroxylamine oxidation, where both hydroxylamine and NO act as obligate intermediates (157), and (iii) nitrite oxidation (Fig. 2). All ammonia oxidizers can oxidize ammonia to hydroxylamine, and most can continue the process to form nitrite (155). Hydroxylamine oxidation to nitrite (NH2OH → NO2−) is catalyzed by hydroxylamine dehydrogenase, encoded by the haoA gene. However, to our knowledge, no data on the diversity or frequency of this gene in desert soils have been published.
The oxidation of ammonia to nitrite is the rate-limiting step of nitrification and is performed by chemolithoautotrophic ammonia-oxidizing bacteria (AOB) and archaea (AOA). AOB belong to the Beta- and Gammaproteobacteria classes (particularly the Nitrosospira genus, in arid environments) (158–160), and AOA belong to the Nitrososphaerota phylum (e.g., Nitrososphaera sp.) (Table 2) (155, 161). The amoA gene, which encodes ammonia monooxygenase, is commonly used to study the abundance and diversity of ammonia oxidizers in the environment (Fig. 1 and 2) (160), and both AOA and AOB have been frequently detected in hot and cold desert soils, BSCs, and lithic habitats (e.g., see references 71, 78, 83, 159, 160, and 161–168) (Table 2).
TABLE 2.
Microbial nitrification in hot and cold dryland/desert habitatsa
| Habitat type | Desert | Reference(s) | Potential ammonia oxidation rate | amoA detection and/or abundances | Diversity of ammonia oxidizers and/or nitrifiers |
|---|---|---|---|---|---|
| Biological soil crust | Arid and semiarid Eastern Australia | 175 | NE | amoA-AOB: ∼3.72 × 10⁷ copies g−1 soil | NE |
| amoA-AOA: ∼3.16 × 10⁸ copies g−1 soil | |||||
| Chihuahuan Desert | 131 | Lichen crust: ∼0–500 μmol N m−2 h−1 | amoA-AOB: 9.80 × 10¹¹ copies g−1 | NE | |
| Light crust: ∼0–210 μmol N m−2 h−1 | amoA-AOB: 5.92 × 10¹¹ copies g−1 | ||||
| 170 | NE | amoA-AOA: 1.5 × 10³–6.7 × 10⁶ copies g of crusted soil−1 | Nitrososphaera sp. | ||
| amoA-AOB: 8.7 × 10⁴–5.0 × 10⁵ copies g crusted soil−1 | |||||
| 309 | ∼20–100 μmol m−2 h−1 | NE | NE | ||
| Colorado Plateau | 170 | NE | amoA-AOA: 2.0 × 10³–5.8 × 10⁶ copies g crusted soil−1 | Nitrososphaera sp. | |
| NE | amoA-AOB: 9.2 × 10⁴–5.9 × 10⁵ copies g crusted soil−1 | ||||
| 309 | ∼40–50 μmol m−2 h−1 | NE | NE | ||
| 178 | Dark crust: 41.98 ± 21.08 μmol m−2 h−1 | 7.93 ± 5.65 × 10³ AOB cells g−1b | NE | ||
| Light crust: 53.38 ± 28.08 μmol m−2 h−1 | 6.69 ± 6.20 × 10³ AOB cells g−1b | NE | |||
| Great Basin | 170 | NE | amoA-AOA: 5.4 × 101–4.8 × 10⁴ copies g crusted soil−1 | Nitrososphaera sp. | |
| NE | amoA-AOB: 2.2 × 10⁴–5.0 × 10⁶ copies g crusted soil−1 | ||||
| 132 | Dark crust: ∼0–400 μmol N m−2 h−1 | amoA-AOB: 1.99 × 10¹² copies g−1 | NE | ||
| Light crust: ∼0–840 μmol N m−2 h−1 | amoA-AOB: 7.43 × 10¹¹ copies g−1 | NE | |||
| Mojave Desert | 309 | ∼40–260 μmol m−2 h−1 | NE | NE | |
| Negev Desert | 332 | Cyanobacterial crust: NE | amoA-AOB: ∼3.16 × 10¹⁰–6.31 × 10¹⁰ copies cm−2 | Nitrosospira sp. | |
| amoA-AOA: ∼1 × 10³–1.58 × 10³ copies cm−2 | Distantly related to Nitrososphaera sp. | ||||
| Nitrobacter sp: ∼7.94 × 10³–2 × 10⁴ copies cm−2 | Nitrobacter sp. | ||||
| Moss crust: NE | amoA-AOB: ∼7.95 × 10¹⁰ copies cm−2 | Nitrosospira sp. | |||
| amoA-AOA: ∼2 × 10⁴ copies cm−2 | Distantly related to Nitrososphaera sp. | ||||
| Nitrobacter sp.: 2.51 × 10⁵ copies cm−2 | Nitrobacter sp. | ||||
| Omani Desert | 163 | Cyanobacterial crust: 15 ± 2 μmol N m−2 h−1 | Betaproteobacteria: 1.3 ± 0.1 × 10⁶ copies g−1 crust | NE | |
| Gammaproteobacteria: 2.9 ± 0.1 × 10⁷ copies g−1 crust | |||||
| amoA-AOA: 9.3 ± 13.1 × 10⁷ copies g−1 crust | |||||
| Lichen crust: 11 ± 5 μmol N m−2 h−1 | Betaproteobacteria: 1.6 ± 0.1 × 10⁷ copies g−1 crust | NE | |||
| Gammaproteobacteria: 2.0 ± 1.4 × 10⁸ copies g−1 crust | |||||
| amoA-AOA: 2.6 ± 2.6 × 10⁶ copies g−1 crust | |||||
| Semiarid Spain (Aranjuez Exptl Station) | 180 | NE | Low biocrust cover: amoA-AOB: 1.5–∼1.9 × 10⁷ copies g−1 soil; amoA-AOA: 1.6 × 10⁶–∼1.4 × 10⁸ copies g−1 soil | NE | |
| High biocrust cover: amoA-AOB: 1.7–∼1.85 × 10⁷ copies g−1 soil; amoA-AOA: 1.2 × 10⁷–∼1.5 × 10⁸ copies g−1 soil | NE | ||||
| Sonoran Desert | 309 | ∼50–100 μmol m−2 h−1 | NE | NE | |
| 170 | NE | amoA-AOA: 2.8 × 10³–5.5 × 10⁶ copies g of crusted soil−1 | Nitrosospira sp. | ||
| amoA-AOB: 3.9 × 10³–3.7 × 10⁵ copies g of crusted soil−1 | |||||
| Tengger Desert | 334 | Moss and bacterial BSC: NE | Moss (n = 6): 0.0034 ± 0.0010 | NE | |
| Bacterial (n = 6): 0.0066 ± 0.0022 | |||||
| Soil | Arid region, Xinjiang, China | 340 | NEA: ∼0.4–0.58 μg NO3-N+NO2-N g−1 h−1 | amoA-AOA: 12–60 × 107 copies g−1 soil | NE |
| amoA-AOB: ∼4–11 × 107 copies g−1 soil | NE | ||||
| Arid-semiarid region (Kunlun Mountain), Xinjiang, China | 341 | NEA: ∼0.06–0.1 μg NO3-N+NO2-N g−1 h−1 | amoA-AOA: ∼1.7–8.4 × 10⁶ copies g−1 soil | NE | |
| amoA-AOB: ∼1–40 × 106 copies g−1 soil | NE | ||||
| Atacama Desert | 159, 162 | NE | NE | Nitrosospira sp. | |
| Semiarid Western Australia | 342 | NE | amoA-AOB: ∼1.26 × 10³ copies g−1 soil | NE | |
| amoA-AOA: ∼1.26 × 10² copies g−1 soil | NE | ||||
| Arid and semiarid Eastern Australia | 175 | NE | amoA-AOB: ∼2.63 × 10⁷ copies g−1 soil | NE | |
| amoA-AOA: ∼2.00 × 10⁸ copies g−1 soil | NE | ||||
| Australian Desert | 125 | NE | 1.8% (±0.4%) total predicted genes in metagenomes (n = 8) and 0.4 (±0.5) in metatranscriptomes (n = 2) (AOA/B) | Nitrososphaera sp., Candidatus Nitrosocosmicus sp., Nitrosococcus sp., Nitrospira sp., Candidatus Nitrosoglobus sp. | |
| Gobi | 125 | NE | 0.7 % total predicted genes (AOA) | Nitrososphaera sp., Candidatus Nitrosocosmicus sp. | |
| Gurbantunggut Desert | 171 | NE | amoA-AOB: 1.17 × 10⁴–2.36 × 10⁶ copies g−1 soil | Nitrososphaera sp. | |
| amoA-AOA: 3.55 × 10⁵–4.02 × 10⁸ copies g−1 soil | |||||
| Inner Mongolia Desert | 176 | ∼1.8 mg NO2-N kg−1 dry soil day−1 | amoA-AOB: 1.6 × 10⁷–1.6 × 10⁸ copies g−1 dry soil | ||
| amoA-AOA: 9 × 10⁹–1 × 10¹⁰ copies g−1 dry soil | Nitrosospharea sp. | ||||
| 172 | ∼0,36 μg NO2-N g−1 h−1 | amoA-AOA: 2.5 × 10⁵ copies g−1 soil | NE | ||
| amoA-AOB: 0.2 × 10⁵ copies g−1 soil | |||||
| 343 | 0- to 2-cm depth: 1.2 ± 0.64 mg N kg−1 dry soil day−1 |
amoA-AOB: ∼1.78 × 10⁶ copies g−1 soil amoA-AOA: ∼3.16 × 10⁷ copies g−1 soil |
Nitrospira sp., Nitrosomonas sp., Nitrosovibrio sp. Nitrososphaera sp. |
||
| 2- to 5-cm depth: ∼2.8 mg N kg−1 dry soil day−1 |
amoA-AOB: ∼1.00 × 10⁶ copies g−1 soil amoA-AOA: ∼5.0 × 10⁷ copies g−1 soil |
Nitrospira sp., Nitrosomonas sp., Nitrosovibrio sp. Nitrososphaera sp. |
|||
| 5- to 10-cm depth: ∼2.8 mg N kg−1 dry soil day−1 | NE | ||||
| 344 | NE | amoA-AOA: 1.5−4.9 × 10⁷ copies g−1 soil | NE | ||
| amoA-AOB: 1−∼8.5 × 10⁵ copies g−1 soil | NE | ||||
| Mojave Desert | 125 | NE | 2.4% total predicted genes (AOA) | Nitrososphaera sp., “Candidatus Nitrosocosmicus sp.” | |
| Mu Us Desert | 336 | NE | amoA-AOA: 3.6 × 10⁶–1.3 × 10⁹ copies g−1 soil | NE | |
| amoA-AOB: 5.2 × 10⁶–9.8 × 10⁸ copies g−1 soil | |||||
| Namib Desert |
168
125 |
NE | NE | Nitrososphaera sp. | |
| 1.4% total predicted genes (AOA) | Nitrososphaera sp., “Candidatus Nitrosocosmicus sp.” | ||||
| Negev Desert | 158 | 0–20 μM NO2-N | NE | Nitrosospira sp., Nitrosomonas sp. | |
| 164 | Dry: 86 ± 17–120 ± 24 μg N kg−1 soil h−1 | Dry: amoA-AOB: ∼3.16 × 10⁵–1.58 × 10⁷ copies g−1 soil; wet, ∼1.00 × 10⁵–6.31 × 10⁵ copies g−1 soil | NE | ||
| Wet: 102 ± 24–140 ± 31 μg N kg−1 soil h−1 | Dry: amoA-AOA: ∼1.26 × 10⁵–2.51 × 10⁶ copies g−1 soil; wet, 5.01 × 10⁵–2.51 × 10⁶ copies g−1 soil | NE | |||
| 345 | NE | amoA-AOB: 6.25 × 10⁶–2.47 × 10⁷ copies g−1 soil | NE | ||
| amoA-AOA: 1.36 × 10⁷–1.37 × 10⁸ copies g−1 soil | |||||
| 160 | 83 (±10)–115 (±20) μg N kg−1 soil h−1 | Arid, winter: amoA-AOB: ∼2.5–5.0 × 10⁷ copies g−1 soil | Nitrosospira sp., Nitrosophaera sp. | ||
| Semiarid, winter: amoA-AOB: ∼2.5–∼3.2 × 10⁷ copies g−1 soil | |||||
| Arid, summer: amoA-AOB: ∼7.9 × 10⁶–2.8 × 10⁷ copies g−1 soil | |||||
| Semiarid, summer: amoA-AOB: ∼7.9 × 10⁶–2.8 × 10⁷ copies g−1 soil | |||||
| Arid, winter: amoA-AOA: ∼6.3 × 10⁶–1.3 × 10⁷ copies g−1 soil | |||||
| Semiarid, winter: amoA-AOA: ∼1.3–2.0 × 10⁷ copies g−1 soil | |||||
| Arid, Summer: amoA-AOA: ∼8.9 × 10⁷–1.3 × 10⁸ copies g−1 soil | |||||
| Semiarid, summer: amoA-AOA: 5.6–6.3 × 10⁷ copies g−1 soil | |||||
| 346 | NE | Sand: amoA-AOA: ∼3.98 × 10⁵ copies g−1 soil; amoA-AOB: ∼8.91 × 10⁴ copies g−1 soil | NE | ||
| Loess: amoA-AOA: ∼4.47 × 10⁵ copies g−1 soil; amoA-AOB: ∼4.41 × 10⁶ copies g−1 soil | NE | ||||
| Sonoran Desert | 166 | 0.3–3 μg NO2-N g−1 h−1 | amoA-AOB: ∼1 × 10⁵ copies g−1 soil | Nitrosomonas sp., Nitrosospira sp. | |
| amoA-AOA: ∼4.4 × 10⁵–5.4 × 10⁵ copies g−1 soil | Nitrosopharea sp. | ||||
| King Sejong Station and Cape Burk area (Antarctica) | 257 | NE | amoA-AOB: 1.9 × 10⁴–2.5 × 10⁴ copies g−1 soil | NE | |
| amoA-AOA: 1.0 × 10⁻⁴−2.9 × 10⁻² copies g−1 soil | |||||
| Anvers Island (Antarctica) | 338 | 0.11–2.47 μmol N m−2 h−1 | NE | NE | |
| McMurdo Dry Valleys (Antarctica) | 189 | NE | NE | Nitrospira sp. | |
| Upper Wright Valley in McMurdo Dry Valleys (Antarctica) | 165 | NE |
amoA-AOB: ∼2.8 × 10³ copies g−1 soil amoA-AOA: ∼5.0 × 10⁴ copies g−1 soil |
AOBs distantly related to Nitrosomonas sp. and Nitrosospira sp. and AOAs distantly related to Nitrosphaera sp. | |
| Beacon Valley in McMurdo Dry Valleys (Antarctica) | 165 | NE |
amoA-AOB: ∼6.0 × 10³ copies g−1 soil amoA-AOA: ∼1.0 × 10⁵ copies g−1 soil |
AOBs distantly related to Nitrosomonas sp. and Nitrosospira sp. and AOAs distantly related to Nitrosphaera sp. | |
| Battleship Promontory Valley in McMurdo Dry Valleys (Antarctica) | 165 | NE |
amoA-AOB: ∼2.3 × 10⁵ copies g−1 soil amoA-AOA: ∼1.0 × 10⁵ copies g−1 soil |
AOBs distantly related to Nitrosomonas sp. and Nitrosospira sp. and AOAs distantly related to Nitrosphaera sp. | |
| Miers Valley in McMurdo Dry Valleys (Antarctica) | 165 | NE |
amoA-AOB: ∼1.38 × 10⁶ copies g−1 soil amoA-AOA: ∼4.0 × 10⁵ copies g−1 soil |
AOBs distantly related to Nitrosomonas sp. and Nitrosospira sp. and AOAs distantly related to Nitrosphaera sp. | |
| 173 | NE | D | Nitrososphaera sp., Nitrospira sp. | ||
| Taylor Valley (Antarctica) | 146 | NE | amoA-AOB detected | Nitrosospira sp. | |
| 18 Antarctica soils | 120 | NE | 16 hits in 10/18 shotgun metagenomes | Bacteroidota, Cyanobacteria, Pseudomonadota | |
| Signy Island (Antarctica) | 347 | NE | Vegetated: amoA-AOA: 0.9 ± 1.6 × 10³ copies g−1 soil; amoA-AOB: 0.4 ± 0.3 × 10⁵ copies g−1 soil | NE | |
| Fell-field: amoA-AOA: 15.3 ± 8.7 × 10³ copies g−1 soil; amoA-AOB: 3.6 ± 6.5 × 10⁵ copies g−1 soil | NE | ||||
| Anchorage Island (Antarctica) | 347 | NE | Vegetated: amoA-AOA: 0.3 ± 0.5 × 10³ copies g−1 soil; amoA-AOB: 3.5 ± 1.2 × 10⁵ copies g−1 soil | NE | |
| Fell-field: amoA-AOA: 14.4 ± 11.0 × 10³ copies g−1 soil; amoA-AOB: 7.8 ± 3.1 × 10⁵ copies g−1 soil | NE | ||||
| Svalbard, Greenland, Siberia (Arctic) | 348 | In situ: ∼0.4–50 μg N g−1 dry wt soil day−1 | amoA-AOA: 2 × 10⁶ ± 3 × 10⁵–2 × 10⁸ ± 2 × 10⁷ copies g−1 soil | Nitrososphaera sp., | |
| amoA-AOB: 4 × 10⁵ ± 6 × 10⁴–2 × 10⁶ ± 3 × 10⁵ copies g−1 soil | |||||
| Canadian High Arctic | 259 | NE | amoA-AOA: ∼0.7 × 10⁵–1.4 × 10⁶ copies g−1 soil | NE | |
| Hypolith | Namib Desert | 71 | NE | ND | Nitrosomonas sp., Nitrobacter sp., Nitrospira sp. |
| Antarctica | 78, 83 | NE | NE | Archaea and Bacteria | |
| Endolith | Antarctica | 78, 83 | NE | NE | Archaea and Bacteria |
| Hypersaline mat | Omani Desert | 349 | 0.8 ± 0.4 nmol N g−1 h−1 | Betaproteobacteria: 6.7 ± 1.72 × 10⁶ copies g−1 mat | NE |
| Gammaproteobacteria: 7.2 ± 2.23 × 10⁷ copies g−1 mat | NE | ||||
| amoA-AOA: 0.1 ± 0.10 × 10⁷ copies g−1 mat | NE |
D, detected; ND, not detected; NE, not evaluated; AOA, ammonia oxidizing archaea; AOB, ammonia oxidizing bacteria; NEA, nitrifying enzyme activity.
Culture based.
Ammonia-oxidizing communities in soils are globally dominated by AOA over AOB (169), and this has also been observed in most desert soil studies (164, 166, 170–172) (Table 2). The high AOA/AOB ratio observed in desert ecosystems is thought to be related to the higher resilience of AOA in more extreme environmental conditions (e.g., higher temperature and aridity) (164, 170, 173). Exceptions to this trend, where AOB dominated, include Great Basin BSCs and Negev Desert arid and semiarid soils, semiarid Australian surface soils, and some (but not all) hyperarid Antarctic Dry Valley soils (Fig. 1; Table 2) (160, 165, 170, 174). The observation that the edaphic AOB/AOA ratios varied in different Antarctic soils was interpreted as the influence of microenvironmental conditions in structuring the ammonia-oxidizing community (165). This was supported by observations that the AOB/AOA ratio in soils varied across an aridity gradient (175), where AOA abundances increased with increasing aridity, independently of the edaphic microenvironment, while AOB abundances were significantly dependent on soil carbon and ammonium content. The fact that not all arid lands present higher AOA/AOB ratios further supports the hypothesis that local environmental filtering also participates in the structuring of the ammonia-oxidizing community (Fig. 1) (Table 2).
The relative abundances of AOB and/or AOA in a given system do not, however, necessarily reflect their respective contributions to the nitrification process (160, 166). In Negev Desert soils, ammonia oxidation rates were positively correlated with AOB abundances (160), while a similar correlation was observed for AOA in Sonoran and Inner Mongolian desert soils (166, 172) (Table 2). In semiarid Australian and Mongolian steppe soils, it was observed that AOB abundances positively correlated with soil nitrification rates, while those of AOA did not, which supports the view that AOB regulate nitrification in semiarid lands (174, 176).
Ammonia oxidation processes in arid soils are controlled by water availability/aridity, temperature, oxygen supply, and substrate concentrations (131, 160, 166, 176–178). As changes in both water availability and temperature are primary impacts of projected climate change scenarios (1, 24), it is likely that nitrification and other N-input processes (Fig. 2) in arid soils will also change. Recent evidence suggests that rising temperatures may stimulate N mineralization in soils and biocrusts that in turn may promote transformation of N into N2O (179–182). For example, increasing nitrification (and incomplete denitrification) will enhance N2O emissions, where nitrification will dominate over denitrification under aerobic conditions in dry soils (182). Also, evidence suggests that the distribution patterns of AOA are more responsive to elevated temperatures than AOB communities in dryland soils (183, 184). However, the effects of climate change on N transformation may vary geographically and latitudinally due to climatic factors (e.g., soil structure, temperature, pH, moisture, and season), suggesting different regional outcomes (180, 181, 183, 185, 186), and should be taken into consideration when evaluating potential future N2O emissions.
Nitrite oxidation.
Nitrite oxidation is particularly important for N conservation in soil ecosystems in the context of climate change, as the balance between nitrite oxidation (NO2− → NO3−; N input) or reduction (NO2− → NO; N loss) will determine if the fixed N remains in the ecosystem or is lost to the atmosphere as greenhouse gas (GHG) (Fig. 2) (187).
This process is performed by phylogenetically diverse taxa, collectively termed nitrite-oxidizing bacteria (NOB), catalyzed by nitrite oxidoreductase, and encoded by the nxrAB genes (Fig. 2) (187, 188). It remains an understudied step of the nitrogen cycle in desert soil environments.
The dominant NOB in desert soil environments belong to the Nitrobacter (Alphaproteobacteria) and Nitrospira (Nitrospirota) genera (Table 2). Nitrospira has been frequently detected in Antarctic soils and lithic niches, both by gene-specific PCR (189) and GeoChip-based studies (78, 83). However, recent data suggest that desert soils harbor substantial NOB genetic novelty. A pyrosequencing survey of Nitrospira nxrB genes in Namib Desert soils suggested the presence of novel NOB lineages with the identification of three new and distinct nxrB clusters (190). A survey comparing the functional diversities of Gobi, Namib, Australian, and Mojave Desert soil microbiomes also showed a high diversity of nxrA gene-harboring bacteria (i.e., Nitrobacter spp., Nitrolancea spp., Nitrococcus spp., Nitrospira spp., Thiocapsa spp., Nitrospina spp., “Candidatus Nitrospira spp.,” “Candidatus Nitrospina spp.,” “Candidatus Nitrotoga spp.”) (125).
Complete ammonia oxidation (Comammox).
Only members of the chemolithoautotrophic Nitrospira lineage II have to date been shown to perform the complete nitrification process, i.e., complete ammonia oxidation (or comammox) to nitrate (NH3/NH4+ → NO3−) (Fig. 2) (191–193). amoA gene phylogeny has shown that ∼90% of the complete nitrifiers from dryland soils belonged to clade A.2 and ∼5% to clades A.1 and B (193). Interestingly, comammox bacteria have been shown to dominate ammonia-oxidizing bacterial communities in dryland soils, with the relative abundances of their amoA genes representing ∼80% of all AOB amoA sequences (193). This observation may be linked to a high affinity for ammonia uptake and growth yields per mole of oxidized NH4+ in comparison to incomplete ammonia oxidizers, making comammox bacteria particularly well adapted to oligotrophic environments such as desert soils (194). Furthermore, it may also explain why in some arid lands, and against globally reported trends, the AOB/AOA ratio is high (Fig. 1; Table 2) (160, 164–166, 170–172, 174). However, the extent to which comammox bacteria actively participate in desert soil N cycling remains unknown, despite their apparent dominance in these habitats (193) (Table 2). Comparing quantitatively the comammox with the various microbially mediated nitrification processes (Fig. 2) would notably enable the assessment of whether comammox bacteria in drylands outcompete incomplete oxidizers. This is particularly relevant in the context of global climate change, as nitrification has been shown to produce the greenhouse gases NO and N2O (Fig. 2) (195) while comammox bacteria produce NOx (i.e., nitrous acid [HONO], nitric oxide [NO], and nitrogen dioxide [NO2]) only at very low yields (196).
NITROGEN LOSS PROCESSES IN ARID ENVIRONMENTS
A clear understanding of the processes involved in environmental nitrogen loss is important, as these can lead to the release of greenhouse gases, nitric (NO) and nitrous (N2O) oxides, into the atmosphere (Fig. 2) and are of fundamental importance to the nutrient status of an ecosystem. For example, in northern American deserts, N loss has been estimated to represent over 75% of the N fixed (197). Furthermore, while a cross-biome analysis has shown that desert (including polar deserts) and semidesert NO emissions are rather low (i.e., up to 0.5 Tg N year−1), the semiarid chaparral/thorn forest biome was found to be the highest NO-emitting biome after the tropical savannas/woodland biome (4.7 versus 7.4 Tg N year−1, respectively) (198). Together, this indicates that drylands, due to their global surface, represent important sources of nitrogen gases. Furthermore, with climate change, deserts will become hotter and experience less frequent but higher-magnitude precipitation events (139), which may influence N-loss processes. Desert and dryland N fluxes have notably been shown to vary with plant cover and can increase with water availability and higher temperatures, independently of their aridity (129, 184, 199–205). A multifactorial experiment performed in the temperate Gurbantünggüt Desert (China), however, indicates that soil N content was the most important edaphic factor (over soil temperature and moisture) driving N2O emissions (206).
N-loss processes include abiotic N gas formation (via chemodenitrification or photodegradation), nitrate leaching and dust aerosol emissions, and microbially mediated processes, including denitrification (NO3− → NO2−→ NO → N2O → N2), anaerobic ammonium oxidation (anammox; NH4+ + NO2− → N2 + 2H2O), denitrifying anaerobic methane oxidation (CH4 + NO3−/NO2− → CO2 + H2O + N2), nitrifier denitrification (NH3/NH4+ → NO2− → NO → N2O → N2), and nitrification (NH4+ → NO/N2O) (184, 207–214) (Fig. 2). Denitrifying anaerobic methane oxidation is not discussed in this review since, to the best of our knowledge, it has never been studied in desert environments. Furthermore, the fact that it has not been detected in some less-extreme soils (215) suggests that this N-loss process should be marginal in desert soils.
Abiotic N Emissions
While microbial denitrification is an important N-loss process globally (216, 217), in hot deserts, particularly in summer, abiotic processes seem to dominate (201). Indeed, despite the fact that active denitrifiers have been detected in desert soils even during dry periods (e.g., see reference 124), the intensification of N emissions, particularly nitrous oxide species, at temperatures of >50°C favors the hypothesis that abiotic photodegradation and/or photochemical processes, driven by solar radiation, are responsible for hot desert NOx gas pulses (201, 213). This is further supported by the observation that Arctic and Antarctic snow cover also produces nitrogen oxide gases by photochemical (abiotic) processes (218).
Desert dust-derived N loss has been estimated to range between 4.8 and 84.6 Tg N year−1 (197). Desert dust N emissions are particularly important for the surrounding (recipient) environments by acting as a natural fertilizer (219, 220). It has been estimated that total N dust deposition from deserts amounts to ∼0.2 Tg N year−1 in the Mediterranean Sea (221).
It should be noted that a very unusual, yet highly productive, abiotic N2O emission process was discovered in a hypersaline pond in Antarctica, where nitrite/nitrate-rich brine reacts with Fe(II)-rich minerals (Fe2+ + NO3−/NO2− + H2O → Fe3O4 + N2O) (222). With fluxes of N2O comparable to those of fertilized agricultural soils, this process should be evaluated in depth in desert ecosystems, where salt pans, playas, and saline ponds are common features. Increasing evidence demonstrates that chemodenitrification [i.e., abiotic nitrite reduction by Fe(II)] (Fig. 2) is an important source of NO and N2O emissions in drylands and deserts (223–225), especially upon rewetting of dry soils (224, 225). When dry soils are rewetted, accumulated NO2− is rapidly converted to NO and N2O (204, 224–226). Edaphic factors, such as pH and soil organic matter (SOM), may influence chemodenitrification where acidic conditions and SOM-rich soils with a high concentration of reduced metals favor nitrite reduction (227, 228). However, research suggests that neutral pH soils can also stimulate chemodenitrification, as the latter is a surface-driven process (224, 227). Nitrite accumulates on mineral surfaces and favors nitrite reduction across a wide pH range (226). Conclusively, research to date has demonstrated that chemodenitrification is substantial in arid lands, where drought persists and its contribution to N loss and global N2O emissions could have been largely underestimated (224, 229, 230).
Photodegradation is the process by which solar irradiance (UV and short-wavelength visible light) directly breaks down organic material (OM), for example, lignin (231, 232) and hemicellulose (233, 234), to release gaseous photoproducts (e.g., CO2, CO, CH4, H2, and N2O) through either photochemical mineralization (i.e., abiotic) or microbial facilitation (i.e., biotic) (231, 232, 235–238). In drylands, UV-driven photodegradation, in particular UV-B, has been recognized as a main driver of OM degradation and litter mass loss, as these ecosystems are characterized by sparse vegetation and high radiative loads (212, 239). This could be especially important in bare soils and senesced plant litter that are completely sun exposed (212, 240–242), although UV-A and visible light can also contribute to litter decay and gas losses (212, 235, 243). However, some dryland field and laboratory studies have found contradictory results, where mass loss was either not affected or was negatively affected by UV-B radiation (244–246). Moreover, abiotic photodegradation has emerged as a primary factor of CO2 emissions and C loss in drylands, contributing to 1 to 4 g C m−2 year−1 (212, 235, 247). It is important to note that litter degradation also releases nitrogen and that direct sunlight may cause the loss of gaseous N (e.g., NOx and NH3) from soils (201). Conceptual models and field studies suggest that a combination of abiotic and biotic photodegradation contributes to litter degradation and mass loss in drylands (241, 248), where abiotic processes dominate during daytime and higher rates of microbial degradation occur at night (248). However, the interaction between these two processes is complex and depends on a variety of factors such as soil moisture, temperature, and soil-litter matrix (241, 248). As climate change is predicted to expand and impact drylands globally (24), photodegradation (abiotic and biotic) will likely play a large role in regional and global C cycling and nitrogen gas formation (213, 249). As such, accounting for its impact is fundamental in litter decomposition models to predict how soil and biogeochemical cycles will respond to ongoing climate change (250).
Inevitably, abiotic N loss from deserts is a critical component of the global N biogeochemical cycling model, since this process may (i) play a critical role in maintaining the N-limited status of dryland ecosystems, (ii) enrich, and hence increase the productivity of, neighboring oligotrophic terrestrial and aquatic ecosystems, and (iii) impact the composition and chemistry of the Earth’s atmosphere and therefore actively participate in global climate change.
Microbially Mediated N-Loss Processes
Denitrification.
Denitrification is an anaerobic/suboxic microbially mediated multistep process in which nitrogen compounds (NO3−/NO2−) are successively reduced to gases (nitric oxide [NO], nitrous oxide [N2O], and dinitrogen [N2]), encoded by a set of genes (narG, nirS, nirK, norB and nosZ) (Fig. 1 and 2) (204, 251–253). Of these N gases, NO and N2O have a large impact on atmospheric chemical composition and, thus, on climate (254). In the atmosphere, NO can react with tropospheric ozone (i.e., ozone [O3] in the innermost layer of Earth's atmosphere) to form nitrogen dioxide (NO2), a nitrogen oxide (NOx in Fig. 2) pollutant. Tropospheric ozone is further produced by a series of complex reactions between nitrogen dioxide (NO2) and volatile organic compounds (VOCs) in the presence of heat and sunlight. The resultant ozone is regarded as a secondary pollutant, and levels are generally higher during hot, dry months (255). Nitrous oxide (N2O) is a potent greenhouse gas that promotes stratospheric ozone (ozone in the second-lowest layer of Earth’s atmosphere) depletion (254, 256).
Desert denitrifiers belong to a phylogenetically diverse group of bacteria and fungi, including members of Actinomycetota, Bacteroidota, Cyanobacteria, Nitrospirota, Pseudomonadota, Ascomycota, and Basidiomycota (78, 125, 163, 257–260) (Table 3). It has been shown that fungi dominate denitrification processes during the dry seasons in arid and semiarid ecosystems, contributing to >50% of the total soil N2O emissions (184, 261–264). The fungal denitrification system is characterized by a copper-containing NO2– reductase and a cytochrome P450 NO reductase that reduces NO2– to N2O (265). However, fungal denitrifiers generally lack the gene encoding N2O reductase (nosZ) to further reduce N2O to N2, thereby generating N2O as the end product (266). A summary of N2O-producing fungi and associated N2O production processes can be found elsewhere (265). Increasing evidence suggests that AOB (e.g., Nitrosospira or Nitrosomonas) and AOA have the capacity to perform denitrification in low-pH (e.g., polar desert soils) and N-limited environments (267–269). This is particularly relevant to Arctic desert soils, which have pH values ranging from ∼4.4 to ∼8 (270, 271). As AOA usually outnumber AOB in N-depleted soils and oligotrophic environments, it is reasonable to suggest that AOA are an important N2O source (269). Nevertheless, current knowledge on the denitrification dynamics of AOA and AOB in desert environments is still limited, and further experimental investigation is clearly required.
TABLE 3.
Microbial denitrification in hot and cold dryland/desert habitatsa
| Habitat type | Desert | Reference | Denitrification rates | Denitrification gene detection and/or abundances | Diversity of denitrifiers |
|---|---|---|---|---|---|
| Biological soil crust | Chihuahan Desert | 309 | ∼1 μmol m−2 h−1 | NE | NE |
| Mojave Desert | ∼0.7–1 μmol m−2 h−1 | NE | NE | ||
| Sonoran Desert | ∼1 μmol m−2 h−1 | NE | NE | ||
| Colorado Plateau | ∼1 μmol m−2 h−1 | NE | NE | ||
| 275 | 38 ng N m−2 s−1; 0.7 kg N ha−1 yr−1 | NE | NE | ||
| Canyonlands, Utah | 280 | Light crust: 48 μg N m−2 day−1 | NE | NE | |
| Dark crust: 418 μg N m−2 day−1 | NE | NE | |||
| Negev Desert | 289 | 0.01 N2O-N kg soil−1 h−1 | NE | NE | |
| 332 | Cyanobacterial crust: 0.8– 1.3 mg N2O m−2 day−1 | nirK: 2× 10⁸–8 × 10⁸ copies cm−2 | NE | ||
| nirS: ∼5.0 × 10⁶–7.9 × 10⁶ copies cm−2 | NE | ||||
| Moss crust: 1.4–2.4 N2O mg m−2 day−1 | nirK: 20 × 108 copies cm−2 | NE | |||
| nirS: ∼7.94 × 10⁶ copies cm−2 | NE | ||||
| Omani Desert | 163 | Lichen crust: 58 ± 20 μmol N m−2 h−1 (total denitrification; N2O + N2) | Nitrate reducers (narG): (2.2 ± 0.9) × 107 copies g−1 crust | ||
| Nitrate reducers (napA): (9.6 ± 4.1) × 107 copies g−1 crust | |||||
| Nitrite reducers (nirS): (2.0 ± 0.1) × 107 copies g−1 crust | nirS: Paracoccus denitrificans | ||||
| Cyanobacterial crust: 584 ± 101 μmol N m−2 h−1 (total denitrification; N2O + N2) | Nitrate reducers (narG): (4.5 ± 2.2) × 106 copies g−1 crust | ||||
| Nitrate reducers (napA): (8.9 ± 1.7) × 106 copies g−1 crust | |||||
| Nitrite reducers (nirS): (6 ± 1.4) × 107 copies g−1 crust | nirS: Cyanobacteria; Paracoccus denitrificans; Azospirillum sp. | ||||
| Semiarid Spain (Aranjuez exptl Station) | 181 | Control low biocrust cover: ∼10 μg N2O m−2 day−1 | Control low biocrust cover: nosZ: ∼3.16 × 10¹² copies g−1 soil | NE | |
| Control high biocrust cover: ∼20 μg N2O m−2 day−1 | Control high biocrust cover: nosZ: ∼1 × 10¹³ copies g−1 soil | NE | |||
| Soebatsfontein, Succulent Karoo | 350 | Cyanobacterial crust: 208 ± 15 ng NO-N m−2 s−1 | NE | NE | |
| Lichen crust: 94.85 ng NO-N m−2 s−1 | NE | NE | |||
| Moss crust: 47.61 ng NO-N m−2 s−1 | NE | NE | |||
| Tengger Desert | 334 | Moss and bacterial BSC: NE | Moss: narG: 0.0455 ± 0.0067; nirS: 0.0013 ± 0.0008; nirK: 0.0278 ± 0.0027; norB: 0.0562 ± 0.0084; nosZ: 0.0110 ± 0.0020 | NE | |
| Bacterial: narG: 0.0344 ± 0.0048; nirS: 0.0007 ± 0.0003; nirK: 0.0283 ± 0.0030; norB: 0.0549 ± 0.0058; nosZ: 0.0057 ± 0.0012 | NE | ||||
| Soil | Arid region, Xinjiang, China | 351 | −0.3–4.5 g N ha−1 day−1 | NE | NE |
| 340 | 4.30 ± 0.59 g N2O-N ha−1 day−1 | narG: ∼30 × 106−70 × 106 copies g−1 soil | NE | ||
| nirS: 10−52 × 106 copies g−1 soil | NE | ||||
| nirK: 7.5−22 × 105 copies g−1 soil | NE | ||||
| nosZ: 10− 81× 106 copies g−1 soil | NE | ||||
| 352 | 45.6–235 μg N2O-N m−2 h−1 | nirS: ∼1.8 × 10⁴ copies g−1 soil | |||
| nirK: ∼1.3 × 10⁴ copies g−1 soil | nirK: Sphingomonas sp., Chloroflexus sp., Frankia sp., Rhizobium sp., Arthrobacter sp., Sphingobium sp., Curvibacter sp., Comamonas sp., Bordetella sp., Azoarcus sp., Streptoalloteichus sp. | ||||
| nosZ: ∼4.1 × 10³ copies g−1 soil | nosZ: Nitrospirillum sp., Pseudomonas sp., Sinorhizobium sp., Shinella sp., Aeromonas sp., Acidovorax sp., Comamonas sp., Maritimibacter sp., Thioalkalivibrio sp., Sulfitobacter sp., Bordetella sp., Azospirillum sp. | ||||
| Arid-semiarid region (Kunlun Mountain), Xinjiang, China | 341 | 244 ± 20 g N2O-N ha−1 | narG: 13−225 × 106 copies g−1 soil | NE | |
| nirK: ∼0.7 × 10⁶, 0.7 × 10⁶, 2.3 × 10⁶, 1.7 × 10⁶, 2.2 × 10⁶, 2.5 × 10⁶ copies g−1 soil | NE | ||||
| nirS: 1.5−4.5 × 10⁶ copies g−1 soil | NE | ||||
| nosZ: 1.8−15.0 × 10⁶ copies g−1 soil | NE | ||||
| Atacama Desert | 258 | Semiarid soil: 1.81 ± 0.41 ng N2O g−1 h−1 | nirK: 31 clones (semiarid soils) and 43 clones (arid soils) | nirK: Bradyrhizobium sp., Nitrosomonas sp., Alcaligenes sp., Acidovorax sp., Paracoccus sp., Enterococcus sp., Chryseobacterium sp., Brucella suis, Pseudomonas sp., Rhizobium hedysari | |
| Arid soil: ND | nirS: 40 clones (semiarid soils) | nirS: Corynebacterium sp., Pseudomonas sp., Alcaligenes sp., Azoarcus sp., Dechloromonas sp., Paracoccus sp., Azospirillum brasilense, Simplicispira psychrophila | |||
| 353 | NE | A1042: napA: ∼2.51 × 10⁵; narG: ∼7.94 × 10⁴; nirS: ∼6.31 × 10⁶; cnorB: ∼1.58 × 10⁶; qnorB: ∼7.94 × 10⁵; nosZ: ∼3.98 × 10⁶ copies g−1 soil | |||
| A1243: napA: ∼6.31 × 10⁵; narG: ∼6.31 × 10⁵; nirS: ∼5.01 × 10⁶; cnorB: ∼1 × 10⁶; qnorB: ∼6.31 × 10⁶; nosZ: ∼1.26 × 10⁶ copies g−1 soil | |||||
| A1700: napA: ∼5.01 × 10⁵; narG: ∼7.94 × 10⁴; nirS: ∼3.98 × 10⁶; cnorB: ∼1.26 × 10⁶; qnorB: ∼1.58 × 10⁶; nosZ: ∼1.58 × 10⁶ copies g−1 soil | |||||
| A2029: napA: ∼1.58 × 10⁶; narG: ∼5.01 × 10⁵; nirS: ∼1 × 10⁷; cnorB: ∼2.51 × 10⁶; qnorB: ∼4.47 × 10⁶; nosZ: ∼5.01 × 10⁶ copies g−1 soil | |||||
| A2116: napA: ∼5.62 × 10⁵; narG: ∼6.31 × 10⁴; nirS: ∼3.98 × 10⁶; cnorB: ∼2.51 × 10⁶; qnorB: ∼2.24 × 10⁶; nosZ: ∼2.51 × 10⁶ copies g−1 soil | |||||
| Roxby Downs, Australia | 125 | NE | Metagenome: napA (29.5% ± 1.6% total predicted genes), narG (11.8% ± 0.9%), nirK (15.9% ± 0.9%), nirS (1.8% ± 0.4%), norB (20.6% ± 1.8%), nosZ (8.2% ± 1.5%) | See Reference for full species list associated with the respective genes | |
| Metatranscriptome: napA (29.9% ± 5.5% total predicted genes), narG (49.5% ± 6.3%), nirK (13% ± 0.4%), nirS (1.7% ± 0.4%), norB (63.3% ± 6.6%), nosZ (8.6% ± 2%) | |||||
| Chihuahuan Desert | 282 | Bajadas: 9 ng N g−1 h−1 | NE | NE | |
| Playas: 192 ng N g−1 h−1 | NE | NE | |||
| 129 | Dry soil: <0.1 ng NO-N cm−2 h−1 | NE | NE | ||
| Colorado Plateau | 204 | Dry soil: 0.8 ng NOx-N m−2 s−1 and 1.0 ng N2O-N m−2 s−1 | NE | NE | |
| Gobi | 125 | NE | napA (13.4% total predicted genes), narG (1.5%), nirK (5.5%), nirS (0.4%), norB (1.8%), nosZ (0.7%) | See Reference for full species list associated with the respective genes | |
| Great Basin Desert | 274 | 19 kg N ha−1 yr−1 | NE | NE | |
| 282 | Bajadas: 43 ng N g−1 h−1 | NE | NE | ||
| Playas: 163 ng N g−1 h−1 | NE | NE | |||
| Gurbantunggut Desert | 206 | Control: 1.49 ± 0.61 μg N m−2 h−1 | NE | NE | |
| Inner Mongolia Desert | 354 | Denitrification rates: 0.48–7.64 g N2O-N ha−1 day−1 | NE | NE | |
| N2O production rates: 0.59–16.02 g N ha−1 day−1 | NE | NE | |||
| 172 | Nitrate reduction: 0.34 μg g−1 h−1 | nirK: ∼0.8 × 10⁵ copies g−1 soil | NE | ||
| nirS: ∼3.3 × 10⁴ copies g−1 soil | NE | ||||
| nosZ: 3.4 × 10⁴ copies g−1 soil | NE | ||||
| 355 | Controls: 0.016 ± 0.007 kg N2O m−2 h−1 | NE | NE | ||
| 344 | 0.01–0.10 μg N2O-N g−1 soil h−1 | narG: 2.0−17.5 × 10⁶ copies g−1 soil | NE | ||
| Namib Desert | 124 | NE | nar & nir genes detected | nar (Nitrospiracea), nir (Rubrobaceraceae, Geodermatophilaceae, Frankiaceae, Micrococcaceae, Mycobaceriaceae, Streptomycetaceae) | |
| 125 | NE | napA (14% total predicted genes), narG (2%), nirK (3.3%), nirS (0.2%), norB (1.2%), nosZ (0.1%) | See Reference for full species list associated with the respective genes | ||
| Mojave Desert | 282 | Bajadas: 13 ng N g−1 h−1 | NE | NE | |
| Playas: 237 ng N g−1 h−1 | NE | NE | |||
| 356 | Denitrification: 161 ± 96 μg N m−2 day−1 | NE | NE | ||
| N2O fluxes: 30 ± 20 μg N m−2 day−1 | NE | ||||
| Potential DEA: 146 ± 8 mg N m−2 day−1 | NE | ||||
| 294 | N2O fluxes (incubations, control soils): 17.5 ± 1.5 mg N2O-N m−2 | NE | NE | ||
| DEA interspace: 0.11 ± 0.08 μg N2O-N m−2 s−1 | NE | NE | |||
| DEA under Larrea tridentata: 1.10 ± 0.26 μg N2O-N m−2 s−1 | NE | NE | |||
| DEA under Lycium spp.: 0.76 ± 0.26 μg N2O-N m−2 s−1 | NE | NE | |||
| DEA under Pleuraphis rigida: 0.43 ± 0.19 μg N2O-N m−2 s−1 | NE | NE | |||
| 299 | DEA controls: 1.23 ± 0.25 μg N2O-N g−1 min−1 | NE | NE | ||
| 279 | Bare soil and soil under grass: 0.6–3.1 ng N g−1 soil day−1 | NE | NE | ||
| Ant nest soil: 1.6–2.0 ng N g−1 soil day−1 | NE | NE | |||
| 357 | Soil under Larrea tridentata: 2.39 ± 1.28 ng N2O-N m−2 h−1 | NE | NE | ||
| Interspaces: 2.74 ± 1.11 ng N2O-N m−2 h−1 | NE | NE | |||
| 125 | NE | napA (15.9% total predicted genes), narG (2.5%), nirK (5.2%), nirS (0.2%), norB (4.2%), nosZ (1%) | See Reference for full species list associated with the respective genes | ||
| Mu Us Desert | 336 | NE | nirS: ∼1 × 10⁶ copies g−1 soil | NE | |
| nirK: ∼3.5 × 10⁶ copies g−1 soil | NE | ||||
| nosZ: ∼1 × 10⁵ copies g−1 soil | NE | ||||
| Negev Desert | 315 | ∼25 μg N kg−1 h−1 | NE | NE | |
| 289 | 0.04 N2O-N kg soil−1 h−1 | NE | NE | ||
| 346 | Sand: ∼0.1–4.5 mg N2O m−2 day−1 | Sand: nirS: ∼3.98 × 10⁶ copies g−1 soil; nirK: ∼5.62 × 10⁵ copies g−1 soil | NE | ||
| Loess: ∼0.1–6.0 mg N2O m−2 day−1 | Loess: nirS: ∼1.58 × 10⁷ copies g−1 soil; nirK: ∼5.62 × 10⁶ copies g−1 soil | NE | |||
| Sonoran Desert | 273 | Wetted soil under Prosopis shrubs: 11.6 g N ha−1 h−1 | NE | NE | |
| Wetted soil at interspaces: 0.2 g N ha−1 h−1 | NE | NE | |||
| 358 | 2.4 ± 2.2 ng N2O-N m−2 s−1 | NE | NE | ||
| 202 | Desert site: 3.7–14 μg N2O-N m−2 h−1 and 5–16 μg NO-N m−2 h−1 | NE | NE | ||
| Soebatsfontein, Succulent Karoo | 350 | 9 ± 3 ng NO-N m−2 s−1 | NE | NE | |
| 18 Antarctica soils | 120 | NE | nap: 2 hits in 1/18 shotgun metagenomes | Bacteroidota | |
| nar: 5 hits in 4/18 shotgun metagenomes | Actinomycetota, Pseudomonadota | ||||
| nor: 86 hits in 14/18 shotgun metagenomes | Acidobacteria, Bacteroidota, Chloroflexi, Cyanobacteria, Pseudomonadota | ||||
| noz: 32 hits in 8/18 shotgun metagenomes | Actinomycetota, Verrucomicrobiota, Archaea | ||||
| University Valley, McMurdo Dry Valleys (Antarctica) | 359 | NE | narG, nasA, napA: 62 reads of metagenome | NE | |
| nirK, nirS, nirA, nirB, nrfA: 56 reads of metagenome | NE | ||||
| Anchorage Island (Antarctica) | 103 | NE | nir, nar, nas, nos | NE | |
| King Sejong Station and Cape Burk area (Antarctica) | 257 | NE | narG: ∼1 × 10⁸ copies g−1 dry soil | NE | |
| nirS: ∼1 × 10¹¹ copies g−1 dry soil | |||||
| nirK: ∼1 × 10⁵ copies g−1 dry soil | |||||
| norB: ∼1 × 10³ copies g−1 dry soil | |||||
| nosZ: ∼1 × 10² copies g−1 dry soil | |||||
| Anvers Island (Antarctica) | 338 | 0.15–2.38 μmol N m−2 h−1 | NE | NE | |
| Signy Island (Antarctica) | 347 | NE | Vegetated: nirK, (0.1 ± 0.1) × 107 copies g−1 soil; nirS, (1.1 ± 0.7) × 107 copies g−1 soil | NE | |
| Fell-Field: nirK, (5.6 ± 8.5) × 107 copies g−1 soil; nirS, (8.6 ± 9.8) × 107 copies g−1 soil | NE | ||||
| Anchorage Island (Antarctica) | NE | Vegetated: nirK, (0.1 ± 0.0) × 107 copies g−1 soil; nirS, (1.4 ± 1.2) × 107 copies g−1 soil | NE | ||
| Fell-Field: nirK, NA; nirS, (11.6 ± 11.0) × 107 copies g−1 soil | NE | ||||
| Rotmoosferner glacier, Ötz Valley (Arctic) | 360 | NE | narG: 7.7 × 10⁷−1.9 × 10⁸ copies g−1 soil | NE | |
| nirS: 4.9 × 10⁶−1.1 × 10⁸ copies g−1 soil | NE | ||||
| nirK: 7.7 × 10⁶−5.7 × 10⁷ copies g−1 soil | NE | ||||
| nosZ: 1.3 × 10⁷−2.8 × 10⁸ copies g−1 soil | NE | ||||
| Zackenberg lowlands, Greenland (High Arctic) | 361 | Active layer (top soil): 0.01–1.37 μg N2O-N kg−1 h−1 | NE | NE | |
| Russian discontinuous permafrost tundra (Arctic) | 362 | Cryoturbated: 1.2–1.8 μmol N2O g−1 dry wt |
narG: (6.5 ± 2.0) × 104 copies ng−1 DNA nirK: (5.1 ± 2.1) × 100 copies ng−1 DNA |
narG: Actinomycetota nirK: Alphaproteobacteria |
|
| nirS: (4.6 ± 1.0) × 103 copies ng−1 DNA | nirS: Alphaproteobacteria, Betaproteobacteria | ||||
| nosZ: (1.2 ± 0.2) × 101 copies ng−1 DNA | nosZ: Alphaproteobacteria | ||||
| Unturbated: NA | narG: (6.5 ± 2.5) × 102 copies ng−1 DNA | ||||
| nirK: (3.5 ± 1.1) × 101 copies ng−1 DNA | |||||
| nirS: (7.2 ± 0.9) × 103 copies ng−1 DNA | |||||
| nosZ: (2.7 ± 1.2) × 100 copies ng−1 DNA | |||||
| Palsa peat Skalluvaara, northwestern Finnish Lapland (Arctic) | 363 | Vegetated unfertilized palsa peat soil (in situ): 0.01–0.02 μmol N2O m−2 h−1 | Unsupplemented palsa peat soil microcosms, 0–20 cm:narG: (1.5 ± 0.1) × 104 copies ng−1 DNA nirK: (1.4 ± 0.3) × 100 copies ng−1 DNA |
narG: Actinomycetota, Alphaproteobacteria nirK: Alphaproteobacteria nirS: Alphaproteobacteria, Betaproteobacteria |
|
| Unsupplemented palsa peat soil microcosms, 0–20 cm: 0.4 nmol N2O g−1 dry wt |
nirS: (2.5 ± 0.3) × 102 copies ng−1 DNA nosZ: (4.3 ± 0.8) × 101 copies ng−1 DNA |
nosZ: Alphaproteobacteria, Betaproteobacteria | |||
| Unsupplemented palsa peat soil microcosms, >20 cm: 1 nmol N2O g−1 dry wt | Unsupplemented palsa peat soil microcosms, >20 cm:narG: (5.1 ± 0.2) × 104 copies ng−1 DNA nirK: (8.6 ± 2.3) × 101 copies ng−1 DNA nirS: (3.7 ± 0.7) × 101 copies ng−1 DNA |
||||
| nosZ: (8.8 ± 0.8) × 101 copies ng−1 DNA | |||||
| Daring Lake, Northwest Territories, (Canadian low Arctic) | 364 | 0.16 nmol N2O m−2 s−1 | NE | NE | |
| McGill Arctic Research Station (MARS) (Canadian high Arctic) | 286 | Trough soils: 0.291 ± 0.086 mg N2O m−2 day−1 | Trough soils (25 cm): nirS: −3 log2 copies | nirS: Nitrosomonadales, Acidiferrobacterales, Rhodocyclales, Xanthomonadales, Pseudomonadales, Rhodobacterales, Burkholderiales | |
| Raised polygon soils: 0.121 ± 0.16 mg N2O m−2 day−1 | Raised polygon soils (5 cm): nirS: −1.1 log2 copies Raised polygon soils (25 cm): nirS: −5 log2 copies |
nirS: Xanthomonadales, Pseudomonadales, Acidiferrobacterales; Burkholderiales | |||
| Cryptoendolith | University Valley, McMurdo Dry Valleys (Antarctica) | 359 | NE | narG, nasA, napA: 66 reads in metagenome | NE |
| nirK, nirS, nirA, nirB, nrfA: 62 reads in metagenome | NE | ||||
| Hypolith | Namib Desert | 71 | NE | nar, nor, nap | Actinomycetota |
| Hypersaline Mat | Omani desert | 349 | 2.0 ± 1.0 nmol N g−1 h−1 | narG: (8.5 ± 0.7) × 106 copies g−1 mat | nosZ (Halomonas koreensis, Rhodanobacter sp., Pseudomonas sp., Marinobacter sp.), nirK (Rhizobiales) |
| nirS: (3.9 ± 1.5) × 106 copies g−1 mat | |||||
| napA: (9.3 ± 0.7) × 107 copies g−1 mat | |||||
| Microbial mats | Fildes Peninsula (Maritime Antarctica) | 365 | NE | nirK: 57 phylotypes | nirK: Octadecabacter antarcticus |
| nirS: 29 phylotypes | nirS: Rubrivivax gelatinosus, Paracoccus denitrificans | ||||
| nosZ: 79 phylotypes | nosZ: Rhodopseudomonas palustris, Azospirillum lipoferum, Pseudomonas sp., Rhodoferax ferrireducens |
D, detected; ND, not detected; NE, not evaluated; NA, not available; DEA, denitrification enzyme activity.
Globally, denitrification significantly contributes to terrestrial N loss, ranging from ∼120 Tg N year−1 (252) to ∼200 Tg N year−1 (272). In terms of deserts, estimates of denitrification rates are highly variable, ranging from 0.4 to 10 kg N ha−1 year−1 in hot deserts and BSCs (e.g., Chihuahuan, Sonoran, and Negev Deserts) (199, 273) to 19 kg N ha−1 year−1 in cold deserts (Colorado Plateau) (163, 274, 275). Denitrification genes also show highly variable abundances in hot and cold desert soils and BSCs (Fig. 1). For example, nirS gene abundances have been shown to range from ∼9.89 × 10⁶ to ∼2.00 × 10¹⁰ copies g−1 dry soil in the Negev Desert and Antarctica, respectively (Fig. 1). Although denitrification estimates are available for a number of deserts, it remains an understudied process in extreme environments in comparison to nitrogen fixation and nitrification. Abundances for denitrification genes (narG, nirK, nirS, norB, and nosZ) in deserts are mostly available for soils and limited to narG, nirK, nirS, and, rarely, nosZ (Fig. 2; Table 3). Given that denitrification contributes to more than 30% of N loss from terrestrial ecosystems, the need for information on denitrification at ecosystem, landscape, regional, and global scales is pressing (276).
Desert soil N emissions were found to be independent of microbial community composition (204), while those of BSCs were influenced by crust type (e.g., light, dark, chlorolichen, and moss biocrusts) (277) (Table 3). Denitrification rates in deserts have also been shown to be affected by multiple variables, including elevated soil surface temperatures, precipitation, C and N supply, vegetation, and pH (10, 253, 278–281). Denitrifying enzymes in hot desert soils show optimal activities between 30°C and 40°C (282, 283). Conversely, in the cold Arctic and Antarctic soils, denitrification potentials based on the presence of narG, nirK, nirS, norB, and nosZ genes and denitrification activity based on in situ and laboratory measurements of N2O fluxes suggest that denitrification can occur from –4°C to +25°C, especially in soils with higher moisture content (281, 284–286). This clearly demonstrates a niche adaptation of the desert denitrifying guilds (287, 288).
NO and N2O emissions in drylands are usually highest following precipitation and/or irrigation events (202, 206, 224, 229, 289). Wetting typically causes high soil respiration pulses (290–292), together with the release of intracellular solutes from microbial cells undergoing osmotic stress, resulting in a high flux of nutrients into soils (289, 293). Respiration may be sufficiently rapid to deplete soil oxygen levels, creating anaerobic microsites that allow for anaerobic processes to occur, with substantial release of N2O (184, 289). In addition, niche separation of N2O-producing microorganisms is likely to occur with drying-wetting events: fungal denitrifiers and AOA ammonia oxidizers may dominate under dry conditions, while heterotrophic bacteria may be the key mediators of denitrification under wet conditions (184).
Several studies suggest that high levels of labile C and inorganic N promote denitrification in soils (10, 279, 280, 294, 295). As most denitrifying bacteria are heterotrophs, higher concentrations of SOM are likely to increase denitrification by either (i) increasing the energy and electron supply to communities or (ii) enhancing microbial growth and metabolism (associated with high O2 consumption), thereby forcing heterotrophs to switch from oxic to anoxic metabolism (296–298). Similarly, increased soil NO3− concentrations can result in higher denitrification rates and N2O emissions (294, 297). However, this is subjected to certain conditions, such as O2 tension and sufficient C availability (297). Soil cover type can strongly influence C and N availability, which affect denitrification rates. Several studies have shown that soils from vegetated areas (e.g., under plant canopies/shrubs) have considerably higher rates of net nitrification and potential denitrification than soils from interspaces (294, 299). These resource hot spots/islands of fertility supply sufficient C and N for increased microbial activity and N cycling. Lastly, the relationship between soil pH and potential denitrification has been well documented (300–303). Generally, denitrification rates increase with increasing pH and organic C content (to an optimum pH of ∼7 to 8), with a high N2/N2O ratio. In contrast, denitrification activity is low in acidic soils, although the fraction of N2O produced is high (high N2O/N2 ratio) (301).
Although denitrification is performed under anaerobic conditions, recent studies have unequivocally demonstrated that aerobic denitrification (i.e., simultaneous use of both oxygen [O2] and nitrate [NO3−] as electron acceptors) is an active and widespread process in taxa commonly isolated from soils (287, 304). However, this process has rarely been studied in desert ecosystems, and the mechanism of aerobic denitrification, at various molecular levels, warrants further attention.
Anaerobic ammonium oxidation (Anammox).
Anaerobic ammonium oxidation (anammox) is an autotrophic anaerobic process leading to the release of N2 into the atmosphere without the concomitant emission of nitric and nitrous oxides (Fig. 2). This process is performed by members of only six known bacterial genera from the “Candidatus Brocadiales” order (Planctomycetota) but which are commonly found in many natural and engineered ecosystems (305). Anammox can be quantified with 15N incorporation assays and qualitatively assessed using the phylogenetic diversity and abundances of the hzsA/hzsB (hydrazine synthase subunit A/B) genes (306). Globally, the abundance and diversity of anammox bacteria have been shown to be environment specific (i.e., niche partitioned) (305). Anammox activity has been found to be responsible for up to 37% of the N2 produced in temperate soils and to be influenced by seasonal changes and depth (215, 307). The abundance of anammox bacteria depends strongly on substrate availability, i.e., NO2− and NH4+, for which many microbial guilds compete to perform their N-input and N-loss processes (Fig. 2) (308), and also water, the main limiting factor (before N) in dryland productivity. Consequently, and although anammox bacteria have been detected in various niches of hot, cold, and polar deserts, their activity was marginal even under wet conditions, suggesting that this process is not particularly important for N loss in drylands (125, 309) (Table 4).
TABLE 4.
Microbial anammox in hot and cold dryland/desert habitatsa
| Habitat type | Desert | Reference | Anammox rate | Annamox genes | Anaerobic ammonia oxidizers |
|---|---|---|---|---|---|
| Biological soil crust | Omani Desert | 163 | Lichen crust: ND | NE | NE |
| Cyanobacterial crust: ND | NE | NE | |||
| Mojave Desert | 309 | D | NE | NE | |
| Chihuahan Desert | 309 | D | NE | NE | |
| Sonoran Desert | 309 | D | NE | NE | |
| Colorado Plateau | 309 | D | NE | NE | |
| Soil | Australia | 125 | NE | ND | “Candidatus Brocadia sp.” |
| Mojave Desert | 125 | NE | ND | ND | |
| Gobi | 125 | NE | ND | ND | |
| Namib Desert | 125 | NE | ND | ND | |
| Hypolith | Namib Desert | 71 | NE | ND | ND |
| Hypersaline mat | Omani Desert | 349 | ND | NE | NE |
Anammox, anaerobic ammonium oxidation; D, detected; ND, not detected; NE, not evaluated.
Nitrifier denitrification and nitrification.
Nitrifier denitrification and nitrification are microbial processes contributing to the release of gaseous N from ammonium (Fig. 2). Despite the existence of isotopic methods enabling the tracing of N2O emissions (211), segregating the respective contributions of nitrification or nitrifier denitrification in the release of gaseous N remains difficult (211, 224).
Nitrifier denitrification is essentially performed by ammonia-oxidizing bacteria under water- and nutrient-limited conditions (211). These represent typical dryland environmental conditions, which suggests that in such environments, nitrifier denitrification participates in the release of N2O (184, 211). It is noticeable that with the increasing temperatures linked to global climate change (59), ammonia-oxidizing archaeal abundances, along with their contribution to N2O emissions, are expected to increase (184). However, to the best of our knowledge, the rate of N2O emissions related to this specific process has never been investigated in drylands.
Nitrifying bacteria, such as Nitrosomonas spp., Nitrosolobus spp., Nitrospira spp., Nitrosococcus spp., and Nitrosovibrio spp., and nitrate oxidizers (e.g., Nitrobacter spp.) are capable of producing NO and N2O during the oxidation of ammonium (207–209, 310–312). While their presence has been established in various niches of many drylands/deserts (Table 2) and supports the view that nitrification participates in dryland N loss, the overall low carbon content and water availability in drylands make it most certainly marginal during prolonged dry periods (205, 210). However, following precipitation events, drylands represent NO emission “hot spots,” and nitrification is considered to dominate NO emissions under aerobic conditions (195). This has been linked particularly to the accumulation of N during the dry season, as plant uptake is negligible, and to decoupling it from the N biogeochemical cycling in soils (224). With the prolongation of drought periods, and therefore N accumulation, in drylands in relation to global climate change (1), NO and N2O emissions via nitrification N loss may increase after each (rare) precipitation event, creating in the process a positive-feedback loop exacerbating climate change.
CONCLUSIONS AND PERSPECTIVES IN A WARMING WORLD
This review clearly shows that a myriad of specialized fungal and prokaryotic taxa participate in dryland N biogeochemical cycling (Fig. 1 and 2; Tables 1 to 4). Nevertheless, N-cycling microbial community and process data from major arid environments are missing (e.g., the Sahara Desert and southern African drylands) (Fig. 1). Similarly, the roles of some potentially important microbial groups and processes (e.g., nitrifier denitrification and nitrification in N2O emissions) have yet to be studied in any detail at all. For example, the role of viruses and viral lysis in the release of nutrients and in organic matter turnover in desert soils is completely unknown (313). Also, the global contributions of microeukaryotes and macroinvertebrates in desert ecosystems to nitrogen budgets are largely unknown, despite clear evidence that these taxa actively participate in nitrogen cycling and food web dynamics in some deserts (314, 315). We expect that the ongoing development of high-throughput meta-omics technologies (124, 125, 316, 317) will help to fill in these knowledge gaps and also allow the detection of microbial N metabolisms particularly adapted to the oligotrophy and dryness of desert ecosystems, as recently shown for carbon and energy acquisition processes of hyperarid Namib Desert and Antarctic Dry Valley soils (124, 318).
The effect of global climate change on arid ecosystem nitrogen cycling requires particular attention, especially since microbially mediated N turnover data are lacking in climate change models and the surface of hot drylands is expanding (1, 319–322). This is particularly relevant, as many microbial pathways can lead to the emissions of the potent greenhouse gas nitrous oxide (N2O) (Fig. 2) (139). We note that the effects of climate change are geographically variable and therefore intimately dependent on the initial state of the ecosystem or region (139). The impacts of climate change on N-cycling microbial communities and processes should therefore be dryland dependent and evaluated as such. This is particularly noticeable since warming temperatures will have contrasting effects on hot and polar deserts, as the former will become hotter and drier while the latter will become hotter and more humid (319).
ACKNOWLEDGMENTS
We acknowledge the respective institutions, i.e., the Pontificia Universidad Católica de Chile and the University of Pretoria, for support. This review was further supported by Chilean and South African research funding institutions, namely, a Conicyt-Fondecyt fellowship (no. 3190464 awarded to K.J.), ANID-Fondecyt grants (no. 190998 awarded to B.D. and no. 1210912 awarded to J.-B.R.), ANID-FONDAP grants [CRG no. 15200002 and (CR)2 no. 15110009 awarded to B.D.], and NRF grants (no. 104888 awarded to J.-B.R. and no. 113308 awarded to D.A.C.). S.M.H. was supported by a University of Pretoria postdoctoral fellowship awarded to D.A.C.
Biographies

Jean-Baptiste Ramond, educated in France, completed his Ph.D. in Microbiology/Microbial Ecology in 2008. He then moved to South Africa for a postdoctoral research fellowship (2009–2012) at the University of the Western Cape (Cape Town) and a research fellowship at the Centre for Microbial Ecology and Genomics (CMEG) of the University of Pretoria (2012–2019). In 2019, he was appointed Assistant Professor at the Pontificia Universidad Católica de Chile and, in parallel, is an Extraordinary Lecturer of the Department of Biochemistry, Genetics and Microbiology of the University of Pretoria (NRF C2-rated since 2021) and a Visiting Academic in the Faculty of Humanities and Social Sciences of Oxford Brookes University (UK). Using -omics technologies, his research mainly aims at better understanding the adaptation of environmental microbial communities to extreme environmental conditions and climate change, particularly in deserts.

Karen Jordaan received her Master’s and Ph.D. degrees in Environmental Sciences from the North-West University, South Africa. She is currently a Fondecyt-CONICYT Postdoctoral Fellow associated with the Faculty of Biological Sciences based at Pontificia Universidad Católica de Chile, Santiago, Chile. Her main research interest focuses on understanding the impacts of extreme environments, mainly drylands, on microbial community composition, diversity, function, and interactions/cooccurrences between microorganisms.

Beatriz Díez received a Ph.D. in Biology from the Autónoma Universidad de Barcelona (UAB)–Institute of Marine Sciences (CMIMA-CSIC) (Spain) in 2001. During her Ph.D., she revealed the identity, diversity, and distribution of completely new picoeukaryotes in marine environments by using, for the first time, molecular methods. She was a postdoctoral fellow at the Department of Botany, Stockholm University (Sweden), studying the phylogeny, activity, and ecological importance of nitrogen-fixing cyanobacteria in marine systems, and at CMIMA-CSIC Barcelona (Spain), studying the microbial ecology of marine systems. In 2010, she became an Assistant Professor at the Department of Molecular Genetics and Microbiology of the Pontificia Universidad Católica de Chile, and in 2016 an Associate Professor at the BDíez Lab (https://bdiezlab.com). She studies the ecological role of microbes and viruses, their impact on biogeochemical cycles, and their responses to environmental changes, perturbations, and adaptations (metabolic and genetic) by combining quantitative molecular, genomic, meta-omics, and biogeochemical approaches.

Don A. Cowan was educated at the University of Waikato (New Zealand) and completed a 4-year period of postdoctoral research before moving to a Lectureship at University College London (UK) in 1985. After 16 years in London, he moved to the University of the Western Cape (Republic of South Africa), where he established the Institute for Microbial Ecology and Metagenomics. He moved to the University of Pretoria in May 2012 in the dual role of Director of both the University of Pretoria Institutional Research Theme in Genomics and his research group, the Centre for Microbial Ecology and Genomics. He is an NRF A1-rated researcher. Don Cowan's research activities in microbial ecology are mostly linked by the theme of “environmental extremes.” For the past 2 decades, he has worked on the microbial ecology of Namib Desert soils and at the lower end of the biotic temperature scale, studying the microbiology of the Dry Valleys of Eastern Antarctica in collaboration with researchers from all over the world.
REFERENCES
- 1.IPCC. 2019. Summary for policymakers. In Shukla PR, Skea J, Calvo Buendia E, Masson-Delmotte V, Pörtner H-O, Roberts DC, Zhai P, Slade R, Connors S, van Diemen R, Ferrat M, Haughey E, Luz S, Neogi S, Pathak M, Petzold J, Portugal Pereira J, Vyas P, Huntley E, Kissick K, Belkacemi M, Malley J (ed), Climate change and land: an IPCC special report on climate change, desertification, land degradation, sustainable land management, food security, and greenhouse gas fluxes in terrestrial ecosystems. [Google Scholar]
- 2.Laity JJ. 2009. Deserts and desert environments, vol 3. Wiley-Blackwell, Hoboken, NJ. [Google Scholar]
- 3.Chan Y, Lacap DC, Lau MC, Ha KY, Warren-Rhodes KA, Cockell CS, Cowan DA, McKay CP, Pointing SB. 2012. Hypolithic microbial communities: between a rock and a hard place. Environ Microbiol 14:2272–2282. 10.1111/j.1462-2920.2012.02821.x. [DOI] [PubMed] [Google Scholar]
- 4.Pointing SB, Belnap J. 2012. Microbial colonization and controls in dryland systems. Nat Rev Microbiol 10:551–562. 10.1038/nrmicro2831. [DOI] [PubMed] [Google Scholar]
- 5.Makhalanyane TP, Valverde A, Gunnigle E, Frossard A, Ramond JB, Cowan DA. 2015. Microbial ecology of hot desert edaphic systems. FEMS Microbiol Rev 39:203–221. 10.1093/femsre/fuu011. [DOI] [PubMed] [Google Scholar]
- 6.Marasco R, Mosqueira MJ, Fusi M, Ramond JB, Merlino G, Booth JM, Maggs-Kolling G, Cowan DA, Daffonchio D. 2018. Rhizosheath microbial community assembly of sympatric desert speargrasses is independent of the plant host. Microbiome 6:215. 10.1186/s40168-018-0597-y. [DOI] [PMC free article] [PubMed] [Google Scholar]
- 7.Barger NN, Weber B, Garcia-Pichel F, Zaady E, Belnap J. 2016. Patterns and controls on nitrogen cycling of biological soil crusts, p 257–285. In Weber B, Büdel B, Belnap J (ed), Biological soil crusts: an organizing principle in drylands ecological studies (analysis and synthesis). Springer, Cham, Switzerland. 10.1007/978-3-319-30214-0_14. [DOI] [Google Scholar]
- 8.Leung PM, Bay SK, Meier DV, Chiri E, Cowan DA, Gillor O, Woebken D, Greening C. 2020. Energetic basis of microbial growth and persistence in desert ecosystems. mSystems 5:e00495-19. 10.1128/mSystems.00495-19. [DOI] [PMC free article] [PubMed] [Google Scholar]
- 9.Trenberth KE, Smith L. 2005. The mass of the atmosphere: a constraint on global analyses. J Climate 18:864–875. 10.1175/JCLI-3299.1. [DOI] [Google Scholar]
- 10.Yergeau E, Kang S, He Z, Zhou J, Kowalchuk GA. 2007. Functional microarray analysis of nitrogen and carbon cycling genes across an Antarctic latitudinal transect. ISME J 1:163–179. 10.1038/ismej.2007.24. [DOI] [PubMed] [Google Scholar]
- 11.Zehr JP, Kudela RM. 2011. Nitrogen cycle of the open ocean: from genes to ecosystems. Annu Rev Mar Sci 3:197–225. 10.1146/annurev-marine-120709-142819. [DOI] [PubMed] [Google Scholar]
- 12.Gruber N. 2008. The marine nitrogen cycle: overview and challenges, p 1–50. In Capone DG, Bronk DA, Mulholland MR, Carpenter EJ (ed), Nitrogen in the marine environment, 2nd ed. Academic Press, New York, NY. 10.1016/B978-0-12-372522-6.00001-3. [DOI] [Google Scholar]
- 13.Batjes NH. 1996. Total carbon and nitrogen in the soils of the world. Eur J Soil Sci 47:151–163. 10.1111/j.1365-2389.1996.tb01386.x. [DOI] [Google Scholar]
- 14.Post WM, Pastor J, Zinke PJ, Stangenberger AG. 1985. Global patterns of soil nitrogen storage. Nature 317:613–616. 10.1038/317613a0. [DOI] [Google Scholar]
- 15.Walvoord MA, Phillips FM, Stonestrom DA, Evans RD, Hartsough PC, Newman BD, Striegl RG. 2003. A reservoir of nitrate beneath desert soils. Science 302:1021–1024. 10.1126/science.1086435. [DOI] [PubMed] [Google Scholar]
- 16.Graham RC, Hirmas DR, Wood YA, Amrhein C. 2008. Large near-surface nitrate pools in soils capped by desert pavement in the Mojave Desert, California. Geol 36:259–262. 10.1130/G24343A.1. [DOI] [Google Scholar]
- 17.Xu R, Prentice IC. 2008. Terrestrial nitrogen cycle simulation with a dynamic global vegetation model. Global Change Biol 14:1745–1764. 10.1111/j.1365-2486.2008.01625.x. [DOI] [Google Scholar]
- 18.Hadley N, Szarek S. 1981. Productivity of desert ecosystems. Bioscience 31:747–753. 10.2307/1308782. [DOI] [Google Scholar]
- 19.Vitousek PM, Howarth RW. 1991. Nitrogen limitation on land and in the sea: how can it occur? Biogeochemistry 13:87–115. [Google Scholar]
- 20.Bobbink R, Hicks K, Galloway J, Spranger T, Alkemade R, Ashmore M, Bustamante M, Cinderby S, Davidson E, Dentener F, Emmett B, Erisman JW, Fenn M, Gilliam F, Nordin A, Pardo L, De Vries W. 2010. Global assessment of nitrogen deposition effects on terrestrial plant diversity: a synthesis. Ecol Appl 20:30–59. 10.1890/08-1140.1. [DOI] [PubMed] [Google Scholar]
- 21.Bai E, Houlton BZ, Wang YP. 2012. Isotopic identification of nitrogen hotspots across natural terrestrial ecosystems. Biogeosciences 9:3287–3304. 10.5194/bg-9-3287-2012. [DOI] [Google Scholar]
- 22.Safriel U, Adeel Z, Niemeijer D, Puigdefabregas J, White R, Lal R, Winslow M, Ziedler J, Prince S, Archer E, King C, Shapiro B, Wessels K, Nielsen TT, Portnov B, Reshef I, Thornell J, Lachman E, McNab D. 2005. Dryland systems, p 623–662. In Hassan R, Scholes R, Ash N (ed), Ecosystems and human well-being: current state and trends. Findings of the Condition and Trends Working Group, vol 1. Island Press, Washington, DC. [Google Scholar]
- 23.Vitousek PM, Cassman K, Cleveland CC, Crews T, Field CB, Grimm NB, Howarth RW, Marino R, Martinelli L, Rastetter EB, Sprent JI. 2002. Towards an ecological understanding of biological nitrogen fixation. Biogeochemistry 57:1–45. 10.1023/A:1015798428743. [DOI] [Google Scholar]
- 24.Huang J, Yu H, Guan X, Wang G, Guo R. 2016. Accelerated dryland expansion under climate change. Nat Clim Chang 6:166–171. 10.1038/nclimate2837. [DOI] [Google Scholar]
- 25.Phoenix GK, Hicks WK, Cinderby S, Kuylenstierna JCI, Stock WD, Dentener FJ, Giller KE, Austin AT, Lefroy RDB, Gimeno BS, Ashmore MR, Ineson P. 2006. Atmospheric nitrogen deposition in world biodiversity hotspots: the need for a greater global perspective in assessing N deposition impacts. Glob Change Biol 12:470–476. 10.1111/j.1365-2486.2006.01104.x. [DOI] [Google Scholar]
- 26.McNeill A, Unkovich M. 2007. The nitrogen cycle in terrestrial ecosystems. In Marschner P, Rengel Z (ed), Nutrient cycling in terrestrial ecosystems soil biology, vol 10. Springer, Berlin, Germany. [Google Scholar]
- 27.Reed SC, Cleveland CC, Townsend AR. 2011. Functional ecology of free-living nitrogen fixation: a contemporary perspective. Annu Rev Ecol Evol Syst 42:489–512. 10.1146/annurev-ecolsys-102710-145034. [DOI] [Google Scholar]
- 28.Vet R, Artz RS, Carou S, Shaw M, Ro C-U, Aas W, Baker A, Bowersox VC, Dentener F, Galy-Lacaux C, Hou A, Pienaar JJ, Gillett R, Forti MC, Gromov S, Hara H, Khodzher T, Mahowald NM, Nickovic S, Rao PSP, Reid NW. 2014. A global assessment of precipitation chemistry and deposition of sulfur, nitrogen, sea salt, base cations, organic acids, acidity and pH, and phosphorus. Atmos Environ 93:3–100. 10.1016/j.atmosenv.2013.10.060. [DOI] [Google Scholar]
- 29.Holland EA, Braswell BH, Sulzman J, Lamarque J-F. 2005. Nitrogen deposition onto the United States and western Europe: synthesis of observations and models. Ecol Appl 15:38–57. 10.1890/03-5162. [DOI] [Google Scholar]
- 30.Cleveland CC, Townsend AR, Schimel DS, Fisher H, Howarth RW, Hedin LO, Perakis SS, Latty EF, Von Fischer JC, Elseroad A, Wasson MF. 1999. Global patterns of terrestrial biological nitrogen (N2) fixation in natural ecosystems. Glob Biogeochem Cycles 13:623–645. 10.1029/1999GB900014. [DOI] [Google Scholar]
- 31.Davies-Barnard T, Friedlingstein P. 2020. The global distribution of biological nitrogen fixation in terrestrial natural ecosystems. Glob Biogeochem Cycles 34:e2019GB006387. [Google Scholar]
- 32.Cleveland CC, Houlton BZ, Smith WK, Marklein AR, Reed SC, Parton W, Del Grosso SJ, Running SW. 2013. Patterns of new versus recycled primary production in the terrestrial biosphere. Proc Natl Acad Sci USA 110:12733–12737. 10.1073/pnas.1302768110. [DOI] [PMC free article] [PubMed] [Google Scholar]
- 33.Houlton BZ, Morford SL. 2015. A new synthesis for terrestrial nitrogen inputs. Soil 1:381–397. 10.5194/soil-1-381-2015. [DOI] [Google Scholar]
- 34.Reis CRG, Pacheco FS, Reed SC, Tejada G, Nardoto GB, Forti MC, Ometto JP. 2020. Biological nitrogen fixation across major biomes in Latin America: patterns and global change effects. Sci Total Environ 746:140998. 10.1016/j.scitotenv.2020.140998. [DOI] [PubMed] [Google Scholar]
- 35.Ewing SA, Michalski G, Thiemens M, Quinn RC, Macalady JL, Kohl S, Wankel SD, Kendall C, McKay CP, Amundson R. 2007. Rainfall limit of the N cycle on Earth. Global Biogeochem Cycles 21:GB3009. [Google Scholar]
- 36.Tie X, Zhang R, Brasseur G, Lei W. 2002. Global NOx production by lightning. J Atmos Chem 43:61–74. 10.1023/A:1016145719608. [DOI] [Google Scholar]
- 37.Báez S, Fargione J, Moore DI, Collins SL, Gosz JR. 2007. Atmospheric nitrogen deposition in the northern Chihuahuan desert: temporal trends and potential consequences. J Arid Environ 68:640–651. 10.1016/j.jaridenv.2006.06.011. [DOI] [Google Scholar]
- 38.Bond DW, Steiger S, Zhang R, Tie X, Orville RE. 2002. The importance of NOx production by lightning in the tropics. Atmos Environ 36:1509–1519. 10.1016/S1352-2310(01)00553-2. [DOI] [Google Scholar]
- 39.Miyazaki K, Eskes HJ, Sudo K, Zhang C. 2014. Global lightning NOx production estimated by an assimilation of multiple satellite data sets. Atmos Chem Phys 14:3277–3305. 10.5194/acp-14-3277-2014. [DOI] [Google Scholar]
- 40.Nesbitt SW, Zhang R, Orville RE. 2000. Seasonal and global NOx production by lightning estimated from the Optical Transient Detector (OTD). Tellus B 52:1206–1215. 10.3402/tellusb.v52i5.17098. [DOI] [Google Scholar]
- 41.Li K, Liu X, Song W, Chang Y, Hu Y, Tian C. 2013. Atmospheric nitrogen deposition at two sites in an arid environment of Central Asia. PLoS One 8:e67018. 10.1371/journal.pone.0067018. [DOI] [PMC free article] [PubMed] [Google Scholar]
- 42.Liu YW, Wang YS, Pan YP, Piao SL, Xu-Ri. 2015. Wet deposition of atmospheric inorganic nitrogen at five remote sites in the Tibetan Plateau. Atmos Chem Phys 15:11683–11700. 10.5194/acp-15-11683-2015. [DOI] [Google Scholar]
- 43.Sickman JO, James AE, Fenn ME, Bytnerowicz A, Lucero DM, Homyak PM. 2019. Quantifying atmospheric N deposition in dryland ecosystems: a test of the integrated total nitrogen input (ITNI) method. Sci Total Environ 646:1253–1264. 10.1016/j.scitotenv.2018.07.320. [DOI] [PubMed] [Google Scholar]
- 44.Li SQ, Bu TY, Li SX. 1993. Ammonium nitrification and fixation by clay minerals in calcareous soil. Agric Res Arid Areas 11:99–107. [Google Scholar]
- 45.Kanakidou M, Myriokefalitakis S, Daskalakis N, Fanourgakis G, Nenes A, Baker AR, Tsigaridis K, Mihalopoulos N. 2016. Past, present and future atmospheric nitrogen deposition. J Atmos Sci 73:2039–2047. 10.1175/JAS-D-15-0278.1. [DOI] [PMC free article] [PubMed] [Google Scholar]
- 46.Reay DS, Dentener F, Smith P, Grace J, Feely RA. 2008. Global nitrogen deposition and carbon sinks. Nat Geosci 1:430–437. 10.1038/ngeo230. [DOI] [Google Scholar]
- 47.Rao LE, Parker DR, Bytnerowicz A, Allen EB. 2009. Nitrogen mineralization across an atmospheric nitrogen deposition gradient in Southern California deserts. J Arid Environ 73:920–930. 10.1016/j.jaridenv.2009.04.007. [DOI] [Google Scholar]
- 48.Offer ZY, Goossens D, Shachak M. 1992. Aeolian deposition of nitrogen to sandy and loessial ecosystems in the Negev Desert. J Arid Environ 23:355–363. 10.1016/S0140-1963(18)30609-8. [DOI] [Google Scholar]
- 49.Bonnail E, Cunha Lima R, Martinez Turrieta G. 2018. Trapping fresh sea breeze in desert? Health status of Camanchaca, Atacama's fog. Environ Sci Pollut Res Int 25:18204–18212. 10.1007/s11356-018-2278-6. [DOI] [PubMed] [Google Scholar]
- 50.Gottlieb TR, Eckardt FD, Venter ZS, Cramer MD. 2019. The contribution of fog to water and nutrient supply to Arthraerua leubnitziae in the central Namib Desert, Namibia. J Arid Environ 161:35–46. 10.1016/j.jaridenv.2018.11.002. [DOI] [Google Scholar]
- 51.Mitchell D, Henschel JR, Hetem RS, Wassenaar TD, Strauss WM, Hanrahan SA, Seely MK. 2020. Fog and fauna of the Namib Desert: past and future. Ecosphere 11:e02996. 10.1002/ecs2.2996. [DOI] [Google Scholar]
- 52.Westbeld A, Klemm O, Grießbaum F, Sträter E, Larrain H, Osses P, Cereceda P. 2009. Fog deposition to a Tillandsia carpet in the Atacama Desert. Ann Geophys 27:3571–3576. 10.5194/angeo-27-3571-2009. [DOI] [Google Scholar]
- 53.Lange OL, Allan Green TG, Melzer B, Meyer A, Zellner H. 2006. Water relations and CO2 exchange of the terrestrial lichen Teloschistes capensis in the Namib fog desert: measurements during two seasons in the field and under controlled conditions. Flora 201:268–280. 10.1016/j.flora.2005.08.003. [DOI] [Google Scholar]
- 54.Azua-Bustos A, Gonzalez-Silva C, Mancilla RA, Salas L, Gomez-Silva B, McKay CP, Vicuna R. 2011. Hypolithic cyanobacteria supported mainly by fog in the coastal range of the Atacama Desert. Microb Ecol 61:568–581. 10.1007/s00248-010-9784-5. [DOI] [PubMed] [Google Scholar]
- 55.Spirig R, Vogt R, Larsen JA, Feigenwinter C, Wicki A, Franceschi J, Parlow E, Adler B, Kalthoff N, Cermak J, Andersen H, Fuchs J, Bott A, Hacker M, Wagner N, Maggs-Kölling G, Wassenaar T, Seely M. 2019. Probing the fog life cycles in the Namib Desert. Bull Am Meteorol Soc 100:2491–2507. 10.1175/BAMS-D-18-0142.1. [DOI] [Google Scholar]
- 56.del Río C, Lobos-Roco F, Latorre C, Koch MA, García JL, Osses P, Lambert F, Alfaro F, Siegmund A. 2021. Spatial distribution and interannual variability of coastal fog and low clouds cover in the hyperarid Atacama Desert and implications for past and present Tillandsia landbeckii ecosystems. Plant Syst Evol 307:1–23. 10.1007/s00606-021-01782-z. [DOI] [Google Scholar]
- 57.Vitousek PM, Aber JD, Howarth RW, Likens GE, Matson PA, Schindler DW, Schlesinger WH, Tilman DG. 1997. Human alteration of the global nitrogen cycle: sources and consequences. Ecol Appl 7:737–750. 10.2307/2269431. [DOI] [Google Scholar]
- 58.Cook EM, Sponseller R, Grimm NB, Hall SJ. 2018. Mixed method approach to assess atmospheric nitrogen deposition in arid and semi-arid ecosystems. Environ Pollut 239:617–630. 10.1016/j.envpol.2018.04.013. [DOI] [PubMed] [Google Scholar]
- 59.IPCC. 2021. Summary for policymakers. In Masson-Delmotte V, Zhai P, Pirani A, Connors SL, Péan C, Berger S, Caud N, Chen Y, Goldfarb L, Gomis MI, Huang M, Leitzell K, Lonnoy E, Matthews JBR, Maycock TK, Waterfield T, Yelekçi O, Yu R, Zhou B (ed), Climate change 2021: the physical science basis. Contribution of Working Group I to the Sixth Assessment Report of the Intergovernmental Panel on Climate Change, 2021. [Google Scholar]
- 60.Hooper DU, Johnson L. 1999. Nitrogen limitation in dryland ecosystems: responses to geographical and temporal variation in precipitation. Biogeochemistry 46:247–293. 10.1007/BF01007582. [DOI] [Google Scholar]
- 61.Allen EB, Rao L, Steers RJ, Bytnerowicz A, Fenn ME. 2009. Impacts of atmospheric nitrogen deposition on vegetation and soils in Joshua Tree National Park, p 78–100. In Webb RH, Fenstermaker LF, Heaton JS, Hughson DL, McDonald EV, Miller DM (ed), The Mojave Desert: ecosystem processes and sustainability. University of Nevada Press, Las Vegas, NV. [Google Scholar]
- 62.Zhou Z, Wang C, Zheng M, Jiang L, Luo Y. 2017. Patterns and mechanisms of responses by soil microbial communities to nitrogen addition. Soil Biol Biochem 115:433–441. 10.1016/j.soilbio.2017.09.015. [DOI] [Google Scholar]
- 63.Zhou X, Zhang Y, Downing A. 2012. Non-linear response of microbial activity across a gradient of nitrogen addition to a soil from the Gurbantunggut Desert, northwestern China. Soil Biol Biochem 47:67–77. 10.1016/j.soilbio.2011.05.012. [DOI] [Google Scholar]
- 64.Zehr JP, Jenkins BD, Short SM, Steward GF. 2003. Nitrogenase gene diversity and microbial community structure: a cross-system comparison. Environ Microbiol 5:539–554. 10.1046/j.1462-2920.2003.00451.x. [DOI] [PubMed] [Google Scholar]
- 65.Cowan DA, Sohm JA, Makhalanyane TP, Capone DG, Green TG, Cary SC, Tuffin IM. 2011. Hypolithic communities: important nitrogen sources in Antarctic desert soils. Environ Microbiol Rep 3:581–586. 10.1111/j.1758-2229.2011.00266.x. [DOI] [PubMed] [Google Scholar]
- 66.Brankatschk R, Fischer T, Veste M, Zeyer J. 2013. Succession of N cycling processes in biological soil crusts on a Central European inland dune. FEMS Microbiol Ecol 83:149–160. 10.1111/j.1574-6941.2012.01459.x. [DOI] [PubMed] [Google Scholar]
- 67.Wang J, Bao JT, Li XR, Liu YB. 2016. Molecular ecology of nifH genes and transcripts along a chronosequence in revegetated areas of the Tengger Desert. Microb Ecol 71:150–163. 10.1007/s00248-015-0657-9. [DOI] [PubMed] [Google Scholar]
- 68.Lacap-Bugler DC, Lee KK, Archer S, Gillman LN, Lau MCY, Leuzinger S, Lee CK, Maki T, McKay CP, Perrott JK, de Los Rios-Murillo A, Warren-Rhodes KA, Hopkins DW, Pointing SB. 2017. Global diversity of desert hypolithic cyanobacteria. Front Microbiol 8:867. 10.3389/fmicb.2017.00867. [DOI] [PMC free article] [PubMed] [Google Scholar]
- 69.Warshan D, Bay G, Nahar N, Wardle DA, Nilsson MC, Rasmussen U. 2016. Seasonal variation in nifH abundance and expression of cyanobacterial communities associated with boreal feather mosses. ISME J 10:2198–2208. 10.1038/ismej.2016.17. [DOI] [PMC free article] [PubMed] [Google Scholar]
- 70.Crits-Christoph A, Robinson CK, Ma B, Ravel J, Wierzchos J, Ascaso C, Artieda O, Souza-Egipsy V, Casero MC, DiRuggiero J. 2016. Phylogenetic and functional substrate specificity for endolithic microbial communities in hyper-arid environments. Front Microbiol 7:301. 10.3389/fmicb.2016.00301. [DOI] [PMC free article] [PubMed] [Google Scholar]
- 71.Vikram S, Guerrero LD, Makhalanyane TP, Le PT, Seely M, Cowan DA. 2016. Metagenomic analysis provides insights into functional capacity in a hyperarid desert soil niche community. Environ Microbiol 18:1875–1888. 10.1111/1462-2920.13088. [DOI] [PubMed] [Google Scholar]
- 72.Stivaletta N, Barbieri R, Billi D. 2012. Microbial colonization of the salt deposits in the driest place of the Atacama Desert (Chile). Orig Life Evol Biosph 42:187–200. 10.1007/s11084-012-9289-y. [DOI] [PubMed] [Google Scholar]
- 73.Ramond JB, Woodborne S, Hall G, Seely M, Cowan DA. 2018. Namib Desert primary productivity is driven by cryptic microbial community N-fixation. Sci Rep 8:6921. 10.1038/s41598-018-25078-4. [DOI] [PMC free article] [PubMed] [Google Scholar]
- 74.Leigh JA. 2000. Nitrogen fixation in methanogens: the archaeal perspective. Curr Issues Mol Biol 2:125–131. [PubMed] [Google Scholar]
- 75.Jetten MS, Niftrik L, Strous M, Kartal B, Keltjens JT, Op den Camp HJ. 2009. Biochemistry and molecular biology of anammox bacteria. Crit Rev Biochem Mol Biol 44:65–84. 10.1080/10409230902722783. [DOI] [PubMed] [Google Scholar]
- 76.Zehr JP. 2011. Nitrogen fixation by marine cyanobacteria. Trends Microbiol 19:162–173. 10.1016/j.tim.2010.12.004. [DOI] [PubMed] [Google Scholar]
- 77.Gtari M, Ghodhbane-Gtari F, Nouioui I, Beauchemin N, Tisa LS. 2012. Phylogenetic perspectives of nitrogen-fixing actinobacteria. Arch Microbiol 194:3–11. 10.1007/s00203-011-0733-6. [DOI] [PubMed] [Google Scholar]
- 78.Chan Y, Van Nostrand JD, Zhou J, Pointing SB, Farrell RL. 2013. Functional ecology of an Antarctic dry valley. Proc Natl Acad Sci USA 110:8990–8995. 10.1073/pnas.1300643110. [DOI] [PMC free article] [PubMed] [Google Scholar]
- 79.Gunnigle E, Ramond JB, Frossard A, Seeley M, Cowan D. 2014. A sequential co-extraction method for DNA, RNA and protein recovery from soil for future system-based approaches. J Microbiol Methods 103:118–123. 10.1016/j.mimet.2014.06.004. [DOI] [PubMed] [Google Scholar]
- 80.Pandit AS, Joshi MN, Bhargava P, Shaikh I, Ayachit GN, Raj SR, Saxena AK, Bagatharia SB. 2015. A snapshot of microbial communities from the Kutch: one of the largest salt deserts in the World. Extremophiles 19:973–987. 10.1007/s00792-015-0772-z. [DOI] [PubMed] [Google Scholar]
- 81.Ronca S, Ramond JB, Jones BE, Seely M, Cowan DA. 2015. Namib Desert dune/interdune transects exhibit habitat-specific edaphic bacterial communities. Front Microbiol 6:845. 10.3389/fmicb.2015.00845. [DOI] [PMC free article] [PubMed] [Google Scholar]
- 82.McCann CM, Wade MJ, Gray ND, Roberts JA, Hubert CR, Graham DW. 2016. Microbial communities in a High Arctic polar desert landscape. Front Microbiol 7:419. 10.3389/fmicb.2016.00419. [DOI] [PMC free article] [PubMed] [Google Scholar]
- 83.Wei ST, Lacap-Bugler DC, Lau MC, Caruso T, Rao S, de Los Rios A, Archer SK, Chiu JM, Higgins C, Van Nostrand JD, Zhou J, Hopkins DW, Pointing SB. 2016. Taxonomic and functional diversity of soil and hypolithic microbial communities in Miers Valley, McMurdo Dry Valleys, Antarctica. Front Microbiol 7:1642. 10.3389/fmicb.2016.01642. [DOI] [PMC free article] [PubMed] [Google Scholar]
- 84.Meslier V, Casero MC, Dailey M, Wierzchos J, Ascaso C, Artieda O, McCullough PR, DiRuggiero J. 2018. Fundamental drivers for endolithic microbial community assemblies in the hyperarid Atacama Desert. Environ Microbiol 20:1765–1781. 10.1111/1462-2920.14106. [DOI] [PubMed] [Google Scholar]
- 85.Aranibar JN, Anderson IC, Ringrose S, Macko SA. 2003. Importance of nitrogen fixation in soil crusts of southern African arid ecosystems: acetylene reduction and stable isotope studies. J Arid Environ 54:345–358. 10.1006/jare.2002.1094. [DOI] [Google Scholar]
- 86.Miao L, Feng W, Zhang Y, Bai Y, Sun Y, She W, Mao H, Lai Z, Qin S. 2020. Chemoheterotrophic diazotrophs contribute to nitrogen incorporation in a semi-arid desert. Biol Fertil Soils 56:1165–1176. 10.1007/s00374-020-01492-7. [DOI] [Google Scholar]
- 87.Adams DG. 2000. Heterocyst formation in cyanobacteria. Curr Opin Microbiol 3:618–624. 10.1016/s1369-5274(00)00150-8. [DOI] [PubMed] [Google Scholar]
- 88.Banerjee M, Verma V. 2009. Nitrogen fixation in endolithic cyanobacterial communities of the McMurdo Dry Valley, Antarctica. ScienceAsia 35:215–219. 10.2306/scienceasia1513-1874.2009.35.215. [DOI] [Google Scholar]
- 89.Heimann K, Cirés S. 2015. N2-fixing cyanobacteria: ecology and biotechnological application, p 501–515. In Kim S-K (ed), Handbook of marine microalgae. Academic Press, New York, NY. 10.1016/B978-0-12-800776-1.00033-9. [DOI] [Google Scholar]
- 90.Bergman B, Gallon JR, Rai AN, Stal LJ. 1997. N2 fixation by non-heterocystous cyanobacteria. FEMS Microbiol Rev 19:139–185. 10.1016/S0168-6445(96)00028-9. [DOI] [Google Scholar]
- 91.Belnap J. 2002. Nitrogen fixation in biological soil crusts from southeast Utah, USA. Biol Fert Soils 35:128–135. 10.1007/s00374-002-0452-x. [DOI] [Google Scholar]
- 92.Pointing SB. 2016. Hypolithic communities, p 199–213. In Weber B, Büdel B, Belnap J (ed), Biological soil crusts: an organizing principle in drylands ecological studies (analysis and synthesis), vol 226. Springer, Cham, Switzerland. [Google Scholar]
- 93.Sakrouhi I, Belfquih M, Sbabou L, Moulin P, Bena G, Filali-Maltouf A, Le Quere A. 2016. Recovery of symbiotic nitrogen fixing acacia rhizobia from Merzouga Desert sand dunes in South East Morocco—identification of a probable new species of Ensifer adapted to stressed environments. Syst Appl Microbiol 39:122–131. 10.1016/j.syapm.2016.01.001. [DOI] [PubMed] [Google Scholar]
- 94.Lange O, Belnap J, Reichenberger H. 1998. Photosynthesis of the cyanobacterial soil-crust lichen Collema tenax from arid lands in southern Utah, USA: role of water content on light and temperature responses of CO2 exchange. Funct Ecol 12:195–202. 10.1046/j.1365-2435.1998.00192.x. [DOI] [Google Scholar]
- 95.Schultz M, Zedda L, Rambold G. 2009. New records of lichen taxa from Namibia and South Africa. Bibl Lichenol 99:315–334. [Google Scholar]
- 96.Büdel B, Vivas M, Lange OL. 2013. Lichen species dominance and the resulting photosynthetic behavior of Sonoran Desert soil crust types (Baja California, Mexico). Ecol Process 2:6. 10.1186/2192-1709-2-6. [DOI] [Google Scholar]
- 97.Rikkinen J. 2015. Cyanolichens. Biodivers Conserv 24:973–993. 10.1007/s10531-015-0906-8. [DOI] [Google Scholar]
- 98.Torres-Cruz TJ, Howell AJ, Reibold RH, McHugh TA, Eickhoff MA, Reed SC. 2018. Species-specific nitrogenase activity in lichen-dominated biological soil crusts from the Colorado Plateau, USA. Plant Soil 429:113–125. 10.1007/s11104-018-3580-2. [DOI] [Google Scholar]
- 99.Belnap J, Büdel B, Lange OL. 2001. Biological soil crusts: characteristics and distribution, p 3–30. In Belnap J, Lange OL (ed), Biological soil crusts: structure, function, and management ecological studies (analysis and synthesis), vol 150. Springer, Berlin, Germany. [Google Scholar]
- 100.Belnap J. 2003. The world at your feet: desert biological soil crusts. Front Ecol Environ 1:181–189. 10.1890/1540-9295(2003)001[0181:TWAYFD]2.0.CO;2. [DOI] [Google Scholar]
- 101.Pepe-Ranney C, Koechli C, Potrafka R, Andam C, Eggleston E, Garcia-Pichel F, Buckley DH. 2016. Non-cyanobacterial diazotrophs mediate dinitrogen fixation in biological soil crusts during early crust formation. ISME J 10:287–298. 10.1038/ismej.2015.106. [DOI] [PMC free article] [PubMed] [Google Scholar]
- 102.Sroga GE. 1997. Regulation of nitrogen fixation by different nitrogen sources in the filamentous non-heterocystous cyanobacterium Microcoleus sp. FEMS Microbiol Lett 153:11–15. 10.1111/j.1574-6968.1997.tb10457.x. [DOI] [PubMed] [Google Scholar]
- 103.Yeager CM, Kornosky JL, Morgan RE, Cain EC, Garcia-Pichel F, Housman DC, Belnap J, Kuske CR. 2007. Three distinct clades of cultured heterocystous cyanobacteria constitute the dominant N2-fixing members of biological soil crusts of the Colorado Plateau, USA. FEMS Microbiol Ecol 60:85–97. 10.1111/j.1574-6941.2006.00265.x. [DOI] [PubMed] [Google Scholar]
- 104.Abed RM, Al Kharusi S, Schramm A, Robinson MD. 2010. Bacterial diversity, pigments and nitrogen fixation of biological desert crusts from the Sultanate of Oman. FEMS Microbiol Ecol 72:418–428. 10.1111/j.1574-6941.2010.00854.x. [DOI] [PubMed] [Google Scholar]
- 105.Mogul R, Vaishampayan P, Bashir M, McKay CP, Schubert K, Bornaccorsi R, Gomez E, Tharayil S, Payton G, Capra J, Andaya J, Bacon L, Bargoma E, Black D, Boos K, Brant M, Chabot M, Chau D, Cisneros J, Chu G, Curnutt J, DiMizio J, Engelbrecht C, Gott C, Harnoto R, Hovanesian R, Johnson S, Lavergne B, Martinez G, Mans P, Morales E, Oei A, Peplow G, Piaget R, Ponce N, Renteria E, Rodriguez V, Rodriguez J, Santander M, Sarmiento K, Scheppelmann A, Schroter G, Sexton D, Stephenson J, Symer K, Russo-Tait T, Weigel B, Wilhelm MB. 2017. Microbial community and biochemical dynamics of biological soil crusts across a gradient of surface coverage in the Central Mojave Desert. Front Microbiol 8:1974. 10.3389/fmicb.2017.01974. [DOI] [PMC free article] [PubMed] [Google Scholar]
- 106.Yeager CM, Kornosky JL, Housman DC, Grote EE, Belnap J, Kuske CR. 2004. Diazotrophic community structure and function in two successional stages of biological soil crusts from the Colorado Plateau and Chihuahuan Desert. Appl Environ Microbiol 70:973–983. 10.1128/AEM.70.2.973-983.2004. [DOI] [PMC free article] [PubMed] [Google Scholar]
- 107.Nagy ML, Perez A, Garcia-Pichel F. 2005. The prokaryotic diversity of biological soil crusts in the Sonoran Desert (Organ Pipe Cactus National Monument, AZ). FEMS Microbiol Ecol 54:233–245. 10.1016/j.femsec.2005.03.011. [DOI] [PubMed] [Google Scholar]
- 108.Elbert W, Weber B, Burrows S, Steinkamp J, Budel B, Andreae MO, Poschl U. 2012. Contribution of cryptogamic covers to the global cycles of carbon and nitrogen. Nat Geosci 5:459–462. 10.1038/ngeo1486. [DOI] [Google Scholar]
- 109.Elbert W, Weber B, Büdel B, Andreae MO, Pöschl U. 2009. Microbiotic crusts on soil, rock and plants: neglected major players in the global cycles of carbon and nitrogen? Biogeosci Discuss 6:6983–7015. [Google Scholar]
- 110.Wu N, Zhang YM, Downing A. 2009. Comparative study of nitrogenase activity in different types of biological soil crusts in the Gurbantunggut Desert, Northwestern China. J Arid Environ 73:828–833. 10.1016/j.jaridenv.2009.04.002. [DOI] [Google Scholar]
- 111.Su Y-G, Zhao X, Li A-X, Li X-R, Huang G. 2011. Nitrogen fixation in biological soil crusts from the Tengger Desert, northern China. Eur J Soil Biol 47:182–187. 10.1016/j.ejsobi.2011.04.001. [DOI] [Google Scholar]
- 112.Friedmann EI, Kibler AP. 1980. Nitrogen economy of endolithic microbial communities in hot and cold deserts. Microb Ecol 6:95–108. 10.1007/BF02010548. [DOI] [PubMed] [Google Scholar]
- 113.Dong H, Rech JA, Jiang H, Sun H, Buck BJ. 2007. Endolithic cyanobacteria in soil gypsum: occurrences in Atacama (Chile), Mojave (United States), and Al‐Jafr Basin (Jordan) Deserts. J Geophys Res Biogeosci 112:G02030. [Google Scholar]
- 114.Pointing SB, Warren-Rhodes KA, Lacap DC, Rhodes KL, McKay CP. 2007. Hypolithic community shifts occur as a result of liquid water availability along environmental gradients in China's hot and cold hyperarid deserts. Environ Microbiol 9:414–424. 10.1111/j.1462-2920.2006.01153.x. [DOI] [PubMed] [Google Scholar]
- 115.Wierzchos J, de los Rios A, Ascaso C. 2012. Microorganisms in desert rocks: the edge of life on Earth. Int Microbiol 15:173–183. 10.2436/20.1501.01.170. [DOI] [PubMed] [Google Scholar]
- 116.Qu EB, Omelon CR, Oren A, Meslier V, Cowan DA, Maggs-Kolling G, DiRuggiero J. 2019. Trophic selective pressures organize the composition of endolithic microbial communities from global deserts. Front Microbiol 10:2952. 10.3389/fmicb.2019.02952. [DOI] [PMC free article] [PubMed] [Google Scholar]
- 117.Van Goethem MW, Makhalanyane TP, Cowan DA, Valverde A. 2017. Cyanobacteria and Alphaproteobacteria may facilitate cooperative interactions in niche communities. Front Microbiol 8:2099. 10.3389/fmicb.2017.02099. [DOI] [PMC free article] [PubMed] [Google Scholar]
- 118.Warren-Rhodes KA, McKay CP, Boyle LN, Wing MR, Kiekebusch EM, Cowan DA, Stomeo F, Pointing SB, Kaseke KF, Eckardt F, Henschel JR, Anisfeld A, Seely M, Rhodes KL. 2013. Physical ecology of hypolithic communities in the central Namib Desert: the role of fog, rain, rock habitat, and light. J Geophys Res Biogeosci 118:1451–1460. 10.1002/jgrg.20117. [DOI] [Google Scholar]
- 119.Finstad KM, Probst AJ, Thomas BC, Andersen GL, Demergasso C, Echeverria A, Amundson RG, Banfield JF. 2017. Microbial community structure and the persistence of cyanobacterial populations in salt crusts of the hyperarid Atacama Desert from genome-resolved metagenomics. Front Microbiol 8:1435. 10.3389/fmicb.2017.01435. [DOI] [PMC free article] [PubMed] [Google Scholar]
- 120.Van Goethem MW, Vikram S, Hopkins DW, Hall G, Woodborne S, Aspray TJ, Hogg ID, Cowan DA, Makhalanyane TP. 2020. Nutrient parsimony shapes diversity and functionality in hyper-oligotrophic Antarctic soils. bioRxiv 10.1101/2020.02.15.950717. [DOI]
- 121.Herman RP, Provencio KR, Herrera-Matos J, Torrez RJ. 1995. Resource islands predict the distribution of heterotrophic bacteria in Chihuahuan Desert soils. Appl Environ Microbiol 61:1816–1821. 10.1128/aem.61.5.1816-1821.1995. [DOI] [PMC free article] [PubMed] [Google Scholar]
- 122.Xu L, Zeng XC, Nie Y, Luo X, Zhou E, Zhou L, Pan Y, Li W. 2014. Pontibacter diazotrophicus sp. nov., a novel nitrogen-fixing bacterium of the family Cytophagaceae. PLoS One 9:e92294. 10.1371/journal.pone.0092294. [DOI] [PMC free article] [PubMed] [Google Scholar]
- 123.Gunnigle E, Frossard A, Ramond JB, Guerrero L, Seely M, Cowan DA. 2017. Diel-scale temporal dynamics recorded for bacterial groups in Namib Desert soil. Sci Rep 7:40189. 10.1038/srep40189. [DOI] [PMC free article] [PubMed] [Google Scholar]
- 124.Leon-Sobrino C, Ramond JB, Maggs-Kolling G, Cowan DA. 2019. Nutrient acquisition, rather than stress response over diel cycles, drives microbial transcription in a hyper-arid Namib Desert soil. Front Microbiol 10:1054. 10.3389/fmicb.2019.01054. [DOI] [PMC free article] [PubMed] [Google Scholar]
- 125.Jordaan K, Lappan R, Dong X, Aitkenhead IJ, Bay SK, Chiri E, Wieler N, Meredith LK, Cowan DA, Chown SL, Greening C. 2020. Hydrogen-oxidizing bacteria are abundant in desert soils and strongly stimulated by hydration. mSystems 5:e01131-20. 10.1128/mSystems.01131-20. [DOI] [PMC free article] [PubMed] [Google Scholar]
- 126.Franklin KA, Sommers PN, Aslan CE, López BR, Bronstein JL, Bustamante E, Búrquez A, Medellín RA, Marazzi B. 2016. Plant biotic interactions in the Sonoran Desert: current knowledge and future research perspectives. Int J Plant Sci 177:217–234. 10.1086/684261. [DOI] [Google Scholar]
- 127.Bergmann D, Zehfus M, Zierer L, Smith B, Gabel M. 2009. Grass rhizosheaths: associated bacterial communities and potential for nitrogen fixation. West N Am Nat 69:105–114. 10.3398/064.069.0102. [DOI] [Google Scholar]
- 128.Hanna AL, Youssef HH, Amer WM, Monib M, Fayez M, Hegazi NA. 2013. Diversity of bacteria nesting the plant cover of north Sinai deserts, Egypt. J Adv Res 4:13–26. 10.1016/j.jare.2011.11.003. [DOI] [PMC free article] [PubMed] [Google Scholar]
- 129.Hartley AE, Schlesinger WH. 2000. Environmental controls on nitric oxide emission from northern Chihuahuan desert soils. Biogeochemistry 50:279–300. 10.1023/A:1006377832207. [DOI] [Google Scholar]
- 130.Hartley AE, Schlesinger WH. 2002. Potential environmental controls on nitrogenase activity in biological crusts of the northern Chihuahuan Desert. J Arid Environ 52:293–304. 10.1006/jare.2002.1007. [DOI] [Google Scholar]
- 131.Zhou X, Smith H, Giraldo Silva A, Belnap J, Garcia-Pichel F. 2016. Differential responses of dinitrogen fixation, diazotrophic cyanobacteria and ammonia oxidation reveal a potential warming-induced imbalance of the N-cycle in biological soil crusts. PLoS One 11:e0164932. 10.1371/journal.pone.0164932. [DOI] [PMC free article] [PubMed] [Google Scholar]
- 132.Jeffries DL, Klopatek JM, Link SO, Bolton H. 1992. Acetylene reduction by cryptogamic crusts from a blackbrush community as related to resaturation and dehydration. Soil Biol Biochem 24:1101–1105. 10.1016/0038-0717(92)90059-7. [DOI] [Google Scholar]
- 133.Malam Issa O, Stal LJ, Défarge C, Couté A, Trichet J. 2001. Nitrogen fixation by microbial crusts from desiccated Sahelian soils (Niger). Soil Biol Biochem 33:1425–1428. 10.1016/S0038-0717(01)00046-3. [DOI] [Google Scholar]
- 134.Wierenga PJ, Hendrickx JMH, Nash MH, Ludwig JA, Daugherty LA. 1987. Variation of soil and vegetation with distance along a transect in the Chihuahuan Desert. J Arid Environ 13:53–63. 10.1016/S0140-1963(18)31153-4. [DOI] [Google Scholar]
- 135.Billings SA, Schaeffer SM, Evans RD. 2003. Nitrogen fixation by biological soil crusts and heterotrophic bacteria in an intact Mojave Desert ecosystem with elevated CO2 and added soil carbon. Soil Biol Biochem 35:643–649. 10.1016/S0038-0717(03)00011-7. [DOI] [Google Scholar]
- 136.Belnap J, Welter JR, Grimm NB, Barger N, Ludwig JA. 2005. Linkages between microbial and hydrologic processes in arid and semiarid watersheds. Ecology 86:298–307. 10.1890/03-0567. [DOI] [Google Scholar]
- 137.Englund B, Meyerson H. 1974. In situ measurement of nitrogen fixation at low temperatures. Oikos 25:283–287. 10.2307/3543946. [DOI] [Google Scholar]
- 138.Bosch J, Marais E, Maggs-Kölling G, Ramond JB, Lebre PH, Eckardt FD, Cowan DA. Water inputs across the Namib Desert: implications for dryland edaphic microbiology. Frontiers of Biogeography. In press. [Google Scholar]
- 139.IPCC. 2014. Climate change 2014: synthesis report. Contribution of Working Groups I, II and III to the Fifth Assessment Report of the Intergovernmental Panel on Climate Change. IPCC, Geneva, Switzerland. [Google Scholar]
- 140.Jacobson K, van Diepeningen A, Evans S, Fritts R, Gemmel P, Marsho C, Seely M, Wenndt A, Yang X, Jacobson P. 2015. Non-rainfall moisture activates fungal decomposition of surface litter in the Namib Sand Sea. PLoS One 10:e0126977. 10.1371/journal.pone.0126977. [DOI] [PMC free article] [PubMed] [Google Scholar]
- 141.Yang WH, Ryals RA, Cusack DF, Silver WL. 2017. Cross-biome assessment of gross soil nitrogen cycling in California ecosystems. Soil Biol Biochem 107:144–155. 10.1016/j.soilbio.2017.01.004. [DOI] [Google Scholar]
- 142.Bell CW, Acosta-Martinez V, McIntyre NE, Cox S, Tissue DT, Zak JC. 2009. Linking microbial community structure and function to seasonal differences in soil moisture and temperature in a Chihuahuan desert grassland. Microb Ecol 58:827–842. 10.1007/s00248-009-9529-5. [DOI] [PubMed] [Google Scholar]
- 143.Frossard A, Ramond JB, Seely M, Cowan DA. 2015. Water regime history drives responses of soil Namib Desert microbial communities to wetting events. Sci Rep 5:12263. 10.1038/srep12263. [DOI] [PMC free article] [PubMed] [Google Scholar]
- 144.Ladwig LM, Sinsabaugh RL, Collins SL, Thomey ML. 2015. Soil enzyme responses to varying rainfall regimes in Chihuahuan Desert soils. Ecosphere 6:40. 10.1890/ES14-00258.1. [DOI] [Google Scholar]
- 145.Scola V, Ramond JB, Frossard A, Zablocki O, Adriaenssens EM, Johnson RM, Seely M, Cowan DA. 2018. Namib Desert soil microbial community diversity, assembly, and function along a natural xeric gradient. Microb Ecol 75:193–203. 10.1007/s00248-017-1009-8. [DOI] [PubMed] [Google Scholar]
- 146.Barnard S, Van Goethem MW, de Scally SZ, Cowan DA, van Rensburg PJ, Claassens S, Makhalanyane TP. 2020. Increased temperatures alter viable microbial biomass, ammonia oxidizing bacteria and extracellular enzymatic activities in Antarctic soils. FEMS Microbiol Ecol 96:fiaa065. 10.1093/femsec/fiaa065. [DOI] [PubMed] [Google Scholar]
- 147.Pandey CB, Kumar U, Kaviraj M, Minick KJ, Mishra AK, Singh JS. 2020. DNRA: A short-circuit in biological N-cycling to conserve nitrogen in terrestrial ecosystems. Sci Total Environ 738:139710. 10.1016/j.scitotenv.2020.139710. [DOI] [PubMed] [Google Scholar]
- 148.Rütting T, Boeckx P, Müller C, Klemedtsson L. 2011. Assessment of the importance of dissimilatory nitrate reduction to ammonium for the terrestrial nitrogen cycle. Biogeosciences 8:1779–1791. 10.5194/bg-8-1779-2011. [DOI] [Google Scholar]
- 149.Hu S, Zeng RJ, Haroon MF, Keller J, Lant PA, Tyson GW, Yuan Z. 2015. A laboratory investigation of interactions between denitrifying anaerobic methane oxidation (DAMO) and anammox processes in anoxic environments. Sci Rep 5:8706. 10.1038/srep08706. [DOI] [PMC free article] [PubMed] [Google Scholar]
- 150.Schmidt EL. 1982. Nitrification in soil, p 253–288. In Stevenson FJ (ed), Nitrogen in agricultural soils, vol 22. American Society of Agronomy, Madison, WI. [Google Scholar]
- 151.Walworth J. 2013. Nitrogen in soil and the environment. College of Agriculture and Life Sciences Cooperative Extension, The University of Arizona, Tucson, AZ. [Google Scholar]
- 152.Norton J, Ouyang Y. 2019. Controls and adaptive management of nitrification in agricultural soils. Front Microbiol 10:1931. 10.3389/fmicb.2019.01931. [DOI] [PMC free article] [PubMed] [Google Scholar]
- 153.Sahrawat KL. 2008. Factors affecting nitrification in soils. Commun Soil Sci Plan 39:1436–1446. 10.1080/00103620802004235. [DOI] [Google Scholar]
- 154.Stein L. 2011. Heterotrophic nitrification and nitrifier denitrification, p 95–114. In Ward B, Arp D, Klotz M (ed), Nitrification. ASM Press, Washington, DC. 10.1128/9781555817145.ch5. [DOI] [Google Scholar]
- 155.Kuypers MMM, Marchant HK, Kartal B. 2018. The microbial nitrogen-cycling network. Nat Rev Microbiol 16:263–276. 10.1038/nrmicro.2018.9. [DOI] [PubMed] [Google Scholar]
- 156.Angel R, Conrad R. 2009. In situ measurement of methane fluxes and analysis of transcribed particulate methane monooxygenase in desert soils. Environ Microbiol 11:2598–2610. 10.1111/j.1462-2920.2009.01984.x. [DOI] [PubMed] [Google Scholar]
- 157.Caranto JD, Lancaster KM. 2017. Nitric oxide is an obligate bacterial nitrification intermediate produced by hydroxylamine oxidoreductase. Proc Natl Acad Sci USA 114:8217–8222. 10.1073/pnas.1704504114. [DOI] [PMC free article] [PubMed] [Google Scholar]
- 158.Nejidat A. 2005. Nitrification and occurrence of salt-tolerant nitrifying bacteria in the Negev Desert soils. FEMS Microbiol Ecol 52:21–29. 10.1016/j.femsec.2004.10.011. [DOI] [PubMed] [Google Scholar]
- 159.Orlando J, Alfaro M, Bravo L, Guevara R, Carú M. 2010. Bacterial diversity and occurrence of ammonia-oxidizing bacteria in the Atacama Desert soil during a “desert bloom” event. Soil Biol Biochem 42:1183–1188. 10.1016/j.soilbio.2010.03.025. [DOI] [Google Scholar]
- 160.Sher Y, Zaady E, Nejidat A. 2013. Spatial and temporal diversity and abundance of ammonia oxidizers in semi-arid and arid soils: indications for a differential seasonal effect on archaeal and bacterial ammonia oxidizers. FEMS Microbiol Ecol 86:544–556. 10.1111/1574-6941.12180. [DOI] [PubMed] [Google Scholar]
- 161.Prosser JI, Nicol GW. 2008. Relative contributions of archaea and bacteria to aerobic ammonia oxidation in the environment. Environ Microbiol 10:2931–2941. 10.1111/j.1462-2920.2008.01775.x. [DOI] [PubMed] [Google Scholar]
- 162.Neilson JW, Quade J, Ortiz M, Nelson WM, Legatzki A, Tian F, LaComb M, Betancourt JL, Wing RA, Soderlund CA, Maier RM. 2012. Life at the hyperarid margin: novel bacterial diversity in arid soils of the Atacama Desert, Chile. Extremophiles 16:553–566. 10.1007/s00792-012-0454-z. [DOI] [PubMed] [Google Scholar]
- 163.Abed RM, Lam P, de Beer D, Stief P. 2013. High rates of denitrification and nitrous oxide emission in arid biological soil crusts from the Sultanate of Oman. ISME J 7:1862–1875. 10.1038/ismej.2013.55. [DOI] [PMC free article] [PubMed] [Google Scholar]
- 164.Sher Y, Ronen Z, Nejidat A. 2016. Differential response of ammonia-oxidizing archaea and bacteria to the wetting of salty arid soil. J Basic Microbiol 56:900–906. 10.1002/jobm.201600035. [DOI] [PubMed] [Google Scholar]
- 165.Magalhaes CM, Machado A, Frank-Fahle B, Lee CK, Cary SC. 2014. The ecological dichotomy of ammonia-oxidizing archaea and bacteria in the hyper-arid soils of the Antarctic Dry Valleys. Front Microbiol 5:515. 10.3389/fmicb.2014.00515. [DOI] [PMC free article] [PubMed] [Google Scholar]
- 166.Marusenko Y, Garcia-Pichel F, Hall SJ. 2015. Ammonia-oxidizing archaea respond positively to inorganic nitrogen addition in desert soils. FEMS Microbiol Ecol 91:1–11. 10.1093/femsec/fiu023. [DOI] [PubMed] [Google Scholar]
- 167.Armstrong A, Valverde A, Ramond JB, Makhalanyane TP, Jansson JK, Hopkins DW, Aspray TJ, Seely M, Trindade MI, Cowan DA. 2016. Temporal dynamics of hot desert microbial communities reveal structural and functional responses to water input. Sci Rep 6:34434. 10.1038/srep34434. [DOI] [PMC free article] [PubMed] [Google Scholar]
- 168.van der Walt AJ, Johnson RM, Cowan DA, Seely M, Ramond JB. 2016. Unique microbial phylotypes in Namib Desert dune and gravel plain fairy circle soils. Appl Environ Microbiol 82:4592–4601. 10.1128/AEM.00844-16. [DOI] [PMC free article] [PubMed] [Google Scholar]
- 169.Leininger S, Urich T, Schloter M, Schwark L, Qi J, Nicol GW, Prosser JI, Schuster SC, Schleper C. 2006. Archaea predominate among ammonia-oxidizing prokaryotes in soils. Nature 442:806–809. 10.1038/nature04983. [DOI] [PubMed] [Google Scholar]
- 170.Marusenko Y, Bates ST, Anderson I, Johnson SL, Soule T, Garcia-Pichel F. 2013. Ammonia-oxidizing archaea and bacteria are structured by geography in biological soil crusts across North American arid lands. Ecol Process 2:9. 10.1186/2192-1709-2-9. [DOI] [Google Scholar]
- 171.Liu R, Li K, Zhang H, Zhu J, Joshi D. 2014. Spatial distribution of microbial communities associated with dune landform in the Gurbantunggut Desert, China. J Microbiol 52:898–907. 10.1007/s12275-014-4075-3. [DOI] [PubMed] [Google Scholar]
- 172.Wang Z, Na R, Koziol L, Schellenberg MP, Li X, Ta N, Jin K, Wang H. 2020. Response of bacterial communities and plant-mediated soil processes to nitrogen deposition and precipitation in a desert steppe. Plant Soil 448:277–297. 10.1007/s11104-020-04424-4. [DOI] [Google Scholar]
- 173.Monteiro M, M SB, Seneca J, Torgo L, C KL, Cary SC, Magalhaes C. 2020. Understanding the response of nitrifying communities to disturbance in the McMurdo Dry Valleys, Antarctica. Microorganisms 8:404. 10.3390/microorganisms8030404. [DOI] [PMC free article] [PubMed] [Google Scholar]
- 174.Banning NC, Maccarone LD, Fisk LM, Murphy DV. 2015. Ammonia-oxidising bacteria not archaea dominate nitrification activity in semi-arid agricultural soil. Sci Rep 5:11146. 10.1038/srep11146. [DOI] [PMC free article] [PubMed] [Google Scholar]
- 175.Delgado-Baquerizo M, Maestre FT, Eldridge DJ, Singh BK. 2016. Microsite differentiation drives the abundance of soil ammonia oxidizing bacteria along aridity gradients. Front Microbiol 7:505. 10.3389/fmicb.2016.00505. [DOI] [PMC free article] [PubMed] [Google Scholar]
- 176.Chen Y, Xu Z, Hu H, Hu Y, Hao Z, Jiang Y, Chen B. 2013. Responses of ammonia-oxidizing bacteria and archaea to nitrogen fertilization and precipitation increment in a typical temperate steppe in Inner Mongolia. Appl Soil Ecol 68:36–45. 10.1016/j.apsoil.2013.03.006. [DOI] [Google Scholar]
- 177.Monib M, Hosny I, El-Hadidy TT, El-Shahawy R. 1979. Temperature adaptability of nitrifying bacteria in soils of Egypt. Zentralbl Bakteriol Naturwiss 134:528–535. 10.1016/S0323-6056(79)80076-2. [DOI] [PubMed] [Google Scholar]
- 178.Johnson SL, Budinoff CR, Belnap J, Garcia-Pichel F. 2005. Relevance of ammonium oxidation within biological soil crust communities. Environ Microbiol 7:1–12. 10.1111/j.1462-2920.2004.00649.x. [DOI] [PubMed] [Google Scholar]
- 179.Bai E, Li S, Xu W, Li W, Dai W, Jiang P. 2013. A meta-analysis of experimental warming effects on terrestrial nitrogen pools and dynamics. New Phytol 199:441–451. 10.1111/nph.12252. [DOI] [PubMed] [Google Scholar]
- 180.Delgado-Baquerizo M, Maestre FT, Escolar C, Gallardo A, Ochoa V, Gozalo B, Prado-Comesaña A. 2014. Direct and indirect impacts of climate change on microbial and biocrust communities alter the resistance of the N cycle in a semiarid grassland. J Ecol 102:1592–1605. 10.1111/1365-2745.12303. [DOI] [Google Scholar]
- 181.Lafuente A, Durán J, Delgado-Baquerizo M, Recio J, Gallardo A, Singh BK, Maestre FT. 2020. Biocrusts modulate responses of nitrous oxide and methane soil fluxes to simulated climate change in a Mediterranean dryland. Ecosystems 23:1690–1701. 10.1007/s10021-020-00497-5. [DOI] [Google Scholar]
- 182.Lafuente A, Recio J, Ochoa-Hueso R, Gallardo A, Perez-Corona ME, Manrique E, Duran J. 2020. Simulated nitrogen deposition influences soil greenhouse gas fluxes in a Mediterranean dryland. Sci Total Environ 737:139610. 10.1016/j.scitotenv.2020.139610. [DOI] [PubMed] [Google Scholar]
- 183.Martins SCS, Macdonald CA, Anderson IC, Singh BK. 2016. Feedback responses of soil greenhouse gas emissions to climate change are modulated by soil characteristics in dryland ecosystems. Soil Biol Biochem 100:21–32. 10.1016/j.soilbio.2016.05.007. [DOI] [Google Scholar]
- 184.Hu HW, Trivedi P, He JZ, Singh BK. 2017. Microbial nitrous oxide emissions in dryland ecosystems: mechanisms, microbiome and mitigation. Environ Microbiol 19:4808–4828. 10.1111/1462-2920.13795. [DOI] [PubMed] [Google Scholar]
- 185.Castillo-Monroy AP, Maestre FT, Delgado-Baquerizo M, Gallardo A. 2010. Biological soil crusts modulate nitrogen availability in semi-arid ecosystems: insights from a Mediterranean grassland. Plant Soil 333:21–34. 10.1007/s11104-009-0276-7. [DOI] [Google Scholar]
- 186.Karimi T, Stockle CO, Higgins SS, Nelson RL. 2021. Impact of climate change on greenhouse gas emissions and water balance in a dryland-cropping region with variable precipitation. J Environ Manage 287:112301. 10.1016/j.jenvman.2021.112301. [DOI] [PubMed] [Google Scholar]
- 187.Daims H, Lucker S, Wagner M. 2016. A new perspective on microbes formerly known as nitrite-oxidizing bacteria. Trends Microbiol 24:699–712. 10.1016/j.tim.2016.05.004. [DOI] [PMC free article] [PubMed] [Google Scholar]
- 188.Giguere AT, Taylor AE, Myrold DD, Mellbye BL, Sayavedra-Soto LA, Bottomley PJ. 2018. Nitrite-oxidizing activity responds to nitrite accumulation in soil. FEMS Microbiol Ecol 94:fiy008. 10.1093/femsec/fiy008. [DOI] [PubMed] [Google Scholar]
- 189.Geyer KM, Altrichter AE, Takacs-Vesbach CD, Van Horn DJ, Gooseff MN, Barrett JE. 2014. Bacterial community composition of divergent soil habitats in a polar desert. FEMS Microbiol Ecol 89:490–494. 10.1111/1574-6941.12306. [DOI] [PubMed] [Google Scholar]
- 190.Pester M, Maixner F, Berry D, Rattei T, Koch H, Lucker S, Nowka B, Richter A, Spieck E, Lebedeva E, Loy A, Wagner M, Daims H. 2014. NxrB encoding the beta subunit of nitrite oxidoreductase as functional and phylogenetic marker for nitrite-oxidizing Nitrospira. Environ Microbiol 16:3055–3071. 10.1111/1462-2920.12300. [DOI] [PubMed] [Google Scholar]
- 191.Daims H, Lebedeva EV, Pjevac P, Han P, Herbold C, Albertsen M, Jehmlich N, Palatinszky M, Vierheilig J, Bulaev A, Kirkegaard RH, von Bergen M, Rattei T, Bendinger B, Nielsen PH, Wagner M. 2015. Complete nitrification by Nitrospira bacteria. Nature 528:504–509. 10.1038/nature16461. [DOI] [PMC free article] [PubMed] [Google Scholar]
- 192.van Kessel MA, Speth DR, Albertsen M, Nielsen PH, Op den Camp HJ, Kartal B, Jetten MS, Lucker S. 2015. Complete nitrification by a single microorganism. Nature 528:555–559. 10.1038/nature16459. [DOI] [PMC free article] [PubMed] [Google Scholar]
- 193.Xia F, Wang JG, Zhu T, Zou B, Rhee SK, Quan ZX. 2018. Ubiquity and diversity of complete ammonia oxidizers (comammox). Appl Environ Microbiol 84:e01390-18. 10.1128/AEM.01390-18. [DOI] [PMC free article] [PubMed] [Google Scholar]
- 194.Kits KD, Sedlacek CJ, Lebedeva EV, Han P, Bulaev A, Pjevac P, Daebeler A, Romano S, Albertsen M, Stein LY, Daims H, Wagner M. 2017. Kinetic analysis of a complete nitrifier reveals an oligotrophic lifestyle. Nature 549:269–272. 10.1038/nature23679. [DOI] [PMC free article] [PubMed] [Google Scholar]
- 195.Russow R, Stange CF, Neue HU. 2009. Role of nitrite and nitric oxide in the processes of nitrification and denitrification in soil: results from 15N tracer experiments. Soil Biol Biochem 41:785–795. 10.1016/j.soilbio.2009.01.017. [DOI] [Google Scholar]
- 196.Han P, Wu D, Sun D, Zhao M, Wang M, Wen T, Zhang J, Hou L, Liu M, Klumper U, Zheng Y, Dong HP, Liang X, Yin G. 2021. N2O and NOy production by the comammox bacterium Nitrospira inopinata in comparison with canonical ammonia oxidizers. Water Res 190:116728. 10.1016/j.watres.2020.116728. [DOI] [PubMed] [Google Scholar]
- 197.Peterjohn WT, Schlesinger WH. 1990. Nitrogen loss from deserts in the southwestern United States. Biogeochemistry 10:67–79. 10.1007/BF00000893. [DOI] [Google Scholar]
- 198.Davidson EA, Kingerlee W. 1997. A global inventory of nitric oxide emissions from soils. Nutr Cycl Agroecosys 48:37–50. 10.1023/A:1009738715891. [DOI] [Google Scholar]
- 199.Peterjohn WT, Schlesinger WH. 1991. Factors controlling denitrification in a Chihuahuan desert ecosystem. Soil Sci Soc Am J 55:1694–1701. 10.2136/sssaj1991.03615995005500060032x. [DOI] [Google Scholar]
- 200.McCalley CK, Sparks JP. 2008. Controls over nitric oxide and ammonia emissions from Mojave Desert soils. Oecologia 156:871–881. 10.1007/s00442-008-1031-0. [DOI] [PubMed] [Google Scholar]
- 201.McCalley CK, Sparks JP. 2009. Abiotic gas formation drives nitrogen loss from a desert ecosystem. Science 326:837–840. 10.1126/science.1178984. [DOI] [PubMed] [Google Scholar]
- 202.Hall SJ, Huber D, Grimm NB. 2008. Soil N2O and NO emissions from an arid, urban ecosystem. J Geophys Res 113:G01016. [Google Scholar]
- 203.Yahdjian L, Sala O. 2010. Size of precipitation pulses controls nitrogen transformation and losses in an arid Patagonian ecosystem. Ecosystems 13:575–585. 10.1007/s10021-010-9341-6. [DOI] [Google Scholar]
- 204.Eberwein JR, Homyak PM, Carey CJ, Aronson EL, Jenerette GD. 2020. Large nitrogen oxide emission pulses from desert soils and associated microbiomes. Biogeochemistry 149:239–250. 10.1007/s10533-020-00672-9. [DOI] [Google Scholar]
- 205.Martins CS, Nazaries L, Macdonald CA, Anderson IC, Singh BK. 2015. Water availability and abundance of microbial groups are key determinants of greenhouse gas fluxes in a dryland forest ecosystem. Soil Biol Biochem 86:5–16. 10.1016/j.soilbio.2015.03.012. [DOI] [Google Scholar]
- 206.Yue P, Zuo X, Li K, Cui X, Wang S, Misselbrook T, Liu X. 2021. The driving effect of nitrogen-related functional microorganisms under water and nitrogen addition on N2O emission in a temperate desert. Sci Total Environ 772:145470. 10.1016/j.scitotenv.2021.145470. [DOI] [PubMed] [Google Scholar]
- 207.Goreau TJ, Kaplan WA, Wofsy SC, McElroy MB, Valois FW, Watson SW. 1980. Production of NO2− and N2O by nitrifying bacteria at reduced concentrations of oxygen. Appl Environ Microbiol 40:526–532. 10.1128/aem.40.3.526-532.1980. [DOI] [PMC free article] [PubMed] [Google Scholar]
- 208.Lipschultz F, Zafiriou O, Wofsy SC, McElroy MB, Valois FW, Watson SW. 1981. Production of NO and N2O by soil nitrifying bacteria. Nature 294:641–643. 10.1038/294641a0. [DOI] [Google Scholar]
- 209.Stüven R, Bock E. 2001. Nitrification and denitrification as a source for NO and NO2 production in high-strength wastewater. Water Res 35:1905–1914. 10.1016/s0043-1354(00)00471-1. [DOI] [PubMed] [Google Scholar]
- 210.Li SX, Wang ZH, Hu TT, Gao YJ, Stewart BA. 2009. Nitrogen in dryland soils of China and its management. Adv Agron 101:123–181. 10.1016/S0065-2113(08)00803-1. [DOI] [Google Scholar]
- 211.Wrage-Mönnig N, Horn MA, Well R, Müller C, Velthof G, Oenema O. 2018. The role of nitrifier denitrification in the production of nitrous oxide revisited. Soil Biol Biochem 123:A3–A16. 10.1016/j.soilbio.2018.03.020. [DOI] [Google Scholar]
- 212.Austin AT, Vivanco L. 2006. Plant litter decomposition in a semi-arid ecosystem controlled by photodegradation. Nature 442:555–558. 10.1038/nature05038. [DOI] [PubMed] [Google Scholar]
- 213.Austin AT. 2011. Has water limited our imagination for aridland biogeochemistry? Trends Ecol Evol 26:229–235. 10.1016/j.tree.2011.02.003. [DOI] [PubMed] [Google Scholar]
- 214.Ball BA, Christman MP, Hall SJ. 2019. Nutrient dynamics during photodegradation of plant litter in the Sonoran Desert. J Arid Environ 160:1–10. 10.1016/j.jaridenv.2018.09.004. [DOI] [Google Scholar]
- 215.Zhu G, Wang S, Li Y, Zhuang L, Zhao S, Wang C, Kuypers MMM, Jetten MSM, Zhu Y. 2018. Microbial pathways for nitrogen loss in an upland soil. Environ Microbiol 20:1723–1738. 10.1111/1462-2920.14098. [DOI] [PubMed] [Google Scholar]
- 216.Bouwman AF, Beusen AH, Griffioen J, Van Groenigen JW, Hefting MM, Oenema O, Van Puijenbroek PJ, Seitzinger S, Slomp CP, Stehfest E. 2013. Global trends and uncertainties in terrestrial denitrification and N(2)O emissions. Philos Trans R Soc Lond B Biol Sci 368:20130112. 10.1098/rstb.2013.0112. [DOI] [PMC free article] [PubMed] [Google Scholar]
- 217.Fowler D, Coyle M, Skiba U, Sutton MA, Cape JN, Reis S, Sheppard LJ, Jenkins A, Grizzetti B, Galloway JN, Vitousek P, Leach A, Bouwman AF, Butterbach-Bahl K, Dentener F, Stevenson D, Amann M, Voss M. 2013. The global nitrogen cycle in the twenty-first century. Philos Trans R Soc Lond B Biol Sci 368:20130164. 10.1098/rstb.2013.0164. [DOI] [PMC free article] [PubMed] [Google Scholar]
- 218.Grannas AM, Jones AE, Dibb J, Ammann M, Anastasio C, Beine HJ, Bergin M, Bottenheim J, Boxe CS, Carver G, Chen G, Crawford JH, Dominé F, Frey MM, Guzmán MI, Heard DE, Helmig D, Hoffmann MR, Honrath RE, Huey LG, Hutterli M, Jacobi HW, Klán P, Lefer B, McConnell J, Plane J, Sander R, Savarino J, Shepson PB, Simpson WR, Sodeau JR, von Glasow R, Weller R, Wolff EW, Zhu T. 2007. An overview of snow photochemistry: evidence, mechanisms and impacts. Atmos Chem Phys 7:4329–4373. 10.5194/acp-7-4329-2007. [DOI] [Google Scholar]
- 219.Herut B, Collier R, Krom MD. 2002. The role of dust in supplying nitrogen and phosphorus to the Southeast Mediterranean. Limnol Oceanogr 47:870–878. 10.4319/lo.2002.47.3.0870. [DOI] [Google Scholar]
- 220.Reche I, Ortega-Retuerta E, Romera O, Villena EP, Morales Baquero R, Casamayor EO. 2009. Effect of Saharan dust inputs on bacterial activity and community composition in Mediterranean lakes and reservoirs. Limnol Oceanogr 54:869–879. 10.4319/lo.2009.54.3.0869. [DOI] [Google Scholar]
- 221.Richon C, Dutay JC, Dulac F, Wang R, Balkanski Y, Nabat P, Aumont O, Desboeufs K, Laurent B, Guieu C, Raimbault P, Beuvier J. 2018. Modeling the impacts of atmospheric deposition of nitrogen and desert dust-derived phosphorus on nutrients and biological budgets of the Mediterranean Sea. Prog Oceanogr 163:21–39. 10.1016/j.pocean.2017.04.009. [DOI] [Google Scholar]
- 222.Samarkin VA, Madigan MT, Bowles MW, Casciotti KL, Priscu JC, McKay CP, Joye SB. 2010. Abiotic nitrous oxide emission from the hypersaline Don Juan Pond in Antarctica. Nat Geosci 3:341–344. 10.1038/ngeo847. [DOI] [Google Scholar]
- 223.Peters B, Casciotti KL, Samarkin VA, Madigan MT, Schutte CA, Joye SB. 2014. Stable isotope analyses of NO2−, NO3−, and N2O in the hypersaline ponds and soils of the McMurdo Dry Valleys, Antarctica. Geochim Cosmochim Acta 135:87–101. 10.1016/j.gca.2014.03.024. [DOI] [Google Scholar]
- 224.Homyak PM, Blankinship JC, Marchus K, Lucero DM, Sickman JO, Schimel JP. 2016. Aridity and plant uptake interact to make dryland soils hotspots for nitric oxide (NO) emissions. Proc Natl Acad Sci USA 113:E2608-16. 10.1073/pnas.1520496113. [DOI] [PMC free article] [PubMed] [Google Scholar]
- 225.Leitner S, Homyak PM, Blankinship JC, Eberwein JR, Jenerette GD, Zechmeister-Boltenstern S, Schimel JP. 2017. Linking NO and N2O emission pulses with the mobilization of mineral and organic N upon rewetting dry soils. Soil Biol Biochem 115:461–466. 10.1016/j.soilbio.2017.09.005. [DOI] [Google Scholar]
- 226.Homyak PM, Kamiyama M, Sickman JO, Schimel JP. 2017. Acidity and organic matter promote abiotic nitric oxide production in drying soils. Glob Chang Biol 23:1735–1747. 10.1111/gcb.13507. [DOI] [PubMed] [Google Scholar]
- 227.Venterea RT, Rolston DE, Cardon ZG. 2005. Effects of soil moisture, physical, and chemical characteristics on abiotic nitric oxide production. Nutr Cycl Agroecosyst 72:27–40. 10.1007/s10705-004-7351-5. [DOI] [Google Scholar]
- 228.Heil J, Vereecken H, Brüggemann N. 2016. A review of chemical reactions of nitrification intermediates and their role in nitrogen cycling and nitrogen trace gas formation in soil. Eur J Soil Sci 67:23–39. 10.1111/ejss.12306. [DOI] [Google Scholar]
- 229.Homyak PM, Allison SD, Huxman TE, Goulden ML, Treseder KK. 2017. Effects of drought manipulation on soil nitrogen cycling: a meta-analysis. J Geophys Res Biogeosci 122:3260–3272. 10.1002/2017JG004146. [DOI] [Google Scholar]
- 230.Homyak PM, Sickman JO. 2014. Influence of soil moisture on the seasonality of nitric oxide emissions from chaparral soils, Sierra Nevada, California, USA. J Arid Environ 103:46–52. 10.1016/j.jaridenv.2013.12.008. [DOI] [Google Scholar]
- 231.Henry HAL, Brizgys K, Field CB. 2008. Litter decomposition in a California annual grassland: interactions between photodegradation and litter layer thickness. Ecosystems 11:545–554. 10.1007/s10021-008-9141-4. [DOI] [Google Scholar]
- 232.Austin AT, Ballare CL. 2010. Dual role of lignin in plant litter decomposition in terrestrial ecosystems. Proc Natl Acad Sci USA 107:4618–4622. 10.1073/pnas.0909396107. [DOI] [PMC free article] [PubMed] [Google Scholar]
- 233.Schade GW, Hofmann R-M, Crutzen PJ. 1999. CO emissions from degrading plant matter. Tellus B 51:889–908. 10.1034/j.1600-0889.1999.t01-4-00003.x. [DOI] [Google Scholar]
- 234.Lin Y, King JY, Karlen S, Ralph J. 2015. Using 2D NMR spectroscopy to assess effects of UV radiation on cell wall chemistry during litter decomposition. Biogeochemistry 125:427–436. 10.1007/s10533-015-0132-1. [DOI] [Google Scholar]
- 235.Brandt LA, Bohnet C, King JY. 2009. Photochemically induced carbon dioxide production as a mechanism for carbon loss from plant litter in arid ecosystems. J Geophys Res 114:G02004. [Google Scholar]
- 236.Bloom AA, Lee-Taylor J, Madronich S, Messenger DJ, Palmer PI, Reay DS, McLeod AR. 2010. Global methane emission estimates from ultraviolet irradiation of terrestrial plant foliage. New Phytol 187:417–425. 10.1111/j.1469-8137.2010.03259.x. [DOI] [PubMed] [Google Scholar]
- 237.Foereid B, Bellarby J, Meier-Augenstein W, Kemp H. 2010. Does light exposure make plant litter more degradable? Plant Soil 333:275–285. 10.1007/s11104-010-0342-1. [DOI] [Google Scholar]
- 238.Lee H, Rahn T, Throop H. 2012. An accounting of C-based trace gas release during abiotic plant litter degradation. Glob Change Biol 18:1185–1195. 10.1111/j.1365-2486.2011.02579.x. [DOI] [Google Scholar]
- 239.Throop HL, Archer SR. 2009. Resolving the dryland decomposition conundrum: some new perspectives on potential drivers, p 171–194. In Lüttge U, Beyschlag W, Büdel B, Francis D (ed), Progress in botany, vol 70. Springer, Berlin, Germany. [Google Scholar]
- 240.Yanni SF, Suddick EC, Six J. 2015. Photodegradation effects on CO2 emissions from litter and SOM and photo-facilitation of microbial decomposition in a California grassland. Soil Biol Biochem 91:40–49. 10.1016/j.soilbio.2015.08.021. [DOI] [Google Scholar]
- 241.Barnes PW, Throop HL, Hewins DB, Abbene ML, Archer SR. 2012. Soil coverage reduces photodegradation and promotes the development of soil-microbial films on dryland leaf litter. Ecosystems 15:311–321. 10.1007/s10021-011-9511-1. [DOI] [Google Scholar]
- 242.Day TA, Zhang ET, Ruhland CT. 2007. Exposure to solar UV-B radiation accelerates mass and lignin loss of Larrea tridentata litter in the Sonoran Desert. Plant Ecol 193:185–194. 10.1007/s11258-006-9257-6. [DOI] [Google Scholar]
- 243.Austin AT, Mendez MS, Ballare CL. 2016. Photodegradation alleviates the lignin bottleneck for carbon turnover in terrestrial ecosystems. Proc Natl Acad Sci USA 113:4392–4397. 10.1073/pnas.1516157113. [DOI] [PMC free article] [PubMed] [Google Scholar]
- 244.Kirschbaum MU, Lambie SM, Zhou H. 2011. No UV enhancement of litter decomposition observed on dry samples under controlled laboratory conditions. Soil Biol Biochem 43:1300–1307. 10.1016/j.soilbio.2011.03.001. [DOI] [Google Scholar]
- 245.Smith WK, Gao W, Steltzer H, Wallenstein MD, Tree R. 2010. Moisture availability influences the effect of ultraviolet-B radiation on leaf litter decomposition. Glob Chang Biol 16:484–495. 10.1111/j.1365-2486.2009.01973.x. [DOI] [Google Scholar]
- 246.Uselman SM, Snyder KA, Blank RR, Jones TJ. 2011. UVB exposure does not accelerate rates of litter decomposition in a semi-arid riparian ecosystem. Soil Biol Biochem 43:1254–1265. 10.1016/j.soilbio.2011.02.016. [DOI] [Google Scholar]
- 247.Rutledge S, Campbell DI, Baldocchi D, Schipper LA. 2010. Photodegradation leads to increased carbon dioxide losses from terrestrial organic matter. Glob Chang Biol 16:3065–3074. [Google Scholar]
- 248.Gliksman D, Rey A, Seligmann R, Dumbur R, Sperling O, Navon Y, Haenel S, De Angelis P, Arnone JA, III, Grünzweig JM. 2017. Biotic degradation at night, abiotic degradation at day: positive feedbacks on litter decomposition in drylands. Glob Chang Biol 23:1564–1574. 10.1111/gcb.13465. [DOI] [PubMed] [Google Scholar]
- 249.Adair EC, Parton WJ, King JY, Brandt LA, Lin Y. 2017. Accounting for photodegradation dramatically improves prediction of carbon losses in dryland systems. Ecosphere 8:e01892. 10.1002/ecs2.1892. [DOI] [Google Scholar]
- 250.Almagro M, Maestre FT, Martínez-Lopez J, Valencia E, Rey A. 2015. Climate change may reduce litter decomposition while enhancing the contribution of photodegradation in dry perennial Mediterranean grasslands. Soil Biol Biochem 90:214–223. 10.1016/j.soilbio.2015.08.006. [DOI] [Google Scholar]
- 251.Barnard R, Leadley PW, Hungate BA. 2005. Global change, nitrification, and denitrification: a review. Glob Biogeochem Cycles 19:GB1007. [Google Scholar]
- 252.Seitzinger S, Harrison JA, Bohlke JK, Bouwman AF, Lowrance R, Peterson B, Tobias C, Van Drecht G. 2006. Denitrification across landscapes and waterscapes: a synthesis. Ecol Appl 16:2064–2090. 10.1890/1051-0761(2006)016[2064:DALAWA]2.0.CO;2. [DOI] [PubMed] [Google Scholar]
- 253.Wallenstein MD, Myrold DD, Firestone M, Voytek M. 2006. Environmental controls on denitrifying communities and denitrification rates: insights from molecular methods. Ecol Appl 16:2143–2152. 10.1890/1051-0761(2006)016[2143:ECODCA]2.0.CO;2. [DOI] [PubMed] [Google Scholar]
- 254.Behrendt T, Agam N, Horn MA. 2019. Microbial nitric oxide, nitrous oxide, and nitrous acid emissions from drylands, p 335–365. In D'Odorico P, Porporato A, Wilkinson Runyan C. (ed), Dryland ecohydrology Springer, Cham, Switzerland. [Google Scholar]
- 255.Lu X, Zhang L, Shen L. 2019. Meteorology and climate influences on tropospheric ozone: a review of natural sources, chemistry, and transport patterns. Curr Pollut Rep 5:238–260. 10.1007/s40726-019-00118-3. [DOI] [Google Scholar]
- 256.Ravishankara AR, Daniel JS, Portmann RW. 2009. Nitrous oxide (N2O): the dominant ozone-depleting substance emitted in the 21st century. Science 326:123–125. 10.1126/science.1176985. [DOI] [PubMed] [Google Scholar]
- 257.Jung J, Yeom J, Kim J, Han J, Lim HS, Park H, Hyun S, Park W. 2011. Change in gene abundance in the nitrogen biogeochemical cycle with temperature and nitrogen addition in Antarctic soils. Res Microbiol 162:1018–1026. 10.1016/j.resmic.2011.07.007. [DOI] [PubMed] [Google Scholar]
- 258.Orlando J, Caru M, Pommerenke B, Braker G. 2012. Diversity and activity of denitrifiers of chilean arid soil ecosystems. Front Microbiol 3:101. 10.3389/fmicb.2012.00101. [DOI] [PMC free article] [PubMed] [Google Scholar]
- 259.Ota M, Siciliano SD. 2020. Biology and carbon lability of sub-surface nutrient patches in High Arctic polar deserts drives the probability and magnitude of nitrous oxide emissions. Soil Biol Biochem 150:108001. 10.1016/j.soilbio.2020.108001. [DOI] [Google Scholar]
- 260.Zhao L, Liu Y, Wang Z, Yuan S, Qi J, Zhang W, Wang Y, Li X. 2020. Bacteria and fungi differentially contribute to carbon and nitrogen cycles during biological soil crust succession in arid ecosystems. Plant Soil 447:379–392. 10.1007/s11104-019-04391-5. [DOI] [Google Scholar]
- 261.Laughlin R, Stevens R. 2002. Evidence for fungal dominance of denitrification and codenitrification in a grassland soil. Soil Sci Soc Am J 66:1540–1548. 10.2136/sssaj2002.1540. [DOI] [Google Scholar]
- 262.Crenshaw CL, Lauber C, Sinsabaugh RL, Stavely LK. 2008. Fungal control of nitrous oxide production in semiarid grassland. Biogeochemistry 87:17–27. 10.1007/s10533-007-9165-4. [DOI] [Google Scholar]
- 263.Laughlin RJ, Rütting T, Müller C, Watson CJ, Stevens RJ. 2009. Effect of acetate on soil respiration, N2O emissions and gross N transformations related to fungi and bacteria in a grassland soil. Appl Soil Ecol 42:25–30. 10.1016/j.apsoil.2009.01.004. [DOI] [Google Scholar]
- 264.Marusenko Y, Huber DP, Hall SJ. 2013. Fungi mediate nitrous oxide production but not ammonia oxidation in arid land soils of the southwestern US. Soil Biol Biochem 63:24–36. 10.1016/j.soilbio.2013.03.018. [DOI] [Google Scholar]
- 265.Mothapo N, Chen H, Cubeta MA, Grossman JM, Fuller F, Shi W. 2015. Phylogenetic, taxonomic and functional diversity of fungal denitrifiers and associated N2O production efficacy. Soil Biol Biochem 83:160–175. 10.1016/j.soilbio.2015.02.001. [DOI] [Google Scholar]
- 266.Zumft WG, Kroneck PM. 2007. Respiratory transformation of nitrous oxide (N2O) to dinitrogen by Bacteria and Archaea. Adv Microb Physiol 52:107–227. 10.1016/S0065-2911(06)52003-X. [DOI] [PubMed] [Google Scholar]
- 267.Shaw LJ, Nicol GW, Smith Z, Fear J, Prosser JI, Baggs EM. 2006. Nitrosospira spp. can produce nitrous oxide via a nitrifier denitrification pathway. Environ Microbiol 8:214–222. 10.1111/j.1462-2920.2005.00882.x. [DOI] [PubMed] [Google Scholar]
- 268.Bartossek R, Nicol GW, Lanzen A, Klenk HP, Schleper C. 2010. Homologues of nitrite reductases in ammonia-oxidizing archaea: diversity and genomic context. Environ Microbiol 12:1075–1088. 10.1111/j.1462-2920.2010.02153.x. [DOI] [PubMed] [Google Scholar]
- 269.Zhu G, Ju X, Zhang J, Muller C, Rees RM, Thorman R, Sylvester-Bradley R. 2019. Effects of the nitrification inhibitor DMPP (3,4-dimethylpyrazole phosphate) on gross N transformation rates and N2O emissions. Biol Fertil Soils 55:603–615. 10.1007/s00374-019-01375-6. [DOI] [Google Scholar]
- 270.Bockheim JG. 1980. Properties and classification of some desert soils in coarse-textured glacial drift in the Arctic and Antarctic. Geoderma 24:45–69. 10.1016/0016-7061(80)90034-8. [DOI] [Google Scholar]
- 271.Tedrow JCF. 2005. Polar soils, p 239–249. In Hillel D (ed), Encyclopedia of soils in the environment. Academic Press, New York, NY. [Google Scholar]
- 272.Scheer C, Fuchs K, Pelster DE, Butterbach-Bahl K. 2020. Estimating global terrestrial denitrification from measured N2O:(N2O+N2) product ratios. Curr Opin Environ Sust 47:72–80. 10.1016/j.cosust.2020.07.005. [DOI] [Google Scholar]
- 273.Virginia RA, Jarrell WM, Franco-Vizcaino E. 1982. Direct measurement of denitrification in a Prosopis (Mesquite) dominated Sonoran Desert ecosystem. Oecologia 53:120–122. 10.1007/BF00377145. [DOI] [PubMed] [Google Scholar]
- 274.West NE, Skujins J. 1977. Nitrogen cycle in North-America cold-winter semi-desert ecosystems. Oecolog Plantar 12:45–53. [Google Scholar]
- 275.Barger NN. 2003. Biogeochemical cycling and N dynamics of biological soil crusts in a semi-arid ecosystem. PhD dissertation. Colorado State University, Ft. Collins, CO. [Google Scholar]
- 276.Groffman PM. 2012. Terrestrial denitrification: challenges and opportunities. Ecol Process 1:11. 10.1186/2192-1709-1-11. [DOI] [Google Scholar]
- 277.Weber B, Wu D, Tamm A, Ruckteschler N, Rodríguez-Caballero E, Steinkamp J, Meusel H, Elbert W, Behrendt T, Sörgel M, Cheng Y, Crutzen PJ, Su H, Pöschl U. 2015. Biological soil crusts accelerate the nitrogen cycle through large NO and HONO emissions in drylands. Proc Natl Acad Sci USA 112:15384–15389. 10.1073/pnas.1515818112. [DOI] [PMC free article] [PubMed] [Google Scholar]
- 278.Williams EJ, Hutchinson GL, Fehsenfeld FC. 1992. NOx and N2O emissions from soil. Global Biogeochem Cycles 6:351–388. 10.1029/92GB02124. [DOI] [Google Scholar]
- 279.Jones JB, Wagner D. 2006. Microhabitat-specific controls on soil respiration and denitrification in the Mojave Desert: the role of harvester ant nests and vegetation. West N Am Nat 66:426–433.2.0.CO;2]. 10.3398/1527-0904(2006)66[426:MCOSRA]2.0.CO;2. [DOI] [Google Scholar]
- 280.Barger NN, Castle SC, Dean GN. 2013. Denitrification from nitrogen-fixing biologically crusted soils in a cool desert environment, southeast Utah, USA. Ecol Process 2:16. 10.1186/2192-1709-2-16. [DOI] [Google Scholar]
- 281.Stewart KJ, Grogan P, Coxson DS, Siciliano SD. 2014. Topography as a key factor driving atmospheric nitrogen exchanges in arctic terrestrial ecosystems. Soil Biol Biochem 70:96–112. 10.1016/j.soilbio.2013.12.005. [DOI] [Google Scholar]
- 282.Peterjohn WT. 1991. Denitrification: enzyme content and activity in desert soils. Soil Biol Biochem 23:845–855. 10.1016/0038-0717(91)90096-3. [DOI] [Google Scholar]
- 283.Hartley AE, Barger N, Belnap J, Okin GS. 2007. Dryland ecosystems, p 271–307. In Marschner P, Rengel Z (ed), Nutrient cycling in terrestrial ecosystems soil biology, vol 10. Springer, Heidelberg, Germany. [Google Scholar]
- 284.Wertz S, Goyer C, Zebarth BJ, Burton DL, Tatti E, Chantigny MH, Filion M. 2013. Effects of temperatures near the freezing point on N2O emissions, denitrification and on the abundance and structure of nitrifying and denitrifying soil communities. FEMS Microbiol Ecol 83:242–254. 10.1111/j.1574-6941.2012.01468.x. [DOI] [PubMed] [Google Scholar]
- 285.Canion A, Overholt WA, Kostka JE, Huettel M, Lavik G, Kuypers MM. 2014. Temperature response of denitrification and anaerobic ammonium oxidation rates and microbial community structure in Arctic fjord sediments. Environ Microbiol 16:3331–3344. 10.1111/1462-2920.12593. [DOI] [PubMed] [Google Scholar]
- 286.Altshuler I, Ronholm J, Layton A, Onstott TC, Wg C, Whyte LG. 2019. Denitrifiers, nitrogen-fixing bacteria and N2O soil gas flux in high Arctic ice-wedge polygon cryosols. FEMS Microbiol Ecol 95:fiz049. 10.1093/femsec/fiz049. [DOI] [PubMed] [Google Scholar]
- 287.Ji B, Yang K, Zhu L, Jiang Y, Wang H, Zhou J, Zhang H. 2015. Aerobic denitrification: a review of important advances of the last 30 years. Biotechnol Bioprocess Eng 20:643–651. 10.1007/s12257-015-0009-0. [DOI] [Google Scholar]
- 288.Cao S, Du R, Zhou Y. 2020. Coupling anammox with heterotrophic denitrification for enhanced nitrogen removal: a review. Crit Rev Env Sci Technol 51:2260–2293. [Google Scholar]
- 289.Zaady E, Groffman PM, Standing D, Shachak M. 2013. High N2O emissions in dry ecosystems. Eur J Soil Biol 59:1–7. 10.1016/j.ejsobi.2013.08.004. [DOI] [Google Scholar]
- 290.Huang G, Li Y, Su YG. 2015. Effects of increasing precipitation on soil microbial community composition and soil respiration in a temperate desert, Northwestern China. Soil Biol Biochem 83:52–56. 10.1016/j.soilbio.2015.01.007. [DOI] [Google Scholar]
- 291.Li XJ, Zhao Y, Yang HT, Zhang P, Gao YP. 2018. Soil respiration of biologically-crusted soils in response to simulated precipitation pulses in the Tengger Desert, Northern China. Pedosphere 28:103–113. 10.1016/S1002-0160(17)60307-2. [DOI] [Google Scholar]
- 292.Throop HL, Seely MK, Marufu VJ, Summer Drylands Program Participants. 2020. Multiple scales of spatial heterogeneity control soil respiration responses to precipitation across a dryland rainfall gradient. Plant Soil 453:423–443. 10.1007/s11104-020-04614-0. [DOI] [Google Scholar]
- 293.Schimel J, Balser TC, Wallenstein M. 2007. Microbial stress-response physiology and its implications for ecosystem function. Ecology 88:1386–1394. 10.1890/06-0219. [DOI] [PubMed] [Google Scholar]
- 294.Schaeffer SM, Billings SA, Evans RD. 2003. Responses of soil nitrogen dynamics in a Mojave Desert ecosystem to manipulations in soil carbon and nitrogen availability. Oecologia 134:547–553. 10.1007/s00442-002-1130-2. [DOI] [PubMed] [Google Scholar]
- 295.Chen S, Wang F, Zhang Y, Qin S, Wei S, Wang S, Hu C, Liu B. 2018. Organic carbon availability limiting microbial denitrification in the deep vadose zone. Environ Microbiol 20:980–992. 10.1111/1462-2920.14027. [DOI] [PubMed] [Google Scholar]
- 296.Garcia-Montiel DC, Melillo JM, Steudler PA, Cerri CC, Piccolo MC. 2003. Carbon limitations to nitrous oxide emissions in a humid tropical forest of the Brazilian Amazon. Biol Fertil Soils 38:267–272. 10.1007/s00374-003-0637-y. [DOI] [Google Scholar]
- 297.Gillam KM, Zebarth BJ, Burton DL. 2008. Nitrous oxide emissions from denitrification and the partitioning of gaseous losses as affected by nitrate and carbon addition and soil aeration. Can J Soil Sci 88:133–143. 10.4141/CJSS06005. [DOI] [Google Scholar]
- 298.Paré MC. 2011. Organic matter quality in cryosols: effect on soil nitrogen dynamics and greenhouse gas emissions. University of Saskatchewan, Saskatoon, SK, Canada. [Google Scholar]
- 299.Schaeffer SM, Billings SA, Evans RD. 2007. Laboratory incubations reveal potential responses of soil nitrogen cycling to changes in soil C and N availability in Mojave Desert soils exposed to elevated atmospheric CO2. Glob Change Biol 13:854–865. 10.1111/j.1365-2486.2007.01324.x. [DOI] [Google Scholar]
- 300.Šimek M, Jíšová L, Hopkins DW. 2002. What is the so-called optimum pH for denitrification in soil? Soil Biol Biochem 34:1227–1234. 10.1016/S0038-0717(02)00059-7. [DOI] [Google Scholar]
- 301.Šimek M, Cooper JE. 2002. The influence of soil pH on denitrification: progress towards the understanding of this interaction over the last 50 years. Eur J Soil Sci 53:345–354. 10.1046/j.1365-2389.2002.00461.x. [DOI] [Google Scholar]
- 302.Cuhel J, Simek M, Laughlin RJ, Bru D, Chèneby D, Watson CJ, Philippot L. 2010. Insights into the effect of soil pH on N2O and N2 emissions and denitrifier community size and activity. Appl Environ Microbiol 76:1870–1878. 10.1128/AEM.02484-09. [DOI] [PMC free article] [PubMed] [Google Scholar]
- 303.Sun P, Zhuge Y, Zhang J, Cai Z. 2012. Soil pH was the main controlling factor of the denitrification rates and N2/N2O emission ratios in forest and grassland soils along the Northeast China Transect (NECT). Soil Sci Plant Nutr 58:517–525. 10.1080/00380768.2012.703609. [DOI] [Google Scholar]
- 304.Yang J, Feng L, Pi S, Cui D, Ma F, Zhao HP, Li A. 2020. A critical review of aerobic denitrification: insights into the intracellular electron transfer. Sci Total Environ 731:139080. 10.1016/j.scitotenv.2020.139080. [DOI] [PubMed] [Google Scholar]
- 305.Sonthiphand P, Hall MW, Neufeld JD. 2014. Biogeography of anaerobic ammonia-oxidizing (anammox) bacteria. Front Microbiol 5:399. 10.3389/fmicb.2014.00399. [DOI] [PMC free article] [PubMed] [Google Scholar]
- 306.Wu J, Hong Y, He X, Jiao L, Wen X, Chen S, Chen G, Li Y, Huang T, Hu Y, Liu X. 2018. Anaerobic ammonium oxidation in acidic red soils. Front Microbiol 9:2142. 10.3389/fmicb.2018.02142. [DOI] [PMC free article] [PubMed] [Google Scholar]
- 307.Zhu G, Wang S, Wang Y, Wang C, Risgaard-Petersen N, Jetten MS, Yin C. 2011. Anaerobic ammonia oxidation in a fertilized paddy soil. ISME J 5:1905–1912. 10.1038/ismej.2011.63. [DOI] [PMC free article] [PubMed] [Google Scholar]
- 308.Shen LD, Liu S, Lou LP, Liu WP, Xu XY, Zheng P, Hu BL. 2013. Broad distribution of diverse anaerobic ammonium-oxidizing bacteria in Chinese agricultural soils. Appl Environ Microbiol 79:6167–6172. 10.1128/AEM.00884-13. [DOI] [PMC free article] [PubMed] [Google Scholar]
- 309.Strauss SL, Day TA, Garcia-Pichel F. 2012. Nitrogen cycling in desert biological soil crusts across biogeographic regions in the Southwestern United States. Biogeochemistry 108:171–182. 10.1007/s10533-011-9587-x. [DOI] [Google Scholar]
- 310.Remde A, Conrad R. 1990. Production of nitric oxide in Nitrosomonas europaea by reduction of nitrite. Arch Microbiol 154:187–191. 10.1007/BF00423331. [DOI] [Google Scholar]
- 311.Zhu X, Burger M, Doane TA, Horwath WR. 2013. Ammonia oxidation pathways and nitrifier denitrification are significant sources of N2O and NO under low oxygen availability. Proc Natl Acad Sci USA 110:6328–6333. 10.1073/pnas.1219993110. [DOI] [PMC free article] [PubMed] [Google Scholar]
- 312.Freitag A, Rudert M, Bock E. 1987. Growth of Nitrobacter by dissimilatoric nitrate reduction. FEMS Microbiol Ecol 48:105–109. 10.1111/j.1574-6968.1987.tb02524.x. [DOI] [Google Scholar]
- 313.Emerson JB. 2019. Soil viruses: a new hope. mSystems 4:e00120-19. 10.1128/mSystems.00120-19. [DOI] [PMC free article] [PubMed] [Google Scholar]
- 314.Grimm NB. 1988. Role of macroinvertebrates in nitrogen dynamics of a desert stream. Ecology 69:1884–1893. 10.2307/1941165. [DOI] [Google Scholar]
- 315.Zaady E, Shachak M, Groffman PM. 1996. Release and consumption of nitrogen by snail feces in Negev Desert soils. Biol Fertil Soils 23:399–404. 10.1007/BF00335913. [DOI] [Google Scholar]
- 316.Thamdrup B. 2012. New pathways and processes in the global nitrogen cycle. Annu Rev Ecol Evol Syst 43:407–428. 10.1146/annurev-ecolsys-102710-145048. [DOI] [Google Scholar]
- 317.Jansson JK, Hofmockel KS. 2018. The soil microbiome-from metagenomics to metaphenomics. Curr Opin Microbiol 43:162–168. 10.1016/j.mib.2018.01.013. [DOI] [PubMed] [Google Scholar]
- 318.Ortiz M, Bosch J, Coclet C, Johnson J, Lebre P, Salawu-Rotimi A, Vikram S, Makhalanyane T, Cowan D. 2020. Microbial nitrogen cycling in Antarctic soils. Microorganisms 8:1442. 10.3390/microorganisms8091442. [DOI] [PMC free article] [PubMed] [Google Scholar]
- 319.Liu Y, Xue Y. 2020. Expansion of the Sahara Desert and shrinking of frozen land of the Arctic. Sci Rep 10:4109. 10.1038/s41598-020-61085-0. [DOI] [PMC free article] [PubMed] [Google Scholar]
- 320.Docherty KM, Gutknecht JLM. 2012. The role of environmental microorganisms in ecosystem responses to global change: current state of research and future outlooks. Biogeochemistry 109:1–6. 10.1007/s10533-011-9614-y. [DOI] [Google Scholar]
- 321.Wieder W, Bonan G, Allison S. 2013. Global soil carbon projections are improved by modelling microbial processes. Nat Clim Chang 3:909–912. 10.1038/nclimate1951. [DOI] [Google Scholar]
- 322.Jansson JK, Hofmockel KS. 2020. Soil microbiomes and climate change. Nat Rev Microbiol 18:35–46. 10.1038/s41579-019-0265-7. [DOI] [PubMed] [Google Scholar]
- 323.Zhenghu D, Honglang X. 2000. Effects of soil properties on ammonia volatilization. Soil Sci Plant Nutr 46:845–852. 10.1080/00380768.2000.10409150. [DOI] [Google Scholar]
- 324.Housman DC, Powers HH, Collins AD, Belnap J. 2006. Carbon and nitrogen fixation differ between successional stages of biological soil crusts in the Colorado Plateau and Chihuahuan Desert. J Arid Environ 66:620–634. 10.1016/j.jaridenv.2005.11.014. [DOI] [Google Scholar]
- 325.Eskew DL, Ting IP. 1978. Nitrogen fixation by legumes and blue-green algal-lichen crusts in a Colorado Desert environment. Am J Bot 65:850–856. 10.1002/j.1537-2197.1978.tb06146.x. [DOI] [Google Scholar]
- 326.Belnap J. 1996. Soil surface disturbances in cold deserts: effects on nitrogenase activity in cyanobacterial-lichen soil crusts. Biol Fertil Soils 23:362–367. 10.1007/BF00335908. [DOI] [Google Scholar]
- 327.Terry RE, Burns SJ. 1987. Nitrogen fixation in cryptogamic soil crusts as affected by disturbance, p 362–372. In Proceedings, Pinyon-Juniper Conference. Technical Report INT-215, USDA Forest Service, Intermountain Research Station, Ogden, UT.
- 328.Rychert RC, Skujiņš J. 1974. Nitrogen fixation by blue-green algae-lichen crusts in the Great Basin Desert. Soil Sci Soc Am J 38:768–771. 10.2136/sssaj1974.03615995003800050023x. [DOI] [Google Scholar]
- 329.Skarpe C, Henriksson E. 1987. Research note—nitrogen fixation by cyanobacterial crusts and by associative‐symbiotic bacteria in Western Kalahari, Botswana. Arid Soil Res Rehab 1:55–59. 10.1080/15324988709381128. [DOI] [Google Scholar]
- 330.Zaady E, Groffman PM, Shachak M. 1998. Nitrogen fixation in macro- and microphytic patches in the Negev Desert. Soil Biol Biochem 30:449–454. 10.1016/S0038-0717(97)00195-8. [DOI] [Google Scholar]
- 331.Russow R, Veste M, Bohme F. 2005. A natural 15N approach to determine the biological fixation of atmospheric nitrogen by biological soil crusts of the Negev Desert. Rapid Commun Mass Spectrom 19:3451–3456. 10.1002/rcm.2214. [DOI] [PubMed] [Google Scholar]
- 332.Kidron GJ, Posmanik R, Brunner T, Nejidat A. 2015. Spatial abundance of microbial nitrogen-transforming genes and inorganic nitrogen in biocrusts along a transect of an arid sand dune in the Negev Desert. Soil Biol Biochem 83:150–159. 10.1016/j.soilbio.2015.01.024. [DOI] [Google Scholar]
- 333.MacGregor AN, Johnson DE. 1971. Capacity of desert algal crusts to fix atmospheric nitrogen. Soil Sci Soc Am J 35:843–844. 10.2136/sssaj1971.03615995003500050055x. [DOI] [Google Scholar]
- 334.Li JY, Jin XY, Zhang XC, Chen L, Liu JL, Zhang HM, Zhang X, Zhang YF, Zhao JH, Ma ZS, Jin D. 2020. Comparative metagenomics of two distinct biological soil crusts in the Tengger Desert, China. Soil Biol Biochem 140:107637. 10.1016/j.soilbio.2019.107637. [DOI] [Google Scholar]
- 335.Koberl M, Erlacher A, Ramadan EM, El-Arabi TF, Muller H, Bragina A, Berg G. 2016. Comparisons of diazotrophic communities in native and agricultural desert ecosystems reveal plants as important drivers in diversity. FEMS Microbiol Ecol 92:fiv166. 10.1093/femsec/fiv166. [DOI] [PMC free article] [PubMed] [Google Scholar]
- 336.Bu L, Peng Z, Tian J, Song F, Wei G, Wang H. 2020. Distinct abundance patterns of nitrogen functional microbes in desert soil profiles regulate soil nitrogen storage potential along a desertification development gradient. CATENA 194:104716. 10.1016/j.catena.2020.104716. [DOI] [Google Scholar]
- 337.Lopez-Lozano NE, Carcaño-Montiel MG, Bashan Y. 2016. Using native trees and cacti to improve soil potential nitrogen fixation during long-term restoration of arid lands. Plant Soil 403:317–329. 10.1007/s11104-016-2807-3. [DOI] [Google Scholar]
- 338.Strauss SL, Garcia-Pichel F, Day TA. 2012. Soil microbial carbon and nitrogen transformations at a glacial foreland on Anvers Island, Antarctic Peninsula. Polar Biol 35:1459–1471. 10.1007/s00300-012-1184-5. [DOI] [Google Scholar]
- 339.Wierzchos J, Ascaso C, McKay CP. 2006. Endolithic cyanobacteria in halite rocks from the hyperarid core of the Atacama Desert. Astrobiology 6:415–422. 10.1089/ast.2006.6.415. [DOI] [PubMed] [Google Scholar]
- 340.Yin M, Gao X, Tenuta M, Gui D, Zeng F. 2019. Presence of spring-thaw N2O emissions are not linked to functional gene abundance in a drip-fertigated cropped soil in arid northwestern China. Sci Total Environ 695:133670. 10.1016/j.scitotenv.2019.133670. [DOI] [PubMed] [Google Scholar]
- 341.Yin M, Gao X, Tenuta M, Li L, Gui D, Li X, Zeng F. 2020. Enhancement of N2O emissions by grazing is related to soil physicochemical characteristics rather than nitrifier and denitrifier abundances in alpine grassland. Geoderma 375:114511. 10.1016/j.geoderma.2020.114511. [DOI] [Google Scholar]
- 342.Jenkins SN, Murphy DV, Waite IS, Rushton SP, O'Donnell AG. 2016. Ancient landscapes and the relationship with microbial nitrification. Sci Rep 6:30733. 10.1038/srep30733. [DOI] [PMC free article] [PubMed] [Google Scholar]
- 343.Zhang G, Huang J, Jia M, Liu F, Yang Y, Wang Z, Han G. 2019. Ammonia-oxidizing Bacteria and Archaea: response to simulated climate warming and nitrogen supplementation. Soil Sci Soc Am J 83:1683–1695. 10.2136/sssaj2019.05.0134. [DOI] [Google Scholar]
- 344.Zhong L, Du R, Ding K, Kang X, Li FY, Bowatte S, Hoogendoorn CJ, Wang Y, Rui Y, Jiang L, Wang S. 2014. Effects of grazing on N2O production potential and abundance of nitrifying and denitrifying microbial communities in meadow-steppe grassland in northern China. Soil Biol Biochem 69:1–10. 10.1016/j.soilbio.2013.10.028. [DOI] [Google Scholar]
- 345.Sher Y, Zaady E, Ronen Z, Nejidat A. 2012. Nitrification activity and levels of inorganic nitrogen in soils of a semi-arid ecosystem following a drought-induced shrub death. Eur J Soil Biol 53:86–93. 10.1016/j.ejsobi.2012.09.002. [DOI] [Google Scholar]
- 346.Posmanik R, Nejidat A, Dahan O, Gross A. 2017. Seasonal and soil-type dependent emissions of nitrous oxide from irrigated desert soils amended with digested poultry manures. Sci Total Environ 593–594:91–98. 10.1016/j.scitotenv.2017.03.115. [DOI] [PubMed] [Google Scholar]
- 347.Yergeau E, Bokhorst S, Kang S, Zhou J, Greer CW, Aerts R, Kowalchuk GA. 2012. Shifts in soil microorganisms in response to warming are consistent across a range of Antarctic environments. ISME J 6:692–702. 10.1038/ismej.2011.124. [DOI] [PMC free article] [PubMed] [Google Scholar]
- 348.Alves RJ, Wanek W, Zappe A, Richter A, Svenning MM, Schleper C, Urich T. 2013. Nitrification rates in Arctic soils are associated with functionally distinct populations of ammonia-oxidizing archaea. ISME J 7:1620–1631. 10.1038/ismej.2013.35. [DOI] [PMC free article] [PubMed] [Google Scholar]
- 349.Abed RMM, De Beer D, Stief P. 2015. Functional-structural analysis of nitrogen-cycle bacteria in a hypersaline mat from the Omani desert. Geomicrobiol J 32:119–129. 10.1080/01490451.2014.932033. [DOI] [Google Scholar]
- 350.Maier S, Tamm A, Wu D, Caesar J, Grube M, Weber B. 2018. Photoautotrophic organisms control microbial abundance, diversity, and physiology in different types of biological soil crusts. ISME J 12:1032–1046. 10.1038/s41396-018-0062-8. [DOI] [PMC free article] [PubMed] [Google Scholar]
- 351.Ma Z, Gao X, Tenuta M, Kuang W, Gui D, Zeng F. 2018. Urea fertigation sources affect nitrous oxide emission from a drip-fertigated cotton field in northwestern China. Agric Ecosyst Environ 265:22–30. 10.1016/j.agee.2018.05.021. [DOI] [Google Scholar]
- 352.Tao R, Wakelin SA, Liang Y, Hu B, Chu G. 2018. Nitrous oxide emission and denitrifier communities in drip-irrigated calcareous soil as affected by chemical and organic fertilizers. Sci Total Environ 612:739–749. 10.1016/j.scitotenv.2017.08.258. [DOI] [PubMed] [Google Scholar]
- 353.Wu D, Senbayram M, Moradi G, Mörchen R, Knief C, Klumpp E, Jones DL, Well R, Chen R, Bol R. 2021. Microbial potential for denitrification in the hyperarid Atacama Desert soils. Soil Biol Biochem 157:108248. 10.1016/j.soilbio.2021.108248. [DOI] [Google Scholar]
- 354.Xu Y, Wan S, Cheng W, Li L. 2008. Impacts of grazing intensity on denitrification and N2O production in a semi-arid grassland ecosystem. Biogeochemistry 88:103–115. 10.1007/s10533-008-9197-4. [DOI] [Google Scholar]
- 355.Liu X, Qi Y, Dong Y, Peng Q, He Y, Sun L, Jia J, Cao C. 2014. Response of soil N2O emissions to precipitation pulses under different nitrogen availabilities in a semiarid temperate steppe of Inner Mongolia, China. J Arid Land 6:410–422. 10.1007/s40333-013-0211-x. [DOI] [Google Scholar]
- 356.Billings SA, Schaeffer SM, Evans RD. 2002. Trace N gas losses and N mineralization in Mojave Desert soils exposed to elevated CO2. Soil Biol Biochem 34:1777–1784. 10.1016/S0038-0717(02)00166-9. [DOI] [Google Scholar]
- 357.McCalley CK, Strahm BD, Sparks KL, As DE, Sparks JP. 2011. The effect of long‐term exposure to elevated CO2 on nitrogen gas emissions from Mojave Desert soils. J Geophys Res Atmos 116. 10.1029/2011JG001667. [DOI] [Google Scholar]
- 358.Guilbault MR, Matthias AD. 1998. Emissions of N2O from Sonoran Desert and effluent-irrigated grass ecosystems. J Arid Environ 38:87–98. 10.1006/jare.1997.0300. [DOI] [Google Scholar]
- 359.Goordial J, Davila A, Greer CW, Cannam R, DiRuggiero J, McKay CP, Whyte LG. 2017. Comparative activity and functional ecology of permafrost soils and lithic niches in a hyper-arid polar desert. Environ Microbiol 19:443–458. 10.1111/1462-2920.13353. [DOI] [PubMed] [Google Scholar]
- 360.Kandeler E, Deiglmayr K, Tscherko D, Bru D, Philippot L. 2006. Abundance of narG, nirS, nirK, and nosZ genes of denitrifying bacteria during primary successions of a glacier foreland. Appl Environ Microbiol 72:5957–5962. 10.1128/AEM.00439-06. [DOI] [PMC free article] [PubMed] [Google Scholar]
- 361.Elberling B, Christiansen H, Hansen B. 2010. High nitrous oxide production from thawing permafrost. Nat Geosci 3:332–335. 10.1038/ngeo803. [DOI] [Google Scholar]
- 362.Palmer K, Biasi C, Horn MA. 2012. Contrasting denitrifier communities relate to contrasting N2O emission patterns from acidic peat soils in arctic tundra. ISME J 6:1058–1077. 10.1038/ismej.2011.172. [DOI] [PMC free article] [PubMed] [Google Scholar]
- 363.Palmer K, Horn MA. 2012. Actinobacterial nitrate reducers and proteobacterial denitrifiers are abundant in N2O-metabolizing palsa peat. Appl Environ Microbiol 78:5584–5596. 10.1128/AEM.00810-12. [DOI] [PMC free article] [PubMed] [Google Scholar]
- 364.Paré MC, Bedard-Haughn A. 2012. Landscape-scale N mineralization and greenhouse gas emissions in Canadian cryosols. Geoderma 189–190:469–479. 10.1016/j.geoderma.2012.06.002. [DOI] [Google Scholar]
- 365.Alcántara-Hernández RJ, Centeno CM, Ponce-Mendoza A, Batista S, Merino-Ibarra M, Campo J, Falcón LI. 2014. Characterization and comparison of potential denitrifiers in microbial mats from King George Island, Maritime Antarctica. Polar Biol 37:403–416. 10.1007/s00300-013-1440-3. [DOI] [Google Scholar]