

Abstract
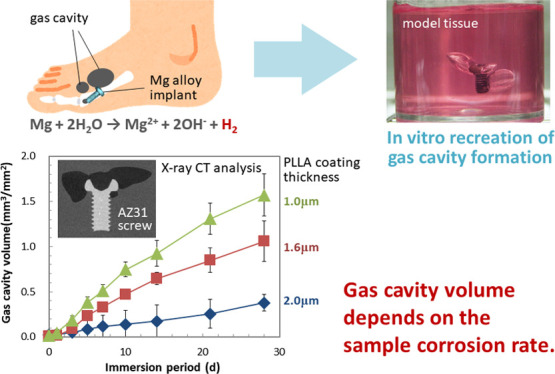
Clinical applications of magnesium (Mg)-based screws have reported gas cavity formation in the surrounding tissue, which sometimes delays the fixation of the bone fracture. The gas cavity formation is considered to depend on the balance between hydrogen generation by Mg corrosion reacting with water in the body fluid and its diffusion into the surrounding tissue by capillary flow. In order to understand the gas cavity formation behavior by Mg-based material implantation, we developed a new in vitro model system to recreate this cavity formation phenomenon: the hydrogen generation by corrosion and its diffusion into the medium. A model tissue is prepared by gelation of the cell culture medium in a sterile condition. The immersion of Mg alloy samples was performed under 5% CO2 atmosphere with periodic observation by X-ray computed tomography, which enabled us to observe gas cavity growth up to 28 d. For demonstrating the usefulness of our model system, Mg alloy samples with different corrosion rates were prepared by a biodegradable polymer coating. AZ31 screws were spin-coated by poly-l-lactide (PLLA) and classified into three groups by their coating thickness as 1.0 ± 0.0, 1.6 ± 0.2, and 2.0 ± 0.1 μm (ave. ± s.d.). Upon their immersion into the model tissue, the gas cavity volumes formed were 1.57 ± 0.23, 1.06 ± 0.22, and 0.38 ± 0.09 mm3/mm2 for 1.0, 1.6, and 2.0 μm coating samples, having the weight loss of 20.2 ± 2.93, 18.5 ± 2.84, and 11.3 ± 3.54 μg/mm2, respectively (ave. ± s.d.). This result clearly indicates the dependence of gas cavity formation on the corrosion rate of the sample. The gas cavity volume was only 3.3∼7.5% of the total hydrogen gas volume estimated based on the weight loss of the samples at 28 d, which is in the range of those calculated from the clinical report (3.2∼9.4% at 4w). This system can be an effective tool to investigate the gas cavity formation behavior and contribute to understand the mechanisms and controlling factors of this phenomenon.
Keywords: biodegradable metals, magnesium alloys, biocorrosion, hydrogen gas, in vitro evaluation
Introduction
Biomedical applications of magnesium (Mg) and its alloys are widely investigated for the success of biodegradable implant devices such as coronary stents and bone fracture fixatives.1−3 Mg is an essential element found in the human body at a relatively high content.4 Mg and its alloys have a Young’s modulus similar to that of the human cortical bone.5 They are easily corroded by reacting with water in the body fluids and tissues, which is utilized as degradability inside the human body. Several reports on clinical studies of Mg alloy devices are available;6−12 some of them are about cannulated compressive screws made of Mg-4wt %Y-3wt %RE (WE43, RE indicates rare-earth elements)-based alloy.6−8,11,12 In case of hallux valgus treatment, gas cavity formation in the tissue surrounding the Mg alloy screws was observed in almost all (38 of 39) patients at 6w of follow up.7 Furthermore, early disintegration and the failure of the implanted screws were found in 7 and 1 cases out of 39, respectively.7 Applying this screw to unstable scaphoid fractures, extensive resorption cysts were observed in 3 out of 5 patients, resulting in the retardation of fracture healing.12 Implantation of two screws to reconstruct scaphotrapeziotrapezoidal joint failed with osteolytic seams, cyst formation, and loosening of both screws, resulting in revision by nondegradable screws.11 To avoid the clinical complication or inconvenience caused by gas cavity formation accompanying the corrosion of the Mg alloy devices, it is important to understand its mechanism and to evaluate its risk before clinical trial.
The cyst or gas cavity formation is attributed to the hydrogen (H2) generation by the Mg corrosion reaction.13 The amount of gas dissolved into the fluid is proportional to its partial pressure, which is known as Henry’s law. Before the implantation, the body fluid contains dissolved nitrogen (N2), oxygen (O2), and carbon dioxide (CO2) proportionally to their partial pressure inside the body (Figure 1a). When a Mg alloy device is implanted, H2 is generated by corrosion reaction, resulting in the increase in its partial pressure inside the body. At the beginning of the implantation period, however, the partial pressure of H2 is much lower than those of N2, O2, and CO2; most of the generated H2 cannot dissolve into the body fluid and forms a gas cavity in the tissue surrounding the implant (Figure 1b). Along the progress of the corrosion reaction, the partial pressure of H2 increases more, whereas those of other gases decrease. Then, some of the H2 in the gas cavity dissolves into the body fluid and diffuses through the microcapillary network, whereas undissolved N2, O2, and CO2 join to the cavity in the tissue, resulting in the exchange of H2 in the cavity by N2, O2, and CO2 (Figure 1c).14 This is supported by the analysis of the gas composition in the cavity formed in animal tissue by Mg alloy implantation as mainly composed of N2, followed by O2 and H2.15 The quick decrease in H2 concentration in the gas cavity was also confirmed by an in vivo experiment with subcutaneous injection of H2 into hairless mice.14
Figure 1.

Schematic explanation of gas cavity formation and H2 diffusion in the tissue.
The partial pressure of H2 in the tissue near the Mg alloy implant depends on the balance between its generation by corrosion reaction and its diffusion by blood flow because every tissue has a capillary network. If the diffusion rate by blood flow is faster than the generation rate, the partial pressure of H2 does not increase, and then, gas cavity does not form. Actually, no gas cavity formation is reported in the clinical study for vascular stents,16−18 where the blood flow rates in coronary arteries are much higher than those in capillary.19 In the clinical trial of pure Mg screws, the gas cavity formation depends on the implanting tissues; it was not observed in the femoral head or neck but observed in the metatarsal bone.3 This dependence on the implanting tissue makes it difficult to predict the gas cavity formation behavior of the Mg alloy implants because blood flow differs not only with the types of tissues but also with patient conditions such as age, types of injury, pathology, underlying diseases, and so forth.
In order to tackle the gas cavity formation by Mg alloy implantation, a few in vivo experiments were recently carried out focusing on this phenomenon in small animals.14,20−22 These in vivo experiments are valuable to observe and understand the gas cavity formation behavior using a Mg alloy sample, but they are not applicable to risk assessment on gas cavity formation by a Mg alloy for a specific clinical use. Currently available Mg alloy screws had to be evaluated by in vivo implantation tests prior to their clinical application, but they failed to reveal the clinical risks reported in their clinical studies.7,11,12 This can be attributed to an indispensable issue lying under in vivo experiments, difference in species. Healthy animal tissue can never be the same to injured human tissue, including simple factors such as the body weight and fluid/tissue amount. It is also difficult to control each of physiological factors such as blood flow separately in an animal body. If we have a good in vitro evaluation method which can simulate the human body environment and can control the factors influencing gas cavity formation behavior, it is effective to understand the critical conditions for gas cavity formation and contribute to the appropriate estimation of the risks. It is also beneficial on the following points as low costs, relatively short testing periods, and no animal uses (no issue on animal welfare). However, most of in vitro evaluation methods are carried out in a simple liquid environment; no method is established to observe gas cavity formation behavior accompanying the implantation of biodegradable metal devices so far.
Based on the described background, we developed a new in vitro method to observe the gas cavity formation behavior of a biodegradable metal sample under a controllable condition. We employed a gel of cell culture medium by adding the thickener (gelation reagent) to form a model tissue and demonstrated the observation of gas cavity formation using an AZ31 screw up to 28 d using mircofocus X-ray computed tomography (μCT).
Materials and Methods
Sample Preparation
Commercially available industrial screws (MG-0204, M2 and 4 mm in length, WILCO Co. Ltd.) made of Mg-3wt %Al-1wt %Zn (AZ31) were employed as a model device. Its chemical composition is shown in Table 1. The screws were immersed in 1 M NaOH at 80 °C for 5 min and rinsed thoroughly with ultrapure water to clean their surface. Then, surface activation was carried out by 1 M HNO3 at room temperature for 10 s, followed by rinsing with ultrapure water. The screws were dried in vacuo, and their initial weight (W0) was measured. Biodegradable polymer coating was employed to control the initial degradation rate of the screw samples without seriously changing their surface area, as studied in our previous work.23,24 Poly-l-lactide (PLLA), one of the representative biodegradable polymers, was applied because it was already used as a clinical implant. The screws were spin-coated with a 20 μL portion of 0.5, 1, and 2% (w/v) solution of PLLA (Mw 300,000, Polysciences, Inc.) in chloroform at 100 rpm for 10 s, followed by 1000 rpm for 60 s. These coated samples were dried in vacuo, and their weight with coating (Wc) was measured to determine the amount of the coated polymer. The coating thickness of the polymer, hcoat, was calculated by the following equation:
| 1 |
where ρp and S0 indicate the density of the polymer (1.15 mg/mm3) and the initial surface area of the screw, respectively. S0 was determined based on the μCT observation described in the next section. The coated screws were categorized into three groups depending on their coating thickness: thick (2.0 ± 0.1 μm on average ± standard deviation), intermediate (1.6 ± 0.2 μm), and thin (1.0 ± 0.0 μm). Each group has three samples. Prior to gel immersion, each sample was sterilized by ethylene oxide gas (EOG) and stored in vacuo.
Table 1. Chemical Composition of the AZ31 Alloy (Wt.%).
| Al | Zn | Mn | Fe | Si | Cu | Ni | Mg |
|---|---|---|---|---|---|---|---|
| 3.00 | 1.00 | 0.40 | <0.01 | 0.01 | <0.01 | <0.01 | Bal. |
Gel Immersion
Eagle’s minimum essential medium (Eagle’s MEM “Nissui” 1, Nissui Pharmaceutical Co Ltd.) supplemented with 10% (v/v) fetal bovine serum (E-MEM + FBS) was employed as a simulated body fluid. The major chemical components of E-MEM are shown in Table 2 in comparison with those of human blood plasma.25 To simulate the living tissue, a thickener (gellan gum, Wako Pure Chemical Corporation) was added to E-MEM + FBS to be 0.4%(w/v) as a final concentration. In detail, an appropriate amount of the thickener was dissolved in water at 90 °C, followed by the addition of an appropriate amount of 10 times concentrated E-MEM solution without supplements. After sterilization by autoclaving, the solution was maintained at 55 °C, while appropriate amounts of supplements (3% L-glutamate, 7.5% NaHCO3, and FBS) were aseptically added.
Table 2. Major Chemical Components of Blood Plasma and E-MEM.
| composition | blood plasma25 | E-MEMa |
|---|---|---|
| Na+(mM) | 142 | 143.5 |
| K+(mM) | 5 | 5.37 |
| Mg2+(mM) | 1.5 | 0.81 |
| Ca2+(mM) | 2.5 | 1.80 |
| Cl–(mM) | 103 | 124.7 |
| HCO3–(mM) | 27 | 26.2 |
| HPO42–(mM) | 1 | 0.90 |
| SO42–(mM) | 0.5 | 0.81 |
| Glucose (g/L) | ∼1.1 | 1 |
| amino acids and vitamins (g/L) | 0.25–0.4 | 0.81 |
| proteins (g/L) | 63–80 | |
| phenol red (g/L) | 0.006 |
Eagle’s minimum essential medium “Nissui” 1, Nissui Pharmaceutical Co Ltd., Japan.
A schematic illustration of the gel immersion procedure is shown in Figure 2. A 3 mL portion of the prepared immersion medium was poured into a sterile polystyrene vessel and solidified at room temperature for 10 min. Then, a Mg alloy screw was half-buried into the gel (keeping its head out of the gel) to control its depth in the gel. Then, an additional 5 mL portion of the immersion medium was poured over the screw, which was completely immersed into the gel. The vessel was placed in the CO2 incubator (37 °C, 5% CO2) loosely capped for gas exchange. Within a few hours, the gel sample was observed by μCT (SMX-90CT, Shimadzu Corporation) at an optimal condition with the resolution of 21 μm/voxel to confirm the initial condition of the immersion medium. S0 was determined based on the μCT images at 0 d using image analysis software (VG Studio Max 3.0, Volume Graphics GmbH). The gas cavity formed around the screw was observed by μCT at 1, 3, 5, 7, 10, 14, 21, and 28 d of immersion. The volume of the gas cavity was analyzed by the image analysis software and divided by S0 to give gas cavity volume per initial sample surface area, Vcavity [mm3/mm2].
Figure 2.

Schematic illustration of the gel immersion procedure.
After the immersion of 28 d, the screws were collected from the immersion medium and dried in vacuo. An insoluble salt layer formed on the screw surface was removed by a chromic acid solution [20 g of CrO3, 1 g of AgNO3, and 2 g of Ba (NO3)2 dissolved in 100 mL of ultrapure water], followed by rinsing with ultrapure water and drying in vacuo. The remaining weight (Wr) was measured to determine the weight loss per unit surface area (Wloss [g/mm2]) by the following equation:
| 2 |
In order to calculate the total gas volume generated by corrosion during the immersion period, generated H2 was assumed as the ideal gas for simplicity. The total gas volume per unit surface area (Vtotal [mm3/mm2]) was calculated by the following equation:
| 3 |
where Wm, R, T, and p indicate the molecular weight of AZ31 (24.54 [g/mol]), gas constant (0.0821 [L·atm/K·mol]), absolute temperature (310 [K]), and pressure, respectively. When p is assumed as 1 [atm], the previous equation gives the following one:
| 4 |
which is used to estimate Vtotal generated during 28 d of gel immersion. Then, the capture ratio of the generated gas in the gas cavity is determined by dividing Vcavity by Vtotal.
Real gases are known to have different behavior from that of ideal gas, especially at high pressure and low temperature. In the present study, however, the pressure and temperature are 1 [atm] and 310 [K], respectively, and the difference from the ideal gas behavior is relatively small.26 When Vtotal is calculated assuming H2 and applying the van der Waals equation, the difference from the value calculated by the ideal gas law is less than 0.1%.
Results
The examples of macroscopic images of gel immersion samples are shown in Figure 3. Gas cavity formation around the screw in the immersion medium was observed, suggesting the successful recreation of the gas cavity formation phenomenon by the corrosion of a Mg alloy sample. It also shows that the immersion medium could maintain the gas cavity during 28 d of immersion. The growth of gas cavity can be easily observed even in the macroscopic images. However, to give a further detailed analysis, μCT observation is performed at various time points. Figure 4 shows the examples of the two-dimensional (2D) μCT images of gas cavities and an immersed screw. This figure clearly demonstrates the growth of the gas cavities with an increase in the immersion period, but it does not represent the whole volume and behavior of gas cavity formation. Therefore, the volume of the gas cavity was measured using image analysis software and summarized in Figure 5. It is clear that Vcavity increased with an increase in the immersion period for all samples. The growth rate depends on the thickness of the coating; the screws with thinner coating have higher gas cavity volumes.
Figure 3.

Examples of the macroscopic observation of gel immersion of a PLLA-coated screw at 3 d (a), 7 d (b), and 28 d (c).
Figure 4.

Examples of the cross-section images of gas cavity formation around an immersed screw observed by μCT.
Figure 5.

Gas cavity growth curve during gel immersion (ave ± s.d, n = 3).
After 28 d of gel immersion, the Wloss values of PLLA-coated screws were 20.2 ± 2.93, 18.5 ± 2.84, and 11.3 ± 3.54 μg/mm2 for coating thicknesses of 1.0, 1.6, and 2.0 μm, respectively (see Supplemental Table S1). Figure 6a indicates the correlation between Vcavity and Vtotal, which was estimated using Wloss by eq 4. As Vtotal decreased with an increase in hcoat, Vcavity decreased. In other words, the higher corrosion rate of the screw resulted in the larger gas cavity formation. It also indicates that Vcavity is much smaller than Vtotal, even though it has a good correlation. As described in the Materials and Methods Section, Vtotal is estimated by ideal gas law, which may have a difference of 0.1% from the estimation based on the real gas behavior (van der Waals equation, data not shown). However, this 0.1% difference is sufficiently low compared to that between Vcavity and Vtotal shown here.
Figure 6.

(a) Correlation of the gas cavity volume per initial surface area, Vcavity, and the total gas volume generated by corrosion per initial surface area, Vtotal. (b) Correlation of the gas capture ratio, Vcavity/Vtotal and Vtotal (ave ± s.d, n = 3).
The capture ratio of the generated gas into the cavity is estimated by Vcavity/Vtotal and shown in Figure 6b. The capture ratios are 3.3∼7.5% after 28 d of gel immersion and increased with the increase in Vtotal. This indicates that most of the gas generated by corrosion diffuses into the model tissue without forming the gas cavity. The extrapolation of the linear regression curve indicates the limit of the Vtotal, which does not form a gas cavity as ca. 4 mm3/mm2 for 28 d in this experimental condition. In order to estimate the gas diffusion rate (vd), the following equation is applied:
| 5 |
where t is the immersion period of 28 d. Then, vd is plotted against the gas generation rate (vg), which is calculated dividing Vtotal by t (28 d). As shown in Figure 7, the clear dependence of vd on vg was observed, suggesting that 94% of the generated gas diffused into the model tissue.
Figure 7.

Correlation of the gas diffusion rate, vd, and the gas generation rate, vg (ave ± s.d, n = 3).
Discussion
Biodegradable metals represented by Mg and its alloys have different degradation mechanism from those of biodegradable polymeric and ceramic materials. The total corrosion reaction of Mg is described below:27
| 6 |
where the pH of the solution will increase and H2 accumulation will occur with the progress of the corrosion reaction. Inside the living body, however, the vascular network supplies blood circulation, which supports the diffusion of corrosion products such as Mg2+, OH–, and H2. This contributes to maintain the pH of the blood and interstitial fluid near the implant ca. 7.4 and to reduce the gas cavity formation. Because Mg and its alloys are the very first biodegradable materials that generate H2 accompanying its degradation, no in vitro method is established to evaluate the gas cavity formation behavior of the material and the effect of gas cavity in the surrounding tissue.
In vivo implantation of Mg and its alloys was carried out to evaluate the material corrosion rate and biocompatibility including gas cavity formation in the tissue. Most of these studies reported no specific adverse reaction caused by the implantation, but they often observed gas cavity formation in the surrounding tissue of the implant.20−22,28−30 As described before, gas cavity formation depends on the balance between the H2 generating rate (=corrosion rate) and its diffusion rate by blood flow. However, in in vivo experiments, it is difficult to prepare the same environment of the human, injured tissue. Even though a sample can be implanted to the same type of the tissue, the environmental factors such as blood flow are different between human and animal tissues. Alternatively, if we have an in vitro system to simulate the environment of the human tissue with individual controls of the environmental parameters such as blood flow, we can use it to obtain supportive data for the risk assessment of the gas cavity formation by biodegradable metal implants prior to their clinical application.
Having said so, most of the in vitro degradation/corrosion tests of Mg alloys were performed in physiological solution, which could not achieve the recreation of the gas cavity formation phenomenon. This is because diffusion of the generated gas in the solution is faster than that in the tissue. Therefore, as a first step to mimic in vivo implantation condition, a model tissue is prepared by adding a thickener to a cell culture medium to slow down the diffusion rate of the gas. E-MEM is employed as a physiological solution because it is developed based on the composition of human blood plasma. Gellan gum, known as one of the alternatives of an agar for microbiological culture, is selected as a gelation reagent because it forms a transparent gel and can be sterilized by autoclaving. As shown in Figure 3, the immersion of an AZ31 screw into this gel offers macroscopic observation of the gas cavity formation behavior during 28 d of immersion. This is the very first in vitro evaluation method that enables us to observe the gas cavity formation behavior in a model tissue.
Using μCT, the gas cavity volume can be measured and analyzed through the immersion period, as summarized in Figure 5. PLLA-coating was employed to control the H2 generation rate by suppressing the corrosion of the screw; the thicker coating results in the lower corrosion rate (see Supplemental Table S1). As shown in Figure 6, the gas cavity growth depends on the corrosion rate of the screw. This finding demonstrates that our developed system can detect the difference in the gas cavity formation behavior, which is derived from the difference in the material corrosion rate.
Inside the human body, H2 generated by the corrosion reaction of the implanted Mg-based device will diffuse by blood flow. Therefore, the generated gas exceeding its diffusion limits forms the gas cavity in the surrounding tissue. That means, the condition to form gas cavity in the tissue can be written as vg > vd, where vg and vd are the H2 generation rate by corrosion and as the H2 diffusion rate, respectively. Then, Vcavity can be described as follows:
| 7 |
where t indicates the immersion period. When (vg – vd) is constant through the immersion period, Vcavity keeps growing at a constant rate. As shown in Figure 5, Vcavity increases through the immersion period of 28 d in the present study, but the slope of the growth curve is larger at the beginning of the immersion than at the latter. This suggests that (vg – vd) is not constant, but slightly decreases along the incubation period. Vcavity/Vtotal was plotted against Vtotal in Figure 6b. Gas capture ratios were 3.3∼7.5% after 28 d of immersion, suggesting that more than 90% of the generated gas diffused via the immersion medium.
In order to find Vcavity/Vtotal, we analyzed the data in the clinical reports in which Mg-5wt %Ca (Mg-5Ca)22 or WE43-based7 screws were implanted to the metatarsal/midfoot fractures or osteotomies. In ref (7), the gas cavity formation was only reported as the maximum width of radiolucency areas around the screw, and summarized as the average, the minimum, and the maximum values. Therefore, the gas cavity volume is calculated assuming a sphere with a diameter of the maximum width of radiolucency areas. The average degradation periods of Mg-5Ca or WE43-based screws were also assumed as 1231 and 18 months,32 respectively, with a constant degradation rate through the entire implantation period for the simplest model. As summarized in Tables 3 and 4, the Vcavity of the clinical cases decreases with increases in the implantation period. The increasing phase of Vcavity is missing because of the lack of follow-up at the early stage of implantation. In other words, the increase phase of Vcavity is relatively short in clinical cases. This trend agrees with those of in vivo implantation experiments.20−22 The decrease in Vcavity indicates vd > vg, which was not observed in our model tissue in the present study. Because the gas cavity is formed in the clinical cases, vg should be larger than vd at the initial phase of implantation. Then, at some point, vg becomes smaller than vd, resulting in a decrease in Vcavity. Unfortunately, detailed information on the degradation of Mg alloy screws were not available in clinical cases, but the decrease in the corrosion rate of Mg alloy samples was reported by in vitro corrosion tests in simulated body fluids even within the first 24 h.33,34 Therefore, in clinical cases, it is considered that vg decreases below vd in fairly early stage of implantation. In the present study, however, it does not occur in our model tissue within 28 d. This might be attributed to the slow decrease in vg or relatively low vd of our model system. The resolution of the μCT images we obtained is not enough to find reduction in the volume of the immersed screw for the shorter immersion period. Further improvement/investigation is necessary to obtain sequential data on Mg alloy sample degradation during the incubation period.
Table 3. Estimation of the Gas Cavity Volume and the Total Gas Volume from the Literature22.
| follow-up period (w) | tissue | gas cavity volume (mm3)22 | gas capture ratio (%)a | total gas volume (mm3)b |
|---|---|---|---|---|
| 1 | bone | 79.32 ± 19.00 | 15.0 ± 3.6 | 531 |
| soft tissue | 341.95 ± 126.42 | 64.5 ± 23.8 | ||
| 4 | bone | 67.95 ± 15.73 | 3.20 ± 0.74 | 2122 |
| soft tissue | 198.50 ± 84.47 | 9.35 ± 3.98 | ||
| 8 | bone | 38.86 ± 7.55 | 0.92 ± 0.18 | 4244 |
| soft tissue | 164.23 ± 70.21 | 3.87 ± 1.65 | ||
| 12 | bone | 34.86 ± 6.07 | 0.55 ± 0.01 | 6367 |
| soft tissue | 85.00 ± 42.95 | 1.34 ± 0.67 | ||
| 26 | bone | 32.23 ± 5.61 | 0.23 ± 0.04 | 13,794 |
| soft tissue | 35.59 ± 37.79 | 0.26 ± 0.27 | ||
| 52 | bone | 26.43 ± 3.21 | 0.10 ± 0.01 | 27,589 |
| soft tissue | 20.84 ± 31.17 | 0.08 ± 0.11 |
Gas capture ratio is defined as the gas cavity volume divided by the total gas volume.
Total gas volume is calculated as an ideal gas based on the following assumptions: the weight of the Mg-5Ca screw as 26.97 mg, and its degradation period as 12 months (the average values of the degradation period appear on the implant brochure31) with a constant degradation rate through the period.
Table 4. Estimation of the Gas Cavity Volume and the Total Gas Volume from the Literature7.
| follow-up period (w) | tissue | ave./max | radiolucency areas (mm)7 | gas cavity volume (mm3)a | gas capture ratio (%)b | total gas volume (mm3)c |
|---|---|---|---|---|---|---|
| 6 | bone | ave | 2.0 ± 1.3 | 4.19 ± 8.2 | 0.04 ± 0.07 | 11,390 |
| max | 6 | 113 | 0.99 | |||
| soft tissue | ave | 3.0 ± 3.0 | 14.1 ± 42.4 | 0.12 ± 0.37 | ||
| max | 11 | 697 | 6.1 | |||
| 12 | bone | ave | 1.5 ± 0.9 | 1.77 ± 3.2 | 0.008 ± 0.014 | 22,780 |
| max | 2.8 | 11.5 | 0.05 | |||
| soft tissue | ave | 1.0 ± 1.8 | 0.524 ± 2.8 | 0.002 ± 0.012 | ||
| max | 5.7 | 97.0 | 0.43 |
Gas cavity volume is calculated assuming a sphere with a diameter of the average and the maximum value of the maximum length of X-ray transparency reported.7
Gas capture ratio is defined as the gas cavity volume divided by the total gas volume.
Total gas volume is calculated as an ideal gas based on the following assumptions: the weight of the WE43-based compression screw as 150 mg, and its degradation period as 18 months (the average values of the degradation period appears on the implant brochure32) with a constant degradation rate through the period.
The gas capture ratios, Vcavity/Vtotal, of the clinical cases were less than 15%, except that in the soft tissue at 1 week of follow up, as reported in ref (22). This simple calculation based on the clinical data also indicates that most of the generated gas diffuses through the tissue and blood flow after 4 w of implantation. The estimation in Tables 3 and 4 suggests the difference in the gas capture ratio between the tissue types. The Vcavity/Vtotal of both bone and soft tissue are plotted against the incubation period, as shown in Figure 8. The estimation in ref (22) is higher than that in ref (7), but maximum data in ref (7) showed a similar level of Vcavity/Vtotal to those in ref (22). For both cases, Vcavity/Vtotal of the soft tissue was higher than that of bone.
Figure 8.

Comparison of Vcavity/Vtotal in clinical cases to those of the present study (ave ± s.d). The values of bone and soft tissue were calculated based on the clinical reports (*ref (22), **ref (7), see Tables 3 and 4).
The Vcavity/Vtotal in the model tissue is those between the soft tissue and bone of ref (22). Because the concentration of the gelation reagent in the model tissue is constant, to giving the same diffusion condition, the higher corrosion rate (of the 1.0 μm coating group than that of 2.0 μm coating group) results in the larger overflow of H2, that is, (vg – vd). This suggests that, in clinical cases, the soft tissue has a larger H2 overflow compared to those of the bone tissue. In our model tissue, the gelation reagent and its concentration are changeable, which enables us to control the diffusion rate in the model tissue closer to those in the actual human tissue. This brings us a new challenge to recreate/simulate the environment in various human tissues and conditions. Our model tissue can be useful to observe the initial process of gas cavity formation, to understand its mechanism, and to elucidate the factors controlling this process. This will contribute to the success of new biodegradable medical devices made of biodegradable metals with reducing risks of gas cavity formation.
Conclusions
In the present study, we developed a new in vitro evaluation method for the gas cavity formation behavior by Mg alloy corrosion under a similar environment inside the human body. We demonstrate the recreation of the gas cavity formation phenomenon by immersing a Mg alloy sample into a model tissue, which is prepared by the gelation of a cell culture medium. The obtained results proved that our developed method can successfully detect the difference in the gas cavity growth rate, which is controlled by PLLA coating of the sample. At this condition, it confirmed that the higher corrosion rate gives the higher cavity growth rate. This suggests the dependency of gas cavity formation on the balance between the hydrogen generation rate by corrosion and its diffusion rate in the biological environment. The gas capture ratios of the model tissue were in the range of those in the clinical reports. Our developed method can be an effective tool to study the gas cavity formation behavior by Mg alloy corrosion under the similar environment to the actual implantation condition.
Acknowledgments
The authors appreciate Ms. Y. Kohyama from NIMS, Mr. M. Gwiazda from the Warsaw University of Technology, and Ms. Y. Mukai from Tsukuba University for their participation to the prepractice to establish this evaluation method. This research was partially supported by JSPS KAKENHI (Grant Number JP 17H02116).
Glossary
Abbreviations
- AZ31
Mg-3wt %Al-1wt %Zn alloy
- EOG
ethylene oxide gas
- FBS
fetal bovine serum
- hcoat
coating thickness
- MEM
minimum essential medium
- Mw
molecular weight
- PLLA
poly-l-lactide
- R
gas constant
- RE
rare earth
- S0
initial surface area
- Vcabity
gas cavity volume per initial surface area
- Vtotal
total gas volume per initial surface area
- vd
diffusion rate of the gas
- vg
generation rate of the gas
- WE43
Mg-4wt %Y-3wt %RE alloy
- Wc
weight after coating
- Wloss
weight loss
- Wm
molecular weight (of an alloy)
- Wr
remaining weight
- W0
initial weight
- μCT
micro focus X-ray computed tomography
- ρp
density of polymer
- 2D
two dimensional.
Supporting Information Available
The Supporting Information is available free of charge at https://pubs.acs.org/doi/10.1021/acsbiomaterials.1c01429.
Wloss of the AZ31 screws after 28 d of gel immersion (PDF)
Author Contributions
The manuscript was written through contributions of all authors. All authors have given approval to the final version of the manuscript.
This research was partially supported by JSPS KAKENHI (Grant Number JP 17H02116).
The authors declare no competing financial interest.
Supplementary Material
References
- Liu Y.; Zheng Y. F.; Chen X. H.; Yang J. A.; Pan H.; Chen D.; Wang L.; Zhang J.; Zhu D.; Wu S.; Yeung K. W. K.; Zeng R. C.; Han Y.; Guan S. Fundamental theory of biodegradable metals—Definition, criteria, and design. Adv. Funct. Mater. 2019, 29, 1805402 10.1002/adfm.201805402. [DOI] [Google Scholar]
- Wang J. L.; Xu J. K.; Hopkins C.; Chow D. H.; Qin L. Biodegradable magnesium-based implants in orthopaedics—A general review and perspectives. Adv Sci. 2020, 7, 1902443 10.1002/advs.201902443. [DOI] [PMC free article] [PubMed] [Google Scholar]
- Zhao D.; Witte F.; Lu F.; Wang J.; Li J.; Qin L. Current status on clinical applications of magnesium-based orthopaedic implants: A review from clinical translational perspective. Biomaterials 2017, 112, 287–302. 10.1016/j.biomaterials.2016.10.017. [DOI] [PubMed] [Google Scholar]
- Tanaka H. Expectations for development of medicine based on biological functions of trace metals. Chem. Rev. Q. 1995, 27, 3–12. [Google Scholar]; Japanese
- Gu X. N.; Zheng Y. F. A review on magnesium alloys as biodegradable materials. Front. Mater. Sci. China 2010, 4, 111–115. 10.1007/s11706-010-0024-1. [DOI] [Google Scholar]
- Windhagen H.; Radtke K.; Weizbauer A.; Diekmann J.; Noll Y.; Kreimeyer U.; Schavan R.; Stukenborg-Colsman C.; Waizy H. Biodegradable magnesium-based screw clinically equivalent to titanium screw in hallux valgus surgery: short term results of the first prospective, randomized, controlled clinical pilot study. J. Geophys. Res. Planets 2013, 12, 62. 10.1186/1475-925X-12-62. [DOI] [PMC free article] [PubMed] [Google Scholar]
- Plaass C.; Ettinger S.; Sonnow L.; Koenneker S.; Noll Y.; Weizbauer A.; Reifenrath J.; Claassen L.; Daniilidis K.; Stukenborg-Colsman C.; Windhagen H. Early results using a biodegradable magnesium screw for modified chevron osteotomies. J. Orthop. Res. 2016, 34, 2207–2214. 10.1002/jor.23241. [DOI] [PubMed] [Google Scholar]
- Plaass C.; Von Falck C.; Ettinger S.; Sonnow L.; Calderone F.; Weizbauer A.; Reifenrath J.; Claassen L.; Waizy H.; Daniilidis K.; Stukenborg-Colsman C.; Windhagen H. Bioabsorbable magnesium versus standard titanium compression screws for fixation of distal metatarsal osteotomies—3 year results of a randomized clinical trial. J. Orthop. Sci. 2018, 23, 321–327. 10.1016/j.jos.2017.11.005. [DOI] [PubMed] [Google Scholar]
- Lee J. W.; Han H. S.; Han K. J.; Park H.; Jeon H.; Ok M. R.; Seok H. K.; Ahn J. P.; Lee K. E.; Lee D. H.; Yang S. J.; Cho S. Y.; Cha P. R.; Kwon H.; Nam T. H.; Han J. H. L.; Rho H. J.; Lee K. S.; Kim Y. C.; Mantovani D. Long-term clinical study and multiscale analysis of in vivo biodegradation mechanism of Mg alloy. Proc. Natl. Acad. Sci. U. S. A. 2016, 113, 716–721. 10.1073/pnas.1518238113. [DOI] [PMC free article] [PubMed] [Google Scholar]
- Yu X.; Zhao D.; Huang S.; Wang B.; Zhang X.; Wang W.; Wei X. Biodegradable magnesium screws and vascularized iliac grafting for displaced femoral neck fracture in young adults. BMC Musculoskelet. Disord. 2015, 16, 329. 10.1186/s12891-015-0790-0. [DOI] [PMC free article] [PubMed] [Google Scholar]
- Wichelhaus A.; Emmerich J.; Mittlmeier T. A case of implant failure in partial wrist fusion applying magnesium-based headless bone screws. Case Rep. Orthop. 2016, 2016, 7049130 10.1155/2016/7049130. [DOI] [PMC free article] [PubMed] [Google Scholar]
- Meier R.; Panzica M. First results with a resorbable MgYREZr compression screw in unstable scaphoid fractures show extensive bone cysts. Handchir. Mikrochir. Plast. Chir. 2017, 49, 37–41. 10.1055/s-0042-121416. [DOI] [PubMed] [Google Scholar]
- Witte F. The history of biodegradable magnesium implants: A review. Acta Biomater. 2010, 6, 1680–1692. 10.1016/j.actbio.2010.02.028. [DOI] [PubMed] [Google Scholar]
- Kuhlmann J.; Bartsch I.; Willbold E.; Schuchardt S.; Holz O.; Hort N.; Höche D.; Heineman W. R.; Witte F. Fast escape of hydrogen from gas cavities around corroding magnesium implants. Acta Biomater. 2013, 9, 8714–8721. 10.1016/j.actbio.2012.10.008. [DOI] [PubMed] [Google Scholar]
- McBride E. D. Absorbable metal in bone surgery: A further report on the use of magnesium alloys. J. Am. Med. Assoc. 1938, 111, 2464–2467. 10.1001/jama.1938.02790530018007. [DOI] [Google Scholar]
- Peeters P.; Bosiers M.; Verbist J.; Deloose K.; Heublein B. Preliminary results after application of absorbable metal stents in patients with critical limb ischemia. J. Endovasc. Ther. 2005, 12, 1–5. 10.1583/04-1349R.1. [DOI] [PubMed] [Google Scholar]
- Erbel R.; di Mario C.; Bartunek J.; Bonnier J.; de Bruyne B.; Eberli F. R.; Erne P.; Haude M.; Heublein B.; Horrigan M.; Ilsley C.; Böse D.; Koolen J.; Lüscher T. F.; Weissman N.; Waksman R.; Temporary scaffolding of coronary arteries with bioabsorbable magnesium stents: a prospective, non-randomised multicentre trial. Lancet 2007, 369, 1869–1875. 10.1016/S0140-6736(07)60853-8. [DOI] [PubMed] [Google Scholar]
- Haude M.; Ince H.; Abizaid A.; Toelg R.; Lemos P. A.; von Birgelen C.; Christiansen E. H.; Wijns W.; Neumann F. J.; Kaiser C.; Eeckhout E.; Lim S. T.; Escaned J.; Garcia-Garcia H. M.; Waksman R. Safety and performance of the second-generation drug-eluting absorbable metal scaffold in patients with de-novo coronary artery lesions (BIOSOLVE-II): 6 month results of a prospective, multicentre, non-randomised, first-in-man trial. Lancet 2016, 387, 31–39. 10.1016/S0140-6736(15)00447-X. [DOI] [PubMed] [Google Scholar]
- Ando J. [2. Biomechanics of endothelial cells]. In: Kamiya R. Ed. [Biomechanics of blood circulation]; Corona Publishing Co. Ltd.: Tokyo, 2005, 30–91 (Japanese). [Google Scholar]
- Noviana D.; Paramitha D.; Ulum M. F.; Hermawan H. The effect of hydrogen gas evolution of magnesium implant on the postimplantation mortality of rats. J. Orthop. Trans. 2016, 5, 9–15. 10.1016/j.jot.2015.08.003. [DOI] [PMC free article] [PubMed] [Google Scholar]
- Miura C.; Shimizu Y.; Imai Y.; Mukai T.; Yamamoto A.; Sano Y.; Ikeo N.; Isozaki S.; Takahashi T.; Oikawa M.; Kumamoto H.; Tachi M. In vivo corrosion behaviour of magnesium alloy in association with surrounding tissue response in rats. Biomed Mater. 2016, 11, 025001 10.1088/1748-6041/11/2/025001. [DOI] [PubMed] [Google Scholar]
- Kim Y. K.; Lee K. B.; Kim S. Y.; Bode K.; Jang Y. S.; Kwon T. Y.; Jeon M. H.; Lee M. H. Gas formation and biological effects of biodegradable magnesium in a preclinical and clinical observation. Sci. Technol. Adv. Mater. 2018, 19, 324–335. 10.1080/14686996.2018.1451717. [DOI] [PMC free article] [PubMed] [Google Scholar]
- Xu L.; Yamamoto A. Characteristics and cytocompatibility of biodegradable polymer film on magnesium by spin coating. Colloids Surf. B:Biointerfaces 2012, 93, 67–74. 10.1016/j.colsurfb.2011.12.009. [DOI] [PubMed] [Google Scholar]
- Witecka A.; Yamamoto A.; Idaszek J.; Chlanda A.; Święszkowski W. Influence of biodegradable polymer coatings on corrosion, cytocompatibility and cell functionality of Mg-2.0Zn-0.98Mn magnesium alloy. Colloids Surf. B Biointerfaces 2016, 144, 284–292. 10.1016/j.colsurfb.2016.04.021. [DOI] [PubMed] [Google Scholar]
- Imahori K.; Yamakawa T.. Dictionary of biochemistry (3rd ed.); Tokyo Kagaku Dojin Co. Ltd.: Tokyo; 1984, 734. [Google Scholar]
- LibreTexts, Chemistry 10.9: Real Gases-Deviations from Ideal Behavior, http://chem.libretexts.org/@go/page/21767
- Wada G. On the rate-determining step of the hydrated-water reaction in corrosion of magnesium in aqueous solutions of neutral salt. Denki Kagaku [Electrochemistry] 1957, 25, 164–165. [Google Scholar]; Japanese
- Witte F.; Kaese V.; Haferkamp H.; Switzer E.; Meyer-Lindenberg A.; Wirth C. J.; Windhagen H. In vivo corrosion of four magnesium alloys and the associated bone response. Biomaterials 2005, 26, 3557–3563. 10.1016/j.biomaterials.2004.09.049. [DOI] [PubMed] [Google Scholar]
- Zhang S.; Zhang X.; Zhao C.; Li J.; Song Y.; Xie C.; Tao H.; Zhang Y.; He Y.; Jiang Y.; Bian Y. Research on an Mg–Zn alloy as a degradable biomaterial. Acta Biomater. 2010, 6, 626–640. 10.1016/j.actbio.2009.06.028. [DOI] [PubMed] [Google Scholar]
- Ishikawa A.; Tamura J.; Akahori T.; Hattori T.; Deie M. Biodegradation of pure magnesium and bone tissue reaction in rabbit femur 1 year results of 3D micro-CT monitoring and histological observation. Mater. Trans. 2017, 58, 118–122. 10.2320/matertrans.MI201517. [DOI] [Google Scholar]
- Brochure of resomet: bioresorbable metal, cortex screw, U&I corporation, https://www.youic.com/data/product/5c369d6d56954.pdf.
- Brochure of MAGNEZIX® :UNDERSTANDING INNOVATIONS, Synthellix AG, https://www.syntellix.de/fileadmin/Downloads/Special_Report/180808_004_SYN_Broschuere_SPECIAL_REPORT_EN_WEB.pdf.
- Kannan M. B.; Yamamoto A.; Khakbaz H. Influence of living cells (L929) on the biodegradation of magnesium–calcium alloy. Colloids Surf. B Biointerfaces 2015, 126, 603–606. 10.1016/j.colsurfb.2015.01.015. [DOI] [PubMed] [Google Scholar]
- Witecka A.; Yamamoto A.; Świąszkowski W. Influence of SaOS-2 cells on corrosion behavior of castMg-2.0Zn0.98Mn magnesium alloy. Colloids Surf., B Biointerfaces 2017, 150, 288–296. 10.1016/j.colsurfb.2016.10.041. [DOI] [PubMed] [Google Scholar]
Associated Data
This section collects any data citations, data availability statements, or supplementary materials included in this article.