

Abstract
Objective:
Adolescents’ drinking is influenced by their friends’ drinking. However, it is unclear whether individually-targeted alcohol interventions reduce drinking in the friends of individuals who receive the intervention. This study used simulations of drinking in simulated longitudinal social networks to test whether individually-targeted alcohol interventions may be expected to spread to non-targeted individuals.
Method:
Stochastic actor-based models simulated longitudinal social networks where changes in drinking and friendships were modeled using parameters from a meta-analysis of high school 10th grade social networks. Social influence (i.e., how much one’s friends’ drinking affects their own drinking) and social selection (i.e., how much one’s drinking affects who they select as friends) were manipulated at several levels. At the midpoint of each simulation, a randomly-selected heavy-drinking individual was experimentally assigned to an intervention (changing their drinking status to non-drinking) or a control condition (no change in drinking status) and the drinking statuses of that individual’s friends were recorded at the end of the simulation.
Results:
Friends of individuals who received the intervention significantly reduced their drinking, with higher reductions occurring in networks with greater social influence. However, all effect sizes were small (e.g., average per-friend reduction of 0.07 on a 5-point drinking scale).
Conclusions:
Individually-targeted alcohol interventions may have small effects on reducing the drinking of non-targeted adolescents, with social influence being a mechanism that drives such effects. Due to small effect sizes, many adolescents may need to receive alcohol interventions to produce measurable effects on drinking outcomes for non-targeted individuals.
Keywords: computer simulation, diffusion, peer socialization, social influence, social selection
Adolescents’ drinking tends to be correlated with the drinking of their peers (Barnett, Ott, & Clark, 2014; Leung, Toumbourou, & Hemphill, 2014). This correlation is often attributed to social influence, where the drinking of one’s friends affects their own drinking (Kelman, 1958), and social selection1, where individuals tend to create and maintain friendships with people who drink similarly to themselves (Verbrugge, 1977). Social influence and social selection often occur simultaneously (Huang et al., 2014; Mathys, Burk, & Cillessen, 2013; Mercken, Steglich, Knibbe, & de Vries, 2012; Parra et al., 2007), although the magnitude of these effects can vary by age and numerous protective factors (e.g., parental monitoring; Fairlie, Wood, & Laird, 2012; Mercken et al., 2012; van der Vorst, Engels, & Burk, 2010).
When social influence and social selection operate simultaneously, they create reciprocal and potentially nonlinear effects. With social influence, the drinking of an individual’s friends affects their own drinking, and with social selection that individual’s own drinking affects who they select as friends, who, in turn, influence that individual’s drinking, and so on. The resulting feedback loop can produce nonlinear effects where the impact of a change within the system – such as an individual receiving an alcohol-focused intervention – is difficult to predict. For example, it is possible that exposing an individual to an alcohol intervention could result in reduced drinking among that individual’s friends, due to that individual reducing their drinking and in turn influencing their friends’ drinking (known as a contagion effect; VanderWeele & Christakis, 2019). Alternatively, it is also possible that alcohol-focused interventions have little or no contagion effects because the non-targeted individuals could still be influenced by numerous other peers who do not reduce their drinking (i.e., due to social influence) or because individuals who successfully reduce their drinking may tend to terminate friendships with their heavy drinking friends and initiate friendships with lighter drinking individuals (i.e., due to social selection), reducing the ability for the person targeted for intervention to influence other heavier drinking individuals.
Modeling contagion effects in social networks using human subject designs is often particularly challenging (see Galea, Hall, & Kaplan, 2009; Hunter-Reel, McCrady, & Hildebrandt, 2009; Latkin & Knowlton, 2015; Leonard, 2015). Although there are methods available to identify potential contagion effects, they often require large samples, complex designs, and/or causal effect analyses with strong assumptions that may be difficult to meet in real-world studies (e.g., An, 2018; Barnett et al., 2019; VanderWeele & Tchetgen Tchetgen, 2011). Moreover, researchers can only control certain variables experimentally, such as whether certain individuals receive alcohol interventions, but they cannot control other important mechanisms that could potentially moderate those effects, such as the level of social influence or social selection present in the networks being studied.
There is a growing body of literature that articulates methods for modeling the effects of interventions on non-targeted social network members in observational studies, cluster randomized trials, and agent-based modeling studies (An 2018; Benjamin-Chung et al., 2017; Kang & Keele, 2018; Marshall & Galea, 2015). Computer simulations of social networks can potentially complement this work by testing whether alcohol interventions are likely to affect the drinking of non-targeted individuals through effects that are typically observed in social networks, such as drinking-related social influence or social selection in adolescent social networks. In particular, simulations of social networks can allow researchers to control and manipulate underlying social network mechanisms that could affect longitudinal changes in friendships and drinking, in contrast to estimating the strength with which such parameters operate using real-world data. Simulation methods also allow for testing of experimental manipulations that are feasibly or ethically impossible to manipulate in human studies, including the manipulation of network-level parameters, such as social influence and social selection, or by modeling hypothetical scenarios where the same individual is hypothetically exposed to different interventions. As a result, simulations can operate without unmodeled effects that would inherently be present in real-world studies, directly control the potential mechanisms driving the effects of interest, remove the presence of potential confounding variables, and directly model hypothetical outcomes from the same individual being exposed to different interventions. For example, in a previous simulation study that used similar methods to those described below, we found that increasing the amount of social influence and social selection present within social networks increased the extent to which individuals tended to cluster into segregated groups of heavier drinking versus abstaining and lighter drinking individuals (Hallgren et al., 2017). Additionally, when we compared the efficacy of several hypothetical individual-level intervention strategies, each of which targeted the same heavy-drinking individual, we found that reducing that individual’s susceptibility to social influence reduced their drinking more than the other social network-based intervention strategies that were tested (e.g., reducing the individual’s contact with heavy drinking individuals, increasing their contact with non-drinking individuals), especially when social influence and social selection were high within the social networks. In other words, the simulations suggested that decreasing an individual’s susceptibility to social influence could be an effective intervention strategy, especially when social influence and social selection were strong and individuals were in friendship clusters that were predominantly composed of other heavier drinking individuals. These findings complemented real-world studies that showed the positive impact of intervention strategies that reduce susceptibility to social influence (e.g., interventions that enhance drink-refusal skills or parental monitoring; Fairlie et al., 2012; van der Vorst et al., 2010).The findings also extended previous studies by suggesting that reducing adolescents’ susceptibility to social influence may be particularly effective among adolescents who are subject to a greater degree of social influence and social selection.
Although the previously described simulation study tested the effects of different intervention strategies on the drinking outcomes for individuals who were targeted for interventions, we are unaware of studies that have tested whether alcohol interventions that successfully reduce the drinking of a targeted adolescent are associated with reductions in drinking of that adolescent’s friends who were not recipients of the intervention. The aim of the present study was to address this gap by simulating social networks of adolescents to understand the extent to which individually-targeted alcohol interventions may be expected to reduce the drinking of non-targeted peers in the presence of typically-observed social network effects.
Method
Overview
The following sections introduce the real-world reference study that provided the parameters used for our simulations and the procedures for simulating longitudinal social networks. We then describe the experimental procedures for testing the simulated intervention and for measuring contagion effects.
Reference Study
Simulation parameters were obtained from a study of longitudinal social networks of 10th grade students in five southern California high schools (mean N=287 per network, total N=1434; Huang et al., 2014). We selected this as the reference study because Huang et al. observed complete social networks within each high school and estimated several social network parameters that described the drinking and friendship dynamics for the real-world high school 10th graders they studied. Drinking statuses were assessed for each adolescent in the reference study using a 5-point composite scale based on past drinking behaviors and current drinking intentions (1=no drinking and no intention to drink in the next year, 2=no drinking but intention to drink in the next year, 3=ever drank, 4=past-month drinking, 5=past-month binge drinking). Each adolescent was also asked to identify up to 19 friends (mean number of friends identified=5.17 per adolescent) using a photo roster of students in their grade. Drinking and friendships were assessed again 7 months later, then modeled longitudinally using stochastic actor-based models (SABMs; described below). Huang et al. estimated longitudinal parameters that described how friendships, drinking, smoking, and social media use changed over time, which included results suggesting that alcohol-related social influence and social selection operated simultaneously. Only the friendship- and drinking-related parameters were modeled in the present study (i.e., smoking, demographic, and social media usage parameters were excluded and drinking status was the only actor-level variable generated during the simulation process), and thus there were no covariate effects or potential confounders included in the simulations.
Stochastic Actor Based Models (SABMs)
SABMs (Snijders, 1996, 2001; see Snijders, van de Bunt, & Steglich, 2010 for overview) were modeled using RSiena software (Ripley et al., 2020). They are designed to model longitudinal, interdependent changes in social ties (e.g., friendships) and personal characteristics (e.g., drinking statuses) for a defined network of actors (e.g., 10th graders in the same school). SABMs assume changes in friendships and drinking behaviors occur stochastically (i.e., changes in friendships and drinking statuses are modeled probabilistically rather than deterministically) and as Markov processes (i.e., the state of the system at time t+1 is predicted only by the state of the system at time t). They also assume friendships between actors are not necessarily bidirectional; for example, actor i may consider actor j to be their friend, regardless of whether actor j considers actor i their friend. The models also weigh all social ties equally (i.e., all friendships are equally influential) and assume that friendships and actor characteristics change relatively slowly and represent status-like variables (e.g., drinking status over several weeks or months) rather than changing quickly and representing momentary variables (e.g., drinks consumed within a single day).
Friendships and drinking were free to change longitudinally under the guidance of an objective function that includes several effects specified by the researcher. Common effects include an outdegree effect, where individuals tend to extend relatively few friendships out of the total number of possible friendships, a reciprocity effect, where actors who receive friendships from one person tend to identify that person as their friend (i.e., j → i, given that i → j), and a transitivity effect, where actors tend to become friends with friends of their own friends (i → h, given that i → j and j → h). Many networks also have a small three-cycle effect, where actors tend to avoid non-hierarchical cyclical tie patterns (e.g., it is less likely that k → i given that i → j and j → k), which is reflective of the tendency for friendships to exhibit some degree of hierarchy (Snijders et al., 2010). Social selection was modeled using a similarity effect, indicating how much individuals extend and maintain friendships with others who drink similarly to themselves and retract friendships from individuals who drink differently from themselves. We also included drinking ego and drinking alter effects, which indicate the extent to which individuals with higher levels of drinking tend to extend and receive more ties from other actors, respectively (e.g., Ali, Amialchuk, & Nikaj, 2013).
Drinking behaviors are guided by a separate objective function that likewise includes a number of researcher-specified effects, including a linear shape effect, which models the distribution of the behavioral variable (e.g., mean value of drinking on the 5-point measurement scale), and a quadratic shape effect, which models the impact of current drinking status on future changes in drinking status (e.g., for higher values, an individual who drinks heavily or abstains is more likely to continue drinking heavily or abstaining, respectively, in the future). Social influence was modeled using an average alter effect, indicating how strongly individuals tend to change their own drinking to be more similar to the average drinking of their friends.
The parameters for the effects described above, which guide the longitudinal changes in friendships and drinking, were obtained directly from the reference study (Huang et al., 2014; see Table 1) and were used to guide longitudinal changes in the simulated social networks studied here. When used for modeling real-world longitudinal network data, the RSiena program (Ripley et al., 2020) would utilize a simulation-based model-fitting procedure to estimate the most likely direction and magnitude of each friendship and behavioral effect described above, based on the observed data. However, longitudinal networks can be simulated using this model-fitting algorithm to simulate plausible data that would be expected to result from the friendship and behavioral effects that are pre-specified by the researchers (Snijders, 2010), which was done for the current study. Whether fitting real-world data or simulating it, RSiena simulates a series of decisions made by individual actors to sequentially change their friendships and drinking statuses. At each decision point, one actor in the network is randomly selected and the model identifies all possible changes that actor could make with regard to their friendships – for example, adding a new friendship where one does not exist, deleting a friendship that already exists, or making no changes to any of their friendships. The probability of the actor making each of these possible changes to their network is computed similarly to multinomial logistic regression, where potential changes that are more consistent with the parameters specified above (e.g., levels of reciprocity, transitivity, three-cycles, social selection, etc.) have higher probabilities of being selected by the target actor, and potential changes that are less consistent with the parameters above have lower probabilities of being selected. A random number is used to select a single outcome (e.g., a single friendship is formed or removed, or no change is made at all to the network), weighted by the probabilities computed in the prior step. The number of times this process is repeated is guided by the friendship rate parameter, which identifies the mean number of times each actor considers this type of friendship change between the two observation periods (e.g., friendship rate of 13.17 in Huang et al. indicates a mean of 13.17 instances per actor where a specific friendship change was considered during the 7-month observation period). Similar steps are used to guide changes in drinking behaviors, where the program randomly selects a network member, uses the drinking behavior parameters described above to derive probabilities of the actor making a change to their drinking status (e.g., drinking may increase, decrease, or stay the same, and changes that are more consistent with the linear and quadratic shape effects, social influence, etc. are more likely to be chosen), and a single change to the actor’s drinking behavior is randomly selected. Computational details for completing these steps are not provided here but are described more thoroughly in other sources (e.g., see Snijders et al., 2010 for detailed overview).
Table 1.
Network and Drinking Parameters Used in Simulations
| Values used for each friendship effect across levels of social selection | ||||||
|---|---|---|---|---|---|---|
| Friendship effects | Description of friendship effect | None | 1x | 2x | 3x | |
| Outdegree | Controls number of friendships formed | −2.41 | −2.53 | −2.73 | −3.02 | |
| Social selection (drinking similarity) | Tendency to form friendships based on similarity in drinking statuses | 0 | 0.39 | 0.78 | 1.17 | |
| Drinking alter | Tendency for heavier drinking individuals to receive more friendships | 0.04 | 0.04 | 0.04 | 0.04 | |
| Drinking ego | Tendency for heavier drinking individuals too extend more friendships | 0.03 | 0.03 | 0.03 | 0.03 | |
| Transitivity | Tendency to form relationships with friends-of-friends | 0.49 | 0.49 | 0.49 | 0.49 | |
| Reciprocity | Tendency to reciprocate friendships to others who extend ties to you | 1.85 | 1.85 | 1.85 | 1.85 | |
| Three-cycle | Tendency for network closure | −0.35 | −0.35 | −0.35 | −0.35 | |
| Friendship rate | Typical number of opportunities to change friendships | 13.17 | 13.17 | 13.17 | 13.17 | |
| Values used for each drinking effect at each level of social influence | ||||||
| Drinking effects | Description of drinking effect | None | 1x | 2x | 3x | 4x |
| Linear drinking | Linear distribution of drinking (higher indicates heavier drinking, on average) | −0.32 | −0.32 | −0.32 | −0.32 | −0.32 |
| Quadratic drinking | Quadratic distribution of drinking (higher indicates that abstaining and heavier drinking individuals tend to maintain their drinking status over time) | 0.09 | 0.09 | 0.09 | 0.09 | 0.09 |
| Social influence (average alter) | Tendency to change drinking status toward the average drinking status of friends | 0 | 0.19 | 0.38 | 0.57 | 0.76 |
| Drinking rate | Typical number of opportunities to change drinking status | 2.24 | 2.24 | 2.24 | 2.24 | 2.24 |
Note. Values at the “1x” levels are reference values obtained from a study of social network analyses with 10th grade high social networks (Huang et al., 2014). Levels of 2x, 3x, and 4x indicate that social selection or social influence were scaled by these factors, relative to the reference study values. In the present study, all levels of social selection were crossed with all levels of social influence. Outdegrees were adjusted slightly from their original values of −2.66 at each level of social selection to provide approximately 5.17 outgoing ties per individual.
Experimental Design
Social influence and social selection manipulation.
All simulation parameters were obtained from the reference study. Further, we experimentally manipulated the levels of social influence and social selection to be absent and 1–4 times higher (social influence) and 1–3 times higher (social selection) than the values observed in the reference study, with the values of social selection and social influence held constant within each iteration of the simulation.
Alcohol intervention.
The procedure for simulating longitudinal networks and imitating an alcohol “intervention” is illustrated in Figure 1. Networks were first initialized with random drinking statuses and random friendships among individuals (Figure 1, panel A; however, note that n=287 in the simulated networks). The initial number of friendships per individual and the distribution of drinking statuses matched the distributions reported in the reference study. Then, the networks evolved freely according to the friendship and behavioral effects as described above2, including the selected values of social influence and social selection, creating networks with friendship and drinking structures that were more reflective of the specified network and drinking parameters (Figure 1, panel B). A single randomly selected heavy drinking individual (i.e., with a value of 5 on the 5-point drinking scale) was then identified as the target for the intervention. An exact copy of the network was created, and in one copy the targeted individual underwent an experimental condition reflecting successful alcohol “intervention” where their drinking status was changed to the lowest value of 1. In the other copy of the network, the targeted individual experienced no manipulation (i.e., control condition). The two networks were identical in all ways except the experimental manipulation (single actor with changed drinking status) and no additional manipulations occurred. Each network evolved independently using the same set of friendship and behavioral effects as before for both conditions (intervention and control), with all individuals (including the targeted individual) free to make changes in their drinking and friendships over a period of time reflecting the 7-month period in the reference study. Of note, the simulation was agnostic as to the nature of the alcohol intervention that led the targeted individual to change their drinking. It is also assumed that the intervention’s only direct effect was to change the targeted individual’s drinking status (i.e., all subsequent effects that stem from this change are indirect effects of the intervention occurring through the effect of the targeted individual’s change in drinking status because all other effects were held constant for both conditions). The drinking statuses of all individuals in the networks were then recorded at the end of the simulation, and the process was repeated 500 times for each combination of social influence and social selection.
Figure 1. Simulation procedures.
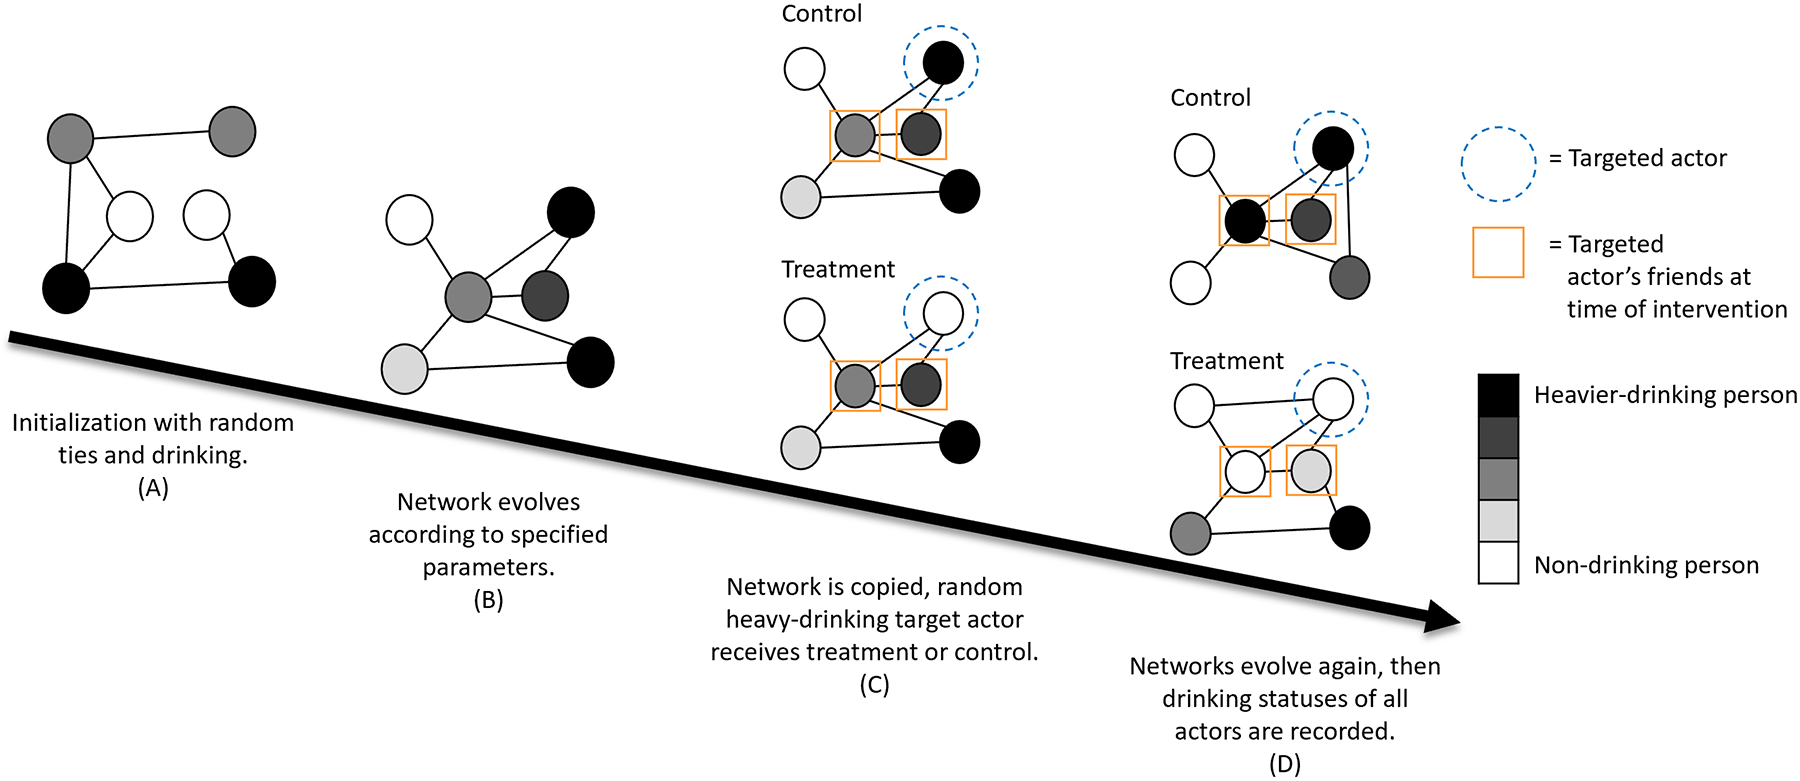
Networks are first generated with completely random ties and drinking statuses (A), then evolve according to the parameters specified in the text and Table 1 (B). The simulated networks are then copied (C) and the same heavy-drinking network member in both copies (dashed circle) is targeted for either the intervention (reduced drinking) or the control condition (no change). The network then evolves again according to the same parameters as before (D) and the drinking statuses of the targeted actor’s friends at the time of the intervention (squares) are recorded. The process is then repeated for 500 trials across combinations of social influence and social selection. Nodes indicate individual adolescents. Darker nodes indicate heavier drinking. Lines between nodes indicate friendships. The simulated networks had 287 actors; only 6 actors are shown here for illustration.
Analytic Plan
Our primary aim was to evaluate the impact of an individually-focused alcohol intervention on the drinking outcomes of individuals who were not directly targeted by the intervention. Our primary outcome measure was the mean end-of-simulation drinking status of individuals who identified the target individual as their friend at the time of the alcohol intervention; for brevity, we call this measure “friends’ drinking”3. In the analyses described below, we directly compared friends’ drinking between the two copied versions of each network, where all parameters, including those that guided drinking and friendship changes, remained completely identical between the network copies and only the receipt of the alcohol intervention differed between the two conditions. In this manner, simulated outcomes of the same target actor receiving versus not receiving the intervention, while holding all other factors constant, can be directly observed, which would typically be impossible with real-world data. Comparing the differences in friends’ drinking for the intervention and control condition, with all other parameters being exactly the same between conditions, allowed us to directly compare simulated outcomes for friends’ drinking and attribute any differences to the experimental manipulation (i.e., changes in the targeted actor’s drinking), reflecting a contagion effect.
Point estimates of friends’ drinking were entered as dependent variables in a series of models that tested three hypotheses: (a) that friends’ drinking would be lower in the intervention condition compared to control in the networks that were most closely modeled after the reference study, reflecting a contagion effect; (b) that the degree of contagion would increase as the amount of social influence present in the networks increased to levels higher than what was observed in the parent study due to the targeted individual potentially having a greater degree of influence on their friends; and (c) that contagion effects would be larger when the target individual had more heavy-drinking friends (i.e., higher average alter drinking), since those friends would have a larger discrepancy in their drinking statuses compared to the targeted individual, providing more opportunity for those friends to decrease their drinking from heavier drinking to lighter drinking.
Hypothesis A was tested by evaluating differences between the intervention and control conditions in the networks modeled with identical social influence and social selection as the reference study. A paired sample t-test was used to directly compare the repeated observations of each network (i.e., network copies with the same individual targeted for intervention versus no change) within each iteration of the simulation. Hypotheses B and C evaluated differences between the intervention and control conditions across combinations of social influence, social selection, and friends’ pre-treatment drinking using linear mixed-effects regression in R (Bates, Mächler, Bolker, & Walker, 2015). Simulation iterations were modeled as random effects to account for the correlation among outcomes observed for the duplicated networks within each simulation iteration. All other predictors were modeled as fixed effects. Treatment conditions were dummy coded (control = 0, intervention = 1). Levels of social influence and social selection were treated as continuous covariates. A condition × social selection × social influence interaction and all subordinate two-way interactions and main effects were included as predictors of friends’ drinking to evaluate hypothesis B. A condition × social selection × social influence × average alter drinking interaction and all subordinate interactions and main effects were included as predictors of friends’ drinking to evaluate hypothesis C. Significant interactions were treated as omnibus tests that were followed with tests of simple mean differences between intervention and control conditions within each combination of social influence and social selection to more specifically understand the nature of observed interactions and to model effect sizes in practical terms using the original 5-point drinking scale. 95% confidence intervals were estimated to characterize the uncertainty of parameter estimates based on variability in outcomes observed across simulation iterations. Due to the large volume of results, the presentation of the findings focuses on describing the patterns of results rather than drawing conclusions about each specific combination of conditions.
Results
Analyses of targeted actors’ drinking indicated that the individuals targeted for intervention significantly reduced their drinking and typically maintained those reductions through the end of the simulation (see supplemental materials).
Hypothesis A: Contagion Effect in Networks Modeled After Real-World Reference Study
A paired sample t-test evaluated contagion effects in the networks that were modeled with identical social influence and social selection parameters as the reference study. In these networks, friends’ mean drinking was significantly lower in the intervention condition (M=2.61, SD=0.73) compared to the control condition (M=2.68, SD=0.75), t(493)=−2.39, p=0.02. Although statistically significant, the magnitude of this contagion effect was small, with friends’ drinking in the intervention vs. control condition only differing by −0.07 points on the 5-point drinking scale (Cohen’s d=−0.10).
Hypothesis B: Effect of Social Influence on Contagion
Mixed model results showing the impact of the intervention on friends’ drinking across networks with increasing levels of social influence and social selection are shown in Table 2. There was a significant two-way interaction of condition × influence, suggesting that the intervention reduced friends’ drinking more than control (i.e., greater degree of contagion) as social influence increased. Although not involving the condition effect, there were also significant main effects for influence and selection and a significant influence × selection interaction, all of which relate to the tendencies for targeted actors to have heavier drinking friends, on average, as social influence and social selection increased (Hallgren et al., 2017). To help interpret the condition × influence interaction related to hypothesis B, the interaction was further characterized in Figure 2, which displays mean values of friends’ drinking (y-axis) across the intervention conditions (separate bars) and across levels of social influence (rows) and social selection (columns). Bars with asterisks above them indicate that there was a significant difference between the intervention and control condition within a given combination of social influence and social selection. (A negative sign is included in parentheses to indicate that friends’ drinking was, on average, lower in the treatment group than in the control group for each significant difference between intervention and control condition.) In Figure 2, There were no significant contagion effects when social influence was absent (top row). When social influence was modeled at the same level as the reference study (1x influence) there were significant contagion effects when social selection was absent or present at the same level as the reference study (no selection or 1x selection, respectively), but not at higher levels of social selection. When social selection was modeled at twice the level of the parent study or higher (2x, 3x, or 4x influence) there were significant contagion effects across all levels of social selection. Still, however, the magnitude of contagion effect was small across combinations of social influence and selection, with the difference in friends’ drinking between intervention and control conditions ranging from −0.20 to 0.04 on the 5-point drinking scale.
Table 2.
Mixed Model Testing Intervention Effects on the Targeted Individuals’ Friends
| Effect | Estimate | SE | 95% CI | p | |
|---|---|---|---|---|---|
| LL | UL | ||||
| (Intercept) | 2.33 | 0.02 | 2.28 | 2.37 | < .001 |
| Condition | −0.02 | 0.02 | −0.06 | 0.02 | .24 |
| Influence | 0.94 | 0.05 | 0.84 | 1.05 | < .001 |
| Selection | 0.47 | 0.03 | 0.41 | 0.54 | < .001 |
| Condition × Influence | −0.23 | 0.04 | −0.31 | −0.14 | < .001 |
| Condition × Selection | 0.00 | 0.03 | −0.05 | 0.06 | .88 |
| Influence × Selection | 0.56 | 0.07 | 0.42 | 0.70 | < .001 |
| Condition × Influence × Selection | 0.05 | 0.06 | −0.07 | 0.17 | .40 |
| Intercept SD | 0.67 | 0.66 | 0.68 | ||
| Residual SD | 0.49 | 0.49 | 0.50 | ||
Note. Significant effects are indicated with bold font. Intercept SD indicates the standard deviation of random intercepts for each simulation iteration. Residual SD indicates the standard deviation of residual errors. Confidence intervals were estimated using likelihood profiles with cutoffs based on the likelihood ratio test.
Figure 2. Effects of the simulated drinking intervention on the average drinking status of targeted actors’ friends.

*p < .05, **p < .01, ***p < .001. Negative signs indicate that the outcome was lower for treatment vs. control.
Hypothesis C: Effect of Friends’ Pre-Intervention Drinking on Contagion
Table 3 shows results from analyses testing whether the degree of contagion was affected by friends’ pre-intervention drinking (i.e., average alter drinking). There were three significant effects that involved condition, including a three-way condition × selection × average alter drinking interaction, a two-way condition × influence interaction, and a main effect of condition. Unrelated to our study hypotheses (i.e., not involving condition), there was also a significant three-way interaction of influence × selection × average alter drinking and significant main effects for influence and average alter drinking.
Table 3.
Mixed Model Testing Intervention Effects on the Targeted Individuals’ Friends, Moderated by Friends’ Pre-Intervention Drinking
| Effect | Estimate | SE | 95% CI | p | |
|---|---|---|---|---|---|
| LL | UL | ||||
| (Intercept) | 2.92 | 0.02 | 2.88, | 2.96 | < .001 |
| Condition | −0.05 | 0.03 | −0.10, | −0.001 | .047 |
| Influence | 0.32 | 0.04 | 0.25, | 0.40 | < .001 |
| Selection | 0.02 | 0.02 | −0.03, | 0.06 | .44 |
| Avg. Alter Drinking | 0.72 | 0.02 | 0.68, | 0.76 | < .001 |
| Condition × Influence | −0.18 | 0.05 | −0.28, | −0.08 | < .001 |
| Condition × Selection | 0.04 | 0.03 | −0.03, | 0.10 | .28 |
| Influence × Selection | 0.04 | 0.05 | −0.06, | 0.14 | .43 |
| Condition × Avg. Alter Drinking | −0.05 | 0.03 | −0.11, | 0.01 | .08 |
| Influence × Avg. Alter Drinking | 0.07 | 0.04 | −0.02, | 0.16 | .11 |
| Selection × Avg. Alter Drinking | 0.01 | 0.02 | −0.03, | 0.06 | .56 |
| Condition × Influence × Selection | −0.03 | 0.07 | −0.17, | 0.10 | .64 |
| Condition × Influence × Avg. Alter Drinking | 0.06 | 0.06 | −0.06, | 0.18 | .31 |
| Condition × Selection × Avg. Alter Drinking | 0.07 | 0.03 | 0.0003, | 0.13 | .049 |
| Influence × Selection × Avg. Alter Drinking | 0.10 | 0.05 | 0.001, | 0.20 | .048 |
| Condition × Influence × Selection × Avg. Alter Drinking | −0.04 | 0.07 | −0.18, | 0.09 | .53 |
| Intercept SD | 0.11 | 0.09, | 0.13 | ||
| Residual SD | 0.49 | 0.49, | 0.50 | ||
Note. Significant effects are indicated with bold font. Intercept SD indicates the standard deviation of random intercepts for each simulation iteration. Residual SD indicates the standard deviation of residual errors. Confidence intervals were estimated using likelihood profiles with cutoffs based on the likelihood ratio test.
To facilitate interpretation of these numerous effects, we present simple two-way interactions in Figure 3 by showing the relationship of the moderator variable (average alter drinking – i.e., the mean drinking status for the targeted individual’s friends, pre-intervention, shown on the x-axis) and treatment condition (intervention vs. control, shown as solid vs. dashed lines, respectively) predicting the mean drinking status for the target actor’s friends at the end of the simulation (y-axis), across combinations of social influence and social selection. The simple slopes of each line indicate the expected value of friends’ drinking at the end of the simulation based on friends’ pre-intervention drinking and treatment condition. Significant differences in these slopes were identified by testing two-way interactions of intervention × average alter drinking within each combination of social influence and social selection to better understand the omnibus moderation tests. Significant intervention × average alter drinking effects were only present in three combinations of social influence and social selection; in one case the intervention effect was largest when friends’ pre-intervention drinking was highest (2x selection, 2x influence), in another case the intervention effect was largest when friends’ pre-intervention drinking was lowest (2x selection, 3x influence), and in the other case there were only marginal differences between intervention and control along all levels of friends’ pre-intervention drinking (3x selection, 1x influence). In summary, despite the presence of a significant omnibus condition × selection × average alter drinking interaction, follow-up contrasts revealed no consistent patterns suggesting that there were larger (or smaller) contagion effects in relation to the pre-intervention drinking levels of target actors’ friends.
Figure 3. Effects of the simulated drinking intervention on the average drinking status of targeted actors’ friends, moderated by the targeted actors’ friends’ pre-intervention drinking.

Solid lines reflect the intervention condition; dashed lines reflect the control condition. The x-axis ranges for regression lines correspond with the observed range of friends’ pre-intervention heavy drinking within the simulated networks. Significant moderator-by-condition interactions, stratified within specific combinations of social influence and selection, are indicated by asterisks, * p < .05.
Supplemental analyses also tested whether contagion effects on friends’ drinking were moderated by the popularity (indegree) of the targeted individual at the time of the intervention; we found no consistent pattern for such moderation effects. Additional supplemental analyses tested for contagion to friends-of-friends of the target actor (i.e., individuals who were exactly two degrees from the target individual) and the full social network (i.e., all individuals in the network except the target actor). The results are detailed in the supplemental materials and found (1) no consistent evidence of contagion to friends-of-friends or full social networks and (2) no consistent evidence that contagion effects to friends-of-friends or full social networks were moderated by the popularity (indegree) of the targeted individual at the time of the intervention.
Discussion
The present study conducted experiments with simulated social networks that were modeled to follow the friendship and drinking dynamics of 10th graders from Southern California high schools (Huang et al., 2014). We found that assigning a randomly-selected heavy drinking adolescent to an individually-targeted alcohol intervention that reduced their drinking could potentially lead to significant reductions in that person’s friends’ drinking, despite those friends not being directly targeted by the intervention. This pattern is consistent with a contagion effect, wherein the drinking outcome of the individual receiving the intervention affected the drinking outcomes of individuals not receiving alcohol interventions. However, the size of the contagion effect was always small, including when the effect of social influence was modeled to be two, three, or four times stronger than what was observed in real-world networks.
Providing alcohol-focused interventions to adolescents may produce significant but small contagion effects to other individuals under conditions that are similar to the networks modeled here. Despite the small average contagion effect, it is possible that cumulative effects could be large if multiple adolescents receive alcohol interventions. For example, the intervention only reduced friends’ drinking by 0.07 points on a 5-point scale in the networks that were most similar to the reference study, which is equivalent to about one out of every 14 friends of targeted individuals reducing their drinking by 1 point (e.g., from 5=past-month binge drinking to 4=past-month non-binge drinking). However, it is important to note that the 0.07-point difference reflects the average amount of change across all friends of the targeted individual. Since the adolescents in the reference study identified 5.17 friends on average, it is possible that for about every three targeted individuals who received the intervention, one of their friends reduced their drinking by 1 point on the 5-point scale (i.e., three targeted individuals × 5.17 friends per individual ≈ 15 total friends of target actors). Although this difference is small on a per-person basis, it could still produce a clinically significant benefit to population health if the contagion effect is widespread by targeting numerous adolescents for interventions. These findings also suggest that brief interventions and prevention programs targeting heavy drinking may be even more effective and cost-effective as public health approaches to address heavy drinking, given the broader influences that extend beyond the targeted individual.
Our results suggest that social influence may be a key mechanism driving potential contagion effects, based on the presence of contagion effects only within networks that had social influence effects included. Our previous network simulations additionally showed that interventions that reduce target actors’ susceptibility to social influence could potentially lead target actors to reduce their own drinking through effects that may occur naturally in some social networks (i.e., high levels of social influence and social selection; Hallgren et al., 2017). In combination, these studies provide evidence suggesting that normative social network effects, including social influence and social selection, may be leveraged to influence the drinking outcomes of adolescents who are targeted for interventions (i.e., by changing the way targeted individuals respond to their friends’ drinking; Hallgren et al., 2017), which may in turn be leveraged to influence the drinking outcomes of their non-targeted friends (i.e., via contagion effects observed in the current study).
Importantly, the observed contagion effects were still relatively small even when social influence was considerably larger than what was observed in the reference study. There are several plausible reasons that contagion effects were not larger, even as social influence increased. When social selection was present, targeted individuals were more likely to remove friendships with their heavy-drinking friends that they had at the time of the intervention, which could reduce their ability to influence those heavy-drinking individuals. Additionally, targeted individuals’ ability to influence their friends was in direct competition with the influence of other friends, many of whom had heavy drinking and each of whom had an equally strong influence on their friends’ drinking as the targeted actor (i.e., the degree of social influence was constant across all friends). This may have attenuated the strength of any contagion effects and could potentially explain the lack of support for hypothesis C, since actors in heavy-drinking friendship groups may have had minimal influence on their friends relative to other heavy drinking friends within the same friendship group.
Few studies have tested whether alcohol intervention outcomes spread to non-targeted individuals. For example, a secondary analysis of data from the Combined Pharmacotherapies and Behavioral Interventions (COMBINE) Study found that adults who received psychotherapy reported small decreases in their spouses’ drinking; however, spouses’ drinking was measured indirectly through patients’ self-reports and the effects of the interventions on other non-spouse network members (e.g., friends) were not evaluated (Fletcher & Marksteiner, 2017). One ongoing trial is currently testing whether intervention effects spread to non-targeted peers by comparing the effects of a brief, alcohol-focused intervention administered to first-year, heavy-drinking college students who are identified as highly influential vs. a no-treatment condition and evaluating the impact on non-targeted individuals (Barnett et al., 2019). Although our simulated networks were modeled after a different population, the results of our study suggest that there could be promise for expecting a small contagion effect to occur through typical social network effects. Our study also lends support for Barnett et al.’s decision to specifically target heavier-drinking individuals who may be in positions to have greater drinking-related social influence. Previously completed research has demonstrated contagion effects for harassment-focused interventions, where randomizing highly influential high school students to a harassment-focused intervention created positive changes in harassment-related perceptions and behaviors of other students within the same schools (Paluck & Shepherd, 2012). Both of these trials required large sample sizes and complex designs and had limited ability to control the mechanisms that can potentially moderate contagion effects (e.g., social influence, social selection). Simulation studies, including the current study, may help complement such studies by estimating the potential magnitude of contagion effects under varying conditions, which may help inform and optimize efforts to predict and test contagion effects in real-world settings.
The present study has noteworthy limitations. Our modeling approach required assumptions and simplifications of complex behaviors that limit generalizability. For example, all social ties were weighted equally despite some real-world friendships often being more important than others. Potentially important relationships (e.g., parents) and behaviors (e.g., smoking, mental health symptoms) that can influence drinking were not included (Kenney et al., 2018). Social influence was driven by the drinking behaviors of friends, even though perceptions about friends’ drinking may be equally or more influential (Cox et al., 2019; DiGuiseppi et al., 2018). Only heavy drinking individuals were targeted for intervention, and therefore the effects observed here may differ if the individuals targeted for alcohol interventions have a broader range of drinking statuses. Our reference sample consisted of 10th graders in Southern California high schools, which may not generalize to other populations (e.g., young adults, people with alcohol use disorder).
The present study also has noteworthy strengths. The use of simulations complements real-world trials and observational studies that aim to understand how individuals influence their peers’ drinking. The use of simulations also provided a greater degree of knowledge and control over the underlying mechanisms that affected peer networks and drinking compared to what is knowable or controllable in human studies. Experimental manipulations could be conducted on identical copies of networks and repeated numerous times to facilitate robust comparisons of experimental effects. Moreover, the use of simulations can complement and inform real-world trials and observational studies that test interventions within social networks.
Conclusion
The social environment plays a key role in affecting alcohol use. Simulations of social networks provide a novel method for modeling alcohol use within longitudinal social networks. When a single adolescent reduces their drinking due to receiving an alcohol intervention, they may exert a significant but small contagion effect by reducing the drinking of their friends who were not directly targeted by the intervention. Future research and intervention efforts may potentially augment understanding of intervention effects by utilizing simulation designs to understand the conditions through which interventions exert their effects in social networks.
Supplementary Material
Public health significance:
This study illustrates the potential for alcohol interventions to have “contagion” effects, where exposing an individual to an alcohol intervention may reduce their friends’ drinking, despite those friends not directly receiving the intervention themselves. Although treatment contagion effects in computer simulations of social networks were generally small on a per-person basis, they may still reflect a significant public health benefit due to the large number of individuals who may be reached within friendship social networks.
Author note:
This work was supported by National Institute on Alcoholism and Alcohol Abuse of the National Institutes of Health, award numbers F31AA021031 and K01AA024796. The content is solely the responsibility of the authors and does not necessarily represent the official views of the National Institutes of Health. The authors wish to thank Dr. J. Scott Tonigan for the helpful guidance he provided on this research.
Footnotes
Also called homophily or assortative mixing (Snijders et al., 2010)
Following Snijders (2010), rate parameters were multiplied by 5 for the first network evolution, allowing them more opportunity to self-organize and devolve from their initially random configuration.
We focus on individuals who were friends with the target actor at the time of the intervention, as opposed to individuals who were friends with the target actor at the conclusion of the simulation. We do this knowing that target actors would often eliminate friendships with their heavier drinking friends after the intervention due to social selection (i.e., target actors stop drinking, and social selection leads them to select new non-drinking friends). Had we measured friends’ drinking based on the target actor’s friendships at the end of the simulation, we’d expect that measure to reflect changes in friendships in addition to changes in the drinking behavior of existing friends.
References
- Ali MM, Amialchuk A, & Nikaj S (2014). Alcohol consumption and social network ties among adolescents: Evidence from Add Health. Addictive Behaviors, 39(5), 918–922. [DOI] [PubMed] [Google Scholar]
- An W (2018). Causal inference with networked treatment diffusion. Sociological Methodology, 48(1), 152–181. [Google Scholar]
- Barnett NP, Clark MA, Kenney SR, DiGuiseppi G, Meisel MK, Balestrieri S, … & Light J (2019). Enrollment and assessment of a first-year college class social network for a controlled trial of the indirect effect of a brief motivational intervention. Contemporary Clinical Trials, 76, 16–23. [DOI] [PMC free article] [PubMed] [Google Scholar]
- Barnett NP, Ott MQ, & Clark MA (2014). The relevance of network prominence and reciprocity of relationships for alcohol use and alcohol-related problems in a college residence hall network. Psychology of Addictive Behaviors, 28(4), 980–989. [DOI] [PubMed] [Google Scholar]
- Bates D, Mächler M, Bolker B, & Walker S (2014). Fitting linear mixed-effects models using lme4. arXiv:1406.5823. [Google Scholar]
- Benjamin-Chung J, Arnold BF, Berger D, Luby SP, Miguel E, Colford JM Jr, & Hubbard AE (2018). Spillover effects in epidemiology: parameters, study designs and methodological considerations. International Journal of Epidemiology, 47(1), 332–347. [DOI] [PMC free article] [PubMed] [Google Scholar]
- Cox MJ, DiBello AM, Meisel MK, Ott MQ, Kenney SR, Clark MA, & Barnett NP (2019). Do misperceptions of peer drinking influence personal drinking behavior? Results from a complete social network of first-year college students. Psychology of Addictive Behaviors, 33(3), 297–303. [DOI] [PMC free article] [PubMed] [Google Scholar]
- DiGuiseppi GT, Meisel MK, Balestrieri SG, Ott MQ, Cox MJ, Clark MA, & Barnett NP (2018). Resistance to peer influence moderates the relationship between perceived (but not actual) peer norms and binge drinking in a college student social network. Addictive Behaviors, 80, 47–52. [DOI] [PMC free article] [PubMed] [Google Scholar]
- Fairlie AM, Wood MD, & Laird RD (2012). Protective effect of parents on peer influences and college alcohol involvement. Psychology of Addictive Behaviors, 26(1), 30–41. [DOI] [PMC free article] [PubMed] [Google Scholar]
- Fletcher J, & Marksteiner R (2017). Causal spousal health spillover effects and implications for program evaluation. American Economic Journal: Economic Policy, 9(4), 144–66. [DOI] [PMC free article] [PubMed] [Google Scholar]
- Galea S, Hall C, & Kaplan GA (2009). Social epidemiology and complex system dynamic modelling as applied to health behaviour and drug use research. International Journal of Drug Policy, 20(3), 209–216. 10.1016/j.drugpo.2008.08.005 [DOI] [PMC free article] [PubMed] [Google Scholar]
- Hallgren KA, McCrady BS, Caudell TP, Witkiewitz K, & Tonigan JS (2017). Simulating drinking in social networks to inform alcohol prevention and treatment efforts. Psychology of Addictive Behaviors, 31(7), 763. [DOI] [PMC free article] [PubMed] [Google Scholar]
- Huang GC, Unger JB, Soto D, Fujimoto K, Pentz MA, Jordan-Marsh M, & Valente TW (2014). Peer influences: the impact of online and offline friendship networks on adolescent smoking and alcohol use. The Journal of Adolescent Health, 54(5), 508–514. 10.1016/j.jadohealth.2013.07.001 [DOI] [PMC free article] [PubMed] [Google Scholar]
- Hunter-Reel D, McCrady BS, & Hildebrandt T (2009). Emphasizing interpersonal factors: An extension of the Witkiewitz and Marlatt relapse model. Addiction, 104, 1281–1290. [DOI] [PMC free article] [PubMed] [Google Scholar]
- Kang H, & Keele L (2018). Spillover effects in cluster randomized trials with noncompliance. arXiv preprint arXiv:1808.06418. [DOI] [PubMed] [Google Scholar]
- Kelman HC (1958). Compliance, identification, and internalization: Three processes of attitude change. The Journal of Conflict Resolution, 2(1), 51–60. [Google Scholar]
- Kenney SR, DiGuiseppi GT, Meisel MK, Balestrieri SG, & Barnett NP (2018). Poor mental health, peer drinking norms, and alcohol risk in a social network of first-year college students. Addictive Behaviors, 84, 151–159. [DOI] [PMC free article] [PubMed] [Google Scholar]
- Latkin CA, & Knowlton AR (2015). Social network assessments and interventions for health behavior change: A critical review. Behavioral Medicine, 41(3), 90–97. doi: 10.1080/08964289.2015.1034645 [DOI] [PMC free article] [PubMed] [Google Scholar]
- Leonard KE (2015). Perspective: Beyond the neural circuits. Nature, 522(7557), S56. 10.1038/522S56a [DOI] [PubMed] [Google Scholar]
- Leung RK, Toumbourou JW, & Hemphill SA (2014). The effect of peer influence and selection processes on adolescent alcohol use: a systematic review of longitudinal studies. Health Psychology Review, 8(4), 426–457. 10.1080/17437199.2011.587961 [DOI] [PubMed] [Google Scholar]
- Marshall BD, & Galea S (2015). Formalizing the role of agent-based modeling in causal inference and epidemiology. American Journal of Epidemiology, 181(2), 92–99. [DOI] [PMC free article] [PubMed] [Google Scholar]
- Mathys C, Burk WJ, & Cillessen AHN (2013). Popularity as a moderator of peer selection and socialization of adolescent alcohol, marijuana, and tobacco use. Journal of Research on Adolescence, 23(3), 513–523. 10.1111/jora.12031 [DOI] [Google Scholar]
- Mercken L, Steglich C, Knibbe R, & de Vries H (2012). Dynamics of friendship networks and alcohol use in early and mid-adolescence. Journal of Studies on Alcohol and Drugs, 73, 99–110. 10.15288/jsad.2012.73.99 [DOI] [PubMed] [Google Scholar]
- Paluck EL, & Shepherd H (2012). The salience of social referents: A field experiment on collective norms and harassment behavior in a school social network. Journal of Personality and Social Psychology, 103(6), 899–915. [DOI] [PubMed] [Google Scholar]
- Parra GR, Krull JL, Sher KJ, & Jackson KM (2007). Frequency of heavy drinking and perceived peer alcohol involvement: Comparison of influence and selection mechanisms from a developmental perspective. Addictive Behaviors, 32, 2211–2225. 10.1016/j.addbeh.2007.02.013 [DOI] [PMC free article] [PubMed] [Google Scholar]
- Ripley R, Snijders TAB, Boda Z, Voros A, & Preciado P (2020). Manual for Siena version 4.0. R package version 1.2–23. https://www.cran.r-project.org/web/packages/RSiena/.
- Snijders TAB (1996). Stochastic actor-oriented models for network change. Journal of Mathematical Sociology, 21(1–2), 149–172. [Google Scholar]
- Snijders TAB (2001). The statistical evaluation of social network dynamics. Sociological Methodology, 31(1), 361–395. doi: 10.1111/0081-1750.00099 [DOI] [Google Scholar]
- Snijders TAB (2010). NetworkSimulation.R: A script for simulation with RSiena. Computer code available online at https://www.stats.ox.ac.uk/~snijders/siena/NetworkSimulation.R.
- Snijders TAB, van de Bunt GG, & Steglich CEG (2010). Introduction to stochastic actor-based models for network dynamics. Social Networks, 32(1), 44–60. doi: 10.1016/j.socnet.2009.02.004 [DOI] [Google Scholar]
- VanderWeele TJ, & Christakis NA (2019). Network multipliers and public health. International Journal of Epidemiology, 48(4), 1032–1037. [DOI] [PMC free article] [PubMed] [Google Scholar]
- VanderWeele TJ, & Tchetgen EJT (2011). Effect partitioning under interference in two-stage randomized vaccine trials. Statistics & Probability Letters, 81(7), 861–869. [DOI] [PMC free article] [PubMed] [Google Scholar]
- van der Vorst H, Engels RCME, & Burk WJ (2010). Do parents and best friends influence the normative increase in adolescents’ alcohol use at home and outside the home? Journal of Studies on Alcohol and Drugs, 71(1), 105–114. [DOI] [PubMed] [Google Scholar]
- Verbrugge LM (1977). The Structure of Adult Friendship Choices. Social Forces, 56(2), 576–597. 10.2307/2577741 [DOI] [Google Scholar]
Associated Data
This section collects any data citations, data availability statements, or supplementary materials included in this article.