

Abstract
This study aimed to define the clinically relevant supratherapeutic dose of rilzabrutinib, an oral Bruton tyrosine kinase (BTK) inhibitor, and evaluate potential effects of therapeutic and supratherapeutic exposures on cardiac repolarization in healthy subjects. This was a two‐part phase I study (anzctr.org.au ACTRN12618001036202). Part A was a randomized, open‐label, three‐period, single‐dose crossover study (n = 12) with rilzabrutinib 100 mg ± ritonavir 100 mg or rilzabrutinib 1200 mg. Part B was a randomized, double‐blind, placebo‐controlled, four‐way, single‐dose crossover study (n = 39) with matched placebo, rilzabrutinib 400 mg ± ritonavir 100 mg, or moxifloxacin (positive control). Primary objectives: part A – pharmacokinetics (PK) of rilzabrutinib ± ritonavir, safety, and optimal dose for Part B; Part B – effect of rilzabrutinib therapeutic and supratherapeutic concentration on electrocardiogram (ECG) parameters. ECGs and PK samples were serially recorded before and post‐dose. In part A, rilzabrutinib 100 mg + ritonavir led to 17‐fold area under the concentration–time curve (AUC0–∞) and 7‐fold maximum plasma concentration (Cmax) increases over rilzabrutinib alone. Rilzabrutinib 1200 mg was discontinued due to mild‐to‐moderate gastrointestinal intolerance. In Part B, rilzabrutinib 400 mg + ritonavir increased rilzabrutinib mean AUC0–∞ from 454 to 3800 ng h/mL and Cmax from 144 to 712 ng/mL. The concentration–QTc relationship was slightly negative, shallow (−0.01 ms/ng/mL [90% CI −0.016 to −0.001]), and an effect >10 ms on QTcF could be excluded within the observed range of plasma concentrations, up to 2500 ng/mL. Safety was similar to other studies of rilzabrutinib. In conclusion, rilzabrutinib, even at supratherapeutic doses, had no clinically relevant effects on ECG parameters, including the QTc interval.
Study Highlights
WHAT IS THE CURRENT KNOWLEDGE ON THE TOPIC?
Oral Bruton tyrosine kinase (BTK) inhibitors, such as rilzabrutinib, have emerged as promising therapeutic approaches to autoimmune disease and hematologic malignancies through their ability to target multiple pathways and cell types involved in inflammation and autoimmunity. To date, only three BTK inhibitors have shown no QTc prolongation in healthy volunteers, an important analysis when assessing new treatment agents.
WHAT QUESTIONS DID THIS STUDY ADDRESS?
The effects of rilzabrutinib on QTc interval are unknown, and this phase I trial was designed to establish the clinically relevant supratherapeutic dose of rilzabrutinib and evaluate potential effects of therapeutic and supratherapeutic exposures on cardiac repolarization in healthy subjects.
WHAT DOES THIS STUDY ADD TO OUR KNOWLEDGE?
Rilzabrutinib, being evaluated for the treatment of immune thrombocytopenia, even at supratherapeutic doses that were reached following drug–drug interaction with ritonavir, a strong CYP3A4 inhibitor, had no clinically relevant effects on electrocardiogram (ECG) parameters, including the QTc interval.
HOW MIGHT THIS CHANGE CLINICAL PHARMACOLOGY OR TRANSLATIONAL SCIENCE?
This combination of safety, pharmacokinetic, and ECG assessments in healthy subjects is a robust approach suggesting that rilzabrutinib is a safe and tolerable BTK inhibitor and supporting further investigations in autoimmune diseases.
INTRODUCTION
Bruton tyrosine kinase (BTK) is a member of the Tec family of tyrosine kinases, with roles in both the adaptive and innate pathways of the immune response. 1 , 2 , 3 It is an essential signaling element downstream of the B‐cell receptor and required for the maturation, survival, function, and differentiation of B cells, and subsequent production of antibodies. 2 , 4 , 5 BTK is also involved in activation of other hematopoietic cells, such as basophils, mast cells, macrophages, neutrophils, and platelets. 6 Owing to its potential to target multiple pathways and cell types involved in inflammation and autoimmunity, BTK inhibition demonstrated activity in various autoimmune diseases, such as pemphigus vulgaris (PV) and immune thrombocytopenia (ITP). 6 , 7 , 8 , 9 , 10
Rilzabrutinib is a novel, potent, and selective inhibitor of BTK. 11 , 12 Due to its covalent features, it has a fast onset and slow off‐rate for target site binding, resulting in prolonged occupancy with relatively low systemic exposure. 11 In preclinical studies, rilzabrutinib showed a dose‐dependent reduction and complete reversal of disease in collagen‐induced arthritis in rats and rapid and significant anti‐inflammatory effects in a rat antibody‐mediated Arthus model, mouse immune thrombocytopenia model, and spontaneous canine pemphigus foliaceus. 9 , 13 Unpublished preclinical safety studies showed no signal for rilzabrutinib (10 μM) on the cardiovascular system using human ether‐a‐go‐go‐related gene (hERG) current in hERG‐transfected HEK293 human embryonic kidney cells. Additionally in a dog telemetry study, there were no drug‐related effects on electrocardiogram (ECG) waveform morphology, intervals (PR, QRS, RR, QT, or QTc), body temperature, or respiratory parameters with 50, 150, and 500 mg/kg rilzabrutinib. Finally, enzymatic studies demonstrated that rilzabrutinib is a substrate for and weak inhibitor of the cytochrome P450 3A4 (CYP3A4), with no significant interaction with other CYP enzymes. 14 To appropriately de‐risk a molecule for QT liabilities, plasma exposure testing under worst‐case scenarios, such as supratherapeutic exposure, is required.
In a phase I healthy volunteer study, a single dose of rilzabrutinib (50–1200 mg) was rapidly absorbed (median time to maximum plasma concentration [Tmax] 0.5–2.5 h). 12 Maximum plasma concentration (Cmax) and mean AUC from time 0 to infinity (AUC0–∞) of rilzabrutinib increased with increasing doses from 50–600 mg. Further increasing the dose from 600 to 1200 mg resulted in similar plasma exposures, indicating that absorption was dose limited. The mean half‐life (t 1/2) ranged from 1.4 to 3.9 h. A moderate fat meal had minimal impact on the rilzabrutinib pharmacokinetics (PK), delaying absorption by ~1 h.
As a result of rilzabrutinib dose‐limited absorption, the clinically meaningful supratherapeutic concentration of rilzabrutinib was achieved through the drug–drug interaction (DDI) with a potent CYP3A4 inhibitor. The objective here was to evaluate the effect of supratherapeutic rilzabrutinib concentrations on ECG parameters in a two‐part study; Part A investigated whether rilzabrutinib alone or combined with ritonavir (potent CYP3A4/P‐glycoprotein [Pgp] inhibitor 15 , 16 ) would result in elevated plasma exposures and inform which approach to assess QT liability in Part B. Because a significant DDI was anticipated due to extensive metabolism, rilzabrutinib was administered at a lower‐than‐therapeutic dose in Part A, prior to giving its full dose in Part B. In addition, ritonavir dose was selected based on prior evidence showing that 100 mg twice daily (b.i.d.) resulted in a potent CYP3A4 inhibition but did not alter QT. 17 , 18 More typical azole drugs were avoided due to the potential for QT prolongation. Part B was a formal thorough QT study evaluating the effects of rilzabrutinib at therapeutic (400 mg) and supratherapeutic concentrations, with moxifloxacin as positive control. Supratherapeutic dose selection of rilzabrutinib was based on the Part A results.
METHODS
Study design
This single‐center, two‐part (Part A and Part B) phase I study was conducted in healthy adult volunteers at Nucleus Network clinical research unit in Melbourne, Australia (clinical trial registration number: ACTRN12618001036202) between May 10, 2018, and February 19, 2019. The protocol was reviewed and approved by the Bellberry Human Research Ethics Committee (EC00458) and was in accordance with the principles of the Declaration of Helsinki (Ethical Principles for Medical Research Involving Human Subjects) and National Health and Medical Research Council, May 2015. All participants provided written informed consent prior to study enrollment. Part A was a randomized, open‐label, three‐period, complete crossover study with a 7‐day washout. Subjects received 100 mg rilzabrutinib, 100 mg rilzabrutinib plus 100 mg ritonavir, b.i.d., or 1200 mg rilzabrutinib, in randomized sequences. Part A evaluated the PK of rilzabrutinib following either 100 or 1200 mg single‐dose administration and the effects of ritonavir plus 100 mg rilzabrutinib on rilzabrutinib PK. In addition, the safety of rilzabrutinib administered with/without ritonavir was assessed. Part A outcomes identified selected doses for Part B.
Part B was a randomized, single‐dose, placebo‐controlled, double‐dummy, four‐period, crossover study with a 7‐day washout between treatment periods conducted per ICH E14 guidance for clinical evaluation of the QT/QTc interval with non‐antiarrhythmic drugs. 19 , 20 The supratherapeutic concentration of rilzabrutinib was reached in combination with ritonavir. Participants received 400 mg rilzabrutinib, 400 mg rilzabrutinib plus 100 mg ritonavir b.i.d., placebo for rilzabrutinib, and 400 mg moxifloxacin in randomized sequences. The central ECG laboratory was blinded to treatment assignment. Weight of active treatment and placebo was matched using rilzabrutinib 100 and 300 mg tablets and over‐encapsulated ritonavir to blind the treatment to study participants, whereas moxifloxacin was given open label. The primary objective for ECG evaluation assessed the effects of therapeutic and supratherapeutic concentrations of rilzabrutinib on the QT interval corrected for heart rate (HR). Secondary ECG objectives assessed the effects of rilzabrutinib on ECG parameters (HR, RR, PR, and QRS intervals), PK of rilzabrutinib, potential relationship between the rilzabrutinib plasma concentrations and QT/QTc changes, safety of rilzabrutinib, and QTc effects of a single oral dose of 400 mg moxifloxacin.
Subjects
Healthy men and non‐pregnant, non‐breastfeeding women aged 18–55 years, with a body mass index (BMI) 18.0–30.0 kg/m2, and weighing ≥45 kg were eligible. Subjects had normal 12‐lead ECG recordings showing normal cardiac rhythm and normal blood pressure at screening. Exclusion criteria were: QTcF intervals between <300 and >450 ms for men or >470 ms for women, history of long or short QT syndrome, resting systolic blood pressure (BP) >90 to <150 mm Hg, or diastolic BP >40 to <100 mm Hg, resting HR >50 beats per minute (bpm) or <90 bpm at screening and baseline (day −1), and clinically significant medical illness.
Safety assessments
The safety population comprised all subjects who received ≥1 dose of study drug (Part A) or all randomized subjects who received ≥1 dose of the study drug (Part B). Safety was graded according to Common Toxicity Criteria for Adverse Events criteria, version ≥4.0 and included treatment‐emergent adverse events (TEAEs), clinical laboratory tests, ECG, vital signs, and physical examination (summarized using descriptive statistics).
PK assessments
Part A blood samples (~4 mL) were evaluated for plasma PK of rilzabrutinib within 15 min pre‐dose and at 0.5, 1, 1.5, 2, 2.5, 3, 4, 6, 8, 12, and 24 h post‐dose. Part B blood samples (~4 mL) were evaluated for plasma PK of rilzabrutinib and moxifloxacin within 15 min pre‐dose and at 0.5, 1, 1.5, 2, 2.5, 3, 4, 5, 6, 7, 8, 10, 12, and 24 h post‐dose. Samples were analyzed using a validated liquid chromatography coupled to tandem mass spectrometry methods. Plasma concentrations of rilzabrutinib and moxifloxacin were quantified by Alturas Analytics Inc. (Moscow, ID, USA). PK data analysis was conducted by Certara (Parsippany, NJ, USA). PK parameters included Cmax, Tmax, AUC from time 0–24 h (AUC0–24), time of the last quantifiable concentrations (AUClast) and infinity (AUC0–∞), and t 1/2 (summarized using descriptive statistics).
ECG recordings
In Part B, continuous Holter recordings were performed on day 1 of each treatment period and at time‐matched timepoints on day −1 of period 1. Day −1 waveforms were stored in case of potential substantial effect on HR. At ECG extraction timepoints, subjects rested in the supine position for ≥10 min prior to and 5 min after the nominal time. All Holter/ECG data were collected using M12R continuous 12‐lead digital recorders and the M12A Enterprise Holter System Client (Global Instrumentation, LLC, Manlius, NY, USA). ECGs were extracted at a central ECG laboratory (ERT, Rochester, NY, USA) in up to 10 replicates at the following timepoints: −1.0, −0.75, and −0.5 h prior to dosing and 0.5, 1, 1.5, 2, 2.5, 3, 4, 5, 6, 7, 8, 10, 12, 13, 14, 16, and 24 h post‐dose. ECG intervals were measured by the central laboratory in a blinded manner using the Expert Precision QT technique. 21 The ECG database was locked prior to any statistical analysis.
Statistical analyses
For all ECG parameters, baseline was the average of the derived ECG intervals from the three ECG timepoints prior to dosing on day 1 within each respective period. As recommended for drugs without a substantial HR effect, the QT interval was HR corrected using the Fridericia's formula, QTcF: QTcF = QT/RR1/3. 19 , 22 If a substantial HR effect (mean ΔΔHR > 10 bpm) was observed with rilzabrutinib, drug‐free QT/RR data collected over a range of HR on day −1 of period 1 was to be used to allow the generation of individualized QT correction methods. The method that removed the HR dependence of the QT interval most efficiently was chosen as the primary correction method.
The primary analysis was based on concentration‐QTc (C‐QTc) modeling of the relationship between rilzabrutinib and the placebo‐corrected change from baseline QTc (i.e., ΔΔQTc from the primary correction method) with the intent to exclude an effect >10 ms at clinically relevant plasma concentrations. In addition, the effects of rilzabrutinib on ∆∆QTc, ΔΔHR, ΔΔPR, and ΔΔQRS were evaluated at each post‐dose timepoint (by timepoint analysis). An analysis of categorical outliers was performed for changes in HR, PR, QRS, QTc, T‐wave morphology, and U‐wave presence.
The relationship between rilzabrutinib plasma concentration and ΔΔQTc (primary correction method) was investigated by a linear mixed‐effects modeling approach with ΔΔQTc as the dependent variable. Three linear models were considered: with an intercept, mean intercept fixed to 0 (with variability), and no intercept. Time‐matched concentration was included in the model as a covariate, centered baseline QTc (i.e., baseline QTc for individual subject at each post‐dose timepoint subtracting the population mean baseline QTc for all subjects) as an additional covariate, and subject as a random effect for both intercept and slope. The geometric mean of the individual Cmax values for subjects on each dose of active drug was determined. The model that fitted the data best (i.e., had the smallest Akaike Information Criterion [AIC] and model‐predicted CIs similar to the observed CIs) was used for predicting population average ΔΔQTc and its corresponding two‐sided 90% CI at the observed mean Cmax. If the upper bound of the two‐sided 90% CI of the model‐predicted QTc effect was <10 ms at clinically relevant plasma levels of rilzabrutinib, it was concluded that rilzabrutinib did not cause clinically concerning QTc prolongation. Additional statistical details and sample size determination are provided in the Methods S1.
RESULTS
Subject disposition
In Part A, 12 healthy subjects were enrolled; 11 (92%) completed the study. One subject withdrew before period 3 dosing due to cannulation difficulty. Three of four participants treated with 1200 mg rilzabrutinib in period 1 experienced gastrointestinal AEs (nausea, dizziness, vomiting, and diarrhea) leading to removal of this dose from the study. The remaining eight participants did not receive the 1200 mg rilzabrutinib dose in periods 2 and 3. Four participants who received 1200 mg rilzabrutinib in period 1 completed the remaining treatment periods and study. In Part A, median age was 25.5 (range 19–38) years, 67% females, 75% white (25% Asian), mean body weight (±SD) of 67.97 (±11.596) kg, and a mean BMI (±SD) of 24.38 (±3.024) kg/m2 at screening.
In Part B, 39 subjects were enrolled and randomized to one of 12 treatment sequences in a four‐way crossover. Thirty‐seven subjects received ≥1 dose of study drug and were included in the safety and PK populations; two subjects (5%) withdrew after randomization and prior to treatment in any treatment period. Of eight participants (21%) who did not complete all four treatment periods, two and four withdrew due to personal reasons and violation of the eligibility criteria, respectively. Part B subjects had a median age of 24.0 (range 18–48) years, 49% females, 77% white, mean body weight (±SD) of 74.28 (±10.001) kg, and BMI (±SD) of 24.38 (±2.671) kg/m2 at screening.
Pharmacokinetics
In Part A, administration of a single dose of 100 mg rilzabrutinib showed rapid absorption, with median Tmax of ~1 h (Figure 1a, Table 1). Elimination appeared multiphasic, with a median t 1/2 of 1.6 h. Following a supratherapeutic 1200 mg rilzabrutinib dose, Tmax was reached after ~3 h, with a median elimination t 1/2 of 3.2 h (Figure 1b, Table 1). Between‐subject variability was high, especially in the 1200 mg treatment group, potentially due to study discontinuations related to gastrointestinal AEs. One participant had markedly higher exposure (up to 10‐fold) following treatment compared with the remaining participants in each treatment period. Co‐administration of 100 mg rilzabrutinib plus 100 mg ritonavir showed a considerable increase (17‐fold for AUC0–∞ and 7‐fold for Cmax) in rilzabrutinib plasma exposures (Table 1).
FIGURE 1.
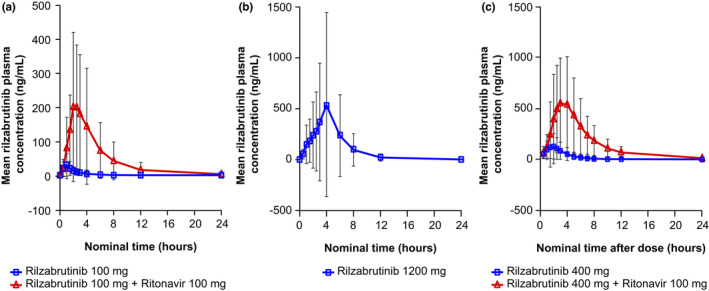
Mean (±SD) plasma concentration (ng/mL) versus time. Blue line, rilzabrutinib at various concentrations; red line, rilzabrutinib + ritonavir 100 mg. (a) Rilzabrutinib 100 mg ± ritonavir 100 mg, (b) rilzabrutinib 1200 mg, and (c) rilzabrutinib 400 mg ± ritonavir 100 mg
TABLE 1.
Plasma pharmacokinetic parameters
| Variable | t 1/2 (h) | Tmax (h) | Cmax (ng/mL) | AUC0–last (ng h/mL) | AUC0–∞ (ng h/mL) |
|---|---|---|---|---|---|
| Part A | |||||
| Rilzabrutinib 100 mg | |||||
| n | 12 | 12 | 12 | 12 | 12 |
| Mean (SD) | 1.8 (0.8) | 1.1 (0.5) | 34 (31) | 65 (67) | 66 (67) |
| Median (range) | 1.6 (1.2–4.0) | 1.0 (0.5–2.0) | 23 (9.0–120) | 51 (19–265) | 51 (20–265) |
| CV% | 43 | 43 | 92 | 103 | 102 |
| Rilzabrutinib 100 mg + ritonavir 100 mg | |||||
| n | 11 | 11 | 11 | 11 | 11 |
| Mean (SD) | 4.0 (0.3) | 2.3 (0.5) | 223 (210) | 1081 (1198) | 1097 (1221) |
| Median (range) | 4.0 (3.5–4.4) | 2.5 (1.53.0) | 157 (80–841) | 771 (393–4644) | 778 (398–4730) |
| CV% | 7 | 23 | 94 | 111 | 111 |
| Rilzabrutinib 1200 mg | |||||
| n a | 4 | 4 | 4 | 4 | 4 |
| Mean (SD) | 3.1 (0.6) | 2.9 (1.3) | 569 (888) | 2470 (3899) | 2474 (3902) |
| Median (range) | 3.2 (2.3–3.5) | 3.0 (1.5–4.0) | 136 (102–1900) | 551 (460–8317) | 553 (464–8326) |
| CV% | 18 | 46 | 156 | 158 | 158 |
| Part B | |||||
| Rilzabrutinib 400 mg | |||||
| n | 31 | 32 | 32 | 32 | 31 |
| Mean (SD) | 3.9 (2.3) | 2.1 (0.9) | 144 (124) | 455 (404) | 454 (411) |
| Median (range) | 3.1 (1.6–11.7) | 2.1 (0.6–4.1) | 102 (12–588) | 316 (53–1840) | 312 (58–1840) |
| CV% | 59 | 41 | 86 | 89 | 91 |
| Rilzabrutinib 400 mg + ritonavir 100 mg | |||||
| n | 33 | 34 | 34 | 34 | 33 |
| Mean (SD) | 4.5 (0.7) | 3.2 (0.8) | 712 (521) | 3640 (2800) | 3800 (2870) |
| Median (range) | 4.4 (3.6–6.9) | 3.1 (1.6–5.1) | 542 (154–2630) | 2980 (1160–14,100) | 3050 (1170–14,500) |
| CV% | 16 | 26 | 73 | 77 | 76 |
| Moxifloxacin 400 mg (positive control) | |||||
| n | 35 | 36 | 36 | 36 | 18 |
| Mean (SD) | 11.1 (4.2) | 2.2 (1.8) | 2360 (681) | 22,700 (5240) | 27,400 (5250) |
| Median (range) | 10 (6.3–31) | 2.1 (0.6–10) | 2310 (1230–4080) | 22,600 (10,100–37,700) | 28,400 (16,600–35,600) |
| CV% | 38 | 84 | 29 | 23 | 19 |
Abbreviations: AUC, area under the plasma concentration–time curve; AUC0–last, AUC from time 0 to last quantifiable timepoint; AUC0–∞, AUC from time 0 to infinity; CV%, percent coefficient of variation; Cmax, maximum peak observed concentration; PK, pharmacokinetic; SD, standard deviation; t 1/2, elimination half‐life; Tmax, time to maximum observed plasma concentration.
Limited number of patients completed period 1 with the 1200 mg rilzabrutinib dose due to gastrointestinal‐related adverse effects and changed dosing for periods 2–4.
In Part B, 400 mg rilzabrutinib median exposure was modestly lower than 1200 mg (Part A), consistent with prior observations of dose‐limited absorption with doses above ~600 mg. 12 Following administration of a single dose of 400 mg under fasting conditions, rilzabrutinib was absorbed rapidly, with a median Tmax of ~2.1 h (Table 1). Elimination appeared multiphasic, with a median t 1/2 of 3.1 h. Between‐subject variability was high, with a coefficient of variation (CV%) of 86.1 and 90.5 for Cmax and AUC0–∞, respectively (Table 1). In the analysis population with ≥1 pair of rilzabrutinib plasma concentration/ΔQTcF, geometric mean Cmax was 101 ng/mL observed at 2 h after a single 400 mg rilzabrutinib dose and 589 ng/mL at 3 h post‐dose with concomitant ritonavir administration (Figure 1c). The magnitude of the DDI between rilzabrutinib and ritonavir was significant, but lower than observed with the 100 mg dose. Co‐administration of 400 mg rilzabrutinib plus 100 mg ritonavir BID resulted in ~8‐fold and 5‐fold increases in AUC0–∞ and Cmax, respectively (Table 1). The effect of co‐administration of ritonavir on rilzabrutinib PK was confirmed using the geometric least square mean method (Table S1).
Of 39 subjects enrolled in Part B, 36 received a single moxifloxacin 400 mg dose that was rapidly absorbed, with Cmax ranging from 1230 to 4080 ng/mL and mean concentration of 2360 ng/mL (CV% of 84.4) reached at a median Tmax of ~2 h (Table 1).
Baseline ECG and heart rate effects
At baseline, data were available from 32, 33, 36, and 35 subjects receiving 400 mg rilzabrutinib, 400 mg rilzabrutinib plus ritonavir, moxifloxacin, and placebo, respectively. Baseline ECG parameters were within expectations for a healthy population with mean HR across treatments between 58.4 and 60.1 bpm, mean QTcF between 401.0 and 401.8 ms, mean PR between 145.3 and 149.5 ms, and mean QRS between 103.8 and 104.0 ms. Mean ∆HR on active treatment closely followed the pattern observed with placebo (Figure 2a). Mean placebo‐corrected ΔHR (∆∆HR) varied between −1.9 bpm at 6 h post‐dose with 400 mg rilzabrutinib and 2.2 bpm at 7 h post‐dose with moxifloxacin across all post‐dose timepoints on all treatments. Rilzabrutinib had no effect on HR. QTcF was used as the primary QT correction method and additional QT correction methods were not explored. There were no outliers in terms of HR changes.
FIGURE 2.
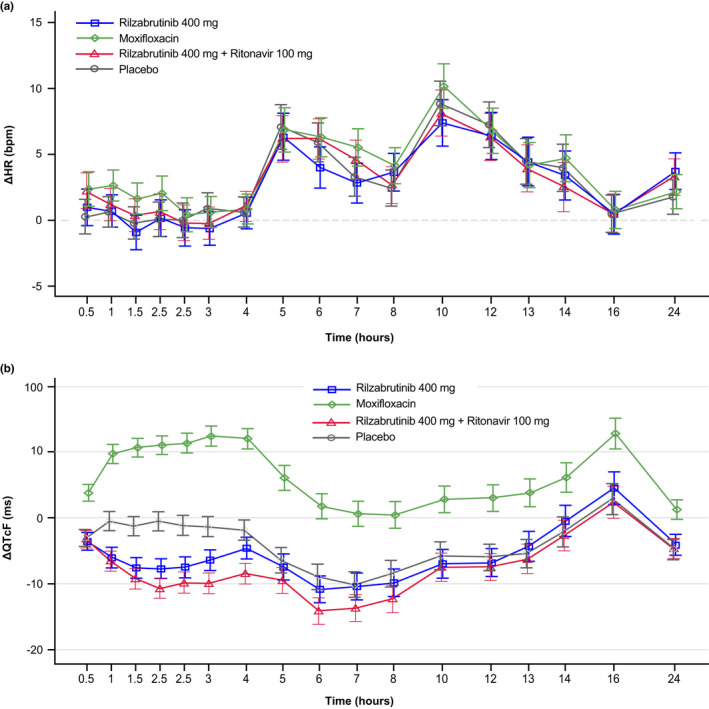
Effects of rilzabrutinib on electrocardiogram (ECG) parameters across timepoints over 24 h after administration of rilzabrutinib 400 mg (blue line), rilzabrutinib 400 mg + ritonavir 100 mg (red line), placebo (gray line), or moxifloxacin (green line) in Part B. (a) Change from baseline in heart rate (ΔHR) and (b) mean change from baseline in QTcF interval over time using Fridericia's formula (ΔQTcF)
Effect on cardiac repolarization: QT interval
Mean ΔQTcF with both rilzabrutinib and placebo was negative at all timepoints except 16 h post‐dose. During the first 3 h post‐dose, mean ΔQTc with rilzabrutinib was more negative than with placebo, and then followed the same pattern observed with placebo at all timepoints from 4 h and beyond (Figure 2b). In contrast, a clear increase of mean ΔQTcF was seen with moxifloxacin. Mean placebo‐corrected ΔQTcF (∆∆QTcF) was generally negative with both rilzabrutinib treatments, with the largest (negative) ΔΔQTcF value of −10.2 ms at 2 h post‐dose with 400 mg rilzabrutinib plus ritonavir (Table 2). After 400 mg oral moxifloxacin treatment, a clear increase of mean ΔΔQTcF was observed with a peak value of 13.8 ms at 3‐ and 4‐h post‐dose. There were no subjects on active treatment with QTcF >450 ms or ΔQTcF >30 ms. There were no treatment‐emergent T‐wave or U‐wave morphology changes except one subject with a flat T wave at two timepoints following 400 mg rilzabrutinib. Given that no clinically relevant QTc prolongation was observed with either rilzabrutinib treatment, additional models taking hysteresis into account were not undertaken.
TABLE 2.
Placebo‐corrected change from baseline QTcF (ΔΔQTcF) a (Part B)
| Timepoint post‐dose (h) | Statistics | Rilzabrutinib 400 mg | Rilzabrutinib 400 mg + ritonavir 100 mg | Moxifloxacin 400 mg |
|---|---|---|---|---|
| 0.5 | LSM (SE) [90% CI] | −0.5 (1.11) [−2.40; 1.30] | −0.2 (1.10) [−2.01; 1.63] | 6.9 (1.08) [5.08; 8.67] |
| 1 | LSM (SE) [90% CI] | −5.6 (1.30) [−7.70; −3.40] | −6.1 (1.28) [−8.20; −3.96] | 10.2 (1.25) [8.13; 12.29] |
| 1.5 | LSM (SE) [90% CI] | −6.4 (1.27) [−8.49; −4.28] | −8.0 (1.25) [−10.09; −5.93] | 11.9 (1.23) [9.89; 13.98] |
| 2 | LSM (SE) [90% CI] | −7.3 (1.25) [−9.33; −5.19] | −10.2 (1.23) [−12.24; −8.16] | 11.5 (1.21) [9.50; 13.52] |
| 2.5 | LSM (SE) [90% CI] | −6.4 (1.33) [−8.58; −4.15] | −8.7 (1.32) [−10.92; −6.54] | 12.5 (1.30) [10.30; 14.60] |
| 3 | LSM (SE) [90% CI] | −5.1 (1.33) [−7.29; −2.87] | −8.6 (1.32) [−10.79; −6.42] | 13.8 (1.30) [11.61; 15.91] |
| 4 | LSM (SE) [90% CI] | −2.8 (1.37) [−5.04; −0.49] | −6.6 (1.35) [−8.88; −4.40] | 13.8 (1.33) [11.65; 16.05] |
| 5 | LSM (SE) [90% CI] | −1.0 (1.67) [−3.80; 1.75] | −3.1 (1.66) [−5.83; −0.34] | 12.5 (1.63) [9.84; 15.23] |
| 6 | LSM (SE) [90% CI] | −1.9 (1.70) [−4.70; 0.95] | −5.2 (1.69) [−7.96; −2.37] | 10.7 (1.65) [8.00; 13.48] |
| 7 | LSM (SE) [90% CI] | −0.3 (1.69) [−3.11; 2.49] | −3.6 (1.67) [−6.39; −0.83] | 10.7 (1.64)) [8.00; 13.44] |
| 8 | LSM (SE) [90% CI] | −1.4 (1.76) [−4.29; 1.56] | −3.8 (1.74) [−6.73; −0.94] | 8.9 (1.71) [6.07; 11.75] |
| 10 | LSM (SE) [90% CI] | −1.2 (1.83) [−4.23; 1.85] | −1.7 (1.82) [−4.75; 1.27] | 8.6 (1.78) [5.63; 11.53] |
| 12 | LSM (SE) [90% CI] | −0.8 (1.77) [−3.77; 2.09] | −1.5 (1.75) [−4.36; 1.44] | 9.0 (1.71) [6.15; 11.84] |
| 13 | LSM (SE) [90% CI] | 1.1 (1.89) [−2.03; 4.24] | −0.8 (1.87) [−3.90; 2.30] | 9.2 (1.83) [6.20; 12.28] |
| 14 | LSM (SE) [90% CI] | 1.7 (198) [−1.63; 4.94] | −0.5 (1.96) [−3.79; 2.72] | 8.3 (1.93) [5.09; 11.47] |
| 16 | LSM (SE) [90% CI] | 1.6 (2.09) [−1.84; 5.08] | −0.5 (2.06) [−3.95; 2.88] | 10.0 (2.02) [6.62; 13.31] |
| 24 | LSM (SE) [90% CI] | 0.7 (1.33) [−1.53; 2.88] | 0.1 (1.30) [−2.10; 2.23] | 6.0 (1.28) [3.92; 8.17] |
Abbreviations: CI, confidence interval; LSM, least squares mean; SE, standard error.
Primary correction method.
The relationship between the individually observed rilzabrutinib plasma concentrations and ΔΔQTcF is shown in Figure 3. In the C‐QTc analysis, a linear model with an intercept was found to fit the data best based on the AIC values, albeit an underestimation of ΔΔQTcF was seen at high concentrations, where data were sparse. The estimated population slope of the C‐QTc relationship was statistically significant: 0.01 ms per ng/mL (90% CI −0.016 to −0.0010; p < 0.0001) with a negative intercept of −2.0 ms (90% CI −3.25 to −0.82). Using this model, the effect on ΔΔQTcF was predicted to −3.4 ms (90% CI −4.5 to −2.2) and −9.9 ms (90% CI −11.9 to −7.9) at the observed geometric mean Cmax for rilzabrutinib 400 mg alone and rilzabrutinib 400 mg with ritonavir, respectively. A QT effect (ΔΔQTcF) >10 ms was excluded with observed rilzabrutinib plasma concentrations of up to ~2500 ng/mL. The slope of the C‐QTc relationship for moxifloxacin was 0.005 ms per ng/mL (90% CI 0.0035 to 0.0056) with an intercept of 4.4 ms (90% CI 2.48 to 6.24). The predicted ΔΔQTcF at the geometric mean peak moxifloxacin concentration (2260 ng/mL) was 14.7 ms (90% CI 12.9 to 16.5). Since the slope of the C‐QTc relationship was statistically significant and lower bound 90% CI of the predicted effect was >5 ms, assay sensitivity was demonstrated. Finally, rilzabrutinib at the studied doses had no clinically relevant effect on cardiac conduction (i.e., PR and QRS intervals).
FIGURE 3.
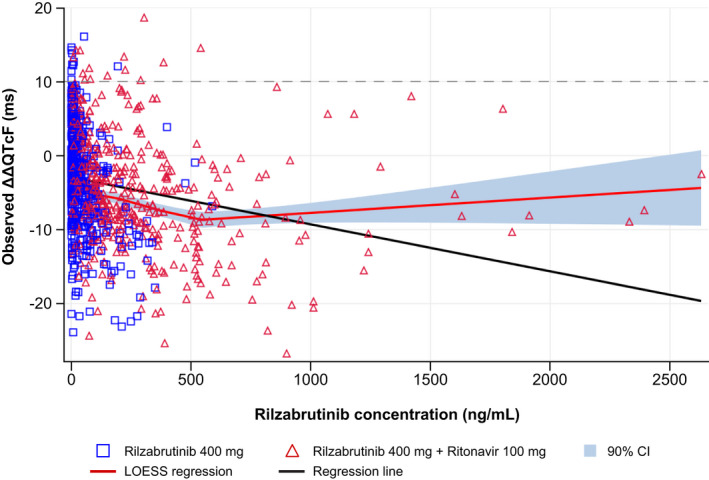
Scatter plot of observed rilzabrutinib plasma concentrations and mean change from baseline in QTcF interval using Fridericia's formula (ΔΔQTcF), with mean regression LOESS (Part B). The blue squares and red triangles denote the pairs of observed plasma concentrations and ΔΔQTcF by participants treated with rilzabrutinib 400 mg and rilzabrutinib 400 mg + ritonavir 100 mg, respectively. The red line represents the LOESS regression, the black line denotes the linear regression, and the horizontal dotted line represents the regulatory threshold of concern of 10 ms
Safety
In Part A, there were no serious TEAEs, deaths, or TEAEs leading to study drug interruption/discontinuation. Rilzabrutinib‐related TEAEs were mostly mild (grade 1). Of the TEAEs deemed related to rilzabrutinib treatment, the majority occurred following administration of 1200 mg, with five events (GI‐related) in three participants (75%) compared with one event in one participant (9.1%) following treatment with 100 mg plus ritonavir 100 mg (Table 3). Of note, there were three moderate (grade 2) treatment related TEAEs (one event each of diarrhea, orthostatic hypotension, and vomiting) in one participant (25.0%) following 1200 mg administration. The 1200 mg dose was subsequently dropped for the remaining eight participants as it was not a viable dose for the purpose of enabling a possible supratherapeutic dose for testing the effect of rilzabrutinib on QT in Part B. There were no rilzabrutinib‐related TEAEs reported following 100 mg rilzabrutinib.
TABLE 3.
Treatment‐related treatment‐emergent adverse events (Part A)
|
System organ class Preferred term |
Rilzabrutinib 100 mg (n = 12) | Rilzabrutinib 100 mg + ritonavir 100 mg (n = 11) | Rilzabrutinib 1200 mg (n = 4) | |||
|---|---|---|---|---|---|---|
| n (%) | Events (n) | n (%) | Events (n) | n (%) | Events (n) | |
| Subjects with ≥1 TEAE | 0 | 0 | 1 (9.1) | 1 | 3 (75.0) | 9 |
| Gastrointestinal disorders | 0 | 0 | 0 | 0 | 3 (75.0) | 5 |
| Diarrhea | 0 | 0 | 0 | 0 | 2 (50.0) | 2 |
| Nausea | 0 | 0 | 0 | 0 | 2 (50.0) | 2 |
| Vomiting | 0 | 0 | 0 | 0 | 1 (25.0) | 1 |
| Nervous system disorders | 1 (8.3) | 1 | 2 (18.2) | 2 | 1 (25.0) | 1 |
| Dizziness | 0 | 0 | 1 (9.1) | 1 | 1 (25.0) | 1 |
| Vascular disorders | 0 | 0 | 0 | 0 | 1 (25.0) | 1 |
| Orthostatic hypotension | 0 | 0 | 0 | 0 | 1 (25.0) | 1 |
Abbreviation: TEAE, treatment‐emergent adverse event.
Note: TEAEs reported in 25% of patients in any treatment group. TEAE was defined as an adverse event that commenced on or after the time of study drug administration. If a subject had multiple occurrences of a TEAE, the subject was counted only once in the subject count (n) column for a given System Organ Class and Preferred Term. Occurrences were counted each time in the events column. Adverse events were coded using MedDRA Version 21.0.
In Part B, there were no serious TEAEs or deaths. The maximum severity of treatment related TEAEs in the majority of participants was mild (grade 1). There were two moderate (grade 2) rilzabrutinib related TEAEs (nausea with 400 mg and diarrhea with 400 mg plus 100 mg ritonavir) reported in two participants. There was one instance of treatment interruption due to an unrelated TEAE of toothache and one instance of withdrawal after moxifloxacin due to unrelated TEAE of upper respiratory tract infection. Both participants were subsequently withdrawn from the study by the principal investigator due to breaches of the exclusion criteria assessed upon readmission. The incidence of treatment‐related TEAEs was highest in rilzabrutinib‐treated participants (43.8% for 400 mg rilzabrutinib and 44.1% for 400 mg rilzabrutinib plus ritonavir) compared with placebo (11.4%) and moxifloxacin (8.3%; Table 4). Diarrhea was the most frequently reported with rilzabrutinib, with the highest number of events occurring with 400 mg rilzabrutinib plus ritonavir (12 events in 12 participants [35.3%]), followed by 400 mg rilzabrutinib (9 events in 9 participants [28.1%]), placebo (1 event in 1 participant [2.9%]), and 400 mg moxifloxacin (1 event in 1 participant [2.8%]).
TABLE 4.
Treatment‐related treatment‐emergent adverse events (Part B)
|
System organ class Preferred term |
Rilzabrutinib 400 mg (n = 32) | Rilzabrutinib 400 mg + ritonavir 100 mg (n = 34) | Placebo (n = 35) | Moxifloxacin 400 mg (n = 36) | ||||
|---|---|---|---|---|---|---|---|---|
| n (%) | Events (n) | n (%) | n (%) | n (%) | Events (n) | n (%) | Events (n) | |
| Subjects with ≥1 TEAE | 14 (43.8) | 19 | 15 (44.4) | 21 | 4 (11.4) | 5 | 3 (8.3) | 7 |
| Gastrointestinal disorders | 13 (40.6) | 17 | 14 (41.2) | 17 | 4 (11.4) | 4 | 1 (2.8) | 4 |
| Diarrhea | 9 (28.1) | 9 | 12 (35.3) | 12 | 1 (2.9) | 1 | 1 (2.8) | 1 |
| Nausea | 4 (12.5) | 5 | 4 (11.8) | 4 | 2 (5.7) | 2 | 1 (2.8) | 1 |
| Abdominal pain | 3 (9.4) | 3 | 0 | 0 | 1 (2.9) | 1 | 1 (2.8) | 1 |
| Frequent bowel movements | 0 | 0 | 1 (2.9) | 1 | 0 | 0 | 0 | 0 |
| Vomiting | 0 | 0 | 0 | 0 | 0 | 0 | 1 (2.8) | 1 |
| Nervous system disorders | 2 (6.3) | 2 | 3 (8.8) | 3 | 1 (2.9) | 1 | 2 (5.6) | 2 |
| Headache | 1 (3.1) | 1 | 0 | 0 | 1 (2.9) | 1 | 0 | 0 |
| Dysgeusia | 1 (3.1) | 1 | 2 (5.9) | 2 | 0 | 0 | 0 | 0 |
| Lethargy | 0 | 0 | 0 | 0 | 0 | 0 | 1 (2.8) | 1 |
| Somnolence | 0 | 0 | 2 (5.9) | 2 | 0 | 0 | 0 | 0 |
| Dizziness | 0 | 0 | 0 | 0 | 0 | 0 | 1 (2.8) | 2 |
| Infections and infestations | 0 | 0 | 1 (2.9) | 1 | 0 | 0 | 1 (2.8) | 1 |
| Fungal skin infection | 0 | 0 | 0 | 0 | 0 | 0 | 0 | 0 |
| Herpex simplex | 0 | 0 | 1 (2.9) | 1 | 0 | 0 | 0 | 0 |
Abbreviation: TEAE, treatment‐emergent adverse event.Note: TEAE was defined as an adverse event that commenced on or after the time of study drug administration. If a subject had multiple occurrences of a TEAE, the subject was counted only once in the subject count (n) column for a given System Organ Class and Preferred Term. Occurrences were counted each time in the events column. Adverse events were coded using MedDRA Version 21.
DISCUSSION
The single dose of 100 mg rilzabrutinib was well tolerated, whereas the 1200 mg single dose led to a gastrointestinal intolerance in 3 of 4 subjects. These findings were consistent with prior studies reporting the use rilzabrutinib liquid formulation at a single dose of 1200 mg. 12 Since nausea and vomiting could affect HR interpretation, the 1200 mg dose was not a viable option for testing rilzabrutinib's effect on QTc prolongation in Part B. In addition to observed gastrointestinal intolerance, PK analysis of rilzabrutinib demonstrated less than proportional increases in exposure between 400 mg and 1200 mg; hence, the 1200 mg dose was considered insufficient to obtain adequate supratherapeutic exposures of rilzabrutinib for ECG assessments in Part B.
Co‐administration of 100 mg rilzabrutinib with 100 mg ritonavir led to a 17‐fold increase in AUC0–∞ and a 7‐fold increase in Cmax of rilzabrutinib plasma exposures. The different fold‐change in exposure between 100 and 400 mg rilzabrutinib in the presence of ritonavir could be due to saturation of presystemic CYP metabolism by rilzabrutinib at 400 mg. Therefore, the impact of CYP3A inhibition by ritonavir was less pronounced on exposure increases at 400 mg versus 100 mg. These findings showed that rilzabrutinib is a CYP3A4 substrate and confirmed that a DDI with ritonavir, a potent CYP3A and Pgp inhibitor, was the clinically relevant supratherapeutic scenario. Consequently, ritonavir was used as a PK booster to achieve supratherapeutic exposures in Part B.
In Part B, the main finding was that neither of the two rilzabrutinib dose groups demonstrated clinically relevant effects on any ECG parameter and that an effect of therapeutic and supratherapeutic concentrations on the QTc interval exceeding 10 ms can be excluded (predicted upper bound 90% CI was <10 ms threshold). Results of the concentration‐QTc analysis showed a negative QTcF interval slope for rilzabrutinib and predicted ΔΔQTcF interval at Cmax < 0 ms with both therapeutic and supratherapeutic dose groups. This finding was consistent with the observed, small shortening of ΔΔQTcF in the by timepoint analysis, with a largest (negative) mean effect of −10.2 ms at 2 h after dosing with the 400 mg rilzabrutinib. QTc shortening of this magnitude is of no clinical concern and has not been associated with any form of proarrhythmias. 23 Thus, the supratherapeutic rilzabrutinib dose used here provided greater systemic drug concentrations for QTc evaluation than would potentially be observed in clinical practice. These results are also in line with findings from preclinical safety data and phase I/II studies that did not report prolonged QTcF interval among safety concerns with rilzabrutinib 400 mg b.i.d. in patients with PV and ITP. 24 , 25 Recently, other BTK inhibitors (e.g., acalabrutinib, zanubrutinib, and evobrutinib) showed no prolongation of the QTc interval or clinically relevant ECG effects. 26 , 27 , 28
The PK profile observed following a 400 mg single dose here was similar to other studies of healthy subjects. 16 There was a minimal accumulation after chronic multiple dosing at 400 mg b.i.d. due to the short half‐life of rilzabrutinib. 12 Oral clearance of rilzabrutinib monotherapy resulted in high interindividual variability, as expected with a CYP3A substrate. 28 Previous phase I/II studies using single and multiple doses of rilzabrutinib demonstrated no change in ECG parameters. During co‐administration of rilzabrutinib with ritonavir, the safety profile changed only minimally, whereas the rilzabrutinib exposure increased 5‐fold for Cmax and 8‐fold for AUC0–∞. At supratherapeutic concentration, exposure levels were multiple‐fold higher than those observed in patients with PV and ITP.
Overall, rilzabrutinib at the studied doses had an acceptable safety profile similar to that reported in earlier studies of healthy subjects and PV patients. 12 , 25 No clinically meaningful changes in clinical chemistry were observed. The maximum severity of TEAEs in most participants was mild, with no severe TEAEs reported. Given that there was no increase of QTc interval observed at the supratherapeutic dose, it can be concluded that rilzabrutinib administered at the clinical dose will not impact the QTc interval.
These study results confirmed that rilzabrutinib is a substrate for CYP3A, and possibly Pgp efflux mechanism, and showed a significant exposure increase in the presence of a potent CYP3A and Pgp inhibitor (i.e., ritonavir). It was not feasible to achieve higher exposure with rilzabrutinib alone without the occurrence of gastrointestinal AEs. Therefore, a thorough QTc study was conducted using 400 mg rilzabrutinib with/without ritonavir. Results showed that rilzabrutinib administered at doses and with PK values that matched or exceeded those used in clinical trials had no clinically relevant effects on HR, PR interval, QRS interval duration, ECG morphology, or cardiac polarization (the QTc interval), and was well tolerated.
CONFLICT OF INTEREST
S.U., A.N., P.N., J.S., K.A.C., M.K., and P.P are or were former employees of and received stock ownership from Principia Biopharma Inc., a Sanofi company at the time of the study. B.D. reports stock or other ownership with ERT and consulting/advisory role as his main employment (excluding Principia Biopharma Inc., a Sanofi company). H.X. is an employee of ERT. D.T. was a former employee of and received stock ownership from Principia Biopharma Inc., a Sanofi company at the time of the study, and reports pending patent regarding rilzabrutinib. P.F.S. reports employment with Certara and received consulting fees from Principia Biopharma Inc, a Sanofi company.
AUTHOR CONTRIBUTIONS
S.U. wrote the manuscript. P.F.S., B.D, and P.N. designed the research. D.T., A.N., M.K., P.P., and K.A.C. performed the research. S.U., J.S., and H.X. analyzed the data.
Supporting information
Table S1
ACKNOWLEDGMENTS
The authors thank all the study investigators, staff, and individuals who contributed to this study. The authors would like to thank Dr Jason Lickliter, from the Nucleus Network, Melbourne, Australia, for conducting this research. The authors received editorial support in the preparation of this manuscript from Mihaela Marina, PhD, of Second City Science LLC, funded by Principia Biopharma Inc., a Sanofi Company. The authors directed the development of the manuscript and are fully responsible for all content and editorial decisions for this manuscript.
Ucpinar S, Darpo B, Neale A, et al. A thorough QTc study to evaluate the effects of oral rilzabrutinib administered alone and with ritonavir in healthy subjects. Clin Transl Sci. 2022;15:1507–1518. doi: 10.1111/cts.13271
Funding information
This study was funded by Principia Biopharma Inc., a Sanofi Company.
DATA AVAILABILITY STATEMENT
Qualified researchers may request access to patient‐level data and related documents (including, e.g., the clinical study report, study protocol with any amendments, blank case report form, statistical analysis plan, and dataset specifications). Patient‐level data will be anonymized, and study documents will be redacted to protect the privacy of trial participants. Further details on Sanofi's data sharing criteria, eligible studies, and process for requesting access can be found at https://www.clinicalstudydatarequest.com.
REFERENCES
- 1. Mohamed AJ, Yu L, Bäckesjö C‐M, et al. Bruton's tyrosine kinase (Btk): function, regulation, and transformation with special emphasis on the PH domain. Immunol Rev. 2009;228:58‐73. [DOI] [PubMed] [Google Scholar]
- 2. Crofford LJ, Nyhoff LE, Sheehan JH, Kendall PL. The role of Bruton's tyrosine kinase in autoimmunity and implications for therapy. Expert Rev Clin Immunol. 2016;12:763‐773. [DOI] [PMC free article] [PubMed] [Google Scholar]
- 3. Rip J, Van Der Ploeg EK, Hendriks RW, Corneth OBJ. The role of Bruton's tyrosine kinase in immune cell signaling and systemic autoimmunity. Crit Rev Immunol. 2018;38:17‐62. [DOI] [PubMed] [Google Scholar]
- 4. Pal Singh S, Dammeijer F, Hendriks RW. Role of Bruton's tyrosine kinase in B cells and malignancies. Mol Cancer. 2018;17:57. [DOI] [PMC free article] [PubMed] [Google Scholar]
- 5. Benson MJ, Rodriguez V, von Schack D, et al. Modeling the clinical phenotype of BTK inhibition in the mature murine immune system. J Immunol. 2014;193:185‐197. [DOI] [PubMed] [Google Scholar]
- 6. Fang P, Li X, Dai J, et al. Immune cell subset differentiation and tissue inflammation. J Hematol Oncol. 2018;11:97. [DOI] [PMC free article] [PubMed] [Google Scholar]
- 7. Cooper N, Ghanima W. Immune thrombocytopenia. N Engl J Med. 2019;381:945‐955. [DOI] [PubMed] [Google Scholar]
- 8. Didona D, Maglie R, Eming R, Hertl M. Pemphigus: current and future therapeutic strategies. Front Immunol. 2019;10:1418. [DOI] [PMC free article] [PubMed] [Google Scholar]
- 9. Langrish CL, Bradshaw JM, Francesco MR, et al. Preclinical efficacy and anti‐inflammatory mechanisms of action of the Bruton tyrosine kinase inhibitor rilzabrutinib for immune‐mediated disease. J Immunol. 2021;206:1454‐1468. [DOI] [PMC free article] [PubMed] [Google Scholar]
- 10. Zufferey A, Kapur R, Semple JW. Pathogenesis and therapeutic mechanisms in immune thrombocytopenia (ITP). J Clin Med. 2017;6:16. [Google Scholar]
- 11. Bradshaw JM, McFarland JM, Paavilainen VO, et al. Prolonged and tunable residence time using reversible covalent kinase inhibitors. Nat Chem Biol. 2015;11:525‐531. [DOI] [PMC free article] [PubMed] [Google Scholar]
- 12. Smith PF, Krishnarajah J, Nunn PA, et al. A phase I trial of PRN1008, a novel reversible covalent inhibitor of Bruton's tyrosine kinase, in healthy volunteers. Br J Clin Pharmacol. 2017;83:2367‐2376. [DOI] [PMC free article] [PubMed] [Google Scholar]
- 13. Goodale EC, White SD, Bizikova P, et al. Open trial of Bruton's tyrosine kinase inhibitor (PRN1008) in the treatment of canine pemphigus foliaceus. Vet Dermatol. 2020;34:410‐e110. [DOI] [PMC free article] [PubMed] [Google Scholar]
- 14. Ucpinar S , La Stant J, Foulke MC, et al. Metabolism‐mediated drug interactions between ritonavir and oral BTK inhibitor rilzabrutinib in rats. Poster presented at: 2020 American College of Clinical Pharmacy Annual Meeting, October 24–27, 2020. Poster 5449; Virtual 2020.
- 15. Schmitt C, Kaeser B, Riek M, Bech N, Kreuzer C. Effect of saquinavir/ritonavir on P‐glycoprotein activity in healthy volunteers using digoxin as a probe. Int J Clin Pharmacol Ther. 2010;48:192‐199. [DOI] [PubMed] [Google Scholar]
- 16. Sevrioukova IF, Poulos TL. Structure and mechanism of the complex between cytochrome P4503A4 and ritonavir. Proc Natl Acad Sci U S A. 2010;107:18422‐18427. [DOI] [PMC free article] [PubMed] [Google Scholar]
- 17. Boyce MJ, Baisley KJ, Warrington SJ. Pharmacokinetic interaction between domperidone and ketoconazole leads to QT prolongation in healthy volunteers: a randomized, placebo‐controlled, double‐blind, crossover study. Br J Clin Pharmacol. 2012;73:411‐421. [DOI] [PMC free article] [PubMed] [Google Scholar]
- 18. Sarapa N, Nickens DJ, Raber SR, Reynolds RR, Amantea MA. Ritonavir 100 mg does not cause QTc prolongation in healthy subjects: a possible role as CYP3A inhibitor in thorough QTc studies. Clin Pharmacol Ther. 2008;83:153‐159. [DOI] [PubMed] [Google Scholar]
- 19. US Department of Health and Human Services, Food and Drugs Administration, Center for Drug Evaluation and Research (CDER), Center for Biologics Evaluation and Research (CBER) . E14 clinical evaluation of QT/QTc interval prolongation and proarrhythmic potential for non‐antiarrhythmic drugs — questions and answers (R3). Guidance for Industry. June 2017, ICH. Revision 2. Accessed 23 September 2021. https://www.fda.gov/regulatory‐information/search‐fda‐guidance‐documents/e14‐clinical‐evaluation‐qtqtc‐interval‐prolongation‐and‐proarrhythmic‐potential‐non‐antiarrhythmic‐11
- 20. European Medicines Agency . ICH E14: The clinical evaluation of QT/QTc interval prolongation and proarrhythmic potential for non‐antiarrhythmic drugs ‐ Step 5. November 2005, CHMP/ICH/2/04. Accessed 23 September 2021. https://www.ema.europa.eu/en/documents/scientific‐guideline/ich‐e‐14‐clinical‐evaluation‐qt/qts‐interval‐prolongation‐proarrhythmic‐potential‐non‐antiarrhythmic‐drugs‐step‐15_en.pdf.
- 21. Darpo B, Fossa AA, Couderc J‐P, et al. Improving the precision of QT measurements. Cardiol J. 2011;18:401‐410. [PubMed] [Google Scholar]
- 22. Garnett CE et al. Methodologies to characterize the QT/corrected QT interval in the presence of drug‐induced heart rate changes or other autonomic effects. Am Heart J. 2012;163:912‐930. [DOI] [PubMed] [Google Scholar]
- 23. Malik M. Facts, fancies and follies of drug‐induced QT/QTc interval shortening. Br J Pharmacol. 2010;159:70‐76. [DOI] [PMC free article] [PubMed] [Google Scholar]
- 24. Kuter DJ, Efraim M, Mayer J, et al. Oral rilzabrutinib, a Bruton tyrosine kinase inhibitor, showed clinically active and durable platelet responses and was well‐tolerated in patients with heavily pretreated immune thrombocytopenia. Blood. 2020;136:13‐14. [Google Scholar]
- 25. Murrell DF, Patsatsi A, Stavropoulos P, et al. Proof of concept for the clinical effects of oral rilzabrutinib, the first Bruton tyrosine kinase inhibitor for pemphigus vulgaris: the phase II BELIEVE study. Br J Dermatol. 2021;185:745‐755. [DOI] [PMC free article] [PubMed] [Google Scholar]
- 26. Calquence (acalabrutinib) capsules, for oral use. Highlights of prescribing information. AstraZeneca, 2019. Accessed 23 September 2021. https://www.azpicentral.com/calquence/calquence.pdf#page=1
- 27. Becker A, Martin EC, Mitchell DY, et al. Safety, tolerability, pharmacokinetics, target occupancy, and concentration‐QT analysis of the novel BTK inhibitor evobrutinib in healthy volunteers. Clin Transl Sci. 2020;13:325‐336. [DOI] [PMC free article] [PubMed] [Google Scholar]
- 28. Mu S, D B, T Z, et al. No QTc prolongation with zanubrutinib: results of concentration‐QTc analysis from a thorough QT study in healthy subjects. Clin Transl Sci. 2020;13:923‐931. [DOI] [PMC free article] [PubMed] [Google Scholar]
Associated Data
This section collects any data citations, data availability statements, or supplementary materials included in this article.
Supplementary Materials
Table S1
Data Availability Statement
Qualified researchers may request access to patient‐level data and related documents (including, e.g., the clinical study report, study protocol with any amendments, blank case report form, statistical analysis plan, and dataset specifications). Patient‐level data will be anonymized, and study documents will be redacted to protect the privacy of trial participants. Further details on Sanofi's data sharing criteria, eligible studies, and process for requesting access can be found at https://www.clinicalstudydatarequest.com.