

Abstract
Asciminib, a first‐in‐class BCR‐ABL1 inhibitor that works by Specifically Targeting the ABL Myristoyl Pocket (STAMP), is a new treatment option for patients with chronic myeloid leukemia who no longer benefit from currently approved tyrosine kinase inhibitors. In vitro, asciminib reversibly inhibits cytochrome P450 (CYP) 3A4/5, CYP2C9, and CYP2C8. This phase I, open‐label, two‐stage study in healthy participants evaluated the effect of asciminib (40 mg b.i.d. at steady‐state) as a potential perpetrator on single‐dose pharmacokinetics of a two‐drug cocktail containing midazolam (CYP3A substrate) and warfarin (CYP2C9 substrate) in stage 1 (n = 22), and of repaglinide (CYP2C8 substrate) in stage 2 (n = 25). For midazolam plus asciminib versus midazolam, geometric mean (G mean) ratios (90% confidence interval) for midazolam area under the curve from zero to infinity (AUCinf) and maximum plasma concentration (Cmax) were 1.28 (1.15, 1.43) and 1.11 (0.96, 1.28), respectively. For warfarin plus asciminib versus warfarin, G mean ratios for S‐warfarin AUCinf and Cmax were 1.41 (1.37, 1.45) and 1.08 (1.04, 1.13), respectively. Results for R‐warfarin were in line with those for S‐warfarin. For repaglinide plus asciminib versus repaglinide, G mean ratios for AUCinf and Cmax were 1.08 (1.02, 1.14) and 1.14 (1.01, 1.28), respectively. The treatments were generally well tolerated, and the asciminib safety profile was consistent with previous studies of asciminib in the absence of probe substrates. Overall, the results indicate that asciminib (40 mg b.i.d.) is a weak inhibitor of CYP3A and CYP2C9 and has no meaningful effect on CYP2C8.
Study Highlights.
WHAT IS THE CURRENT KNOWLEDGE ON THE TOPIC?
Asciminib, a first‐in‐class BCR‐ABL1 inhibitor that works by STAMP (Specifically Targeting the ABL Myristoyl Pocket), is a new treatment option for patients with chronic myeloid leukemia who no longer benefit from currently approved tyrosine kinase inhibitors.
WHAT QUESTION DID THIS STUDY ADDRESS?
This study evaluated the effect of asciminib (40 mg b.i.d. at steady‐state) as a potential perpetrator on single‐dose pharmacokinetics of midazolam (CYP3A substrate), warfarin (CYP2C9 substrate), and repaglinide (CYP2C8 substrate) in healthy participants.
WHAT DOES THIS STUDY ADD TO OUR KNOWLEDGE?
The study shows that in humans, asciminib is a weak inhibitor of CYP3A and CYP2C9, and does not have a clinically relevant effect on CYP2C8.
HOW MIGHT THIS CHANGE CLINICAL PHARMACOLOGY OR TRANSLATIONAL SCIENCE?
The findings will help guide the clinical usage of asciminib when administered in combination with other agents that are substrates of CYP3A, CYP2C9, or CYP2C8.
INTRODUCTION
Chronic myeloid leukemia (CML) is a myeloproliferative neoplasm driven by the presence of BCR‐ABL1 fusion gene, also known as Philadelphia chromosome (Ph), leading to constitutive activation of the BCR‐ABL1 fusion oncoprotein. 1 Asciminib, a first‐in‐class orally administered agent that inhibits BCR‐ABL1 by STAMP (Specifically Targeting the ABL Myristoyl Pocket), inhibits BCR‐ABL1 via allosteric binding to the myristoyl pocket of ABL1, a key element of ABL1 auto‐regulation which is specific for ABL kinases. 2 , 3 , 4 In contrast, currently approved ATP‐competitive tyrosine kinase inhibitors (TKIs) target the ATP‐binding site of ABL1, a motif shared by many tyrosine kinases. 2 , 3 , 4 By virtue of its unique allosteric inhibitory activity, asciminib has a non‐overlapping mutation‐driven resistance profile with ATP‐competitive TKIs, including activity against the T315I mutation, and may therefore provide a clinical benefit for patients with CML who have developed resistance to currently approved TKIs. 4 , 5 Asciminib has recently been approved by the US Food and Drug Administration (FDA) for treatment of patients with Ph‐positive CML in chronic phase (Ph+CML‐CP), previously treated with ≥2 TKIs and for adult patients with Ph+CML‐CP with the T315I mutation. 6
In a phase I, first‐in‐human, dose‐escalation study (NCT02081378), asciminib showed clinically meaningful and durable responses in patients with CML‐resistant or intolerant to other TKIs, with the maximum tolerated dose not reached with asciminib doses of up to 200 mg b.i.d. Based on the efficacy, safety, and pharmacokinetic (PK) results, a dose of 40 mg b.i.d. was selected for further clinical development of asciminib monotherapy. 7 A phase III study in patients with CML in chronic phase previously treated with ≥2 TKIs (ASCEMBL; NCT03106779) compared asciminib 40 mg b.i.d. versus the ATP‐competitive BCR‐ABL1 inhibitor bosutinib (500 mg q.d.) approved for patients with CML who have failed prior lines of therapy; asciminib demonstrated statistically significant superior efficacy versus bosutinib for the primary end point of major molecular response (MMR; defined as BCR‐ABL1 transcript levels on the international scale [BCR‐ABL1 IS] ≤0.1%) at week 24, with a favorable safety profile. 8
Asciminib is rapidly absorbed, with a median time to reach the maximum plasma concentration (Tmax) of 2–3 h post‐dose, and has a half‐life (T 1/2) of 7–15 h, indicating that steady‐state is reached by approximately day 3. 7 , 9 , 10 Disposition studies in humans indicated that asciminib is mainly cleared via hepatic metabolism and elimination via biliary secretion (mean recovery of 80% from feces), 9 with oxidation by cytochrome P450 enzymes (CYP; 37.8%; of which 36% CYP3A4), direct glucuronidation by UDP‐glucuronosyltransferases (UGT; 27.9%; mainly UGT2B7, UGT2B17, and UGT1A3/4), and biliary secretion by breast cancer resistance protein (BCRP; 31.1%) being the main pathways involved (Novartis, unpublished data). 9 , 10 Renal excretion plays only a minor role in the clearance of asciminib (2.5% unchanged asciminib in urine). 9 Circulating drug‐related material is primarily found in the plasma, with unchanged asciminib accounting for >90% of drug‐related exposure and no major metabolite observed (i.e., no metabolite with systemic exposure >10% of the total drug‐related exposure). 9
Conversely, in vitro studies in human liver microsomes demonstrated that asciminib is a reversible inhibitor of CYP3A4/5, CYP2C9, and CYP2C8, with unbound inhibitory constant (Ki,u) values of 0.348, 0.407, and 0.466 μM, respectively (Novartis, unpublished data). In patients with CML, the maximum therapeutic exposure of asciminib (maximum plasma concentration [Cmax] at steady‐state) is 1.77 μM for total asciminib and 0.048 μM for unbound asciminib at 40 mg bid (Novartis, unpublished data). Therefore, a partial enzyme inhibition is indicated, and consequently a drug–drug interaction (DDI) in vivo cannot be excluded.
The primary objective of this study was to evaluate in healthy participants the effect of asciminib (40 mg b.i.d. at steady‐state) as a potential perpetrator of CYP3A‐, CYP2C9‐, and CYP2C8‐mediated DDI by assessing its effect on the single‐dose PK of the sensitive CYP3A substrate midazolam, the sensitive CYP2C9 substrate warfarin, and the sensitive CYP2C8 substrate repaglinide. Additionally, the safety, tolerability, and PK of asciminib when co‐administered with these agents, and the PK of the probe substrate metabolites, were assessed.
METHODS
This clinical study was conducted in accordance with the principles of the Declaration of Helsinki and local laws and regulations. Written informed consent was provided by all participants before any study procedures took place. The study protocol and all amendments were reviewed by the independent ethics committee and/or institutional review board for each study center.
Study design and treatment administration
This was a phase I, single‐center (Germany), open‐label, crossover, single‐sequence, DDI study comprising two stages in two sets of participants (Figure 1). Stage 1 (22 participants) investigated the effect of asciminib as a potential perpetrator of CYP3A (using midazolam) and CYP2C9 (using warfarin). Stage 2 (25 participants; representing a separate group from those in stage 1), investigating the effect of asciminib as a potential perpetrator of CYP2C8 (using repaglinide), was to be conducted only if safety permitted, and if in stage 1 a relevant effect (≥25% increase in exposure; see later) on the CYP2C9 substrate warfarin was observed.
FIGURE 1.
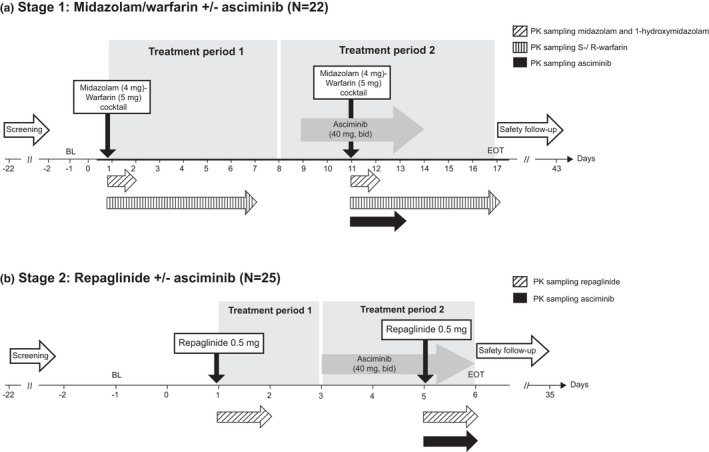
Study design. The two daily doses of asciminib (morning and evening) were taken 12 h apart. In stage 1, the two‐probe drug cocktail (midazolam/warfarin) was administered after the morning dose of asciminib on day 11 (with the evening dose of asciminib administered 12 h later). In stage 2, repaglinide was administered after the morning dose of asciminib on day 5 (with the evening dose of asciminib administered 12 h later). Pharmacokinetic (PK) sampling for midazolam and 1‐hydroxymidazolam were at pre‐dose (0 h), at 0.5, 1, 2, 3, 4, 6, 8, and 12 h post‐dose (days 1 and 11), and at 24 h post‐dose (days 2 and 12). S‐/R‐warfarin PK sampling times were at pre‐dose and at 1, 2, 3, 4, 5, 6, 8, 10, and 12 h post‐dose (days 1 and 11), and at 24, 48, 72, 96, 120, 144 h post‐dose (days 2–7 and 12–17). Repaglinide PK sampling times were at pre‐dose and at 0.25, 0.5. 0.75, 1, 1.5, 2, 3, 4, 6, 8, 10, and 12 h post‐dose (days 1 and 5), and at 24 h post‐dose (days 2 and 6). Asciminib PK samples during stage 1 were collected on days 11–13 at pre‐dose, and on days 11 and 12 at 0.5, 1, 2, 3, 4, 5, 6, 8, 10, 11, and 12 h post‐dose (with the last sample collected prior to administration of the asciminib evening dose); during stage 2, they were collected on day 5 at pre‐dose and at 0.5, 1, 2, 3, 4, 5, 6, 8, 10, and 12 h post‐dose (with the last sample collected prior to administration of the asciminib evening dose), and on day 6 at 12 h post‐dose (with the sample collected 12 h after the administration of the asciminib evening dose on day 5). Sampling times for prothrombin pharmacodynamic analysis were at pre‐dose and at 1, 2, 4, 8, and 12 h post‐dose (days 1 and 11), and at 24, 48, 72, 96, 120, and 144 h post‐dose (days 2–7 and 12–17). Safety assessments were performed on all days during this period. b.i.d., twice daily; BL, baseline; EOT, end‐of‐treatment; PK, pharmacokinetic
Stage 1 consisted of a screening period, two treatment periods, and a safety follow‐up of 30 days after asciminib dosing (Figure 1). During treatment period 1, a single oral dose of a two‐drug cocktail of warfarin 5 mg (tablet) and midazolam 4 mg (2 ml of 2 mg/ml oral solution syrup) was administered on day 1 (morning). The two‐drug cocktail approach was chosen to more efficiently characterize multiple DDIs, and is supported by guidance from the FDA 11 and European Medicines Agency (EMA) 12 as no interactions between the CYP probes warfarin and midazolam have been reported. 13 , 14 During treatment period 2, asciminib 40 mg b.i.d. (oral tablet; taken in the morning and at 12 h after the morning dose) was administered for 5 days starting on day 9, with a single oral dose of the midazolam/warfarin drug cocktail co‐administered with the asciminib morning dose on day 11.
Stage 2 followed a similar single‐sequence design as stage 1 (Figure 1). During treatment period 1, a single oral dose of repaglinide 0.5 mg (tablet) was administered on day 1 (morning); during treatment period 2, asciminib 40 mg b.i.d. (oral; taken in the morning and at 12 h after the morning dose) was administered for 3 days starting on day 3, with a single oral dose of repaglinide 0.5 mg co‐administered with the asciminib morning dose on day 5.
Tablets were taken within approximately 2 min of each other, starting with asciminib, and with a total of 240 ml of water. On days of co‐administration of asciminib and the two‐drug cocktail, asciminib was taken first, followed by the midazolam syrup and the warfarin tablet. No fluid intake was allowed 1 h pre‐ and 1‐hour post‐dosings. On days when asciminib was administered alone, participants were required to fast for ≥2 h before and 1 h after dosing. On days when probe substrates were administered (in the absence or presence of asciminib), participants were required to fast for ≥10 h before and 4 h after dosing.
In both stages, safety assessments were performed on all days during periods 1 and 2, with a safety follow‐up 30 days after the last dosing on days 13 and 5, respectively (i.e., on day 43 in stage 1, and on day 35 in stage 2). Stage 1 was initiated with three participants only to ensure the safety of healthy volunteers. Following safety assessments of these three participants on day 17 (i.e., 4 days after the last dosing of asciminib and ≥5 terminal half‐lives), enrollment of the remaining participants was to be continued, provided there were no tolerability issues observed in the first three participants.
No medication other than the study treatment was allowed from 2 weeks prior to the first dosing of study treatment until all end‐of‐treatment evaluations were conducted, except for medications required to treat adverse events (AEs) and acetaminophen/paracetamol. Drugs that prolong QT‐interval, and drugs that are inhibitors or inducers of CYP3A4/5, BCRP, or P‐glycoprotein, were not allowed within 4 weeks before the first dose of study treatment and until end‐of‐treatment. The consumption of grapefruits, Seville oranges, cranberries, and pomegranates, and their products, was to be avoided from 7 days prior to dosing until the end of the study. Additional information on use of alcohol and smoking are provided in the Supplementary Material.
Participants
Healthy male or female (sterile or post‐menopausal) adults (aged 18–55 years), with a body weight between 50 and 120 kg, and a body mass index (BMI) between 18.5 and 29.9 kg/m2 were included in the study. Participants had to be in good health with no clinically significant abnormalities at baseline, based on medical history, physical examination, vital signs, electrocardiogram (ECG), and routine laboratory testing. Exclusion criteria are summarized in the Supplementary Material.
End points
Primary end points were the PK parameters Cmax, area under the curve (AUC) from zero to the last quantifiable concentration (AUClast), and AUC from zero to infinity (AUCinf) of the probe substrate midazolam, S‐warfarin and R‐warfarin, and repaglinide. Secondary end points included additional PK parameters of the probe substrate (Tmax, T 1/2, apparent plasma clearance [CL/F], and apparent volume of distribution during terminal phase [Vz/F]), PK parameters of the midazolam metabolite 1‐hydroxymidazolam (AUClast, AUCinf, Cmax, Tmax, and the metabolite‐to‐parent ratios for AUClast and AUCinf), and PK parameters of asciminib (Cmax, AUClast, AUCinf, CL/F, Tmax, T 1/2, and AUC from zero to 12 h post‐dosing [AUCtau]).
Additional secondary end points were pharmacodynamic (PD) parameters assessing the anticoagulation effect of warfarin (maximum prothrombin time [PTmax], the time to reach PTmax, the AUC for prothrombin time [PTauc], the maximum International Normalized Ratio [INRmax], the maximum time to reach INRmax, and the AUC of INR [INRauc]), and PD parameters assessing the glucose‐metabolizing activity of repaglinide (blood glucose concentration–time profile). The safety of asciminib was also assessed, based on the incidence of AEs and serious AEs (SAEs; coded using Medical Dictionary for Regulatory Activities [MedDRA] version 21.1 and Common Terminology Criteria for AEs [CTCAE] version 5), changes in hematology and blood chemistry values, vital signs, and ECG.
PK sampling and assessments
Sampling times of blood samples (2 ml) for PK analyses are indicated in Figure 1. All plasma samples were stored frozen at ≤−60°C until analysis. Plasma concentrations of midazolam, 1‐hydroxymidazolam, S‐/R‐warfarin, repaglinide, and asciminib were determined using validated liquid chromatography‐tandem mass spectrometry (LC‐MS/MS; www.veedacr.com) assays with dynamic ranges of 0.3–60 ng/ml for midazolam, 0.1–20 ng/ml for 1‐hydroxymidazolam, 1–1000 ng/ml for S‐/R‐warfarin, 50–10000 pg/ml for repaglinide, and 1.00–5000 ng/ml for asciminib (Supplementary Material). Plasma concentrations of asciminib were determined using validated LC‐MS/MS and a dynamic range of 1.00–5000 ng/ml, as described previously. 10 The methods were validated for specificity, sensitivity, matrix effect, recovery, linearity, accuracy and precision, dilution integrity, batch size, and stability. Values below the lower limit of quantification were treated as missing. The PK parameters were derived from individual plasma concentration–time profiles using non‐compartmental methods using Phoenix WinNonlin (Pharsight, Mountain View, CA, USA) software version 6.4.
Statistical analysis
Based on previously reported data, 15 the highest intra‐subject variability estimates (CV%) for AUC or Cmax of midazolam and warfarin were 24.14% and 19%, respectively. Using these intra‐subject CVs and a sample size of 18, the precision of the 90% CI for treatment difference comparison on the log scale will extend 0.109 for warfarin and 0.138 for midazolam from the observed difference in the means. These calculations are based on t‐distribution with two‐sided α‐level of 0.10 and N–1 degrees of freedom. Assuming a potential dropout rate of 20%, 22 participants were enrolled to ensure at least 18 evaluable participants were available in stage 1.
For stage 2, based on the largest intra‐subject CV% observed for repaglinide PK parameter of 26.36% for AUCinf (Novartis, unpublished data) and a sample size of 20, the precision of 90% CI for treatment difference comparison on the log scale will extend 0.142 from the observed difference in means. Assuming a potential dropout rate of 20%, 25 participants were enrolled to ensure at least 20 participants were evaluable in stage 2.
PK analysis included all participants who provided an evaluable PK profile for at least one of the PK collection days. The safety set included all participants who received at least one dose of any study treatment (asciminib, midazolam, warfarin, or repaglinide). PK parameters were summarized using the geometric mean (G mean), geometric coefficients of variation (GCV%), median, minimum, and maximum. A formal statistical comparison of test versus reference was performed for the primary PK parameters Cmax, AUClast, and AUCinf of each probe substrate. A linear mixed model was fitted to the log‐transformed PK parameters to estimate the effect of asciminib on the probe substrates, with treatment included as a fixed effect, and participant as a random effect. Adjusted G mean estimates were obtained from this model. For each comparison, a point estimate and the corresponding two‐sided 90% CI for the difference between means of test and reference treatment were calculated. This point estimate was anti‐log transformed to obtain the point estimates and the 90% CI for the G mean ratio of test versus reference on the original scale. For stage 2 to be carried out, the results from stage 1 had to show a point estimate for the G mean ratio of either S‐warfarin or R‐warfarin AUClast or AUCinf of ≥1.25 (comparing S‐/R‐warfarin + asciminib vs. S‐/R‐warfarin alone).
For the prothrombin PD analysis, a linear mixed model similar to that used for the primary PK parameters was fitted to the log‐transformed PD parameters (PTmax, PTauc, INRmax, and INRauc). The PD assessment for repaglinide was performed by plotting the blood glucose concentration–time curve during the 6‐h collection interval by treatment (stage 2: repaglinide alone, repaglinide + asciminib). In addition, descriptive statistics were provided for all primary and secondary PK parameters, with the median and range for Tmax, and for all PD parameters.
RESULTS
Participants’ disposition and baseline characteristics
Of the 22 participants enrolled in stage 1, 21 (95.5%) participants completed the study; 1 participant discontinued on day 7 for reasons unrelated to study treatment. The study progressed to stage 2 per protocol, as the increase in warfarin exposure in stage 1 was ≥1.25‐fold. Of the 25 participants enrolled in stage 2, 24 (96.0%) completed the study; 1 participant discontinued due to an AE (emotional distress, on day 5; deemed unrelated to study treatment by the study investigator). At baseline, the median age in stages 1 and 2 was 38.5 years and 41.0 years, respectively. In both stages, most study participants were male (stage 1, 100% [n = 22]; stage 2, 84.0% [n = 21]). The median BMI was 25.0 kg/m2 in both stages. Among stage 1 participants, most (59.1%) were of the CYP2C9*1*1 genotype (Table 1). The most common concomitant medication required during the study was paracetamol, taken by 9.1% and 4% of participants in stages 1 and 2, respectively.
TABLE 1.
Demographics and baseline characteristics
| Demographics and baseline characteristics |
Stage 1 (midazolam and warfarin ± asciminib) (N = 22) |
Stage 2 (repaglinide ± asciminib) (N = 25) |
|---|---|---|
| Median age (range), years | 38.5 (23–54) | 41.0 (26–55) |
| Sex, n (%) | ||
| Male | 22 (100.0) | 21 (84.0) |
| Female | 0 | 4 (16.0) |
| Race, n (%) | ||
| White | 21 (95.5) | 24 (96.0) |
| Asian | 1 (4.5) | 1 (4.0) |
| Ethnicity, n (%) | ||
| Other | 21 (95.5) | 24 (96.0) |
| Hispanic/Latino | 1 (4.5) | 0 |
| West Asian | 0 | 1 (4.0) |
| Median weight (range), kg | 80.0 (61.2–98.4) | 85.3 (58.4–109.4) |
| Median BMI (range), kg/m2 | 25.2 (19.9–29.4) | 25.1 (20.7–29.9) |
| CYC2C9 genotype a , n (%) | ||
| CYP2C9*1*1 | 13 (59.1) | NA |
| CYP2C9*1*2 | 6 (27.3) | NA |
| CYP2C9*1*3 | 3 (13.6) | NA |
Abbreviations: BMI, body mass index; NA, not applicable.
Individuals with a CYP2C9 genotype associated with poor CYP2C9 activity (CYP2C9*2 and CYP2C9*3) are expected to be less sensitive to a potential inhibitory effect. Hence, CYP2C9 genotype status was determined in all stage 1 participants.
DDI of asciminib with midazolam and warfarin (stage 1)
The concentration–time profiles of midazolam and S‐/R‐warfarin revealed minor increases in plasma concentration when midazolam and warfarin were administered with asciminib compared with administration of the probe substrates alone (Figure 2a,b). Primary and secondary midazolam PK parameters are summarized in Table 2. In a statistical comparison of the primary midazolam PK parameters with midazolam + asciminib versus midazolam alone, the estimated G mean ratios (90% CI) for AUCinf, AUClast, and Cmax were 1.28 (1.15, 1.43), 1.27 (1.14, 1.41), and 1.11 (0.96, 1.28), respectively (Table 3). Median midazolam Tmax was 0.49 h with midazolam + asciminib and 0.51 h with midazolam alone.
FIGURE 2.

Arithmetic mean (standard deviation) and median plasma concentration–time profiles of midazolam (a), S‐warfarin (b), R‐warfarin (c), and repaglinide (d) when probe substrate was administered alone or with asciminib. Linear views are shown in the main panel, with semi‐logarithmic views in the top right‐hand corner; midazolam/warfarin, n = 22; repaglinide, n = 25
TABLE 2.
Pharmacokinetic parameters of midazolam, S‐/R‐warfarin, and repaglinide when administered alone or at steady‐state asciminib
| Stage 1 | Stage 2 | |||||||
|---|---|---|---|---|---|---|---|---|
| PK parameter | Midazolam | S‐Warfarin | R‐Warfarin | Repaglinide | ||||
| Treatment | Midazolam | Midazolam + asciminib | Warfarin | Warfarin + asciminib | Warfarin | Warfarin + asciminib | Repaglinide | Repaglinide + asciminib |
| AUCinf (ng × h/ml) | ||||||||
| n | 22 | 21 | 21 | 20 | 18 | 15 | 23 | 24 |
| G mean (GCV%) | 37.4 (31.2) | 48.2 (38.8) | 7350 (23.9) | 10200 (24.8) | 10500 (22.0) | 13100 (24.6) | 10800 (36.8) | 11600 (38.2) |
| AUClast (ng × h/ml) | ||||||||
| n | 22 | 21 | 21 | 21 | 21 | 21 | 25 | 24 |
| G mean (GCV%) | 35.4 (30.7) | 44.9 (38.1) | 6480 (22.8) | 9010 (23.4) | 9700 (24.7) | 12000 (25.3) | 10300 (37.4) | 11300 (39.0) |
| Cmax (ng/ml) | ||||||||
| n | 22 | 21 | 22 | 21 | 22 | 21 | 25 | 24 |
| G mean (GCV%) | 15.9 (30.4) | 17.6 (36.0) | 209 (18.6) | 225 (17.2) | 196 (19.6) | 213 (20.4) | 6710 (40.6) | 7660 (45.1) |
| T max (h) | ||||||||
| n | 22 | 21 | 22 | 21 | 22 | 21 | 25 | 24 |
| median (range) | 0.51 (0.46–1.52) | 0.49 (0.47–1.01) | 2.00 (0.99–4.00) | 2.00 (0.94–3.99) | 2.01 (0.99–12.0) | 2.95 (0.94–11.7) | 0.75 (0.50–1.98) | 0.73 (0.48–1.01) |
| T 1/2 (h) | ||||||||
| n | 22 | 21 | 21 | 20 | 18 | 15 | 23 | 24 |
| G mean (GCV%) | 2.7 (44.2) | 3.4 (50.9) | 47.6 (27.8) | 50.6 (18.7) | 50.0 (19.3) | 52.4 (15.7) | 2.42 (46.2) | 2.09 (76.3) |
| CL/F (L/h) | ||||||||
| n | 22 | 21 | 21 | 20 | 18 | 15 | 23 | 24 |
| G mean (GCV%) | 107 (31.2) | 83.0 (38.8) | 0.68 (23.9) | 0.49 (24.8) | 0.48 (22.0) | 0.38 (24.6) | 46.3 (36.8) | 43.2 (38.2) |
| Vz/F (L) | ||||||||
| n | 22 | 21 | 21 | 20 | 18 | 15 | 23 | 24 |
| G mean (GCV%) | 413 (30.6) | 412 (34.8) | 46.7 (35.1) | 35.6 (29.9) | 34.2 (17.8) | 28.9 (16.5) | 162 (51.0) | 130 (79.5) |
Results were back‐transformed to obtain the adjusted G mean, G mean ratio, and 90% CI.
AUCinf, area under the plasma concentration–time curve from zero to infinity; AUClast, area under the plasma concentration–time curve from zero to the last quantifiable concentration; Cmax, maximum plasma concentration; CI, confidence interval; CL/F, apparent total plasma clearance after oral administration; G mean, geometric mean; GCV%, geometric coefficient of variation; h, hour; n, number of observations used for analysis; PK, pharmacokinetic; T 1/2, terminal elimination half‐life; Tmax, time to reach Cmax; Vz/F, apparent volume of distribution during the terminal elimination phase.
TABLE 3.
Statistical comparison of primary pharmacokinetic parameters of midazolam, S‐/R‐warfarin, and repaglinide when administered alone or at steady‐state asciminib
| PK parameter | Treatment | n |
Adjusted G mean |
Comparison | Treatment comparison | |
|---|---|---|---|---|---|---|
| G mean ratio | 90% CI | |||||
| Midazolam | ||||||
| AUCinf (ng × h/ml) | Midazolam | 22 | 37.4 | Midazolam + asciminib/midazolam | 1.28 | 1.15–1.43 |
| Midazolam + asciminib | 21 | 48.0 | ||||
| AUClast (ng × h/ml) | Midazolam | 22 | 35.4 | Midazolam + asciminib/midazolam | 1.27 | 1.14–1.41 |
| Midazolam + asciminib | 21 | 44.8 | ||||
| Cmax (ng/ml) | Midazolam | 22 | 15.9 | Midazolam + asciminib/midazolam | 1.11 | 0.96–1.28 |
| Midazolam + asciminib | 21 | 17.6 | ||||
| S‐Warfarin | ||||||
| AUCinf (ng × h/ml) | Warfarin | 21 | 7350 | Warfarin + asciminib/warfarin | 1.41 | 1.37–1.45 |
| Warfarin + asciminib | 20 | 10,300 | ||||
| AUClast (ng ×h/ml) | Warfarin | 21 | 6480 | Warfarin + asciminib/warfarin | 1.39 | 1.36–1.42 |
| Warfarin + asciminib | 21 | 9010 | ||||
| Cmax (ng/ml) | Warfarin | 22 | 209 | Warfarin + asciminib/warfarin | 1.08 | 1.04–1.13 |
| Warfarin + asciminib | 21 | 227 | ||||
| R‐Warfarin | ||||||
| AUCinf (ng ×h/ml) | Warfarin | 18 | 10,800 | Warfarin + asciminib/warfarin | 1.25 | 1.21–1.29 |
| Warfarin + asciminib | 15 | 13,500 | ||||
| AUClast (ng ×h/ml) | Warfarin | 21 | 9700 | Warfarin + asciminib/warfarin | 1.24 | 1.21–1.26 |
| Warfarin + asciminib | 21 | 12,000 | ||||
| Cmax (ng/ml) | Warfarin | 22 | 196 | Warfarin + asciminib/warfarin | 1.10 | 1.04–1.15 |
| Warfarin + asciminib | 21 | 215 | ||||
| Repaglinide | ||||||
| AUCinf (ng ×h/ml) | Repaglinide | 23 | 10,600 | Repaglinide + asciminib/repaglinide | 1.08 | 1.02–1.14 |
| Repaglinide + asciminib | 24 | 11,400 | ||||
| AUClast (ng ×h/ml) | Repaglinide | 25 | 10,300 | Repaglinide + asciminib/repaglinide | 1.09 | 1.03–1.15 |
| Repaglinide + asciminib | 24 | 11,200 | ||||
| Cmax (ng/ml) | Repaglinide | 25 | 6710 | Repaglinide + asciminib/repaglinide | 1.14 | 1.01–1.28 |
| Repaglinide +asciminib | 24 | 7640 | ||||
Results were back‐transformed to obtain the adjusted G mean, G mean ratio, and 90% CI.
AUCinf, area under the plasma concentration–time curve from zero to infinity; AUClast, area under the plasma concentration–time curve from zero to the last quantifiable concentration; CI, confidence interval; Cmax, maximum plasma concentration; G mean, geometric mean; GCV%, geometric coefficient of variation; n, number of observations used for analysis; PK, pharmacokinetic.
For the midazolam metabolite 1‐hydroxymidazolam, minor increases in G mean AUCinf, AUClast, and Cmax were noted when midazolam was administered with asciminib compared with midazolam alone (Table S1), whereas the metabolite‐to‐parent ratios of G mean AUCinf, and AUClast decreased slightly (0.29 vs. 0.31 for AUCinf and 0.27 vs. 0.31 for AUClast).
Primary and secondary warfarin PK parameters are summarized in Table 2. In a statistical comparison of the primary warfarin PK parameters with warfarin plus asciminib versus warfarin alone, the estimated G mean ratios (90% CI) for AUCinf, AUClast, and Cmax were 1.41 (1.37, 1.45), 1.39 (1.36, 1.42), and 1.08 (1.04, 1.13), respectively, for S‐warfarin and 1.25 (1.21, 1.29), 1.24 (1.21, 1.26), and 1.10 (1.04, 1.15), respectively, for R‐warfarin (Table 3). Primary PK parameters of S‐warfarin and R‐warfarin showed increased exposures when administered with asciminib irrespective of the CYP2C9 genotype (data not shown); however, the numbers of participants in the allele subgroups were low and the results have to be interpreted with caution. Median Tmax of S‐warfarin was unchanged (2.0 h vs. 2.0 h) and that of R‐warfarin was slightly prolonged (3.0 h vs. 2.0 h) with warfarin + asciminib compared with warfarin alone.
DDI of asciminib with repaglinide (stage 2)
Since in stage 1 the G mean ratio of S‐warfarin AUCinf was ≥1.25, stage 2 was conducted as per protocol. The concentration–time profiles of repaglinide revealed a minimal increase in plasma concentration when administered with asciminib compared with repaglinide alone (Figure 2c). Primary and secondary repaglinide PK parameters are summarized in Table 2. In a statistical comparison of the primary repaglinide PK parameters with repaglinide + asciminib versus repaglinide alone, the estimated G mean ratios (90% CI) for AUCinf, AUClast, and Cmax were 1.08 (1.02, 1.14), 1.09 (1.03, 1.15), and 1.14 (1.01, 1.28), respectively (Table 3). Median Tmax of repaglinide was similar (0.75 h vs. 0.73 h), but G mean T1/2 was slightly shorter (2.1 h vs. 2.4 h) in the presence of asciminib compared with repaglinide alone.
Pharmacokinetic analyses of asciminib
At steady‐state asciminib (40 mg b.i.d.), the median (range) Tmax of asciminib was 2.98 h (1.99–4.02) in stage 1 and 1.99 h (1.00–3.98) in stage 2 (Table S2). G mean (GCV%) Cmax and AUCtau were 836 ng/ml (23.7%) and 5510 ng × h/ml (27.4%), respectively, in stage 1, and 799 ng/ml (32.3%) and 5430 ng × h/ml (28.5%), respectively, in stage 2.
Pharmacodynamic analysis
To assess the anticoagulation activity of warfarin when co‐administered with asciminib, a prothrombin analysis was performed. The anticoagulation activity of warfarin was unaffected by co‐administration with asciminib, as evidenced by G mean ratios of PTauc and INRmax of 1.0 and 0.996, respectively (Table S3). Similarly, there was no difference in the glucose‐metabolizing activity of repaglinide when administered alone or in combination with asciminib, as evidenced by overlapping blood glucose concentration–time profiles (Figure S1).
Safety
Overall, 18 (81.8%) participants in stage 1, and 6 (24.0%) participants in stage 2 experienced at least one AE during the study (Table 4). The most common AEs were fatigue (40.9%) and dizziness (22.7%) during stage 1, and headache and myalgia (8.0% each) during stage 2. No grade 3 or 4 AEs, SAEs, or deaths were reported during the study. AEs considered to be related to study treatment were reported in 15 (68.4%) participants during stage 1, and in 3 (12.0%) participants during stage 2. There were no AEs leading to treatment discontinuation during stage 1. During stage 2, one participant discontinued the study due to an AE (emotional distress [grade 2], on day 5; not considered to be related to the study drug). No clinically relevant abnormalities in laboratory evaluations including hematology, clinical chemistry, urinalysis, vital signs, or ECG were reported during the study.
TABLE 4.
Summary of adverse events reported in ≥5% of participants by preferred term
| Stage 1 (midazolam and warfarin ± asciminib) | All grades |
|---|---|
| (N = 22) | |
| Participants with at least one event, n (%) | 18 (81.8) |
| Fatigue | 9 (40.9) |
| Dizziness | 5 (22.7) |
| Headache | 4 (18.2) |
| Dysphonia | 3 (13.6) |
| Abdominal pain | 2 (9.1) |
| Diarrhea | 2 (9.1) |
| Dyspepsia | 2 (9.1) |
| Dyspnea | 2 (9.1) |
| Feeling hot | 2 (9.1) |
| Somnolence | 2 (9.1) |
| Stage 2 (repaglinide ± asciminib) | N = 25 |
| Participants with at least one event, n (%) | 6 (24.0) |
| Headache | 2 (8.0) |
| Myalgia | 2 (8.0) |
A participant with multiple severity grades for an adverse event was counted only once under the maximum grade.
N, number of participants in a subset; N, total number of participants.
DISCUSSION
This DDI study in healthy participants assessed the role of asciminib as a potential perpetrator of CYP3A, CYP2C9, and CYP2C8, using the sensitive substrates midazolam, warfarin, and repaglinide, respectively.
In the assessment of the DDI between asciminib and midazolam, co‐administration of midazolam at asciminib steady‐state resulted in an increase in midazolam AUCinf, AUClast, and Cmax by 28%, 27%, and 11%, respectively, compared with midazolam alone. According to FDA guidance, 11 agents that increase the AUC of a sensitive index substrate of a given metabolic pathway by ≥1.25‐ to <2‐fold are considered weak inhibitors. Therefore, we conclude that asciminib is a weak inhibitor of CYP3A. For the CYP3A‐dependent midazolam metabolite 1‐hydroxymidazolam, a minor increase in exposure was observed when midazolam was co‐administered with asciminib compared with midazolam alone; however, the metabolite‐to‐parent ratio decreased slightly providing additional supportive evidence that the inhibitory effect of asciminib on CYP3A is modest.
The DDI analysis between asciminib and warfarin assessed the effect on both warfarin enantiomers, with the S‐enantiomer being the predominant pharmacologically active form. 16 Co‐administration of warfarin at asciminib steady‐state resulted in an increase of S‐warfarin AUCinf, AUClast, and Cmax by 40%, 39%, and 9%, respectively, and an increase in R‐warfarin AUCinf, AUClast, and Cmax by 25%, 24%, and 10%, respectively, suggesting that asciminib is a weak inhibitor of CYP2C9. T 1/2 of S‐/R‐ warfarin was similar, whereas Vz/F and CL/F of S‐/R‐ warfarin were slightly lower when warfarin was co‐administered with asciminib versus without asciminib. The modest DDI of asciminib with warfarin was further supported by PD analyses, showing that the anticoagulation effect of warfarin was not relevantly affected by co‐administration with asciminib at steady‐state.
Exposure data for midazolam and warfarin observed in this study are generally in line with historical controls for these agents, supporting the validity of the present study; for example, with warfarin (10 mg oral; i.e., a higher dose than the 5 mg used in the present study), S‐/R‐ warfarin median Cmax, Tmax, and T 1/2 have been reported as 1.7–2.0 μM (corresponding to ~500–600 ng/ml), 2 h, and 32–42 h, respectively 17 ; with midazolam (7.5 mg oral; i.e., a higher dose than the 4 mg used in the present study), median midazolam Cmax, Tmax, and T 1/2 have been reported to be 63.1 ng/ml, 0.34 h, and 3.2 h, respectively. 18
In stage 1 of the present study, the increase in warfarin exposure with warfarin plus asciminib versus warfarin alone met the predefined threshold (G mean ratio of AUClast or AUCinf of ≥1.25), and hence stage 2 of the study, assessing the potential DDI of asciminib with the CYP2C8 substrate repaglinide, was initiated. In the presence of asciminib, repaglinide AUCinf, AUClast, and Cmax increased by 8%, 9%, and 14%, respectively. This indicates that asciminib at steady‐state concentrations has no relevant effect on CYP2C8, as also evidenced by no apparent effect on the glucose‐lowering activity of repaglinide.
The effect of steady‐state asciminib on the PK of the probe substrates of CYP3A4/5, CYP2C9, and CYP2C8 observed in this study confirms the finding from a static net effect model 19 based on in vitro data in human liver microsomes and the unbound portal vein concentration of asciminib 40 mg b.i.d. For CYP3A4 inhibition, the net effect model predicted an AUC ratio of 1.93 (Novartis, unpublished data), which is slightly higher than the observed G mean ratio of 1.28. For CYP2C8 and CYP2C9, the model‐predicted AUC changes of 1.17 and 1.26 were similar to the observed G mean ratios of 1.08 and 1.40, respectively (Novartis, unpublished data).
The treatments were generally well tolerated, and the observed safety profile was consistent with the known safety experience with asciminib alone. 8 There were no grade 3/4 AEs, SAEs, or deaths, and no laboratory abnormalities or changes in vital signs were noted. During stage 1, fatigue (40.9%) and dizziness (22.7%) were the most commonly reported AEs, which can be attributed to the sedative effect of the probe drug midazolam.
Assessing multiple DDIs individually in several clinical trials can be time‐consuming and costly. Hence, for this study, the approach of a two‐drug cocktail was used to simultaneously assess the DDI of asciminib with midazolam and warfarin, a fast and efficient way to generate comprehensive DDI data for both agents. This approach is supported by guidance by the FDA 13 and EMA, 12 provided there is no interaction between substrates. The probe cocktail used in the present study is a subset of a five‐probe cocktail previously validated for the assessment of the activities of CYP1A2 (caffeine, 100 mg orally), CYP2C9 (warfarin, 10 mg orally), CYP2C19 (omeprazole, 20 mg orally), CYP3A (midazolam, 0.03 mg/kg orally), and CYP2D6 (metoprolol, 100 mg orally), 14 and therefore no mutual interactions are expected between the probe substrates midazolam and warfarin.
In summary, the findings from the present study assessing asciminib as a perpetrator show that asciminib 40 mg b.i.d. at steady‐state is a weak inhibitor of CYP3A and CYP2C9, and does not have a clinically relevant effect on CYP2C8. Asciminib co‐administration was well tolerated in this study in healthy participants, and the safety data were consistent with the known safety profile of asciminib given alone.
CONFLICTS OF INTEREST
All authors are employees of Novartis Pharmaceuticals Corporation. M.H. and F.H.P. hold stocks in Novartis.
AUTHOR CONTRIBUTIONS
M.H., F.H.P., and T.S. wrote the manuscript. M.H. and F.H.P. designed and performed the research. M.H., F.H.P., and T.S. analyzed the data.
Supporting information
Supplementary Material
ACKNOWLEDGMENTS
The authors thank Sara Armani, MD, of Parexel, Germany, principal investigator of the drug−drug interaction study, Yunlin Fu of Novartis Pharmaceuticals Corporation, USA, and Veeda Clinical Research Limited for their contribution to the bioanalytical methods and analyses, and Himabindu Gutha, PhD, of Novartis Healthcare Pvt Ltd, Hyderabad, India, for providing medical writing and editorial support for the manuscript.
Hoch M, Sengupta T, Hourcade‐Potelleret F. Pharmacokinetic drug interactions of asciminib with the sensitive cytochrome P450 probe substrates midazolam, warfarin, and repaglinide in healthy participants. Clin Transl Sci. 2022;15:1406‐1416. doi: 10.1111/cts.13252
Funding information
This study was sponsored by Novartis Pharmaceuticals Corporation.
DATA AVAILABILITY STATEMENT
Novartis will not provide access to patient‐level data, if there is a reasonable likelihood that individual patients could be re‐identified. Phase I studies, by their nature, present a high risk of patient re‐identification; therefore, patient individual results for phase I studies cannot be shared. In addition, clinical data, in some cases, have been collected subject to contractual or consent provisions that prohibit transfer to third parties. Such restrictions may preclude granting access under these provisions. Where co‐development agreements or other legal restrictions prevent companies from sharing particular data, companies will work with qualified requestors to provide summary information where possible.
REFERENCES
- 1. Thompson PA, Kantarjian HM, Cortes JE. Diagnosis and treatment of chronic myeloid leukemia in 2015. Mayo Clin Proc. 2015;90:1440‐1454. [DOI] [PMC free article] [PubMed] [Google Scholar]
- 2. Manley PW, Barys L, Cowan‐Jacob SW. The specificity of asciminib, a potential treatment for chronic myeloid leukemia, as a myristate‐pocket binding ABL inhibitor and analysis of its interactions with mutant forms of BCR‐ABL1 kinase. Leuk Res. 2020;98:106458. [DOI] [PubMed] [Google Scholar]
- 3. Schoepfer J, Jahnke W, Berellini G, et al. Discovery of asciminib (ABL001), an allosteric inhibitor of the tyrosine kinase activity of BCR‐ABL1. J Med Chem. 2018;61:8120‐8135. [DOI] [PubMed] [Google Scholar]
- 4. Wylie AA, Schoepfer J, Jahnke W, et al. The allosteric inhibitor ABL001 enables dual targeting of BCR‐ABL1. Nature. 2017;543:733‐737. [DOI] [PubMed] [Google Scholar]
- 5. Eide CA, Zabriskie MS, Savage Stevens SL, et al. Combining the allosteric inhibitor asciminib with ponatinib suppresses emergence of and restores efficacy against highly resistant BCR‐ABL1 mutants. Cancer Cell. 2019;36:431‐43 e5. [DOI] [PMC free article] [PubMed] [Google Scholar]
- 6. U. S. Food and Drug Administration . FDA approves asciminib for Philadelphia chromosome‐positive chronic myeloid leukemia. https://www.fda.gov/drugs/resources‐information‐approved‐drugs/fda‐approves‐asciminib‐philadelphia‐chromosome‐positive‐chronic‐myeloid‐leukemia (Accessed November 2021)
- 7. Hughes TP, Mauro MJ, Cortes JE, et al. Asciminib in chronic myeloid leukemia after ABL kinase inhibitor failure. N Engl J Med. 2019;381:2315‐2326. [DOI] [PMC free article] [PubMed] [Google Scholar]
- 8. Rea D, Mauro MJ, Boquimpani C, et al. A phase 3, open‐label, randomized study of asciminib, a STAMP inhibitor, vs bosutinib in CML after ≥2 prior TKIs. Blood 2021;138(21):2031‐2041. [DOI] [PMC free article] [PubMed] [Google Scholar]
- 9. Tran P, Hanna I, Eggimann FK, et al. Disposition of asciminib, a potent BCR‐ABL1 tyrosine kinase inhibitor, in healthy male subjects. Xenobiotica. 2020;50:160‐179. [DOI] [PubMed] [Google Scholar]
- 10. Hoch M, Sato M, Zack J, et al. Pharmacokinetics of asciminib in individuals with hepatic or renal impairment. J Clin Pharmacol. 2021;61:1454‐1465. [DOI] [PubMed] [Google Scholar]
- 11. U. S. Food and Drug Administration . FDA Center for Drug Evaluation and Research, Guidance for Industry; Clinical drug interaction studies – cytochrome P450 enzyme and transporter‐mediated drug interactions; 2020. https://www.fda.gov/media/134581/download (Accessed November 2021)
- 12. EMA Guideline on the investigation of drug interactions; 2012. https://www.ema.europa.eu/en/documents/scientific‐guideline/guideline‐investigation‐drug‐interactions‐revision‐1_en.pdf (Accessed November 2021)
- 13. Huang SM, Temple R, Throckmorton DC, Lesko LJ. Drug interaction studies: study design, data analysis, and implications for dosing and labeling. Clin Pharmacol Ther. 2007;81:298‐304. [DOI] [PubMed] [Google Scholar]
- 14. Turpault S, Brian W, Van Horn R, et al. Pharmacokinetic assessment of a five‐probe cocktail for CYPs 1A2, 2C9, 2C19, 2D6 and 3A. Br J Clin Pharmacol. 2009;68:928‐935. [DOI] [PMC free article] [PubMed] [Google Scholar]
- 15. He Y‐L, Sabo R, Riviere G‐J, et al. Effect of the novel oral dipeptidyl peptidase IV inhibitor vildagliptin on the pharmacokinetics and pharmacodynamics of warfarin in healthy subjects. Curr Med Res Opin. 2007;23:1131‐1138. [DOI] [PubMed] [Google Scholar]
- 16. Kaminsky LS, Zhang Z‐Y. Human P450 metabolism of warfarin. Pharmacol Ther. 1997;73:67‐74. [DOI] [PubMed] [Google Scholar]
- 17. Ngo N, Sabo R, Riviere G‐J, et al. The warfarin‐cranberry juice interaction revisited: a systematic in vitro‐in vivo evaluation. J Exp Pharmacol. 2010;2010:83‐91. [DOI] [PMC free article] [PubMed] [Google Scholar]
- 18. Link B, Haschke M, Grignaschi N, et al. Pharmacokinetics of intravenous and oral midazolam in plasma and saliva in humans: usefulness of saliva as matrix for CYP3A phenotyping. Br J Clin Pharmacol. 2008;66:473‐484. [DOI] [PMC free article] [PubMed] [Google Scholar]
- 19. Fahmi OA, Maurer TS, Kish M, Cardenas E, Boldt S, Nettleton D. A combined model for predicting CYP3A4 clinical net drug‐drug interaction based on CYP3A4 inhibition, inactivation, and induction determined in vitro. Drug Metab Dispos. 2008;36:1698‐1708. [DOI] [PubMed] [Google Scholar]
Associated Data
This section collects any data citations, data availability statements, or supplementary materials included in this article.
Supplementary Materials
Supplementary Material
Data Availability Statement
Novartis will not provide access to patient‐level data, if there is a reasonable likelihood that individual patients could be re‐identified. Phase I studies, by their nature, present a high risk of patient re‐identification; therefore, patient individual results for phase I studies cannot be shared. In addition, clinical data, in some cases, have been collected subject to contractual or consent provisions that prohibit transfer to third parties. Such restrictions may preclude granting access under these provisions. Where co‐development agreements or other legal restrictions prevent companies from sharing particular data, companies will work with qualified requestors to provide summary information where possible.