Abstract
Ultrafast dynamic contrast-enhanced (UF-DCE) MRI is a new approach to capture kinetic information in the very early post-contrast period with high temporal resolution while keeping reasonable spatial resolution. The detailed timing and shape of the upslope in the time–intensity curve are analyzed. New kinetic parameters obtained from UF-DCE MRI are useful in differentiating malignant from benign lesions and in evaluating prognostic markers of the breast cancers. Clinically, UF-DCE MRI contributes in identifying hypervascular lesions when the background parenchymal enhancement (BPE) is marked on conventional dynamic MRI. This review starts with the technical aspect of accelerated acquisition. Practical aspects of UF-DCE MRI include identification of target hypervascular lesions from marked BPE and diagnosis of malignant and benign lesions based on new kinetic parameters derived from UF-DCE MRI: maximum slope (MS), time to enhance (TTE), bolus arrival time (BAT), time interval between arterial and venous visualization (AVI), and empirical mathematical model (EMM). The parameters derived from UF-DCE MRI are compared in terms of their diagnostic performance and association with prognostic markers. Pitfalls of UF-DCE MRI in the clinical situation are also covered. Since UF-DCE MRI is an evolving technique, future prospects of UF-DCE MRI are discussed in detail by citing recent evidence. The topic covers prediction of treatment response, multiparametric approach using DWI-derived parameters, evaluation of tumor-related vessels, and application of artificial intelligence for UF-DCE MRI. Along with comprehensive literature review, illustrative clinical cases are used to understand the value of UF-DCE MRI.
Keywords: breast, compressed sensing, dynamic contrast enhanced, magnetic resonance imaging, ultrafast
Introduction
Dynamic contrast-enhanced (DCE) MRI is the standard method for evaluating breast lesions. ACR Breast Imaging Reporting and Data system (BI-RADS)1 recommends to take at least three timepoints for constructing time–intensity curves: pre-contrast, initial, and delayed phase post-contrast (ACR). Kinetic analysis obtained from DCE MRI reflects perfusion of the lesion; fast enhancement in the initial phase and wash-out in the delayed phase suggests malignancy. This conventional approach takes 6–10 minutes. Full protocol takes longer as it normally includes T2-weighted images (T2WI), T1-weighted images (T1WI), and diffusion-weighted images (DWI). With the increasing demand of breast MRI as a screening tool for those with higher risk of breast cancer, effort to reduce scanning time has been explored. Abbreviated breast MRI proposed by Kuhl et al.2 just need to acquire one pre- and one post-contrast image, to identify malignant breast lesions.
Ultrafast DCE (UF-DCE) MRI is a new approach to capture kinetic information in the very early post-contrast period with high temporal resolution while keeping reasonable spatial resolution. Instead of waiting for the contrast to wash-out, the detailed timing and shape of the upslope in the time–intensity curve are analyzed. Initial report by Mann et al.3 looked at the upslope, that was linked to malignant lesion with the diagnostic performance equivalent or better than conventional kinetic analysis. Meanwhile, other groups use the timing of lesion enhancement relative to the enhancement of the aorta,4,5 or the parameter obtained from curve fitting of the time–intensity curve.6 Kinetic information is an advantage of UF-DCE MRI over abbreviated MRI, while limited access to the high-spec MRI scanner is currently the disadvantage of UF-DCE MRI. Other drawbacks of UF-DCE MRI include the amount of data obtained within one scan time and the capacity of image storage.
UF-DCE MRI is a developing technique. Technical advancement and evidence to support clinical utility are reported from institutions including Japan. For example, UF-DCE MRI is useful in identifying hypervascular lesions when the background parenchymal enhancement (BPE) is marked, often observed in young women.7,8 On the other hand, there may be differences caused by the variation in image acquisition protocols. In order to clarify the value of UF-DCE MRI in the care of breast cancer patients, these variables should be clarified. This review aimed to overview the technical aspect of accelerated acquisition, summarize the kinetic parameter relevant to UF-DCE MRI in their diagnostic performance and association with prognostic markers, highlight the values and pitfalls of UF-DCE MRI in the clinical situation, and discuss the future research direction on UF-DCE MRI. Along with comprehensive literature review, illustrative clinical cases are used to understand the value of UF-DCE MRI.
Technical Aspect of UF-DCE MRI
Recent technical advancement for fast MRI definitely plays an important role in UF-DCE MRI in the clinical setting. Since UF-DCE MRI requires high temporal and spatial resolution, fast acquisition techniques including sophisticated parallel imaging, view sharing, and compressed sensing (CS) have been used. At present, there is no standard protocol for UF-DCE MRI and several imaging parameters, including the use of fat-suppression (or subtraction) and speed of contrast-agent injection, vary among vendors and institutions (Table 1).
Table 1.
UF-DCE MRI protocol in Japanese institutions
| Institution | Vendor | Scanner name | Magnetic field | Breast coil | UF protocol name | Technique | TR | TE | Flipangle | Fatsupression | FOV(mm) | Orientation | Slicethickness(mm) | Sliceno. |
|---|---|---|---|---|---|---|---|---|---|---|---|---|---|---|
| Kyoto Univ. | Siemens | Prisma/Skyra | 3T | 18-ch | Improved VIBE | CS | 4.8 | 2.5 | 15 | No | 360x360 | Axial | 2.5 | 60 |
| Saga Univ. | Siemens | Prisma | 3T | 18-ch | VIBE | PI | 5.87 | 2.87 | 10 | Yes | 360x360 | Axial | 2.5 | 48 |
| Saga Univ. (2) | Siemens | Prisma | 3T | 18-ch | Improved VIBE | CS | 3 | 1.2 | 12 | Yes | 360×360 | Axial | 2.5 | 48 |
| Nagoya Univ. | Siemens | Prisma | 3T | 18-ch | VIBE | CS | 3.5 | 1.44 | 10 | Yes | 200×350 | Axial | 2 | 72 |
| Dokkyo Univ. | Siemens | Skyra | 3T | 16-ch | TWIST | VS | 6.17 | 2.94 | 10 | Yes | 330×330 | Axial | 2.0 | 80 |
| KPUM | Siemens | Skyra | 3T | 16-ch | TWIST | VS | 5.6 | 1.4 | 10 | Yes | 360×360 | Axial | 2.5 | 60 |
| Tohoku Univ. | Philips | Intera Achieva | 3T | 16-ch | 3D-FS-T1WI GRE | PI | 2.8 | 1.5 | 10 | Yes | 350×350 | Axial | 4 | 80 |
| TMDU | GE | Signa Pioneer | 3T | 16-ch | DISCO | VS | 3.7 | 1.3 | 10 | Yes | 360×360 | Axial | 4 | 76 |
View-sharing involves sharing phase-encoded views from one image to the next in the reconstruction of a time series. Frequent sampling of central k-space contributes to the faster updates compared to the full sampling of k-space. Sequences using this method include time-resolved angiography with interleaved stochastic trajectories (TWIST),9 K-space weighted imaging contrast (KWIC),10 and differential subsampling with Cartesian ordering (DISCO).11 It is more widely available compared to the compressed sensing techniques. The drawback involves temporal blurring, leading to slightly blurred images.
CS is a technique to accelerate image data acquisition. Images with a sparse representation can be recovered from randomly under-sampled k‐space data. The use of nonlinear recovery scheme is necessary.12 Following the successful results in contrast-enhanced angiography, CS has been applied for UF-DCE MRI of the breast, enabling shorter acquisition time while maintaining high temporal and spatial resolution.13,14 The image quality obtained with CS reconstruction is affected by several parameters, including sampling pattern, regularization parameters, and sparsifying transformation. Iterative reconstruction is needed to achieve the minimization of two factors, i.e., data consistency and transform sparsity. Optimization of the number of the iteration is the key to obtain ideal images with reasonable image processing time.14–19
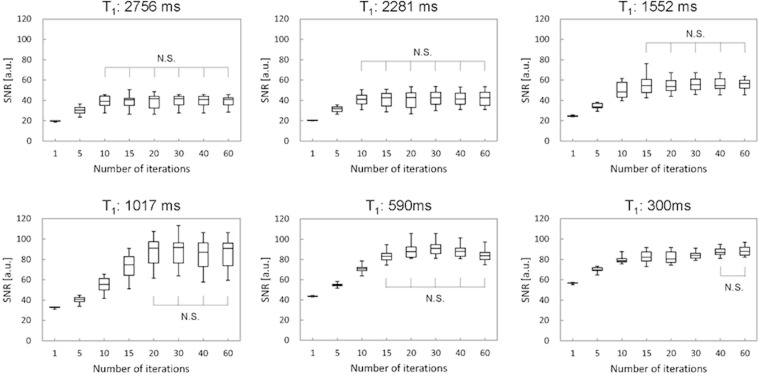
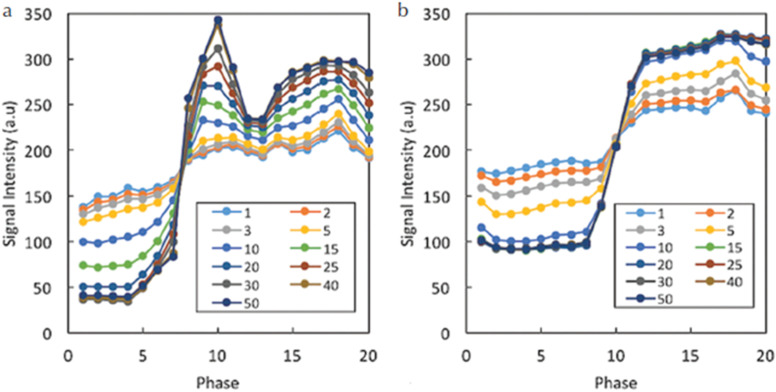
A previous phantom study using NIST phantom for a wide range of T1 values showed that the SNR decreased with fewer iterations and that the number of iterations which stabilized SNR depended on the T1 value (Fig. 1).20 The impact of number of iterations was also examined in in vivo study. Sagawa et al.14 demonstrated that the number of iterations which stabilized the kinetic parameters (e.g., wash-in slope) in malignant lesions was higher than that in benign lesions (Fig. 2). In addition, the signal difference between the pre- and post-contrast images was higher for the larger number of iterations, suggesting that an insufficient number of iterations resulted in averaging of contrast-enhancement effect in the time domain. On the other hand, since the reconstruction time increases linearly with the number of iterations, optimization of the number of iterations is important in clinical practice to achieve both reasonable reconstruction time and image fidelity. High-performance Central Processing Unit (CPU) or Graphics Processing Unit (GPU) may be required for computationally intensive CS reconstruction.
Fig. 1.
The figure shows the relationship between SNR and the number of iterations, which stabilizes SNR with various T1 values using the NIST phantom using the NIST phantom. Initially, SNR increases with increasing number of iterations. The ranges of number of iterations which achieve plateau SNR and demonstrated N.S. are considered stable. The ranges of number of iterations differ among various T1 values. N.S., no significant difference.
Fig. 2.
Exemplary results for the time–intensity curves in the aorta (a) and malignant lesion (b) for different numbers of iterations. The signal difference between pre- and post-contrast images is higher for larger numbers of iterations. This effect is larger for the aorta than for the lesion, and the required minimum number of iterations stabilizing the time–intensity curve is larger for the aorta. (From reference 14.
A practical issue in UF-DCE MRI is to store increased number of images in proportion to the improvement in time resolution, e.g., 1200 images in 20 phases × 60 slices. This may occupy a large amount of disk space in the storage system, so the storage plan of the image should be discussed.
How to Interpret UF-DCE MRI
Identification of target lesions
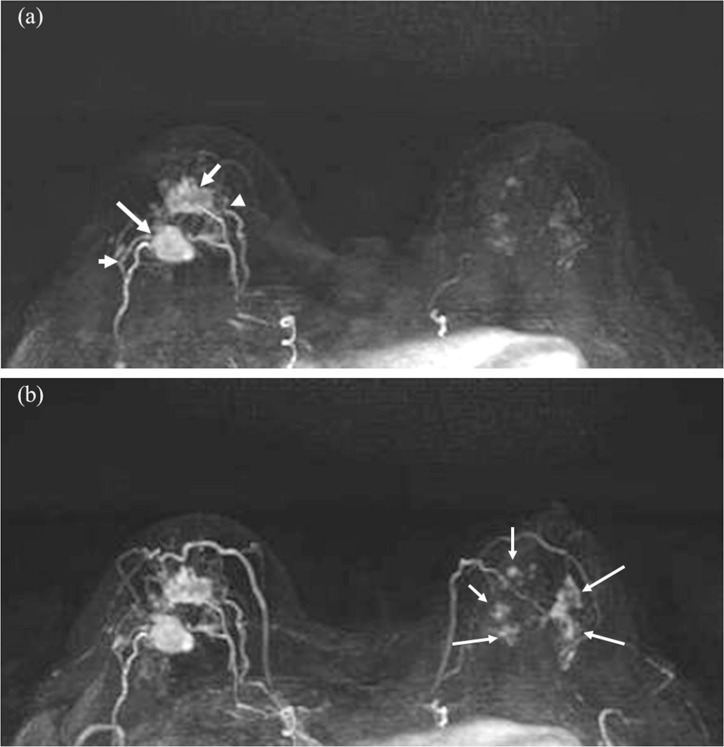
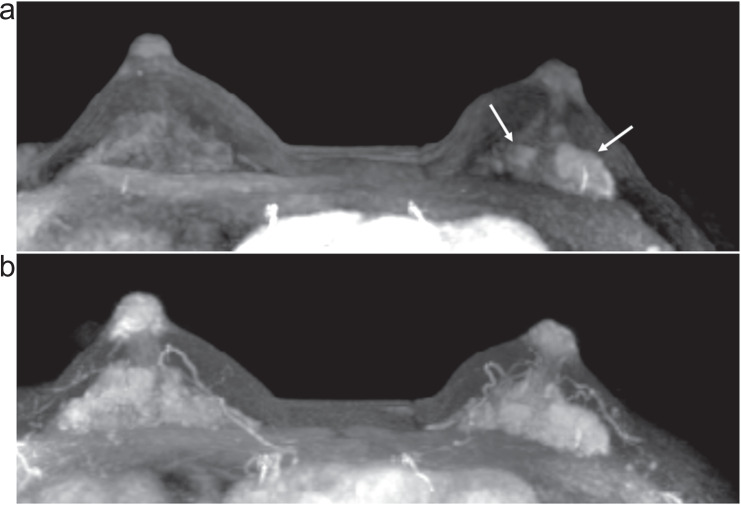
When the concept of clinically feasible UF-DCE MRI was proposed, it was described by Mann et al. as tumor stands out like a light bulb.3 Since most of the malignant tumor is more hypervascular compared to BPE or benign lesions, UF-DCE MRI is useful in identifying hypervascular malignant lesions (Fig. 3). Reduced BPE in UF-DCE MRI is one of the motivations to use this in the clinic, since younger patients and those with high-risk for breast cancer often demonstrate moderate-to-marked BPE, making diagnosis challenging. A study including 70 patients showed a significant lower level of BPE on UF-DCE MRI than standard early phase images.7 Among patients with higher BPE or premenopausal patients, UF-DCE MRI provided better lesion visibility. Another study also concluded that UF-DCE MRI could improve lesion conspicuity compared to conventional DCE-MRI, especially in women with premenopausal status and moderate-to-marked BPE.8 In practice, reviewing maximum intensity projection (MIP) images of several time frames from UF-DCE MRI is a quick way of finding the target lesions (Fig. 4).
Fig. 3.
Invasive carcinoma (ER negative, PR negative, HER2 negative, and apocrine type) of the right breast and DCIS of the left breast in woman in her 70s. Two masses in the right breast (arrows) with surrounding tumor-related vessels (arrowheads) are clearly depicted on MIP image of the 12th frame of UF-DCE MRI (a). In contrast, NME in the left breast is barely visible on the 12th frame. On MIP image of the 20th (last) frame of UF-DCE MRI (b), surrounding vessels are increased in number in the right breast. Multiple NME becomes visible on the 20th frame (arrows). MIP, maximum intensity projection.
Fig. 7.
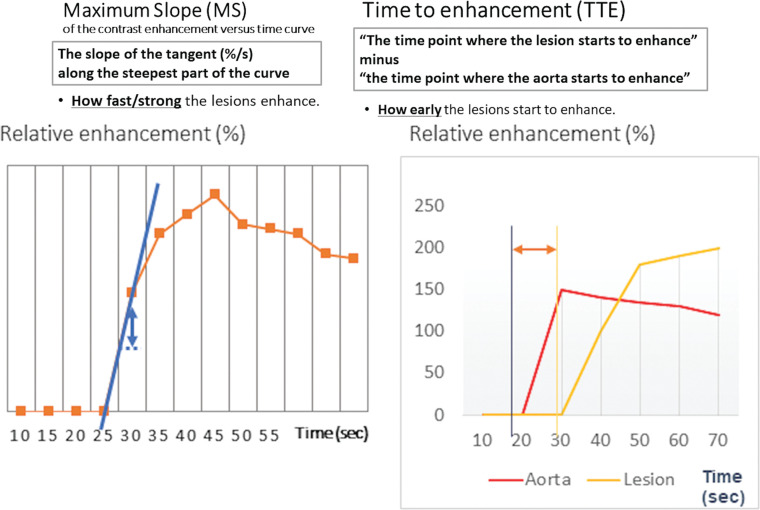
Maximum slope and time to enhancement. MS is defined as the slope of the tangent (%/s) along the steepest part of the curve. TTE is defined as “The time point where the lesion starts to enhance” minus “the time point where the aorta starts to enhance.” MS, maximum slope; TTE, time to enhancement.
Fig. 4.
Invasive carcinoma of the left breast in woman in her 40s. On the 4th phase of UF-DCE MRI (a), the enhanced two masses are clearly delineated. On the early phase of dynamic contrast-enhanced MRI (b), the masses are surrounded and masked by marked BPE.
Diagnosis of malignant and benign lesions using kinetic information from UF-DCE MRI
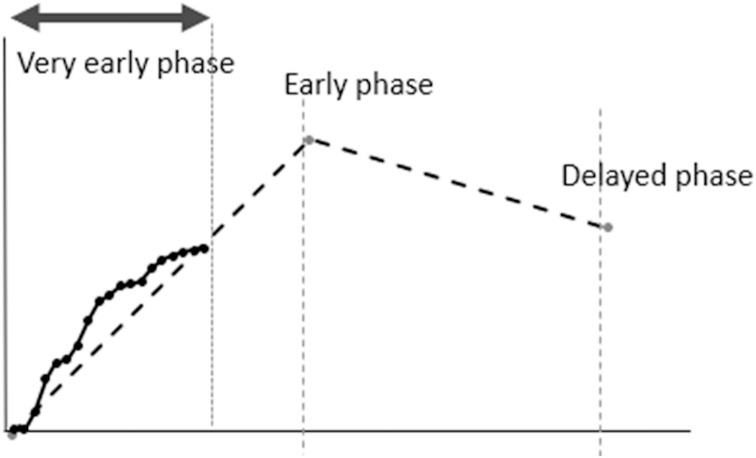
In addition to the identification of the hypervascular lesions, a kinetic evaluation is another benefit of UF-DCE MRI. The concept of interpreting kinetics using UF-DCE MRI can be summarized as follows: 1) hypervascular lesions are likely to be malignant and 2) hypervascular lesions that demonstrated fast-washout pattern on conventional DCE-MRI show fast (steep) upslope, early enhancement timing, with faster blood flow in and out of the lesions. Obtaining kinetic information in a shorter scanning time compared to the conventional DCE MRI is a benefit, since most of the UF-DCE protocols were within 2 minutes from the start of the contrast-medium injection (Fig. 5). In order to evaluate more objectively, several kinetic parameters designed for UF-DCE MRI have been proposed (Figs. 6 and 7).
Fig. 5.
Schema comparing kinetic analysis of UF-DCE MRI in early upslope with three-point BI-RADS curve analysis. Compared to BI-RADS curve analysis, UF-DCE MRI looks at the early upslope.
Fig. 6.
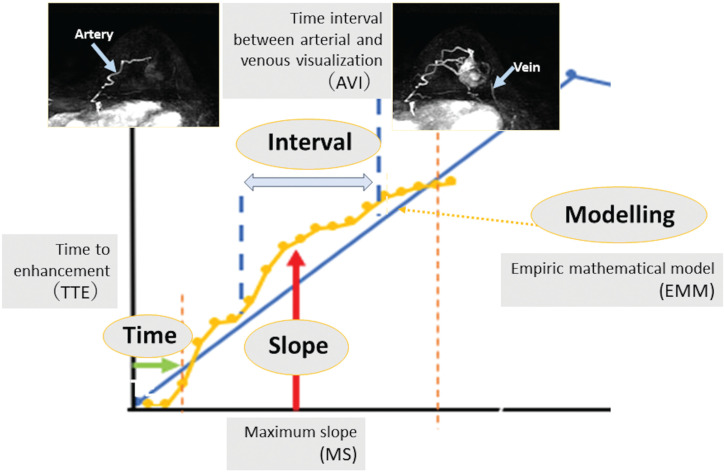
Schema for kinetic parameters used in UF-DCE MRI. There are mainly four kinds of kinetic parameters: slope, time, interval, and modeling. Refer to the text for detailed definition and explanations of each parameter.
Maximum slope (MS), proposed by Mann et al. in 2014,3 is defined as the upslope of the time–intensity curve, calculated by percentage relative enhancement at the steepest part of the curve divided by seconds (%/s). In this paper, MS was categorized into three (< 6.4%/s, cancer unlikely; ≥ 6.4, < 13.3, cancer equivocal; and ≥ 13.3, cancer likely) and then compared to the conventional curve type. In their study, MS achieved a higher area under the ROC curve (AUC) of 0.829 in discriminating malignant from benign breast lesions compared to the conventional curve type analysis (AUC = 0.692).
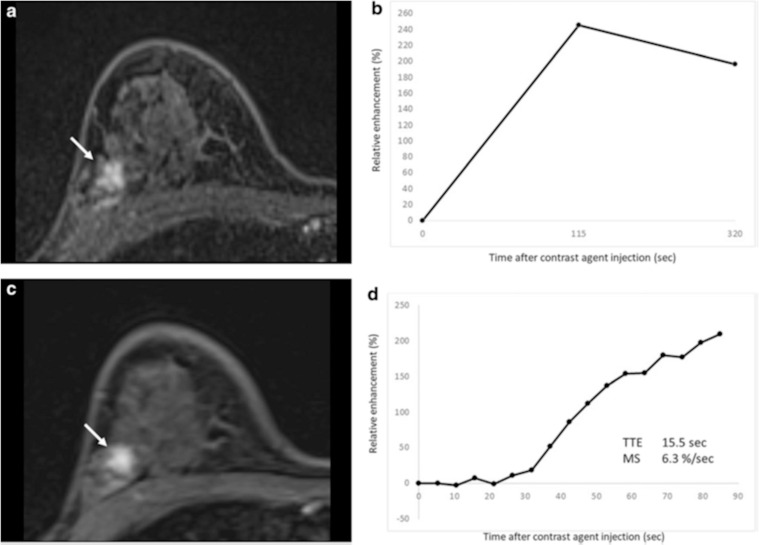
Time to enhancement (TTE) looks at the timing when a breast lesion starts to enhance. It is defined as the time of lesion enhancement minus the time of aortic enhancement. Malignant lesions tend to enhance much earlier than benign lesions, thus resulting in shorter TTE. Mus et al. defined this parameter as “the time point where the lesion starts to enhance” minus “the time point where the aorta starts to enhance” using visual assessment at the MIP images.5 In this study, the discriminating power of TTE with a cut-off value of 12.96s outperformed the conventional curve type analysis (AUCs of 0.80–0.86 and 0.70–0.71, respectively). Goto et al. also examined the importance of TTE and reported that the AUCs of TTE for discrimination malignant from benign breast lesions were 0.71 for masses and 0.78 for non-mass enhancement, respectively (Fig. 8).4
Fig. 8.
Fibrocystic change in a 46-year-old woman. (a) Axial first-phase image of conventional dynamic contrast-enhanced MRI shows non-mass enhancement (NME) with focal distribution and heterogeneous internal enhancement (arrow). (b) The conventional kinetic curve of this NME is a fast wash-out pattern. This NME is classified as BI-RADS category 4. (c) Axial UF-DCE MRI image shows the NME. (d) Kinetic curve obtained from UF-DCE MRI can be useful in identifying relatively hypervascular benign lesion including fibrocystic change. NME, nonmass enhancement. (modified from Reference 4)
Time of arrival (ToA) is defined as the time of arrival of the contrast agent from the aorta to the lesion; thus, it is similar to TTE. ToA in UF-DCE MRI can be overlayed to the normal breast MRI using color intensity projections (CIP).21
Bolus arrival time (BAT) is defined as the time from the start of contrast injection to tracer bolus arrival time. It is similar to TTE, assuming that differences in cardiac function and circulation time in patients may be ignored.5,22 Among BI-RADS 4–5 sub-centimeter breast lesions, BAT was shorter, and MS was higher among carcinoma compared to the benign lesions (P = 0.01),22 indicating the value of ultrafast-derived kinetic parameters among small lesions in which morphological assessment is challenging.
Time interval between arterial and venous visualization (AVI) was proposed due to the better contrast and preserved spatial resolution by CS reconstruction. UF-DCE MRI using CS enables separate identification of breast arteries and veins on their MIP images. Onishi et al. defined AVI as the interval between two time points: the time point where the breast vein starts to enhance and the time point where the breast artery starts to enhance.13 The AVI in breasts with cancers were reported to be significantly shorter than those for breasts with benign lesions (P = 0.043–0.06) and no lesions (P = 0.007).13,23
Fan et al. reported an advantage of using an empirical mathematical model (EMM) to fit the uptake and wash-out of contrast media on DCE-MRI.24 Pineda et al. showed the feasibility of using a truncated EMM to fit UF-DCE MRI data during only the early uptake phase.25 With the truncated EMM, a few simple parameters will be obtained from following formula:
ΔS(t) = A(1-e-αt)
where A is the upper limit of the signal intensity and α (sec-1) is the rate of signal increase.
They will represent the uptake behavior of kinetic data from multiple time points acquired with UF-DCE MRI. The initial slope of the kinetic curve can be calculated as the product of the uptake rate α and the amplitude of enhancement A (Aα). A significant correlation of Aα of the equation with pathological micro-vessel density indicates that Aα could demonstrate the underlying pathophysiology of breast tumors.6 As Aα represents the initial slope of the kinetic curve, it is similar to parameters for the enhancement rate26 and the MS3 used in previous studies. Thus, the utility of the MS or the enhancement rate in non-model analysis in discriminating between benign and malignant lesions was supported. These non-model analyses might be appropriate to use in clinical practice (Fig. 4).
These kinetic parameters derived from a very early phase of the time-intensity curve are considered to reflect the underlying pathophysiology of breast cancer. Early leakage of contrast agent from the vessels to the interstitium is linked to increased MS.22,27 Increased vascular shunt in tumor-associated vessels may be associated with shorter TTE or AVI.28,29 The above results suggest that these kinetic parameters obtained from this UF-DCE MRI may be a potential alternative to those obtained from conventional DCE MRI. The optimal choice of these parameters may depend on the specific purpose (diagnosis, treatment response, and prognosis prediction), which is currently under investigation.
The Value of UF-DCE MRI in Prognostic Markers and Subtype Prediction
Since tumor vascular formation is closely linked to the tumor growth, UF-DCE MRI-derived kinetic parameters are likely to be associated with the presence of invasive component and prognostic markers of breast cancer. MS of invasive breast carcinoma was higher than that of ductal carcinoma in situ (DCIS).23,30,31 Similarly, TTE and BAT of invasive carcinoma were shorter than those of DCIS.32,33 Proliferative marker (ki-67) was correlated with the parameters of UF-DCE MRI. Yamaguchi et al. reported that MS was positively correlated with ki-6731 and several other studies reported that breast carcinoma with high ki-67 showed higher MS and shorter TTE than carcinoma with low ki-67.4,32 Breast carcinoma with higher histological and nuclear grade showed higher MS and shorter TTE than carcinoma with lower histological and nuclear grade.4,31,32 In addition, MS, TTE, and BAT were correlated with estrogen receptor (ER) status, human epidermal growth factor receptor 2 (HER2) status, and axillary lymph node status.4,31–33 Increased angiogenesis of breast carcinoma with high malignant potential seems to be reflected to the parameters of UF-DCE MRI (Table 2).
(Continued)
| Voxel size(mm) | Scan timing(injection start= 0 sec) | Temporalresolution(sec) | Numberofphases | Number ofiterations for CS | CSacceleration | Otherparameters | Contrastagentsa) | Injectionspeedb)(ml/sec) | References |
|---|---|---|---|---|---|---|---|---|---|
| 0.9×0.9×2.5 | -13 to 60 sec | 3.7 | 20 | 30 | 16.5 | Gadobutrol | 2 | 13,23 | |
| 0.9×0.9×2.5 | 0 to 99.6 | 8.3 | 12 | GRAPPA factor 8 | Gadobutrol | 2.5 | 31 | ||
| 0.9×0.9×2.5 | -8.41 to 89.9 | 2.9 | 31 | 30 | Gadobutrol | 2.5 | |||
| 0.78×0.78×2.0 | -8.05 to 98.36 sec | 6.02 | 16 | 30 | 13.5 | Gadobutrol | 1 | ||
| 0.9×0.9×2.0 | 0 to 70 sec | 5 | 15 | Gadobenate dimeglumine | 3 | ||||
| 0.9×0.9×2.5 | 22s(end of first frame of the TWIST) | 5.3 | 17 | GRAPPA factor 3 | Gadoterate meglumine | 2 | 4 | ||
| 1.09×1.66×4.0 | 10–64 sec | 3 | 18 | SENSE accerelation factor 3.2(RL) 2.2 (FH) | Gadobenate dimeglumine | 2 | 6 | ||
| 1×1.1 | 0 to 90 sec | 5.2 | 17 | Gadobutrol | 1 | 51 |
a)gadobutrol 0.1 ml/kg, gadobenate dimeglumine 0.2 ml/kg. b)followed by 20–40 ml saline flush. CS, compressed sensing; DISCO, differential subsampling with Cartesian ordering; KPUM, Kyoto Prefectural University of Medicine; PI, parallel imaging; TMDU, Tokyo Medical Dental University; TWIST, time-resolved angiography with interleaved stochastic trajectories; VIBE, volumetric interpolated breath-hold examination; VS, view-sharing.
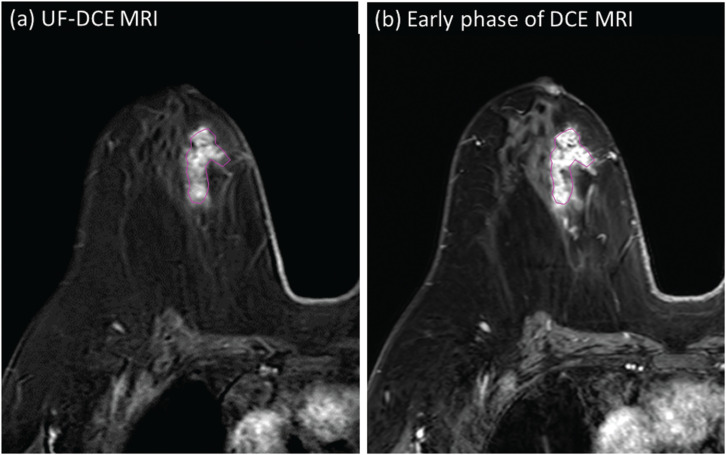
UF-DCE MRI can obtain detailed information on hypervascular component of the tumor. This can be applied to predict breast cancer subtypes. Using 165 invasive breast cancers presenting as masses, MS and TTE values were significantly higher among triple-negative subtypes compared to non-triple-negative subtypes. The model using MS and rim enhancement from the early phase of conventional DCE-MRI showed the AUC of 0.74 in identifying triple-negative subtype.34 In addition, a combination of UF-DCE MRI with texture analysis can distinguish “low-grade DCIS” from “non-low-grade DCIS or DCIS upgraded to invasive lesions”. In a study of 86 DCIS or DCIS upgraded to invasive carcinoma, the model using shape and texture features of UF-DCE MRI could effectively distinguish “low-grade DCIS” from “non-low-grade DCIS or DCIS upgraded to invasive” lesions. The texture analysis may capture the difference in the distribution pattern of hypervascular portions within the specific area that is related to histological grade (Fig. 9).35
Fig. 9.
A 71-year-old woman diagnosed with DCIS by ultrasound-guided biopsy. The case was finally diagnosed as high-grade DCIS by surgery. Heterogeneous enhancement was found in the UF-DCE MRI (a), as well as the early phase of dynamic contrast-enhanced MRI (b). Texture analysis reflects heterogeneity of enhancement within DCIS lesion. DCIS, ductal carcinoma in situ.
Weaknesses and Pitfalls of UF-DCE MRI
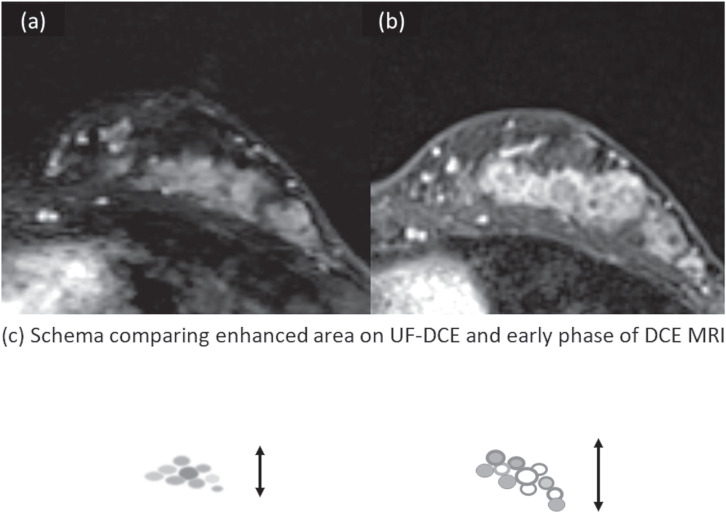
In order to use UF-DCE MRI in the clinical practice, it is important to recognize its weaknesses and pitfalls. First, this is based on vascularity of the lesion and inherently hypovascular lesions are likely to be underestimated. False-negative cases of UF-DCE MRI included DCIS, mucinous carcinoma, invasive lobular carcinoma, and some of invasive carcinoma.4,36 A preliminary study based on 26 DCIS size on UF-DCE MRI is relatively close to the size on pathology compared to conventional DCE-MRI. However, clustered ring internal enhancement pattern, a BI-RADS based descriptor indicating malignancy, is less frequently observed on UF-DCE MRI. Evaluating DCIS based on UF-DCE MRI may be performed with caution, ideally with conventional DCE MRI (Fig. 10).
Fig. 10.
Appearances of DCIS on UF-DCE MRI and the early phase of DCE MRI in relation to BPE. Female patient in her 40s presenting with DCIS (high grade) with microinvasion. UF-DCE MRI (a) revealed NME with segmental distribution without clustered ring enhancement. On the early phase of DCE MRI (b), the lesion appears slightly larger than that on UF-DCE, partly associated with clustered ring enhancement. Schema comparing enhanced area on UF-DCE and early phase of DCE MRI is shown in (c).
Overdiagnosis of hypervascular benign lesions is still a problem. When one cut-off point was determined, the specificity of MS in diagnosing malignant disease ranges from 60% to 71%.21,23,36,37 Hypervascular benign lesions include fibrocystic disease, fibroadenoma, intraductal papilloma, and other papillary lesions.23,36 To compensate for this weakness, combining UF-DCE MRI parameters with other non-kinetic parameters like morphology or non-contrast sequences including diffusion-weighted image (DWI) is investigated.38,39
Standardization is another issue in the long run. Currently, there are variations in protocols, injection and scan timing, and the rate of injections in UF-DCE MRI (Table 1). Methods of measuring parameters are not pre-determined as well. There are variations in cut-off values in kinetic parameters. For example, a cut-off point of MS for differentiating malignant and benign lesions ranges from 10.2%/s to 20.1%/s.23,31 Although these values are optimized for each institution, it should be considered in comparing data from several institutions.
Future Application
UF-DCE MRI may be used for evaluating the treatment response of breast cancer after neoadjuvant chemotherapy. Our preliminary study suggested that UF-DCE MRI is more sensitive in predicting pathological complete response and provides a more accurate estimation of residual lesion size than conventional DCE MRI. UF-DCE MRI may be useful in preventing the overestimation of residual lesion due to scar or inflammatory tissue, which often enhances during the delayed phase in conventional DCE MRI.40
Although kinetic-based diagnosis is now the center of research in UF-DCE MRI, morphological evaluation of UF-DCE MRI would be a clinically relevant issue. Recent improvement in spatial resolution of UF-DCE MRI allows us to evaluate lesions based on BI-RADS. Our preliminary study comparing morphological features of invasive breast carcinomas between UF-DCE MRI and conventional DCE MRI suggested more frequent circumscribed margin and less frequent rim enhancement among UF-DCE MRI.34 The impact of these differences on diagnosis needs to be investigated.
A multiparametric approach may be an option to overcome the limitation of kinetic-based diagnosis. In a study of 96 lesions (73 malignant and 23 benign), univariate and multivariate logistic regression analyses were performed using MS, ADC obtained from DWI, lesion size, and the patient’s age. The prediction model using significant parameters (MS, ADC, and patient’s age) yielded an AUC of 0.90, significantly higher than that of MS (AUC 0.74, P = 0.01). Because ADC reflects cellularity of the lesion, such information is complementary to the kinetic information and therefore improves diagnostic performance.39
Tumor-related vessels in DCE MRI are known to be associated with ipsilateral malignant breast tumor and considered to reflect neovascularization.41 Image-derived information of these vessels can be a biomarker of tumor growth. Efforts to quantify such vessels using UF-DCE MRI are just starting recently. Wu et al. identified the vasculature of 15 patients using Hessian filter to generate vascular morphology and input and output of vessels physically connected to the tumor.42 Vessel count was significantly different between malignant and benign lesions (P = 0.009). Another study examined filtered MIP images of UF-DCE MRI from 51 lesions. The pixel count of skeletonized vessels was used to represent total vessel length. The number of vessel- crossing points was used as a marker of vessel network complexity. These two quantitative markers were associated with invasive cancer subtypes and ki-67 index, a marker of proliferation and prognosis.43 These results indicate that quantified vascular image may be a non-invasive approach to evaluate tumor-related vessels and associated tumor microenvironment. It would be ideally combined with automatic segmentation of tumor-related vessels to facilitate the process.44
Artificial intelligence (AI) has been applied to the areas of DCE MRI of the breast for image classification, object detection, and segmentation.45–48 Some researchers are using AI to further improve the diagnostic performance of UF-DCE MRI. Milenković et al.49 investigated the diagnostic potential of textural analysis that can quantify the spatiotemporal changes of the contrast agent uptake in computer-aided diagnosis (CADx) of malignant and benign breast lesions imaged with UF-DCE MRI of 83 malignant and 71 benign lesions. The AUC obtained by the proposed approach based on 2D textural features with random forest classifier was 0.8997, which was significantly higher (P = 0.0198) than the performance achieved by the previous approach based on 3D morphology and dynamic analysis (AUC = 0.8704). UF-DCE MRI may fit better than conventional DCE MRI in AI-based CADx, resulting in better diagnostic performance.50
Deep learning approach and random forest classifier can be used for a multiparametric approach involving UF-DCE MRI. In a study of 358 malignant and 149 benign lesions scanned with UF-DCE MRI, T2WI, and ADC mapping, deep learning-based model using only UF-DCE MRI resulted in AUC of 0.811, while final AI-based model using all MR images and patient information significantly improved AUC up to 0.852.38
Conclusion
Thanks to the technical advancement of fast MRI scans, UF-DCE MRI has become a new approach of obtaining kinetic information while keeping a reasonable spatial resolution. Compared to conventional DCE MRI, a shorter scanning time is an advantage. UF-DCE MRI is useful in the clinical practice, particularly for patients with marked BPE in identifying target lesions. Various kinetic parameters are proposed and now under investigation. UF-DCE MRI can provide detailed vascular information that can be associated with prognostic factors. They are particularly useful in diagnosing small lesions. However, we need to recognize the weakness of kinetic-based images, which may be compensated by the multiparametric approach and the use of AI.
Table 2.
Relationship between UF-DCE parameters and prognostic markers of breast carcinoma
| MS | TTE | BAT | Reference | |
|---|---|---|---|---|
| Invasive or in situ | Invasive ca. > DCIS | Invasive ca. < DCIS | Invasive ca. < DCIS | 18, 24–27 |
| Proliferative marker (Ki-67) status | High > Low | High < Low | 4, 25, 26 | |
| Histological or nuclear grade | High > Low | High < Low | High < Low | 4, 25, 26, 27 |
| ER status | Negative > Positive | Negative < Positive | 4 | |
| HER2 status | Positive > Negative | 26 | ||
| Intrinsic subtype | Triple negative > Non-triple negative | Triple negative < Non-triple negative | Triple negative or HER2 type < Luminal type | 27, 28 |
| Axillary lymph node metastasis | Positive > Negative | 25 |
BAT, bolus arrival time; ER, estrogen receptor; HER2, human epidermal growth factor receptor 2; MS, maximum slope; TTE, time to enhancement.
Footnotes
Conflicts of Interest
The authors declare that they have no conflicts of interest associated with this manuscript.
References
- 1.Morris EA, Comstock CE, Lee CH. ACR BI-RADS® magnetic resonance imaging, In: ACR BI-RADS® atlas, breast imaging reporting and data system 2013. Reston:American College of Radiology, 2013; 15–18. [Google Scholar]
- 2.Kuhl CK, Schrading S, Strobel K, Schild HH, Hilgers RD, Bieling HB. Abbreviated breast magnetic resonance imaging (MRI): first postcontrast subtracted images and maximum-intensity projection-a novel approach to breast cancer screening with MRI. J Clin Oncol 2014; 32:2304–2310. 10.1200/JCO.2013.52.5386 [DOI] [PubMed] [Google Scholar]
- 3.Mann RM, Mus RD, van Zelst J, Geppert C, Karssemeijer N, Platel B. A novel approach to contrast-enhanced breast magnetic resonance imaging for screening: high-resolution ultrafast dynamic imaging. Invest Radiol 2014; 49:579–585. 10.1097/RLI.0000000000000057 [DOI] [PubMed] [Google Scholar]
- 4.Goto M, Sakai K, Yokota H, et al. Diagnostic performance of initial enhancement analysis using ultra-fast dynamic contrast-enhanced MRI for breast lesions. Eur Radiol 2019; 29:1164–1174. 10.1007/s00330-018-5643-4 [DOI] [PubMed] [Google Scholar]
- 5.Mus RD, Borelli C, Bult P, et al. Time to enhancement derived from ultrafast breast MRI as a novel parameter to discriminate benign from malignant breast lesions. Eur J Radiol 2017; 89:90–96. 10.1016/j.ejrad.2017.01.020 [DOI] [PubMed] [Google Scholar]
- 6.Mori N, Abe H, Mugikura S, et al. Ultrafast dynamic contrast-enhanced breast MRI: Kinetic curve assessment using empirical mathematical model validated with histological microvessel density. Acad Radiol 2019; 26:e141–e149. 10.1016/j.acra.2018.08.016 [DOI] [PMC free article] [PubMed] [Google Scholar]
- 7.Honda M, Kataoka M, Iima M, et al. Background parenchymal enhancement and its effect on lesion detectability in ultrafast dynamic contrast-enhanced MRI. Eur J Radiol 2020; 129:108984. 10.1016/j.ejrad.2020.108984 [DOI] [PubMed] [Google Scholar]
- 8.Kim SY, Cho N, Choi Y, et al. Ultrafast dynamic contrast-enhanced breast MRI: Lesion conspicuity and size assessment according to background parenchymal enhancement. Korean J Radiol 2020; 21:561–571. 10.3348/kjr.2019.0567 [DOI] [PMC free article] [PubMed] [Google Scholar]
- 9.Lim RP, Shapiro M, Wang EY, et al. 3D time-resolved MR angiography (MRA) of the carotid arteries with time-resolved imaging with stochastic trajectories: comparison with 3D contrast-enhanced Bolus-Chase MRA and 3D time-of-flight MRA. AJNR Am J Neuroradiol 2008; 29:1847–1854. 10.3174/ajnr.A1252 [DOI] [PMC free article] [PubMed] [Google Scholar]
- 10.Song HK, Dougherty L. k-space weighted image contrast (KWIC) for contrast manipulation in projection reconstruction MRI. Magn Reson Med 2000; 44:825–832. [DOI] [PubMed] [Google Scholar]
- 11.Saranathan M, Rettmann DW, Hargreaves BA, Clarke SE, Vasanawala SS. DIfferential subsampling with cartesian ordering (DISCO): a high spatio-temporal resolution dixon imaging sequence for multiphasic contrast enhanced abdominal imaging. J Magn Reson Imaging 2012; 35:1484–1492. 10.1002/jmri.23602 [DOI] [PMC free article] [PubMed] [Google Scholar]
- 12.Lustig M, Donoho D, Pauly JM. Sparse MRI: The application of compressed sensing for rapid MR imaging. Magn Reson Med 2007; 58:1182–1195. 10.1002/mrm.21391 [DOI] [PubMed] [Google Scholar]
- 13.Onishi N, Kataoka M, Kanao S, et al. Ultrafast dynamic contrast‐enhanced mri of the breast using compressed sensing: breast cancer diagnosis based on separate visualization of breast arteries and veins. J Magn Reson Imaging 2018; 47:97–104. 10.1002/jmri.25747 [DOI] [PubMed] [Google Scholar]
- 14.Sagawa H, Kataoka M, Kanao S, et al. Impact of the number of iterations in compressed sensing reconstruction on ultrafast dynamic contrast-enhanced breast MR imaging. Magn Reson Med Sci 2019; 18:200–207. 10.2463/mrms.mp.2018-0015 [DOI] [PMC free article] [PubMed] [Google Scholar]
- 15.Jaspan ON, Fleysher R, Lipton ML. Compressed sensing MRI: a review of the clinical literature. Br J Radiol 2015; 88:20150487. 10.1259/bjr.20150487 [DOI] [PMC free article] [PubMed] [Google Scholar]
- 16.Runge VM, Richter JK, Heverhagen JT. Speed in clinical magnetic resonance. Invest Radiol 2017; 52:1–17. 10.1097/RLI.0000000000000330 [DOI] [PubMed] [Google Scholar]
- 17.Tamada D. implementation of compressed sensing for MR imaging. Jpn JMagn Reson Med. 2018; 38:76–86.(in Japanese) 10.2463/jjmrm.2018-1649 [DOI] [Google Scholar]
- 18.Yamamoto A. Clinical application of compressed sensing. Medical Imaging Technology. 2020; 38:57–66. (in Japanese) [Google Scholar]
- 19.Aghaei F, Tan M, Hollingsworth AB, Zheng B. Applying a new quantitative global breast MRI feature analysis scheme to assess tumor response to chemotherapy. J Magn Reson Imaging 2016; 44:1099–1106. 10.1002/jmri.25276 [DOI] [PMC free article] [PubMed] [Google Scholar]
- 20.Kato Y, Kawamura M, Okudaira K, Satake H, Maruyama K, Naganawa S. Impact of number of iterations in VIBE with compressed sensing for a wide range of T1 values using an ISMRM/NIST phantom. Proceedings of the 47th Annual Meeting of JSMRM, Kumamoto, 2019; P2-A-69. [Google Scholar]
- 21.Cover KS, Duvivier KM, de Graaf P, et al. Summarizing the 4D image stack of ultrafast dynamic contrast enhancement MRI of breast cancer in 3D using color intensity projections. J Magn Reson Imaging 2019; 49:1391–1399. 10.1002/jmri.26521 [DOI] [PubMed] [Google Scholar]
- 22.Onishi N, Sadinski M, Gibbs P, et al. Differentiation between subcentimeter carcinomas and benign lesions using kinetic parameters derived from ultrafast dynamic contrast-enhanced breast MRI. Eur Radiol 2020; 30:756–766. 10.1007/s00330-019-06392-5 [DOI] [PMC free article] [PubMed] [Google Scholar]
- 23.Honda M, Kataoka M, Onishi N, et al. New parameters of ultrafast dynamic contrast‐enhanced breast MRI using compressed sensing. J Magn Reson Imaging 2020; 51:164–174. 10.1002/jmri.26838 [DOI] [PubMed] [Google Scholar]
- 24.Fan X, Medved M, Karczmar GS, et al. Diagnosis of suspicious breast lesions using an empirical mathematical model for dynamic contrast-enhanced MRI. Magn Reson Imaging 2007; 25:593–603. 10.1016/j.mri.2006.10.011 [DOI] [PMC free article] [PubMed] [Google Scholar]
- 25.Pineda FD, Medved M, Wang S, et al. Ultrafast bilateral DCE-MRI of the breast with conventional fourier sampling: Preliminary evaluation of semi-quantitative analysis. Acad Radiol 2016; 23:1137–1144. 10.1016/j.acra.2016.04.008 [DOI] [PMC free article] [PubMed] [Google Scholar]
- 26.Abe H, Mori N, Tsuchiya K, et al. Kinetic analysis of benign and malignant breast lesions with ultrafast dynamic contrast-enhanced MRI: Comparison with standard kinetic assessment. AJR Am J Roentgenol 2016; 207:1159–1166. 10.2214/AJR.15.15957 [DOI] [PMC free article] [PubMed] [Google Scholar]
- 27.Cuenod CA, Balvay D. Perfusion and vascular permeability: basic concepts and measurement in DCE-CT and DCE-MRI. Diagn Interv Imaging 2013; 94:1187–1204. 10.1016/j.diii.2013.10.010 [DOI] [PubMed] [Google Scholar]
- 28.Pries AR, Hopfner M, le Noble F, Dewhirst MW, Secomb TW. The shunt problem: control of functional shunting in normal and tumour vasculature. Nat Rev Cancer 2010; 10:587–593. 10.1038/nrc2895 [DOI] [PMC free article] [PubMed] [Google Scholar]
- 29.Jain RK. Normalizing tumor microenvironment to treat cancer: bench to bedside to biomarkers. J Clin Oncol 2013; 31:2205–2218. 10.1200/JCO.2012.46.3653 [DOI] [PMC free article] [PubMed] [Google Scholar]
- 30.Onishi N, Sadinski M, Hughes MC, et al. Ultrafast dynamic contrast-enhanced breast MRI may generate prognostic imaging markers of breast cancer. Breast Cancer Res 2020; 22:58. 10.1186/s13058-020-01292-9 [DOI] [PMC free article] [PubMed] [Google Scholar]
- 31.Yamaguchi K, Nakazono T, Egashira R, et al. Maximum slope of ultrafast dynamic contrast-enhanced MRI of the breast: Comparisons with prognostic factors of breast cancer. Jpn J Radiol 2021; 39:246–253. 10.1007/s11604-020-01049-6 [DOI] [PubMed] [Google Scholar]
- 32.Shin SU, Cho N, Kim SY, Lee SH, Chang JM, Moon WK. Time-to-enhancement at ultrafast breast DCE-MRI: potential imaging biomarker of tumour aggressiveness. Eur Radiol 2020; 30:4058–4068. 10.1007/s00330-020-06693-0 [DOI] [PubMed] [Google Scholar]
- 33.Onishi N, Kataoka M. Breast cancer screening for women at high risk: review of current guidelines from leading specialty societies. Breast Cancer 2021; 28:1195–1211. [DOI] [PubMed] [Google Scholar]
- 34.Ohashi A, Kataoka M, Iima M, et al. Multiparametric prediction model for triple negative breast cancer subtypes using MR parameters including ultrafast DCE MRI. Proceedings of ISMRM & SMRT Annal Meeting, online, 2021; 1443.
- 35.Mori N, Abe H, Mugikura S, et al. Discriminating low-grade ductal carcinoma in situ (DCIS) from non-low-grade DCIS or DCIS upgraded to invasive carcinoma: effective texture features on ultrafast dynamic contrast-enhanced magnetic resonance imaging. Breast Cancer 2021; 28:1141–1153. 10.1007/s12282-021-01257-6 [DOI] [PubMed] [Google Scholar]
- 36.Ohashi A, Kataoka M, Kanao S, et al. Diagnostic performance of maximum slope: A kinetic parameter obtained from ultrafast dynamic contrast-enhanced magnetic resonance imaging of the breast using k-space weighted image contrast (KWIC). Eur J Radiol 2019; 118:285–292. 10.1016/j.ejrad.2019.06.012 [DOI] [PubMed] [Google Scholar]
- 37.Vreemann S, Rodriguez-Ruiz A, Nickel D, et al. Compressed sensing for breast MRI: Resolving the trade-off between spatial and temporal resolution. Invest Radiol 2017; 52:574–582. 10.1097/RLI.0000000000000384 [DOI] [PubMed] [Google Scholar]
- 38.Dalmiş MU, Gubern-Merida A, Vreemann S, et al. Artificial intelligence-based classification of breast lesions imaged with a multiparametric breast MRI protocol with ultrafast DCE-MRI, T2, and DWI. Invest Radiol 2019; 54:325–332. 10.1097/RLI.0000000000000544 [DOI] [PubMed] [Google Scholar]
- 39.Ohashi A, Kataoka M, Iima M, et al. A multiparametric approach to diagnosing breast lesions using diffusion-weighted imaging and ultrafast dynamic contrast-enhanced MRI. Magn Reson Imaging 2020; 71:154–160. 10.1016/j.mri.2020.04.008 [DOI] [PubMed] [Google Scholar]
- 40.Honda M, Kataoka M, Ota R, et al. Ultrafast DCE MRI for post-NST evaluation of breast cancer. Proceedings of ISMRM & SMRT Annal Meeting, online, 2021; 0142.
- 41.Kul S, Cansu A, Alhan E, Dinc H, Reis A, Can G. Contrast-enhanced MR angiography of the breast: Evaluation of ipsilateral increased vascularity and adjacent vessel sign in the characterization of breast lesions. AJR Am J Roentgenol 2010; 195:1250–1254. 10.2214/AJR.10.4368 [DOI] [PubMed] [Google Scholar]
- 42.Wu C, Pineda F, Hormuth DA, 2nd, Karczmar GS, Yankeelov TE. Quantitative analysis of vascular properties derived from ultrafast DCE-MRI to discriminate malignant and benign breast tumors. Magn Reson Med 2019; 81:2147–2160. 10.1002/mrm.27529 [DOI] [PMC free article] [PubMed] [Google Scholar]
- 43.Kawase K, Kataoka M, Takemura T, et al. Quantitative evaluation of tumor-related vessels on ultrafast dynamic contrast enhanced MRI: imaging biomarker of breast cancer proliferation. Proceedings of ISMRM & SMRT Virtual Conference, online, 2020; 0571.
- 44.Kataoka M, Fukutome T, Takemura T, et al. Automatic segmentation of tumor-related vessels of breast cancer on ultrafast DCE MRI using U-Net. Proceedings of ISMRM & SMRT Virtual Conference, online, 2020; 2313. [Google Scholar]
- 45.Adachi M, Fujioka T, Mori M, et al. Detection and diagnosis of breast cancer using artificial intelligence based assessment of maximum intensity projection dynamic contrast-enhanced magnetic resonance images. Diagnostics (Basel) 2020; 10:330. 10.3390/diagnostics10050330 [DOI] [PMC free article] [PubMed] [Google Scholar]
- 46.Fujioka T, Yashima Y, Oyama J, et al. Deep-learning approach with convolutional neural network for classification of maximum intensity projections of dynamic contrast-enhanced breast magnetic resonance imaging. Magn Reson Imaging 2021; 75:1–8. 10.1016/j.mri.2020.10.003 [DOI] [PubMed] [Google Scholar]
- 47.Reig B, Heacock L, Geras KJ, Moy L. Machine learning in breast MRI. J Magn Reson Imaging 2020; 52:998–1018. 10.1002/jmri.26852 [DOI] [PMC free article] [PubMed] [Google Scholar]
- 48.Sheth D, Giger ML. Artificial intelligence in the interpretation of breast cancer on MRI. J Magn Reson Imaging 2020; 51:1310–1324. 10.1002/jmri.26878 [DOI] [PubMed] [Google Scholar]
- 49.Milenković J, Dalmis MU, Zgajnar J, Platel B. Textural analysis of early-phase spatiotemporal changes in contrast enhancement of breast lesions imaged with an ultrafast DCE-MRI protocol. Med Phys 2017; 44:4652–4664. 10.1002/mp.12408 [DOI] [PubMed] [Google Scholar]
- 50.Platel B, Mus R, Welte T, Karssemeijer N, Mann R. Automated characterization of breast lesions imaged with an ultrafast DCE-MR protocol. IEEE Trans Med Imaging 2014; 33:225–232. 10.1109/TMI.2013.2281984 [DOI] [PubMed] [Google Scholar]
- 51.Kikuchi Y, Mori M, Fujioka T, et al. Feasibility of ultrafast dynamic magnetic resonance imaging for the diagnosis of axillary lymph node metastasis: A case report. Eur J Radiol Open 2020; 7:100261. 10.1016/j.ejro.2020.100261 [DOI] [PMC free article] [PubMed] [Google Scholar]


