

Abstract
Trazodone is approved for the treatment of major depressive disorders, marketed as immediate release (IR), prolonged release, and once a day (OAD) formulation. The different formulations allow different administration schedules and may be useful to facilitate patients’ compliance to the antidepressant treatment. A previously verified physiologically‐based pharmacokinetic model based on in vitro and in vivo information on trazodone pharmacokinetics was applied, aiming at predicting brain receptor occupancy (RO) after single and repeated dosing of the IR formulation and repeated dosing of the OAD formulation in healthy subjects. Receptors included in the simulations were selected using static calculations of RO based on the maximum unbound brain concentration (Cmax,brain,u) of trazodone for each formulation and dosing scheme, resulting in 16 receptors being simulated. Seven receptors were simulated for the IR low dose formulation (30 mg), with similar t onset and duration of coverage (range: 0.09–0.25 h and 2.1–>24 h, respectively) as well as RO (range: 0.64–0.92) predicted between day 1 and day 7 of dosing. The 16 receptors evaluated for the OAD formulation (300 mg) showed high RO (range: 0.97–0.84 for the receptors also covered by the IR formulation and 0.73–0.48 for the remaining) correlating with affinity and similar duration of time above the target threshold to the IR formulation (range: 2–>24 h). The dose‐dependent receptor coverage supports the multimodal activity of trazodone, which may further contribute to its fast antidepressant action and effectiveness in controlling different symptoms in depressed patients.
Study Highlights.
WHAT IS THE CURRENT KNOWLEDGE ON THE TOPIC?
The antidepressant efficacy of trazodone has been shown to be significantly correlated to its steady‐state plasma levels, and previous work has shown some understanding of trazodone range of affinity for different receptors, at different doses, but without considering the different available formulations. Trazodone is commonly available as: immediate release (IR), prolonged release (PR), and once a day (OAD) tablets. The IR formulation has a rapid onset and short duration of action, whereas the PR formulation is characterized by an absorption boost as soon as it is administered and has a comparatively delayed maximum concentration (Cmax). Conversely, the OAD formulation provides a controlled release of trazodone over 24 h without the early high peak plasma concentration seen with the IR and PR formulations.
WHAT QUESTION DID THIS STUDY ADDRESS?
This work aims to identify the brain receptors reaching a threshold occupancy of 50% through static predictions and determine the occupancy versus time profile for those of interest following administration of short‐ and long‐acting trazodone formulations.
WHAT DOES THIS STUDY ADD TO OUR KNOWLEDGE?
Brain receptor occupancy (RO) for key targets were predicted based on free drug concentrations, allowing for a physiologically relevant assessment of the different pathways affected by each formulation and dose.
HOW MIGHT THIS CHANGE CLINICAL PHARMACOLOGY OR TRANSLATIONAL SCIENCE?
The presented physiologically‐based pharmacokinetic approach to assess RO can be used to guide formulation selection and dosing in clinical studies.
INTRODUCTION
Trazodone hydrochloride is a triazolopyridine derivative, defined as the first member of the class of serotonin antagonist/reuptake inhibitor (SARI) developed for the treatment of depression. Trazodone is currently approved for the treatment of major depressive disorder (MDD), with or without anxiety. 1
Trazodone acts as a potent antagonist of the serotonin (5‐HT) receptors 5‐HT2A and shows moderate affinity to 5‐HT1A, 5‐HT2C, and 5‐HT7 receptors, acting as a weak agonist for the first one and as a weak antagonist for the following two receptors. 2 Trazodone also shows moderate affinity for the serotonin transporter SERT. Moreover, it was demonstrated that trazodone binds with high affinity to adrenergic receptors, where it acts blocking α1‐adrenoceptors and moderately antagonizing α2‐adrenoceptors. 3 , 4 On the other hand, trazodone has very low affinity for acetylcholine muscarinic, dopaminergic, or GABA/benzodiazepine receptors, whereas there is no full consensus about trazodone affinity for the H1‐histaminic receptors. 5
Trazodone can be defined as a multifunctional drug due to its dose‐dependent pharmacological activity. Different clinical trials suggest that low doses of trazodone (i.e., 30 mg–50 mg per day) may be useful for controlling insomnia, probably due to the antagonism of 5‐HT2A/2C and α1 that provides a hypnotic effect. 6 When used at the proper antidepressant doses (e.g., starting from 100 to 150 mg per day, until 300 mg per day), trazodone is able to exert additional pharmacological actions, such as the SERT blockade. This layered response allows for full antidepressant efficacy, with a complex mixture of pharmacological functions due to the simultaneous inhibition of the serotonin (5‐HT) transporters (SERT), and 5‐HT2A, 5‐HT2C, and 5‐HT7 receptors, together with the partial agonism of 5‐HT1A receptors. The combination of these pathways allows for the antidepressant action of trazodone. 1 Considering the trazodone pharmacokinetic profile, and in particular the variability of the plasma concentration, to achieve therapeutically effective levels to manage major depressive disorder episodes, trazodone should be administered at the target dose of 300 mg/day. 1
Two formulations for trazodone are currently available—immediate‐release (IR) tablets requiring multiple administrations daily, and, in Europe, prolonged‐release tablets for twice‐daily administration. Trazodone once a day (OAD) is a prolonged release formulation of trazodone for once daily administration. The IR formulation has a rapid onset and short duration of action, whereas the prolonged release (PR) formulation is characterized by an absorption boost as soon as it is administered and has a comparatively delayed maximum concentration (Cmax). Conversely, the OAD formulation provides a controlled release of trazodone over 24 h without the early high peak plasma concentration seen with the IR and PR formulations. 7 , 8
To better support and clarify the multimodal mechanism of action of trazodone and its relevance in managing MDD symptoms, it is important to understand the occupancy at the receptors indicated in MDD, the time at which a significant RO (t onset) is reached, as well as the duration where the target RO is maintained. Therefore, the aim of this project was to simulate unbound brain concentrations in adults using an existing physiologically‐based pharmacokinetic (PBPK) model for trazodone, refined with a series of human in vitro parameters, and apply a dynamic pharmacodynamic (PD) model to determine RO over time. The 30 mg IR (at single dose) and the 300 mg OAD (at steady‐state) formulations, standing at the extremes of the available dosing range, will be assessed with the aim of simulating the widest possible range of exposures achievable by trazodone.
METHODS
PBPK modeling strategy and receptor occupancy determination
Development of trazodone PBPK models
The Simcyp Population‐Based Simulator (version 18, release 2; Simcyp Ltd., Sheffield, UK) and Caucasian Healthy Volunteer population was used for all simulations. A PBPK model for IR trazodone has previously been developed. 9 Plasma CLiv was used directly in the model as input. A K p scalar was incorporated to predict the observed volume of distribution at steady state (V ss) value accurately.
For OAD trazodone, this model was updated to include the mechanistic absorption model, Advanced Dissolution Absorption and Metabolism (ADAM) model. The ADAM model within Simcyp has been described previously. 10 In brief, the dissolution profile of OAD trazodone was estimated using the Weibull cumulative dissolution function parameters (Fmax, α, and β, respectively, standing for maximum %Dissolved in vivo, dissolution profile scale factor, and dissolution profile shape factor) for each subject in the clinical trial (Equation 1). The mean deconvoluted in vivo dissolution profile was then compared with the optimized in vitro dissolution (Supplementary Methods). 11
| (1) |
The dissolution profile for the commercial formulation (manufactured by Aziende Chimiche Riunite Angelini Francesco S.p.A) was input as a discrete profile with a coefficient of variation (%CV) at each time point as estimated from in vivo deconvolution to capture population variability and a fixed value of %CV was also assumed. Simulations were then performed to reflect the reference clinical study for a 300 mg single dose. The mean area under the curve (AUC)last, AUCinf, and Cmax were calculated for each of the simulated subjects and then compared with those from the clinical trial (Supplementary Methods). 11
The updated model also includes a perfusion‐limited, one‐compartment brain model. Given that in vitro studies show trazodone is not a substrate for relevant transporters (P‐gp, 12 BCRP, MRPs, OATPs, and OCTs) this model is valid (Table S1). Simulated total brain concentrations were corrected for tissue binding by human f u,brain values from the literature. 13 A maximum effect (Emax) sigmoid model was applied to compute receptor occupancy using the simulated unbound brain concentration and the in vitro K i values for the identified receptors of interest. The final model input parameters used are shown in Table 1.
TABLE 1.
Input parameter values used to simulate the kinetics of trazodone
| Parameter name | Value | Method/source |
|---|---|---|
| Physical chemistry and blood binding | ||
| MW, g/mol | 408.32 | 5 |
| Log P | 2.87 | Calculated from experimental value of logD7.4 (=2.79) 1 |
| Compound type | Monoprotic base | 1 |
| pK a | 6.61 | Measured 1 |
| B/P | 0.68 | Calculated from measured E:P ratio of 0.2 (data on file) |
| fup | 0.0354 | Measured by equilibrium dialysis (data on file) |
| Absorption | ||
| Model |
IR: first order OAD: ADAM with Solid Monolithic /Dissolution Profile Input (Table S1) |
|
| F a | IR: 0.98 | Predicted from mean Papp (24.2 * 10−6 cm/s) obtained in Caco‐2 cells and calibrated using metoprolol data (28.1 * 10−6 cm/s) 10 |
| k a (h−1) |
IR/oral solution: 1.60 OAD: 0.07 |
IR: Predicted from mean Papp (24.2 * 10−6 cm/s) obtained in Caco‐2 cells and calibrated using metoprolol data (28.1 * 10−6 cm/s) 10 OAD: fitting of concentration‐time data following a single oral dose of 300 mg OAD trazodone 16 |
| fugut | 1.0 | Default value |
| Distribution | ||
| Model | Full‐PBPK | |
| V ss (L/kg) | 1.0 | Predicted (Method 2) 17 |
| Elimination | ||
| CLiv (L/h) | 5 | 18 |
| f m,CYP3A4 (%) | 100 | |
Abbreviations: ADAM, Advanced Dissolution Absorption and Metabolism; IR, immediate release; MW, molecular weight; OAD, once a day; PBPK, physiologically‐based pharmacokinetic; Vss, volume of distribution at steady state.
Simulations for IR and OAD trazodone model verification
To verify the developed models for trazodone IR and OAD formulations, simulated plasma concentrations were compared with observed clinical data for a single 30 mg dose of IR trazodone and a single 300 mg dose of OAD trazodone. Simulation study design was matched to the clinical studies (number of subjects, demographics, etc.). For the IR formulation, 10 trials of 23 subjects per trial (age 22–54, 49% female) were simulated, whereas for the OAD formulation, a single trial of 43 subjects aged 18–56 years (46.5% women) was used. Model predictions were determined to be acceptable if the simulated parameters fell within 1.5‐fold of the observed values. A comparison of the observed and predicted concentration‐time profiles (visual check) for each formulation was also performed.
Target identification
Measured K i values for several human molecular targets related to activity in the central nervous system (CNS) were available. These K i values were determined using competitive radioligand binding assays using recombinant (CHO or HEK‐293) cells expressing human receptors (58 targets, mainly GPCR and transporters, reported in Table S1). Trazodone was tested at seven log dilutions starting from 10 µM concentration. From the resulting competition curve, half‐maximal inhibitory concentration (IC50) values were determined by a nonlinear least square regression analysis. Inhibition constant (Ki) was calculated for each receptor according to the Cheng‐Prusoff equation. 14 Affinity toward the different receptors was determined in the range 10–1000 nM.
The list of targets was refined by identifying those with greater than or equal to 50% predicted receptor occupancy (RO; ≥0.5) at the maximum unbound brain concentration (Cmax,brain,u) for each dose/formulation level. This threshold was selected as it is the minimal SERT RO achieved for another multimodal drug, vortioxetine, in its clinical effective dose range. 15 Free drug concentrations in the brain were used for final calculations as only protein‐unbound drug concentrations are considered pharmacologically active. The RO was calculated using an Emax sigmoid model following the formula:
| (2) |
with K i being the affinity constant for trazodone HCl on several molecular targets (Table S1). Trazodone maximum free base brain concentrations were taken from Simcyp V18r2 simulations for each dose (30 mg IR single dose, 30 mg IR at steady‐state, and 300 mg OAD at steady‐state). The reported literature value for human f u,brain of 0.077 was used to correct for the unbound concentration. 13
Receptor occupancy simulations
The previously developed and validated trazodone model was used for all simulations. 9 To determine the RO for the IR trazodone formulation, 10 virtual trials of 10 healthy subjects (50% women) aged 20–50 years receiving either a single oral dose or multiple oral doses (q.d., 8 days) of 30 mg IR trazodone were generated. Simulations for the OAD formulation were completed in the same manner, with 10 virtual trials of 10 healthy subjects (50% women) aged 20–50 years receiving multiple oral doses of OAD trazodone (300 mg q.d.; 8 days). Each receptor was simulated independently due to limitations in applying the dynamic PD model across multiple targets.
Effect of in vitro variability on RO
As trazodone K i values used for computations were the result of repeated in vitro assays on human receptors of interest, the effect of standard variability was evaluated on SERT and its RO value was determined for both formulations using two relative K i values (160 and 280 nM; Table S2). The difference in the resulting RO, onset time, and duration of time at or above the target threshold between the two K i values was assessed to determine the impact of the observed variability on RO predictions.
RESULTS
Model validation
The observed and simulated pharmacokinetic (PK) parameters for the 30 mg single dose IR trazodone and 300 mg single dose OAD trazodone are summarized in Table S3. The concentration‐time profiles for the IR and OAD formulations are shown in Figure S1. The simulated values showed good agreement with the observed parameters, with the ratio of simulated to observed (S/O) for the AUC and Cmax falling within 1.6‐fold for both formulations (30 mg IR S/O range: 0.97–1.57; 300 mg OAD S/O range: 0.92–0.97).
Target identification
The simulated plasma and brain concentrations of trazodone following single and multiple oral doses of 30 mg IR trazodone and multiple doses of 300 mg OAD trazodone are shown in Figures S2–S4. The PK parameters for all dosing intervals and formulations are summarized in Table 2.
TABLE 2.
Summary of total plasma and brain PK parameters for 30 mg IR trazodone following single and multiple oral doses and 300 mg OAD trazodone following multiple oral doses
| Dose/formulation | Dosing frequency | Cmax (ng/ml) | Tmax (h) | AUC a (ng/ml × h) |
|---|---|---|---|---|
| Plasma | ||||
| 30 mg IR | s.d. | 442 (17%) | 0.50 | 4992 (36%) |
| q.d. | 533 (21%) | 0.50 | 4992 (40%) | |
| 300 mg OAD | q.d. | 1632 (38%) | 5.18 | 26651 (46%) |
| Brain | ||||
| 30 mg IR | s.d. | 702 (18%) | 0.72 | 7841 (39%) |
| q.d. | 860 (23%) | 0.65 | 8610 (41%) | |
| 300 mg OAD | q.d. | 2814 (39%) | 5.27 | 47882 (48%) |
Cmax and AUC are reported as geometric mean value, Tmax as median, and variability as %CV.
Abbreviations: AUC, area under the curve; Cmax, maximum concentration; IR, immediate release; OAD, once a day; PK, pharmacokinetic; Tmax, time to maximum concentration.
AUC is AUC0‐inf following s.d. administration and AUC0‐24h following q.d. dosing.
Using predicted brain Cmax,brain,u, static calculations were completed for previously identified targets to determine those reaching at least 50% occupancy for each dose and formulation of interest (Table 3). A total of 16 targets were found to be at or above the threshold value at least in one of the conditions evaluated (i.e., 300 mg trazodone OAD at steady‐state) and were included in subsequent receptor occupancy modeling.
TABLE 3.
Calculated RO for proposed targets of interest by unbound brain concentration (Cmax,brain,u)
| Target | System | K i (nM) | RO | ||
|---|---|---|---|---|---|
|
30 mg IR, s.d. (Cmax,brain,u = 145 nM/54.1 ng/ml) |
30 mg IR, q.d. (Cmax,brain,u = 178 nM/66.3 ng/ml) |
300 mg OAD, q.d. (Cmax,brain,u = 583 nM/217 ng/ml) |
|||
| 5‐HT2A | Serotonergic | 14 | 0.912 | 0.927 | 0.977 |
| α1B | Adrenergic | 15 | 0.906 | 0.922 | 0.975 |
| 5‐HT1D | Serotonergic | 26 | 0.848 | 0.873 | 0.957 |
| α1D | Adrenergic | 27 | 0.843 | 0.868 | 0.956 |
| 5‐HT2B | Serotonergic | 48 | 0.752 | 0.788 | 0.924 |
| 5‐HT1A | Serotonergic | 82 | 0.640 | 0.685 | 0.877 |
| α1A | Adrenergic | 98 | 0.597 | 0.645 | 0.856 |
| H1 | Histaminergic | 190 | 0.433 | 0.484 | 0.754 |
| α2C | Adrenergic | 240 | 0.377 | 0.426 | 0.708 |
| SERT | Serotonergic | 280 | 0.342 | 0.389 | 0.675 |
| 5‐HT2C | Serotonergic | 307 | 0.321 | 0.367 | 0.655 |
| 5‐HT7 | Serotonergic | 406 | 0.264 | 0.305 | 0.589 |
| α2A | Adrenergic | 430 | 0.253 | 0.293 | 0.575 |
| α2B | Adrenergic | 460 | 0.240 | 0.279 | 0.559 |
| D3 | Dopaminergic | 490 | 0.229 | 0.267 | 0.543 |
| D2 | Dopaminergic | 560 | 0.206 | 0.241 | 0.510 |
| 5‐HT1B | Serotonergic | 814 | 0.152 | 0.180 | 0.417 |
| D1 | Dopaminergic | 929 | 0.135 | 0.161 | 0.385 |
| D5 | Dopaminergic | 1200 | 0.108 | 0.129 | 0.327 |
| 5‐HT5A | Serotonergic | 2340 | 0.058 | 0.071 | 0.199 |
| NK‐1 | Tachykinin | 3300 | 0.042 | 0.051 | 0.150 |
| σ1 | Sigma | 3980 | 0.035 | 0.043 | 0.128 |
| β2 | Adrenergic | 6000 | 0.024 | 0.029 | 0.089 |
| 5‐HT4 | Serotonergic | 10,000 | 0.014 | 0.018 | 0.055 |
| MOP | Opiate | 15,436 | 0.009 | 0.011 | 0.036 |
| M4 | Cholinergic | 30,000 | 0.005 | 0.006 | 0.019 |
| M2 | Cholinergic | 34,127 | 0.004 | 0.005 | 0.017 |
For normalization from molar to ng/ml the molecular weight of the trazodone free‐base was considered.
Values in bold indicate RO greater than or equal to 50%.
Abbreviations: Cmax,brain,u, unbound brain concentration; IR, immediate release; RO, receptor occupancy.
Immediate release formulation
Single dose receptor occupancy
Mean brain receptor occupancy following a single oral dose of 30 mg (IR formulation, adjusted to free base concentration) to healthy subjects (10 trials of 10 subjects) was simulated. RO was predicted for the seven targets through the application of the Emax sigmoid model using unbound brain concentrations. Simulations were used to estimate mean t onset, that is the time to reach RO greater than or equal to 0.5, and duration of coverage at or above the target RO threshold for each target of interest.
Mean peak RO ranged from 0.59–0.91 for the targets of interest with an average t onset of 0.12 h (Figure 1; Table 4). As would be expected, time at or above the target RO threshold (TAT) of 0.5 decreased with increasing K i, with TAT of 27 h for the most potent (5‐HT2A, K i = 14 nM) dropping to just over 2 h for the highest K i (α1a, K i = 98 nM).
FIGURE 1.
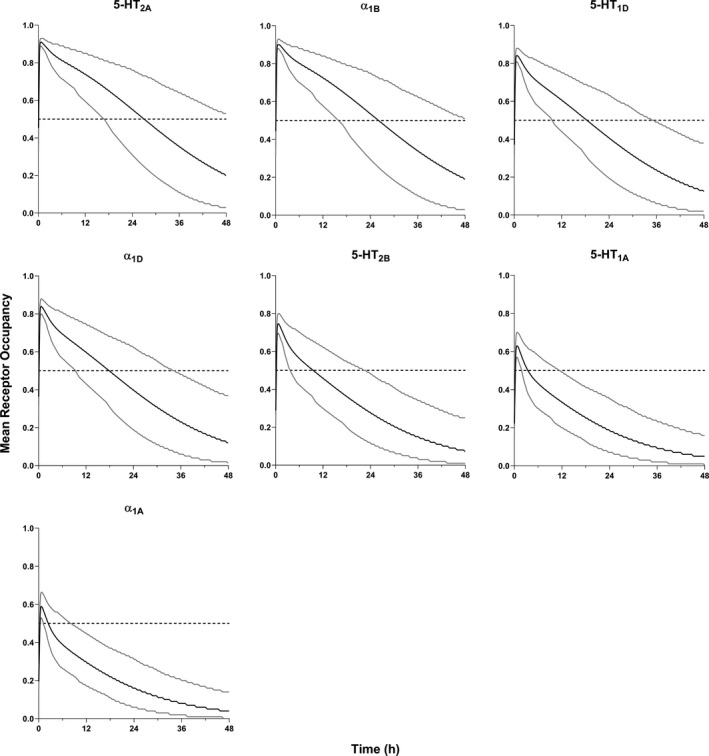
Simulated receptor occupancy vs. time profiles for 30 mg immediate release trazodone following a single oral dose in healthy subjects (mean – black line, 95th and 5th percentiles – grey lines, target receptor occupancy – horizontal dashed line)
TABLE 4.
Predicted geometric mean peak RO and, t onset, and duration of TAT on day 1 and day 7 of 30 mg IR trazodone and on day 7 of 300 mg OAD trazodone administration
| Target | K i (nM) | Mean peak RO | t onset (h) | TAT (h) | ||||||
|---|---|---|---|---|---|---|---|---|---|---|
| 30 mg IR, s.d. | 30 mg IR, q.d. | 300 mg OAD | 30 mg IR, s.d. | 30 mg IR, q.d. | 300 mg OAD | 30 mg IR, s.d. | 30 mg IR, q.d. | 300 mg OAD | ||
| 5‐HT2A | 14 | 0.91 | 0.92 | 0.97 | 0.07 | 0.09 | 0.42 | 27.0 | >24.0 | >24.0 |
| α1B | 15 | 0.90 | 0.92 | 0.97 | 0.07 | 0.09 | 0.42 | 26.0 | >24.0 | >24.0 |
| 5‐HT1D | 26 | 0.84 | 0.87 | 0.95 | 0.07 | 0.09 | 0.50 | 18.3 | 18.2 | >24.0 |
| α1D | 27 | 0.84 | 0.86 | 0.95 | 0.10 | 0.09 | 0.50 | 17.7 | 17.7 | >24.0 |
| 5‐HT2B | 48 | 0.75 | 0.78 | 0.91 | 0.12 | 0.17 | 0.67 | 9.36 | 9.32 | >24.0 |
| 5‐HT1A | 81.8 | 0.63 | 0.68 | 0.86 | 0.19 | 0.25 | 0.76 | 3.29 | 3.11 | >24.0 |
| α1A | 98 | 0.59 | 0.64 | 0.84 | 0.22 | 0.25 | 0.84 | 2.18 | 2.1 | >24.0 |
| H1 | 190 | – | – | 0.73 | – | – | 1.43 | – | – | 16.6 |
| α2C | 240 | – | – | 0.68 | – | – | 2.18 | – | – | 11.9 |
| SERT | 280 | – | – | 0.76 | – | – | 2.94 | – | – | 8.40 |
| 5‐HT2C | 307 | – | – | 0.63 | – | – | 3.44 | – | – | 6.30 |
| 5‐HT7 | 406 | – | – | 0.56 | – | – | 27.05 | – | – | 5.88 |
| α2A | 430 | – | – | 0.55 | – | – | 27.64 | – | – | 4.28 |
| α2B | 460 | – | – | 0.53 | – | – | 28.39 | – | – | 2.19 |
| D3 | 490 | – | – | 0.52 | – | – | 52.42 | – | – | 2.01 |
| D2 | 560 | – | – | 0.48 | – | – | – | – | – | – |
Abbreviations: IR, immediate release; OAD, once a day; RO, receptor occupancy; TAT, time above the RO threshold; t onset, onset time.
Multiple dose receptor occupancy
Ten trials of 10 healthy subjects were simulated for each of the seven targets showing static RO greater than or equal to 50% following multiple doses of 30 mg IR trazodone. The Emax sigmoid model was applied to compute RO using simulated dynamic brain unbound concentration‐time profiles at steady‐state, day 7 of 8 days of dosing. The predicted mean peak receptor occupancies for the targets of interest were then used to estimate tonset (relative to the first dose) and duration of time at or above the threshold, shown in Table 4 and Figure 2.
FIGURE 2.

Simulated mean receptor occupancy versus time following 7 days of dosing of immediate release trazodone (30 mg q.d.) in healthy subjects (mean – black line, 95th and 5th percentiles – grey lines, target receptor occupancy – horizontal dashed line)
Mean peak RO at steady‐state was similar to what was observed following a single IR dose, ranging from 0.64 to 0.92. Similarly, average t onset to reach the target RO was 0.15 h (range: 0.09–0.25 h). Targets with high affinity showed TAT greater than 24 h (5‐HT2A and α1B, K i = 14 nM and 15 nM, respectively) with TAT ranging from 18.0 h to 2.10 h for the remaining receptors evaluated.
Once a day formulation
Multiple dose receptor occupancy
Ten trials of 10 healthy subjects were simulated for each of the 16 targets showing static RO greater than or equal to 50% following daily administration of 300 mg OAD trazodone. The Emax sigmoid PD model was applied to compute receptor occupancies at steady‐state (day 7), as shown in Figure 3. The predicted mean receptor occupancy, t onset, and TAT for targets of interest are summarized in Table 4. At steady‐state, the mean peak RO ranged from 0.48 to 0.97. The threshold value of RO greater than or equal to 0.5 was reached after the first dose for 11 of 16 targets (t onset ranging from 0.42 to 3.44 h). For the remaining four targets, t onset was reached after the second dose (t onset 27.1–28.4 h) for all except one receptor (D3, t onset = 52.4 h) and one target identified in the static modeling, D2, that did not reach the RO threshold in the time simulated (mean peak RO = 0.48).
FIGURE 3.

Simulated mean receptor occupancy following 7 days of dosing of once a day trazodone (300 mg q.d.; mean – black line, 95th and 5th percentiles – grey lines) in healthy subjects
To determine if the average brain concentration at steady‐state (C ave,brain,u) could be used to determine those targets at or above the RO threshold, receptor occupancies were also computed using C ave,brain,u. The simulated difference in RO between the two methods ranges from 10 to 17% for targets with relatively low binding affinity (K i >100 nM), whereas minimal difference was observed for those with high affinity (≤5%; Table S4). It is important to note that the simulated difference in RO also reflects the difference between mean RO (C ave,u as inputs) and peak RO (dynamic brain concentration as inputs), both calculated at the seventh dosing day. For those targets with lower affinity, time to reach the target RO (t onset, which is calculated starting from the first dose) is reached after the second dose (i.e., >24 h), once the drug has accumulated in the brain. This is supported by the same targets not reaching the threshold value when mean steady‐state concentration was used to determine occupancy and can be observed in the PD profiles presented in Figure S5.
In vitro variability
Ten virtual trials of 10 healthy subjects, as described previously, for each dose and formulation of interest were generated using two reported in vitro K i values (160 nM and 280 nM) for SERT, summarized in Table S5 and Figure S6. For the IR formulation, a difference of ~ 1.4‐fold in RO was observed for the low and high K i values. There was no significant difference in RO between day 1 and day 7. A similar difference was seen for the OAD formulation, with a 1.2‐fold difference in RO. For those formulations and dosing schemes reaching the target RO of 0.5, there was a slight increase in t onset (1.18 h vs. 2.94 h) with a significant decrease in the time at or above the threshold (20 h vs. 8.4 h) for the higher K i value.
DISCUSSION
Using the updated trazodone PBPK model, brain receptor occupancy was determined for the 30 mg IR (single dose and at steady‐state) and 300 mg OAD (at steady‐state) formulations. As it is difficult to determine brain concentrations, and therefore receptor occupancies in vivo, this approach allows for a better mechanistic understanding of the mechanism of action of trazodone when administered as an IR versus OAD formulation. This analysis demonstrated the utility of a PBPK‐based approach for generating initial estimates of in vivo occupancy, particularly when clinical data are unavailable. Simulating the widest possible range of exposures for trazodone, 30 mg IR (SD) to 300 mg OAD (QD), allowed to further support determination of the optimal exposure‐related differentiation of brain receptor activation by trazodone between formulations.
For the 30 mg IR formulation, seven targets (5‐HT2A, α1B, 5‐HT1D, α1D, 5‐HT2B, 5‐HT1A, and α1A) were identified through static predictions from the unbound brain Cmax to meet the threshold of 50% RO. Simulation shows that all targets exhibit rapid onset (t onset ≤0.25 h) after the first dose, with time above the target threshold (i.e., RO ≥50%) ranging from 2.4 to 26.9 h. It is important to note that, in the current study, the kinetics of association and dissociation of drugs binding to a specific target is not considered due to lack of data on k on and k off rates. Therefore, the duration of coverage at or above the target RO threshold may be overestimated. In this work, a “time above threshold” is reported as compared to “duration of occupancy” to address this difference. No significant differences were observed in the RO between day 1 and day 7.
In the current study, the PBPK simulations provided the mechanistic basis to support the clinically observed efficacy of trazodone IR to treat insomnia, already when given at the low dose of 30 mg, with predicted RO for 5‐HT1A, 5‐HT1D, 5‐HT2A, 5‐HT2B, α1A, α1B, and α1D receptors of more than 0.63, 0.84, 0.91, 0.75, 0.59, 0.90, and 0.84, respectively.
Sixteen targets were identified from static modeling to reach 50% RO for the OAD formulation (300 mg q.d.). Simulations showed geometric mean peak RO at steady‐state ranging from 0.48 to 0.97 with higher affinity targets (K i ≤300 nM) reaching the threshold occupancy after the first dose (t onset range: 0.42–3.44 h). Targets with poor affinity did not reach RO greater than or equal to 0.5 until the second or third day of dosing, and in one case did not reach the threshold value at all, depending on the K i value.
Comparing mean RO determined from the C ave,brain,u to the mean peak RO simulated using the dynamic brain unbound concentration‐time profiles as PK inputs, differences of 6% or less in the predicted RO was observed for those targets with relatively tight binding affinity (K i <100 nM). The simulated difference in RO increased to 10–17% for targets with relatively poor binding affinity (K i >100 nM). Due to the similar results obtained from the two methods, it can be assumed that an adequate estimate of RO can be determined from average concentrations when dynamic concentration‐time data is unavailable.
It is frequently noted that there are multiple reported values for parameters, such as K i, with little information on how this effects subsequent clinical predictions. Here, the utility of PBPK for assessing the impact of this variability is shown through simulations with two reported K i values for SERT—a key receptor in trazodone efficacy. This also serves to evaluate the effect of PD variability, as it is important to note that the simulator only accounts for variability in the PK simulation through built‐in covariates (i.e., age, weight, sex, and plasma protein levels), not the PD calculations. Using different experimental K i values, RO for a specific formulation and dosing scheme differed by an average of 1.4‐fold. For repeat doses of 30 mg trazodone IR, this resulted in predicted ROs that reached the target threshold in one scenario and not in the other scenario (RO = 0.52 and 0.38 for the low and high K i value, respectively). This difference appears to be more pronounced for borderline occupancy cases. In contrast, the difference in RO was significantly reduced in the case of OAD trazodone where SERT RO was generally higher (RO = 0.76 and 0.65, respectively).
Although previous work has been performed to determine brain RO for trazodone targets, the approach presented here differs in three key areas. 16 First, a comprehensive evaluation of potential targets was completed using initial static calculations with over 50 targets evaluated compared to ~30 previously explored. Next, the RO calculations used here were based on unbound trazodone concentrations in the brain as compared to total brain trazodone concentrations, as only the free drug is able to bind with the receptors. Finally, RO was determined using a full PBPK model with a perfusion‐limited brain compartment, as is supported by data showing no significant involvement of brain transporters, compared to a two‐compartment model using a rodent K p,uu (i.e., a ratio of unbound brain to unbound plasma concentration) value to adjust concentrations. These key differences allow for an updated prediction of RO that better captures the processes involved in vivo.
It should be noted that the simulations presented here for the IR formulation do result in a 1.6‐fold overprediction in trazodone AUC compared to the clinical value, which could affect the interpretation of the simulated RO. In model development for the IR and OAD formulations, two studies reporting trazodone clearance were identified with reported CLIV values differing by approximately twofold (5.3 L/h vs. 10.0 L/h). 17 , 18 From the data presented, there is no obvious explanation for the discrepancy as the only difference in study design appears to be PK sampling duration (24 h vs. 26 h). In the final model, the CLIV has been set to 5.0 L/h for both formulations as to ensure the developed models can adequately capture the observed drug exposures for both formulations. Also, of importance for this discussion, is that the simulated F is different for both formulations—primarily due to the difference in the predicted value for F a. For the IR formulation, F a is ~ 1 in agreement with the findings from a human mass balance study in healthy volunteers, whereas the simulated F a for the OAD formulation is 0.5, predicted from a mechanistic absorption model and in vivo dissolution profile. To improve the prediction of the IR formulation, a higher CLIV or lower F a would be required—the former resulting in poor prediction of the OAD formulation, and the latter not supported by the high permeability and reasonable solubility of the drug.
As described by Morgan et al., it is important to understand drug exposure at the site of action, target binding, and expression of functional pharmacological activity. 19 In turn, achieving sufficient exposure, target binding, and pharmacology modulation for efficacy is key to clinical success. Although further work including imaging studies to visualize the in vivo occupancy during treatment would serve as confirmation for these results, this modeling exercise was able to simulate exposure at the site of action (brain) and occupancy at the relevant receptors. Overall, the results are consistent with the dose‐dependent pharmacological activity of trazodone. The lower doses (i.e., the 30 mg of the IR formulation, both after single and repeated q.d. dosing), acts via the most potent functional properties—5‐HT2A and α1 adrenergic antagonism and 5‐HT1A partial agonism and achieves reasonable levels of occupancy for these receptors (>0.59). The proper antidepressant dose of trazodone (i.e., 300 mg of the OAD formulation after repeated q.d. dosing) recruits additional pharmacological actions, such as the SERT blockade and antagonism of histaminergic H1, 5‐HT2C, and 5‐HT7, and is able to achieve reasonable levels of occupancy at these additional receptors (>0.56). These findings form a strong foundation to further evaluate the multifunctional and multimodal mechanism of action for trazodone in achieving full antidepressant efficacy at target daily dose of 150–300 mg.
CONFLICT OF INTEREST
The authors declared no competing interests for this work.
AUTHOR CONTRIBUTIONS
L.O., M.T.R., A.C., G.D., S.J.M., A.K., and H.M.J. wrote the manuscript. L.O., G.M., M.T.R., A.C., G.D., S.J.M., A.K., and H.M.J. designed the research. S.J.M., A.K., and H.M.J. performed the research. L.O., G.M., M.T.R., A.C., G.D., S.M., A.K., and H.M.J. analyzed the data.
Supporting information
Supplementary Material S1
Supplementary Material S2
ACKNOWLEDGEMENTS
The authors wish to thank Matteo Vergassola and Parisa Foroutan (both part of Angelini Pharma S.p.A.) for their assistance in reviewing this work.
Oggianu L, Di Dato G, Mangano G, et al. Estimation of brain receptor occupancy for trazodone immediate release and once a day formulations. Clin Transl Sci. 2022;15:1417‐1429. doi: 10.1111/cts.13253
Funding information
This work was supported by Angelini Pharma S.p.A.
REFERENCES
- 1. Herr J, Caspi A. Oleptro™ (trazodone hydrochloride) extended‐release tablets. PT. 2011;36:2‐18. [PMC free article] [PubMed] [Google Scholar]
- 2. Albert U, Lamba P, Stahl SM. Early response to trazodone once‐a‐day in major depressive disorder: review of the clinical data and putative mechanism for faster onset of action. CNS Spectr. 2021;26:232‐242. [DOI] [PubMed] [Google Scholar]
- 3. Fagiolini A, Comandini A, Catena Dell'Osso M, Kasper S. Rediscovering trazodone for the treatment of major depressive disorder. CNS Drugs. 2012;26:1033‐1049. [DOI] [PMC free article] [PubMed] [Google Scholar]
- 4. Stahl SM. Mechanism of action of trazodone: a multifunctional drug. CNS Spectr. 2009;14:536‐546. [DOI] [PubMed] [Google Scholar]
- 5. Angelini Pharma S.p.A . Trazodone Investigator's Brochure 8656B01; 2013.
- 6. Schwasinger‐Schmidt TE, Macaluso M. Other antidepressants. Handb Exp Pharmacol. 2019;250:325‐355. [DOI] [PubMed] [Google Scholar]
- 7. Beasley CM Jr, Dornseif BE, Pultz JA, Bosomworth JC, Sayler ME. Fluoxetine versus trazodone: efficacy and activating‐sedating effects. J Clin Psychiatry. 1991;52:294‐299. [PubMed] [Google Scholar]
- 8. Weisler RH, Johnston JA, Lineberry CG, et al. Comparison of bupropion and trazodone for the treatment of major depression. J Clin Psychopharmacol. 1994;14:170‐179. [PubMed] [Google Scholar]
- 9. Oggianu L, Ke AB, Chetty M, et al. Estimation of an appropriate dose of trazodone for pediatric insomnia and the potential for a trazodone‐atomoxetine interaction. CPT Pharmacometrics Syst Pharmacol. 2020;9:77‐86. [DOI] [PMC free article] [PubMed] [Google Scholar]
- 10. Jamei M, Turner D, Yang J, et al. Population‐based mechanistic prediction of oral drug absorption. AAPS J. 2009;11:225‐237. [DOI] [PMC free article] [PubMed] [Google Scholar]
- 11. Oggianu L, Pasculli G, Furlotti G, et al. Development and verification of population level IVIVC using mechanistic PBPK modeling for trazodone extended release formulations to support biowaiver for SUPAC changes to the formulation. AAPS PharmSci 2018;360. https://www.eventscribe.net/2018/PharmSci360/fsPopup.asp?efp=UUFSQlZZVFM1OTQ2&PosterID=166145&rnd=0.550835&mode=posterinfo [Google Scholar]
- 12. Gertz M, Harrison A, Houston JB, Galetin A. Prediction of human intestinal first‐pass metabolism of 25 CYP3A substrates from in vitro clearance and permeability data. Drug Metab Dispos. 2010;38:1147‐1158. [DOI] [PubMed] [Google Scholar]
- 13. Di LI, Umland JP, Chang G, et al. Species independence in brain tissue binding using brain homogenates. Drug Metab Dispos. 2011;39:1270‐1277. [DOI] [PubMed] [Google Scholar]
- 14. Cheng Y, Prusoff WH. Relationship between the inhibition constant (K1) and the concentration of inhibitor which causes 50 per cent inhibition (I50) of an enzymatic reaction. Biochem Pharmacol. 1973;22:3099‐3108. [DOI] [PubMed] [Google Scholar]
- 15. Sanchez C, Asin KE, Artigas F. Vortioxetine, a novel antidepressant with multimodal activity: review of preclinical and clinical data. Pharmacol Ther. 2015;145:43‐57. [DOI] [PubMed] [Google Scholar]
- 16. Settimo L, Taylor D. Evaluating the dose‐dependent mechanism of action of trazodone by estimation of occupancies for different brain neurotransmitter targets. J Psychopharmacol. 2018;32:96‐104. [DOI] [PubMed] [Google Scholar]
- 17. Nilsen OG, Dale O. Single dose pharmacokinetics of trazodone in healthy subjects. Pharmacol Toxicol. 1992;71:150‐153. [DOI] [PubMed] [Google Scholar]
- 18. Greenblatt DJ, Friedman H, Burstein ES, et al. Trazodone kinetics: effect of age, gender, and obesity. Clin Pharmacol Ther. 1987;42:193‐200. [DOI] [PubMed] [Google Scholar]
- 19. Morgan P, Van Der Graaf PH, Arrowsmith J, et al. Can the flow of medicines be improved? Fundamental pharmacokinetic and pharmacological principles toward improving Phase II survival. Drug Discov Today. 2012;17:419‐424. [DOI] [PubMed] [Google Scholar]
Associated Data
This section collects any data citations, data availability statements, or supplementary materials included in this article.
Supplementary Materials
Supplementary Material S1
Supplementary Material S2