PURPOSE
The customary approach to early-phase clinical trial design, where the focus is on identification of the maximum tolerated dose, is not always suitable for noncytotoxic or other targeted therapies. Many trials have continued to follow the 3 + 3 dose-escalation design, but with the addition of phase I dose-expansion cohorts to further characterize safety and assess efficacy. Dose-expansion cohorts are not always planned in advance nor rigorously designed. We introduce an approach to the design of phase I expansion cohorts on the basis of sequential predictive probability monitoring.
METHODS
Two optimization criteria are proposed that allow investigators to stop for futility to preserve limited resources while maintaining traditional control of type I and type II errors. We demonstrate the use of these designs through simulation, and we elucidate their implementation with a redesign of the phase I expansion cohort for atezolizumab in metastatic urothelial carcinoma.
RESULTS
A sequential predictive probability design outperforms Simon's two-stage designs and posterior probability monitoring with respect to both proposed optimization criteria. The Bayesian sequential predictive probability design yields increased power while significantly reducing the average sample size under the null hypothesis in the context of the case study, whereas the original study design yields too low type I error and power. The optimal efficiency design tended to have more desirable properties, subject to constraints on type I error and power, compared with the optimal accuracy design.
CONCLUSION
The optimal efficiency design allows investigators to preserve limited financial resources and to maintain ethical standards by halting potentially large dose-expansion cohorts early in the absence of promising efficacy results, while maintaining traditional control of type I and II error rates.
INTRODUCTION
Designs of phase I clinical trials in oncology were devised to assess safety and identify the maximum tolerated dose and recommended phase II dose of the drug under study. These trials are typically small, single-arm studies in heavily pretreated patient populations. Phase I trials are most commonly implemented using the rule-based 3 + 3 design to conduct dose-escalation. In the modern treatment era, phase I dose-expansion cohorts are being used with greater frequency to further characterize the safety and assess the efficacy of drugs in disease-specific cohorts, or to compare across doses in settings where no maximum tolerated dose may exist. Manji et al1 found that the use of expansion cohorts in single-agent phase I cancer trials increased from 12% in 2006 to 38% in 2011. Bugano et al2 expanded on this work to show that drugs tested in phase I trials with expansion cohorts had higher rates of success in phase II.
CONTEXT
Key Objective
Dose-expansion cohorts are being used more frequently in phase I oncology clinical trials to further characterize safety and get preliminary data on efficacy of new treatments. This paper uses Bayesian sequential predictive probability futility monitoring for the design of phase I expansion cohort studies, and proposes two optimization criteria for selecting a design with acceptable frequentist operating characteristics.
Knowledge Generated
In comparison to the traditional Simon's two-stage design or a Bayesian sequential posterior probability futility monitoring design, a Bayesian sequential predictive probability futility monitoring design selected using the proposed optimization criteria yielded higher power while reducing the average sample size under the null hypothesis.
Relevance
The use of a Bayesian sequential predictive probability futility monitoring design selected using the proposed optimization criteria will allow phase I expansion studies to be designed with high power to detect active drugs, while minimizing the number of patients treated with inactive drugs.
But dose-expansion cohorts are not always planned in advance nor designed with statistical rigor. For example, Manji et al1 found that only 74% of trial protocols included a stated objective regarding the expansion cohort. Dose-expansion cohorts that aim to assess efficacy do not always provide sample size justification, and as a result, sample sizes in expansion cohorts have at times been too small to meet the study aims, while at other times they have exceeded those of traditional phase II trials. For example, the KEYNOTE-001 trial of pembrolizumab included multiple protocol amendments and ultimately enrolled a total of 655 patients across five melanoma expansion cohorts and 550 patients across four non–small-cell lung cancer expansion cohorts.3
Guidance is needed to formalize the statistical designs of phase I expansion cohorts to allow for early stopping for futility as a mechanism to ensure that the trial is ethical for participants and makes efficient use of resources, while also operating within well-defined statistical criteria for control of type I error and power. This article proposes optimization metrics for designing sequential dose-expansion cohorts using Bayesian predictive probability monitoring in a manner that satisfies traditional criteria for type I error and power. We demonstrate the design through simulation studies and apply the methodology to redesign a case study on the basis of an expansion cohort studying atezolizumab in metastatic urothelial bladder cancer.
METHODS
Simon's two-stage designs provide methodology for designing clinical trials with a single look for futility. The decision threshold applied at the interim analysis is selected to minimize the maximum sample size (minimax design) or the expected sample size under the null hypothesis (optimal design).4 These designs are the predominate approach to phase II trials in oncology, and are increasingly applied to phase I dose-expansion cohorts, but are limited to having a single interim look for futility. By incorporating more frequent interim looks for futility, it may be possible to stop trials considerably earlier, thus conserving valuable human and financial resources and preventing patients from being subject to ineffective treatments.
The Bayesian statistical paradigm provides the fundamental theory of sequential statistical learning, and allows flexibility in both the number and timing of interim looks. Posterior distributions reflect the synthesis of prior expectation and experimental evidence acquired in the trial and form the basis for statistical inference. Posterior probabilities, which arise from applying a clinically relevant threshold to the posterior distribution, describe the probability that the response rate exceeds the null on the basis of the data accrued so far in a trial. At any interim analysis, the trial's final result can be predicted by computing the posterior predictive probability (PPP), which represents the probability that the treatment will be declared efficacious at the end of the trial when full enrollment is reached, conditional on the currently observed data. A sequential predictive probability monitoring design can stop the trial if the predictive probability drops below a predefined predictive threshold.5-8 Predictive probability thresholds closer to zero lead to less frequent stopping for futility, whereas thresholds near one lead to frequent stopping unless there is almost certain probability of success on the basis of the accrued data. See the section Appendix 1 for the mathematical details of the calculation of PPP. A prior was used for all calculations in this manuscript.
To design a trial using sequential predictive probability monitoring that controls type I error and achieves acceptable power, we must examine designs on the basis of a range of combinations of posterior and predictive thresholds and choose the design that best meets our desired operating characteristics. Here, we only consider static thresholds across all interim monitoring times. We propose two optimization metrics for identifying optimal threshold combinations. The first optimization criterion considers a design's accuracy. An accurate expansion cohort design minimizes type I and type II errors. We can visualize the accuracy of any design using a scatterplot displaying type I error rate on the x-axis and power (1 -type II error rate) on the y-axis. A perfectly accurate design approaches the point (0, 1), representing no type I error and power of one. Designs can be compared for accuracy on the basis of their Euclidean distance to the ideal design. We refer to the design with nearest proximity to the ideal design as the optimal accuracy (OA) design.
The second optimization criterion considers a design's efficiency. An efficient expansion cohort design stops early for futility when the null hypothesis is true while maximizing patient enrollment when the drug achieves its targeted response rate. We can visualize a design's efficiency using a scatterplot of the average sample size under the null (x-axis) versus the average sample size under the alternative (y-axis). The Euclidean distance to the upper left point on this plot provides a quantitative measure of efficiency. We refer to the design that comes closest to a minimal sample size under the null and a maximal sample size under the alternative as the optimal efficiency (OE) design. Note that identification of the OE design is subject to the additional constraints of an acceptable range of type I error and a minimum power threshold. Without such constraints, it is possible to identify an optimal design with very low power and/or very high type I error that would not be an acceptable design option in practice.
We also note that Euclidean distances can be computed with equal weighting between the axes or with unequal weighting to reflect a preference for one versus the other (eg, minimizing type I v type II error rates). Our implementation only compares designs on the basis of equal weighting. All statistical analyses were conducted using R statistical software.9 Calculations for the Simon's two-stage design were made using the clinfun package.10 Calculations for the sequential predictive probability design, including optimization and plotting, were made using the ppseq package.11
RESULTS
Simulated Data Example
To demonstrate the use of sequential predictive probability monitoring, consider the setting of a one-sample dose-expansion cohort comparing an experimental treatment to the established response rate of a standard-of-care treatment. The end point is tumor response measured as a binary variable. The null, or unacceptable, response rate is 0.1 and the alternative, or acceptable, response rate is 0.3. The Simon's two-stage minimax design on the basis of these response rates, and assuming a type I error of 0.05 and a power of 0.8, enrolls a maximum of 25 patients. Fifteen patients are enrolled in the first stage and if < 2 responses are observed, the trial is stopped for futility. Otherwise, enrollment continues to 25 and the trial is declared a success if six or more responses are observed. We also compare to Simon's two-stage optimal design with a total sample size of 25, which has a type I error of 0.075 and a power of 0.8. This design enrolls 10 patients in the first stage, and stops for futility if < 2 responses are observed. Otherwise, enrollment continues to 25, and the trial is declared a success if five or more responses are observed.
For comparability with these Simon's two-stage designs, we plan a sequential predictive probability design with a maximum sample size of 25. We monitor for futility after every five patients and simultaneously consider the posterior threshold that would be used to determine efficacy at the end of the trial, and the predictive threshold that would be used to stop for futility at a given interim look. We examine each possible combination of thresholds and calculate the associated type I error and power so that we can ultimately select a design with desirable operating characteristics. In this simulation, we considered posterior thresholds of 0, 0.7, 0.74, 0.78, 0.82, 0.86, 0.9, 0.92, 0.93, 0.94, 0.95, 0.96, 0.97, 0.98, 0.99, 0.999, 0.9999, 0.99999, and 1, and we considered predictive thresholds of 0.05, 0.1, 0.15, and 0.2.
Finally, we compare to a Bayesian posterior probability monitoring design12 that uses the same total sample size of 25 and cohort size of five patients. Multc Lean Desktop software program (downloaded from Biostatistics Software13 on December 15, 2021) was used to generate decision rules for each of the above-listed posterior thresholds, using a constant standard treatment response rate of 0.1 and a prior distribution for the experimental treatment response rate.
We generate 10,000 null data sets where the true response probability is 0.1 and 10,000 alternative data sets where the true response probability is 0.3. For each simulated data set, we apply the Simon's two-stage minimax and optimal design rules, the posterior probability monitoring design rules for each posterior threshold, and the sequential predictive probability design for each combination of posterior and predictive thresholds. For each design, we calculate the proportion of simulated data sets that stop early for futility, the proportion of simulated data sets that are declared efficacious, and the average sample size enrolled across the simulated data sets. In null data sets, the proportion of simulated data sets that are declared efficacious represents the type I error rate. In alternative data sets, the proportion of simulated data sets in which the experimental treatment is declared efficacious represents the power.
Figure 1 displays the resulting accuracy and efficiency of the Simon's minimax, Simon's optimal, posterior probability, and predictive probability designs. Optimal designs were selected from those with type I error between 0.05 and 0.1 and power of at least 0.7. The Simon's two-stage minimax design had empirical type I error 0.03 and empirical power 0.81 while enrolling an average of 19.4 and 24.6 participants under the null and alternative hypotheses, respectively. The Simon's two-stage optimal design had empirical type I error 0.03 and empirical power 0.74 while enrolling an average of 13.9 and 22.8 participants under the null and alternative hypotheses, respectively. The posterior probability designs all had very low type I error < 0.001 and low power < 0.4. The OA design is the sequential predictive probability design with posterior threshold 0.93 and predictive threshold 0.1, which had type I error 0.087 and power 0.89 (Fig 1A). This design enrolls an average of 16.7 and 24.3 participants under the null and alternative hypotheses, respectively. The OE design is the sequential predictive probability design with posterior threshold 0.86 and predictive threshold 0.2, which had type I error 0.065 and power 0.77 (Fig 1B). This design enrolls an average of 11 and 21.3 participants under the null and alternative hypotheses, respectively. On the basis of these results, we may choose the OE design since it will optimize our resource utilization by controlling the sample size while still maintaining desirable operating characteristics. If we required a minimum power of 0.8, the previously described OA design would also have OE.
FIG 1.
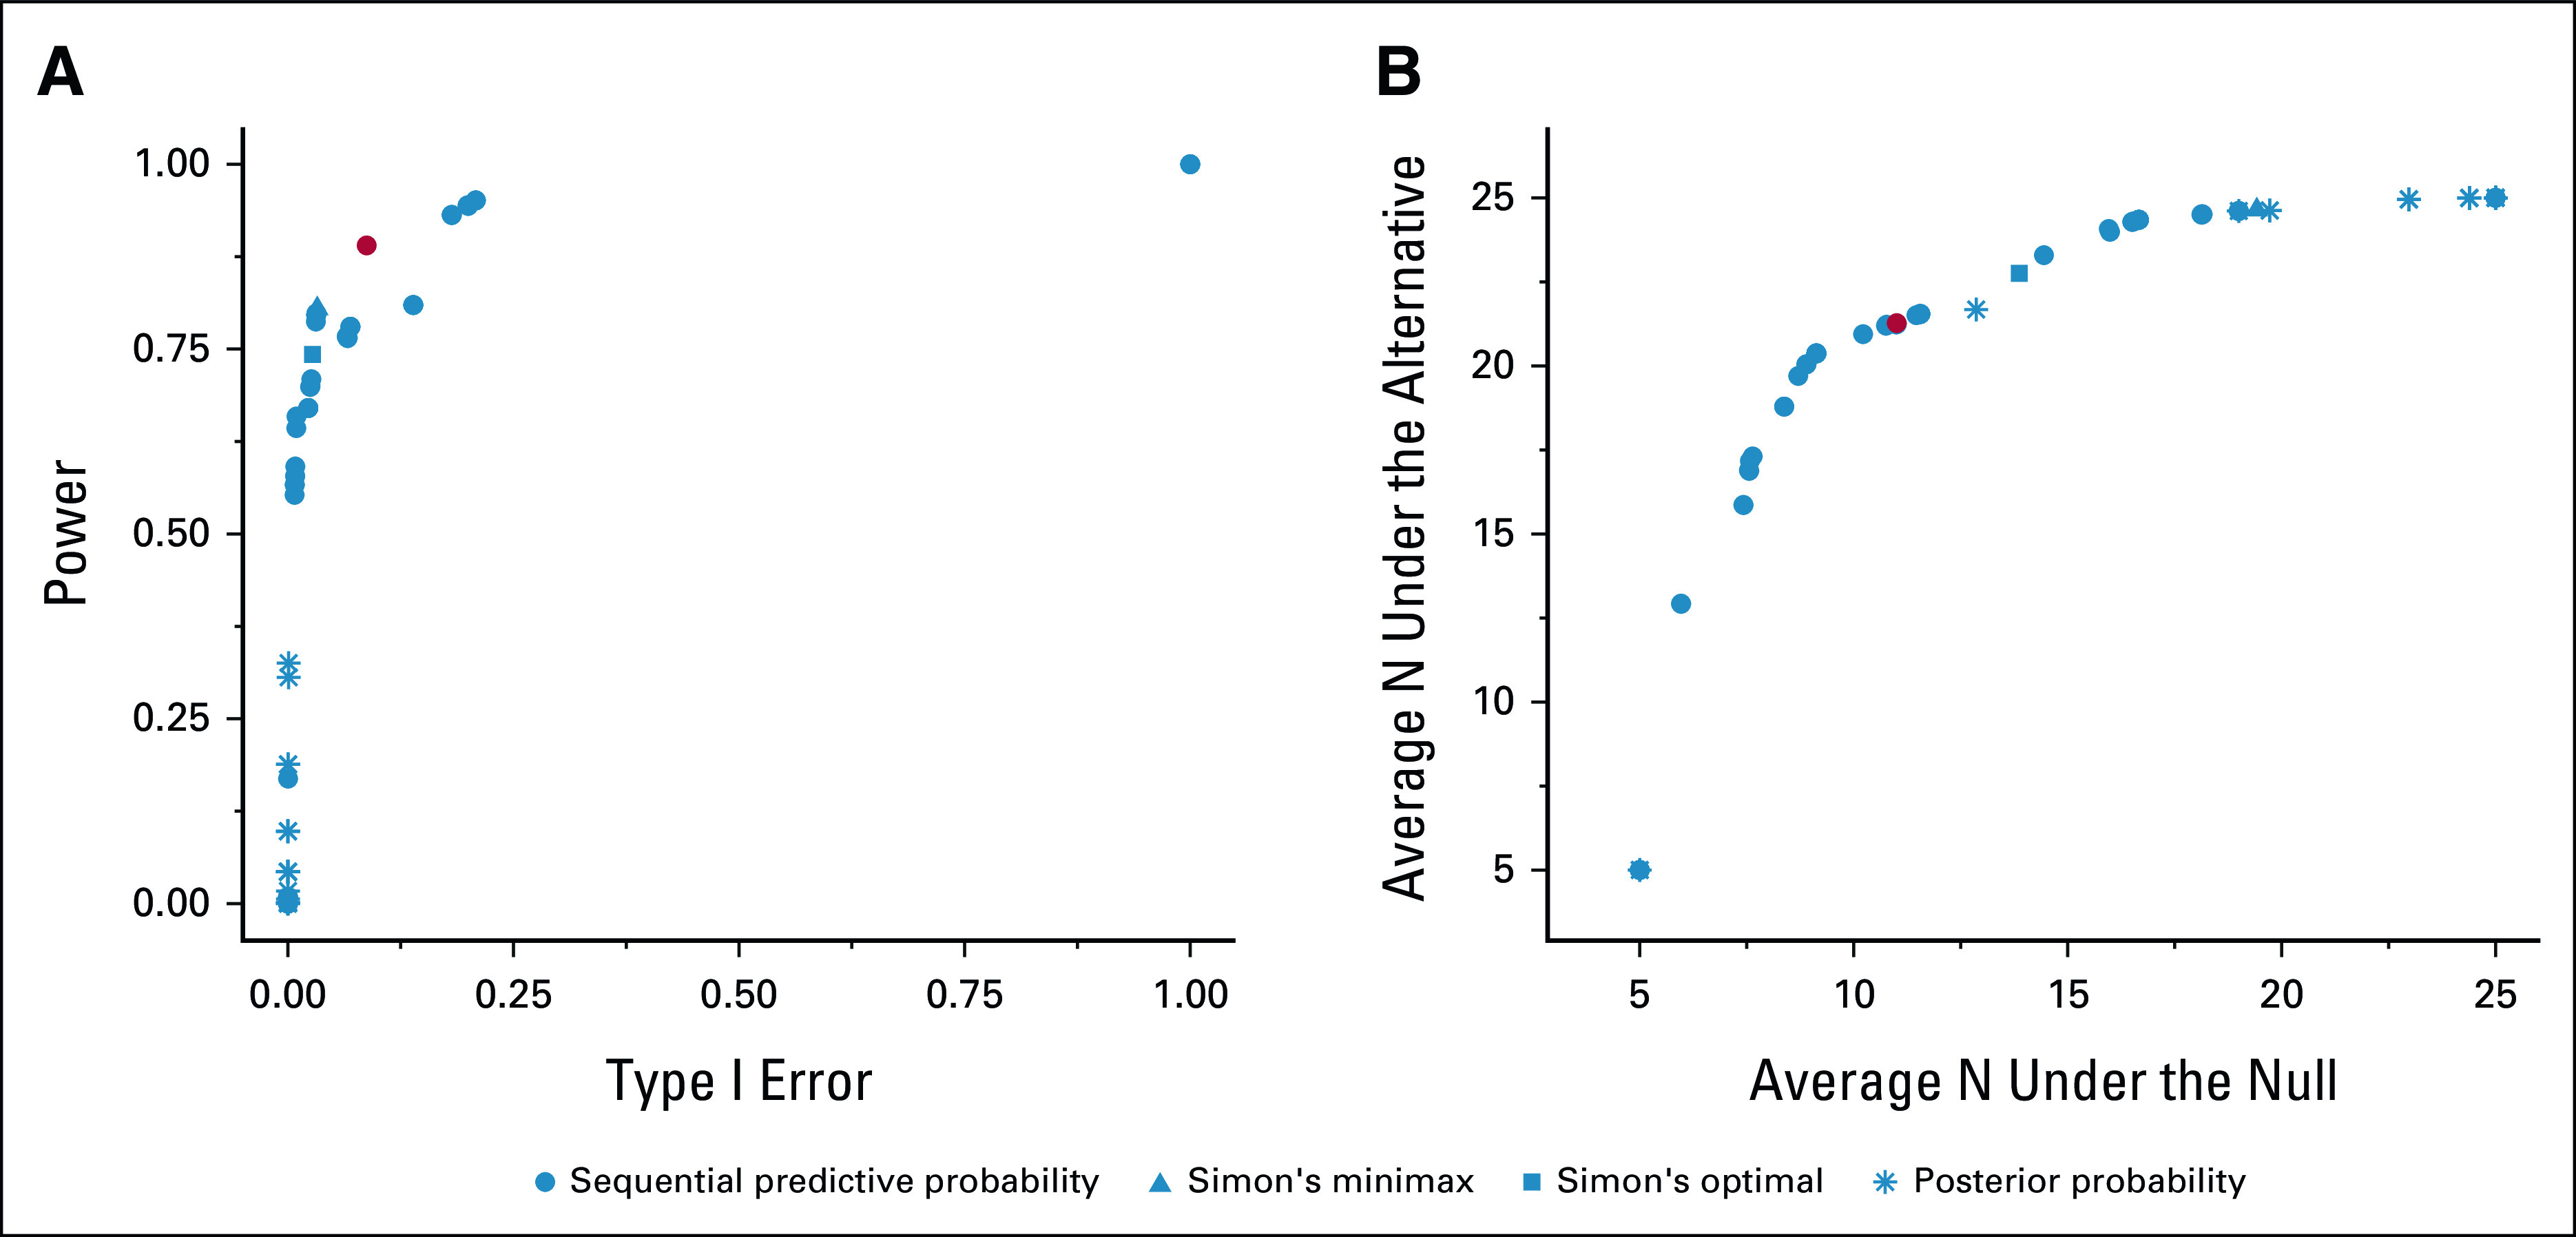
Optimal expansion cohort design options for the simulated data example on the basis of (A) type I error and power where the red point indicates the OA design and (B) sample size under the null and alternative hypotheses where the red point indicates the OE design. OA, optimal accuracy; OE, optimal efficiency.
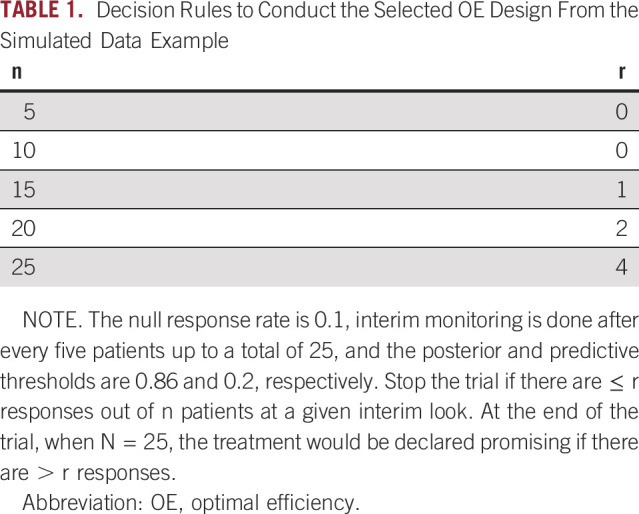
Once a design has been selected in this way, we can map the design's posterior and predictive thresholds into a set of decision rules that would be used at each sequential monitoring point in the trial to avoid interim statistical computation. The decision rules associated with the selected OE design are shown in Table 1.
TABLE 1.
Decision Rules to Conduct the Selected OE Design From the Simulated Data Example
Case Study
The basket trial of atezolizumab, an anti-programmed death-ligand 1 (PD-L1) treatment, enrolled patients with a variety of cancers and included dose-expansion cohorts with the primary aim of further evaluating safety and the secondary aim of investigating preliminary efficacy (NCT01375842). An expansion cohort in metastatic urothelial carcinoma was not part of the original protocol design, but was added later via protocol amendment and ultimately enrolled a total of 95 participants.14,15 Other expansion cohorts included in the original protocol were planned with a sample size of 40 and a single interim futility analysis that would stop the trial if 0 responses were seen in the first 14 patients enrolled. According to the trial protocol, this futility rule is associated with at most a 4.4% chance of observing no responses in 14 patients if the true response rate is 20% or higher.
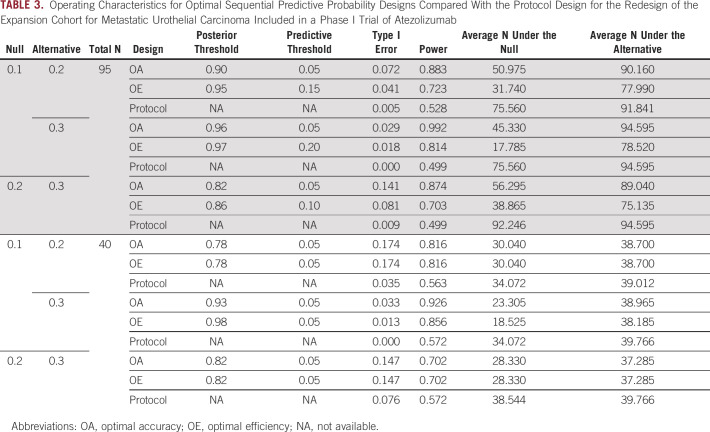
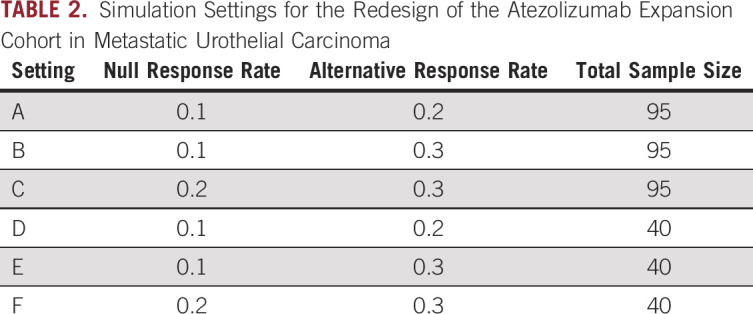
On the basis of these pieces of information about the original design of the atezolizumab expansion cohorts, we investigate a variety of scenarios (Table 2). These scenarios include combinations of a null response rate of 0.1 or 0.2, an alternative response rate of 0.2 or 0.3, and a sample size of 40 or 95. For the protocol design, we use the originally planned single futility look, stopping the trial if 0 responses are observed in the first 14 patients. The trial is declared to have a positive result if the total number of responses meets or exceeds the ceiling of the alternative response rate times the total sample size for a given scenario. For the sequential predictive probability designs, we conduct interim analyses after every five patients. We consider the same posterior and predictive thresholds as in the simulated data example. Only designs with type I error between 0.01 and 0.2 and with power of at least 0.7 were considered for design optimization. 1,000 simulated data sets were generated under both the null and alternative hypotheses.
TABLE 2.
Simulation Settings for the Redesign of the Atezolizumab Expansion Cohort in Metastatic Urothelial Carcinoma
The potential design options are plotted according to accuracy and efficiency in Figures 2A and 2B, respectively, and detailed operating characteristics of the optimal and protocol designs are presented in Table 3. In all cases, we can identify an OE sequential predictive probability design with higher power and lower average sample size under the null compared with the protocol design. The OE designs all have acceptable type I error when the sample size is 95. By comparison, the protocol designs have unreasonably low type I error of < 0.01 and low power of around 50%. When the planned sample size is only 40, none of the designs perform particularly well in the two cases where there is only a 0.1 difference between the null and alternative response rates (ie, 0.1 v 0.2, or 0.2 v 0.3).
FIG 2.
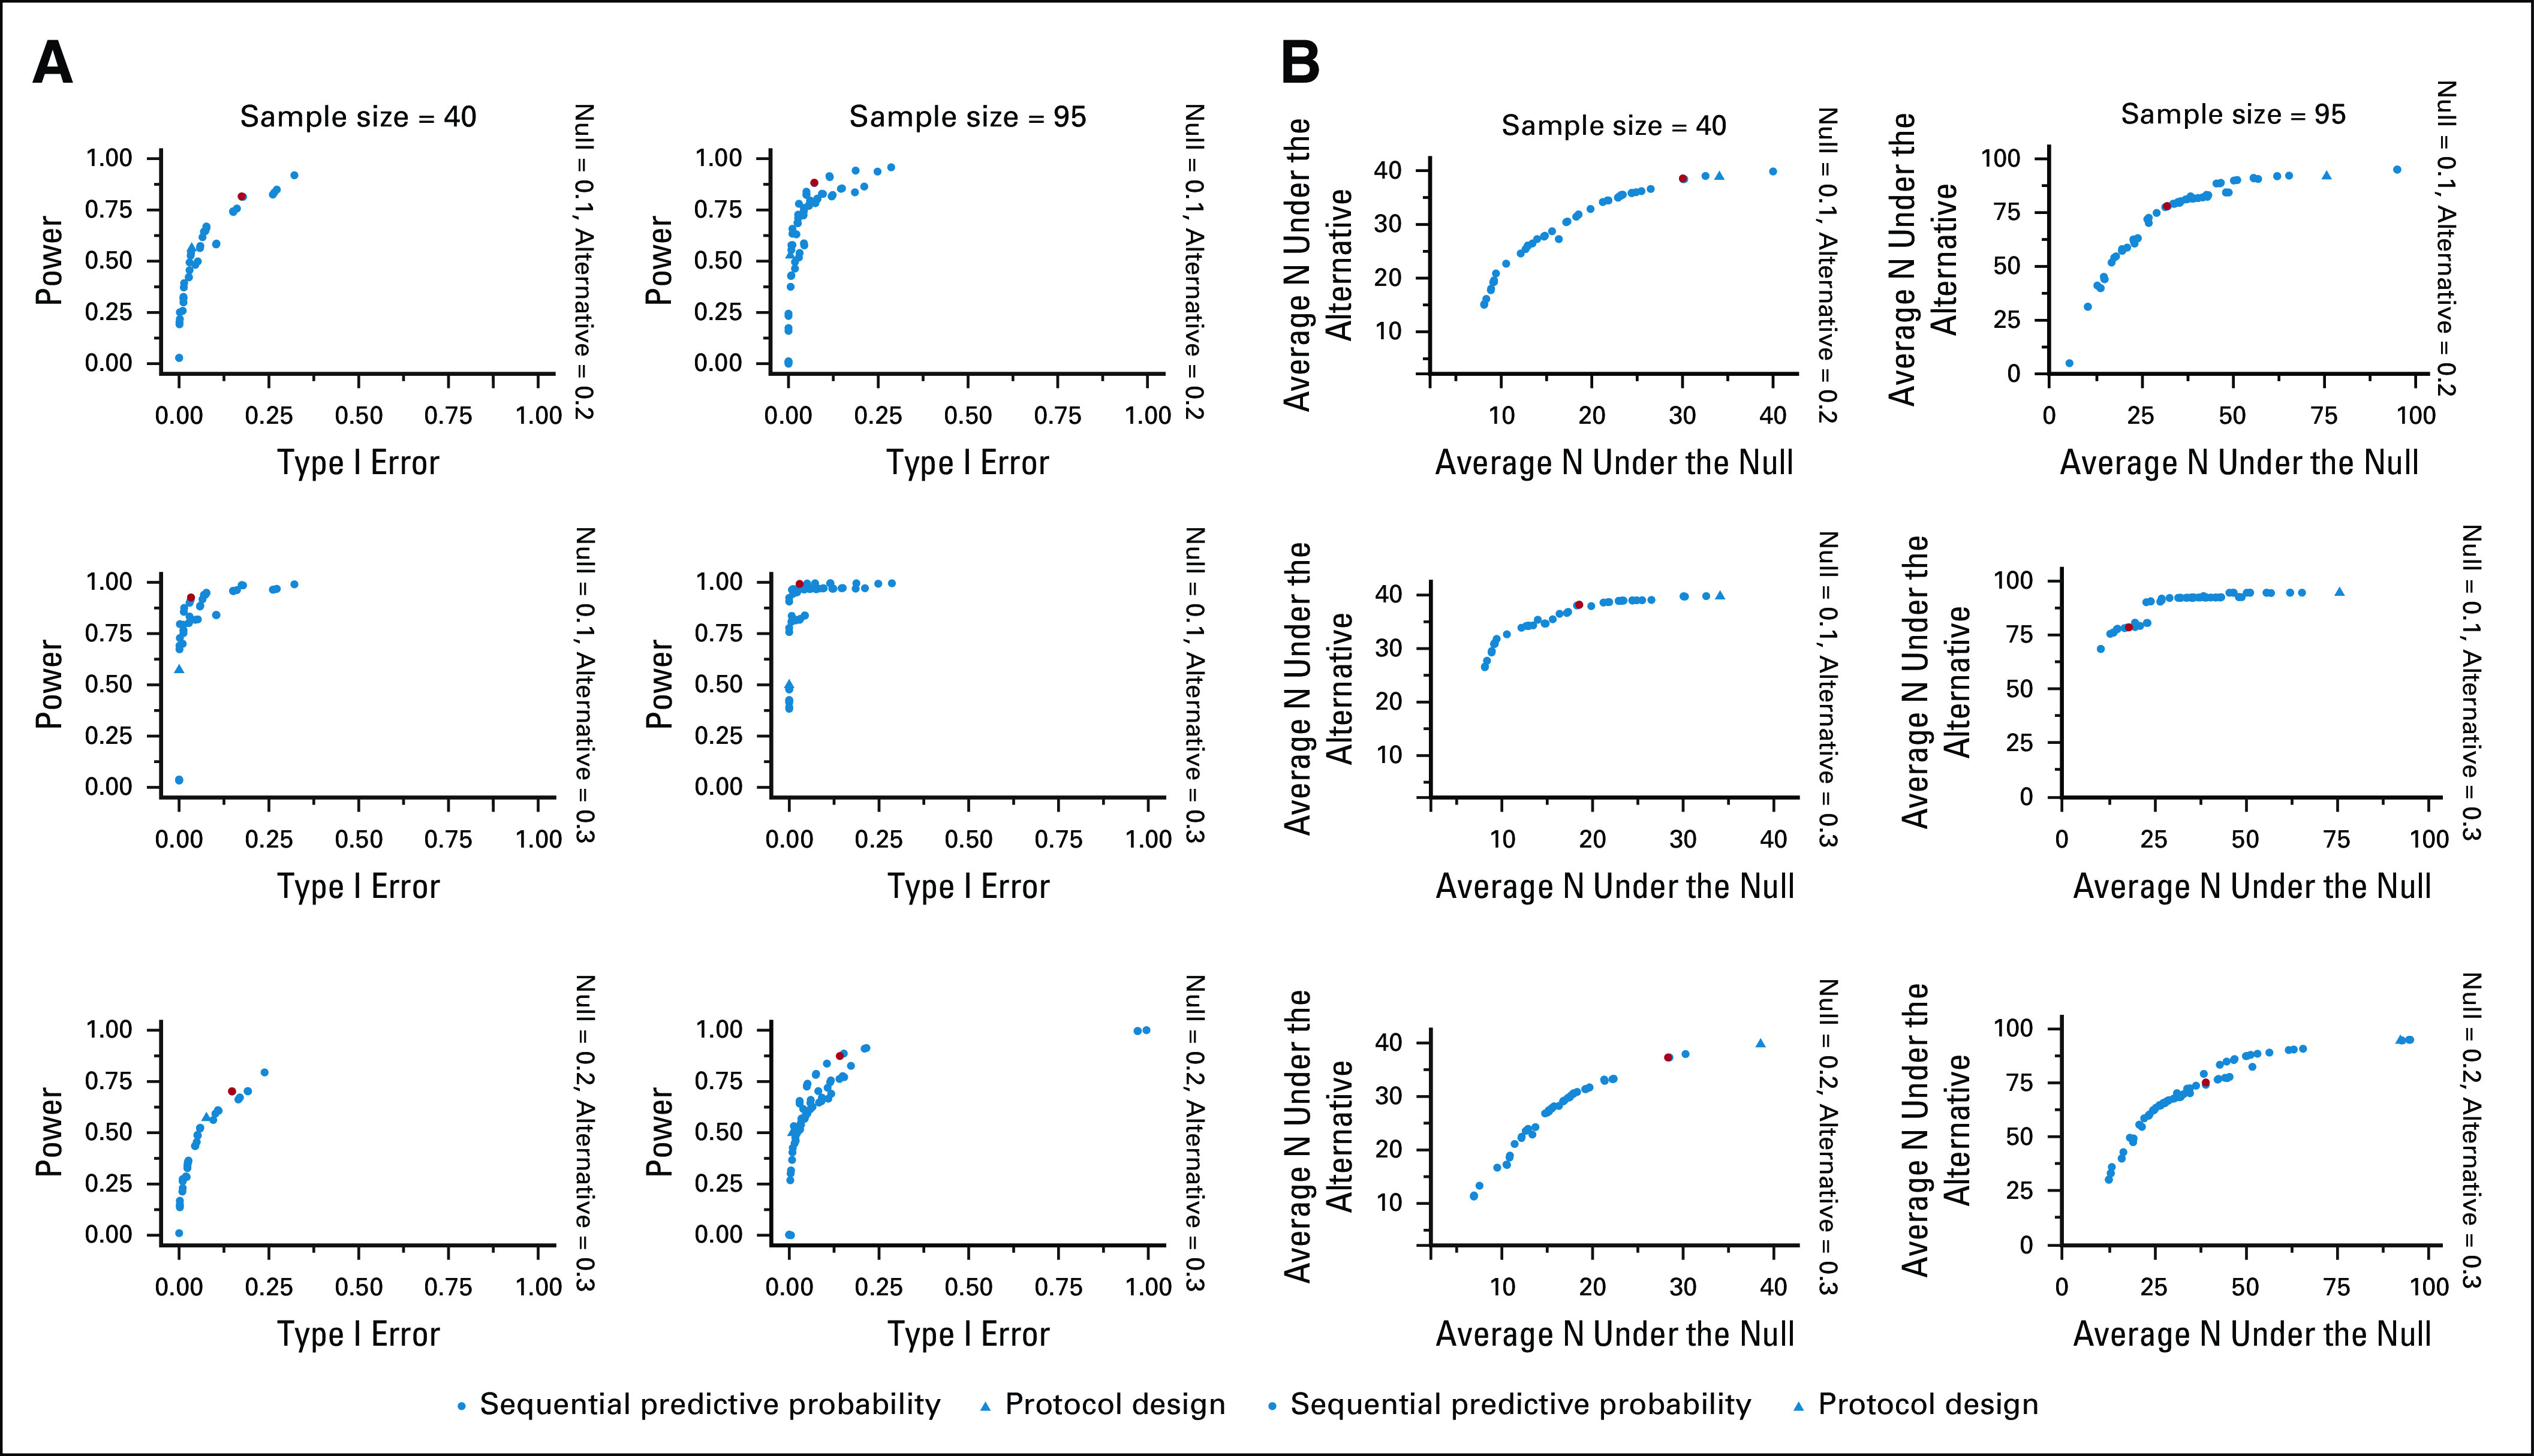
(A) Optimal atezolizumab expansion cohort redesigns for metastatic urothelial carcinoma according to type I error and power. The red point indicates the optimal accuracy design. (B) Optimal atezolizumab expansion cohort redesigns for metastatic urothelial carcinoma according to the average sample size under the null and the average sample size under the alternative. The red point indicates the optimal efficiency design.
TABLE 3.
Operating Characteristics for Optimal Sequential Predictive Probability Designs Compared With the Protocol Design for the Redesign of the Expansion Cohort for Metastatic Urothelial Carcinoma Included in a Phase I Trial of Atezolizumab
DISCUSSION
Recent designs of phase I oncology trials have leveraged dose-expansion cohorts to enroll sample sizes that far exceed conventional practice, and often without a prespecified statistical justification. This article proposes an approach to selecting an optimal design on the basis of sequential predictive probability monitoring in the setting of a phase I dose-expansion trial. Criteria were derived to optimize either the accuracy or the efficiency of an expansion cohort design. After selecting an optimal design, a table of decision rules for interim monitoring can be obtained so that the trial may be conducted without the need for interim statistical computation. In comparison to a traditional Simon's two-stage minimax or optimal design, a Bayesian posterior probability monitoring design, and a design used in a real-world trial with a single interim look, an optimal sequential predictive probability design offered superior trial operating characteristics. The simulation studies conducted found that the OE design tended to have more desirable properties in terms of resource conservation, subject to constraints on type I error and power, compared with the OA design. The OE design allows investigators to preserve the limited financial resources that are available to conduct early-phase clinical trials and to maintain ethical standards by halting large dose-expansion cohorts early in the absence of promising efficacy results.
Accelerated approval was awarded to atezolizumab for patients with metastatic urothelial carcinoma in 2016 on the basis of results of a phase II trial.16 Although the phase III trial found a similar overall response rate to that in the phase II trial for the atezolizumab arm, the response rate on control treatment was much higher than the historical control rate of 10% that had been used in the phase II trial.17 On the basis of the phase III trial results, the approval of atezolizumab for use in this patient population was voluntarily withdrawn by the sponsor. Similarly, durvalumab (NCT01693562) was approved for the treatment of stage IV urothelial cancer patients on the basis of an interim analysis in phase I/II study.18 In phase III study, no difference in overall survival was found in patients with high PD-L1 treated with durvalumab compared with those treated with standard chemotherapy,19 and approval for this patient population was voluntarily withdrawn. These two case studies underscore the importance of understanding the expected performance of biomarker-targeted subpopulations treated with standard-of-care therapies. Preventing future withdrawals may ultimately require the inclusion of contemporary controls in earlier phase trials, especially if they will be used as the basis for accelerated approval. The methods presented here can be easily extended to the context of randomized two-arm early-phase trial designs. Alternative designs include platform trials designed to share a common control8,20,21 and adaptive allocation schemes that enable efficient use of existing evidence.22,23
One limitation of the optimal sequential predictive probability designs is the non-negligible computational time needed to optimize over a grid of posterior and predictive thresholds. Thresholds should be selected with care to avoid using computational time examining thresholds that would not be clinically acceptable. Additionally, we have developed an R statistical software9 package that is freely available11 and comes with detailed user guides to allow for ease of implementation of this design.24 The package includes interactive graphics that make it straightforward to compare the resulting design options.
The methods presented here require prespecification of both the total sample size and the schedule of interim analyses. For designs like Simon's two-stage, in the absence of having observed a sufficient number of responses to proceed to the next stage, one may need to pause enrollment so that interim decision rules can be applied. Although pauses are not explicitly required for Bayesian designs on the basis of thresholds of predictive probability, to strictly adhere to the design's calibrated type I error rate, predictive probability designs should follow the prespecified analysis schedule. Enrollment pauses may be needed in the event of rapid patient accrual.
APPENDIX 1. MATHEMATICAL DETAILS
Consider the setting of a binary outcome, where each patient, denoted by , enrolled in the trial either has the outcome such that or does not have the outcome such that . Then, represents the number of responses out of n currently observed patients up to a maximum of N total patients. Let p represent the probability of response, where p0 represents the null response rate under no treatment or the standard-of-care treatment and p1 represents the alternative response rate under the experimental treatment. Most dose-expansion studies with an efficacy aim will wish to test the null hypothesis versus the alternative hypothesis .
Here, the prior distribution of the response rate has a beta distribution and our data have a binomial distribution . Combining the likelihood function for the observed data with the prior, we obtain the posterior distribution of the response rate, which follows the beta distribution . Using the posterior probability, which represents the probability of success based only on the data accrued so far, we would declare a treatment efficacious if , where represents a prespecified posterior decision threshold. The posterior predictive distribution of the number of future responses in the remaining future patients follows a beta-binomial distribution . Then, the PPP is calculated as . The PPP represents the probability that the treatment will be declared efficacious at the end of the trial when full enrollment is reached. We would stop the trial early for futility if the posterior predictive probability dropped below a prespecified threshold , that is, .
Elizabeth Garrett-Mayer
Consulting or Advisory Role: Deciphera
Brian P. Hobbs
Stock and Other Ownership Interests: Presagia
Consulting or Advisory Role: STCube Pharmaceuticals Inc, Bayer
Research Funding: Amgen
(OPTIONAL) Uncompensated Relationships: Presagia
No other potential conflicts of interest were reported.
SUPPORT
Supported by K01 HL151754 (A.M.K.).
AUTHOR CONTRIBUTIONS
Conception and design: Emily C. Zabor, Alexander M. Kaizer, Brian P. Hobbs
Data analysis and interpretation: All authors
Manuscript writing: All authors
Final approval of manuscript: All authors
Accountable for all aspects of the work: All authors
AUTHORS' DISCLOSURES OF POTENTIAL CONFLICTS OF INTEREST
The following represents disclosure information provided by authors of this manuscript. All relationships are considered compensated unless otherwise noted. Relationships are self-held unless noted. I = Immediate Family Member, Inst = My Institution. Relationships may not relate to the subject matter of this manuscript. For more information about ASCO's conflict of interest policy, please refer to www.asco.org/rwc or ascopubs.org/po/author-center.
Open Payments is a public database containing information reported by companies about payments made to US-licensed physicians (Open Payments).
Elizabeth Garrett-Mayer
Consulting or Advisory Role: Deciphera
Brian P. Hobbs
Stock and Other Ownership Interests: Presagia
Consulting or Advisory Role: STCube Pharmaceuticals Inc, Bayer
Research Funding: Amgen
(OPTIONAL) Uncompensated Relationships: Presagia
No other potential conflicts of interest were reported.
REFERENCES
- 1.Manji A, Brana I, Amir E, et al. : Evolution of clinical trial design in early drug development: Systematic review of expansion cohort use in single-agent phase I cancer trials. J Clin Oncol 31:4260-4267, 2013 [DOI] [PubMed] [Google Scholar]
- 2.Bugano DDG, Hess K, Jardim DLF, et al. : Use of expansion cohorts in phase I trials and probability of success in phase II for 381 anticancer drugs. Clin Cancer Res 23:4020-4026, 2017 [DOI] [PMC free article] [PubMed] [Google Scholar]
- 3.Khoja L, Butler MO, Kang SP, et al. : Pembrolizumab. J Immunother Cancer 3:36, 2015 [DOI] [PMC free article] [PubMed] [Google Scholar]
- 4.Simon R: Optimal two-stage designs for phase II clinical trials. Control Clin Trials 10:1-10, 1989 [DOI] [PubMed] [Google Scholar]
- 5.Dmitrienko A, Wang MD: Bayesian predictive approach to interim monitoring in clinical trials. Stat Med 25:2178-2195, 2006 [DOI] [PubMed] [Google Scholar]
- 6.Saville BR, Connor JT, Ayers GD, et al. : The utility of Bayesian predictive probabilities for interim monitoring of clinical trials. Clin Trials 11:485-493, 2014 [DOI] [PMC free article] [PubMed] [Google Scholar]
- 7.Lee JJ, Liu DD: A predictive probability design for phase II cancer clinical trials. Clin Trials 5:93-106, 2008 [DOI] [PMC free article] [PubMed] [Google Scholar]
- 8.Hobbs BP, Chen N, Lee JJ: Controlled multi-arm platform design using predictive probability. Stat Methods Med Res 27:65-78, 2018 [DOI] [PMC free article] [PubMed] [Google Scholar]
- 9.R Core Team : R: A Language and Environment for Statistical Computing. Vienna, Austria, R Foundation for Statistical Computing, 2020 [Google Scholar]
- 10.Seshan VE: clinfun: Clinical Trial Design and Data Analysis Functions (R Package Version 1.0.15), 2018 [Google Scholar]
- 11.Sequential posterior probability monitoring for clinical trial. https://github.com/zabore/ppseq
- 12.Thall PF, Simon RM, Estey EH: Bayesian sequential monitoring designs for single-arm clinical trials with multiple outcomes. Stat Med 14:357-379, 1995 [DOI] [PubMed] [Google Scholar]
- 13.Multc Lean. https://biostatistics.mdanderson.org/SoftwareDownload/SingleSoftware/Index/12, 2021
- 14.Petrylak DP, Powles T, Bellmunt J, et al. : Atezolizumab (MPDL3280A) monotherapy for patients with metastatic urothelial cancer: Long-term outcomes from a phase 1 study. JAMA Oncol 4:537-544, 2018 [DOI] [PMC free article] [PubMed] [Google Scholar]
- 15.Powles T, Eder JP, Fine GD, et al. : MPDL3280A (anti-PD-L1) treatment leads to clinical activity in metastatic bladder cancer. Nature 515:558-562, 2014 [DOI] [PubMed] [Google Scholar]
- 16.Rosenberg JE, Hoffman-Censits J, Powles T, et al. : Atezolizumab in patients with locally advanced and metastatic urothelial carcinoma who have progressed following treatment with platinum-based chemotherapy: A single-arm, multicentre, phase 2 trial. Lancet 387:1909-1920, 2016 [DOI] [PMC free article] [PubMed] [Google Scholar]
- 17.Powles T, Durán I, van der Heijden MS, et al. : Atezolizumab versus chemotherapy in patients with platinum-treated locally advanced or metastatic urothelial carcinoma (IMvigor211): A multicentre, open-label, phase 3 randomised controlled trial. Lancet 391:748-757, 2018 [DOI] [PubMed] [Google Scholar]
- 18.Powles T, O'Donnell PH, Massard C, et al. : Efficacy and safety of durvalumab in locally advanced or metastatic urothelial carcinoma: Updated results from a phase 1/2 open-label study. JAMA Oncol 3:e172411, 2017 [DOI] [PMC free article] [PubMed] [Google Scholar]
- 19.Powles T, van der Heijden MS, Castellano D, et al. : Durvalumab alone and durvalumab plus tremelimumab versus chemotherapy in previously untreated patients with unresectable, locally advanced or metastatic urothelial carcinoma (DANUBE): A randomised, open-label, multicentre, phase 3 trial. Lancet Oncol 21:1574-1588, 2020 [DOI] [PubMed] [Google Scholar]
- 20.Kaizer AM, Hobbs BP, Koopmeiners JS: A multi-source adaptive platform design for testing sequential combinatorial therapeutic strategies. Biometrics 74:1082-1094, 2018 [DOI] [PMC free article] [PubMed] [Google Scholar]
- 21.Meyer EL, Mesenbrink P, Dunger-Baldauf C, et al. : The evolution of master protocol clinical trial designs: A systematic literature review. Clin Ther 42:1330-1360, 2020 [DOI] [PubMed] [Google Scholar]
- 22.Chen N, Carlin BP, Hobbs BP: Web-based statistical tools for the analysis and design of clinical trials that incorporate historical controls. Comput Stat Data Anal 127:50-68, 2018 [Google Scholar]
- 23.Hobbs BP, Carlin BP, Sargent DJ: Adaptive adjustment of the randomization ratio using historical control data. Clin Trials 10:430-440, 2013 [DOI] [PMC free article] [PubMed] [Google Scholar]
- 24.http://www.emilyzabor.com/ppseq/articles/


