Abstract
Y2O3 doped ZrO2 (YSZ) ceramic material is used to protect alloy components worked in high-temperature. But its phase transformation between tetragonal phase and monoclinic phase occurred at 1150 °C leads to YSZ invalid. Therefore, enhancing the phase stability of YSZ is necessary for meeting the demands of the development of thermal barrier coatings (TBC). In this study, X-ray diffraction and Raman spectra were used to explore the phase stability and phase transformation of Yb2O3 and Y2O3 co-doped ZrO2 (YbYSZ) ceramics after heat treatment at 1300 °C with different times. The stability of tetragonal phase is improved by tetragonality decreasing with Yb3+ doped. Simultaneously, the incorporation of Yb3+ leads to O–O coupling, which is beneficial for increasing the concentration of oxygen vacancies near the substituted ions, thereby improving the stability of the crystal. The 6.5YbYSZ ceramic has the best stability after heat treatment at 1300 °C for different times.
Subject terms: Materials science, Aerospace engineering
Introduction
More efficient engineering components for applications in the energy, automotive, aerospace, electronics, and power industries are desired in the current competitive world economy. Thermal barrier coatings (TBCs) are usually used to protect those components that operate in high-temperature, corrosion, or other harsh environments1,2. TBCs are composed of two important layers: metal bond coat and ceramic top coat. Metal bond coat always uses MCrAlY (M = Ni, Co, Ni + Co, etc.) alloy to protect the components from oxidation and corrosion, while ceramic top coat acts as an insulator3,4. Being in direct contact with the harsh working environment, ceramic top-coat should have lower thermal diffusivity, better performance on phase stability and thermal shock resistance during thermal cycling, as well as better oxidation and corrosion resistance5,6. 6–8 wt% Y2O3 partially stabilized ZrO2 (YSZ) as the most promising choice of ceramic top coat shows outstanding comprehensive performance in thermal conductivity, phase stability, and other aspects5,7,8. However, when the operating ambient temperature exceeds 1200 °C, the tetragonal (t) phase transforms to the monoclinic (m) phase, which is accompanied by a volume expansion of 3–5%, leading to detrimental cracks in coatings9,10. Moreover, at high temperatures (exceeds 1200 °C), the pores inside the YSZ coatings undergo shrinkage, particularly those perpendicular to the heat flow, thus resulting in a significant increase in the thermal conductivity of TBCs11–14.
Therefore, the research and development of lower thermal conductivity and more stable top coat ceramic materials at high temperatures are urgently needed for the development of new-generation gas turbines. Numerous studies have shown that doping rare earth oxides (RE2O3) with different atomic masses or radii into YSZ systems is an effective method for improving thermal insulation performance and high-temperature phase stability15–19. Stecura et al.20 explored the thermal cycle life of Yb2O3-stabilized ZrO2 system at 1120 °C and found that the thermal cycle failure modes of Yb2O3-ZrO2 and Y2O3-ZrO2 were similar, but the thermal cycle life of Yb2O3-ZrO2 was significantly better than that of YSZ. By comparing the phase stability of Yb2O3 and Y2O3 co-stabilized ZrO2 at 1450 °C, Caireny et al.21 found that the addition of Yb could efficiently improve the phase stability. Jing et al.22 studied 3–10 mol% Yb2O3-stabilized ZrO2 ceramics and found that the ceramics consisted with the metastable tetragonal phase (t′) and had lower thermal conductivity. Leilei et al.23 systematically studied the effects of Yb2O3 and Y2O3 co-doped in ZrO2 on the phase stability and thermal conductivity. Their results showed that co-doped ZrO2 had better phase stability and lower thermal conductivity than those of Yb2O3- or Y2O3-doped ZrO2 ceramics. Lei and his colleagues16,24,25 prepared 1 mol% RE2O3 (RE = La, Nd, Gd) and 1 mol% Yb2O3–co-doped YSZ (1RE1Yb–YSZ) ceramics and 3.5 mol% RESZ (RE = Dy, Y, Er, Yb) ceramics by a chemical co-precipitation method. They found that all the prepared ceramics were composed of t′ phase. The phase stability and thermal conductivity of 1RE1Yb–YSZ decreased with the increase of RE3+ ion radius, whereas the fracture toughness of 3.5 mol% RESZ showed the opposite trend. In addition, the corrosion resistance of a GdYb-YSZ ceramic was better than that of YSZ.
This study is based on the better performance of YbYSZ system. X-ray diffraction and Raman spectra are used to explore the phase composition and phase transformation of ceramic samples heat-treated at 1300 °C for different times.
Experimental procedure
Material preparation
x mol% YbO1.5 − (8.5-x) mol% YO1.5 − ZrO2 (x = 0, 2.5, 4.5, 6.5, and 8.5, denoted as xYbYSZ) ceramics were prepared by a solid-state reaction method. Y2O3, Yb2O3, and ZrO2 (99.9%, Zhongnuo New Material Technology Co. Ltd.) were used as raw materials. All oxide powders were calcined at 800 °C for 5 h to eliminate the influence of absorbed water before mixed. Then, the oxides weighed with stoichiometric ratios were milled by two steps. First step was to mix-up all raw materials and pulverize the oxides to micron scale by ball milling. The second step was to further refine the precursor mixed oxide slurry, which was milled in a high-energy ball mill at 2300 rpm, 2500 rpm, and 2700 rpm for 3 h respectively to obtain a nanoscale mixture. The slurry after two grinding steps was completely dried at 80 °C and then sintered at 1450 °C for 3 h to obtain the initial ceramic samples.
Experiment of heat treatment
All initial ceramic samples were heat-treated in a muffle furnace at 1300 °C for 9, 33, 93, 143, 208, 287 and 358 h and then cooled to room temperature at a rate of 10°/min.
Structural characterization and analysis
X-ray diffraction (XRD, Rigaku Smart Lab II, Japan) and Raman spectroscopy (Raman, Horiba, Japan) were used to identify the phase composition and structure of initial ceramic samples and heat-treated ceramic samples. The XRD scans from 20° to 80° at a scan rate of 5°/min with Cu Kα radiation (λ = 0.15418 nm). The Raman scans from 100/60 cm−1 to 800 cm−1 with a green laser (532 nm).
Results and discussion
Phase composition and structure of initial ceramic samples
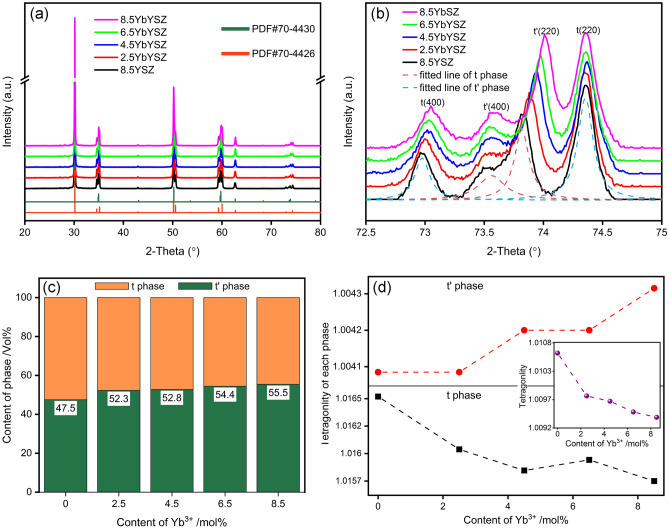
The XRD patterns of xYbYSZ (x = 0, 2.5, 4.5, 6.5, and 8.5) ceramics are presented in Fig. 1. As shown in Fig. 1a, the diffraction peaks correspond to two different tetragonal-related PDF cards (PDF Nos. 70-4426 and 70-4430). The PDF cards can be defined as metastable (PDF#4430, t′) and stable (PDF#4426, t) tetragonal zirconia phase due to the difference in lattice parameters26,27. Therefore, the XRD patterns suggest that Yb3+ and Y3+ have completely dissolved into ZrO2 lattice and formed t and t′ phases. In addition, the positions of the diffraction peaks shift to high angles with the content of Yb3+ increasing (Fig. 1b), which means cell shrinkage. To further investigate the effect of Yb and Y co-doped on phase composition and crystal structure, GSAS software was applied to refine the XRD patterns28,29. By comparing the phase content of t phase and t′ phase shown in Fig. 1c, the content of t′ phase increased from 47.5 to 55.5% with the increase of Yb3+. The increase of t′ phase is beneficial for improving phase stability of ceramics. Figure 1d displays the tetragonality of t and t′ phase, it can be found that the tetragonality of t and t′ phase showed an opposite trend with the increase of Yb3+, and the addition of Yb3+ has a greater influence on the tetragonality of t phase. The reduction of tetragonality of t phase is beneficial to inhibit the phase transition from the t phase to the m-phase.
Figure 1.
XRD patterns of xYbYSZ (x = 0, 2.5, 4.5, 6.5, and 8.5): (a) 2θ = 20°–80° at a scan rate of 5°/min, (b) 2θ = 72.5°–75° at a scan rate of 1°/min; (c) phase content and (d) tetragonality of t phase and t’ phase.
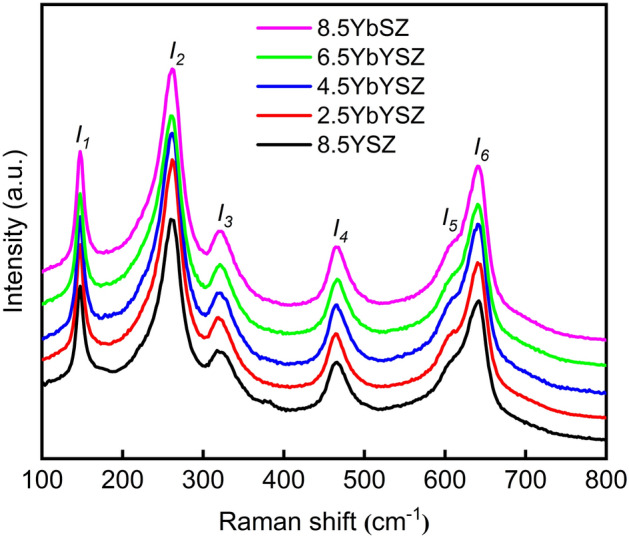
Raman spectra is sensitive to chemical bonds and other short-range ordered structures in the crystal30. Therefore, Raman spectra of xYbYSZ (x = 0, 2.5, 4.5, 6.5, and 8.5) ceramics showed in Fig. 2 is used to analyze the lattice distortion of samples. Raman spectra of all ceramic samples consist of six vibration modes related with tetragonal phase and metastable tetragonal phase, and no monoclinic phase was detected26,31,32. Table 1 displays Raman shift of all ceramics. The incorporation of Yb3+ has a greater effect on Raman shift of I5, and the coexistence of Yb3+ and Y3+ ceramic samples have much lower Raman shift. I5 is related with chemical bond vibration mode of O–O coupling. Therefore, the xYbYSZ (x = 2.5, 4.5 and 6.5) ceramics samples are easier to form larger-scale defect clusters, which can improve the resistance of phase transformation controlled by diffusion.
Figure 2.

Raman spectra of xYbYSZ (x = 0, 2.5, 4.5, 6.5, and 8.5) ceramics.
Table 1.
Raman shift of xYbYSZ (x = 0, 2.5, 4.5, 6.5, and 8.5) ceramic samples.
| Samples | Raman shift (cm−1) | |||||
|---|---|---|---|---|---|---|
| I1 | I2 | I3 | I4 | I5 | I6 | |
| 8.5YSZ | 147 | 260 | 325 | 467 | 620 | 642 |
| 2.5YbYSZ | 147 | 260 | 325 | 467 | 618 | 642 |
| 4.5YbYSZ | 147 | 259 | 324 | 467 | 617 | 642 |
| 6.5YbYSZ | 147 | 259 | 324 | 465 | 613 | 642 |
| 8.5YbSZ | 147 | 260 | 325 | 467 | 619 | 642 |
Phase composition of xYbYSZ (x = 0, 2.5, 4.5, 6.5, and 8.5) after heat treatment for different times
Figure 3 represents the variation of XRD patterns and Raman spectra of 8.5YSZ ceramics after heat-treated with 33, 93, 143, 208, 278 and 358 h. According to Fig. 3a, the intensities of m(− 111) and m(111) peaks increased dramatically after heat treatment for 143–208 h. Furthermore, after heat treatment for 208 h, the characteristic peaks of t and t′ phases of the tetragonal phase were hardly observed (see Fig. 3b). According to the phase diagram of Y2O3-ZrO233, 8.5YSZ was located in the coexisting phase region of the t and c phases. Therefore, the metastable t′ phase is decomposed to the equilibrium t and c phases, and then the t phase transforms to the m phase when the ceramics were heat-treated for a long time. The Raman spectra shown in Fig. 3c further displays that the relative peaks of m phase are appeared with the passage of heat treatment time.
Figure 3.
XRD patterns (a) 2θ = 27.5°–32.5°, (b) 2θ = 72.5°–75.5°, and (c) Raman spectra of 8.5YSZ ceramics after heat treatment for different times.
According to the previous discussion on the influence of the coexistence of Yb3+ and Y3+ on the crystal, 6.5YbYSZ ceramic sample is special compared with other ceramic samples. Therefore, Fig. 4 exhibits the variation of XRD patterns and Raman spectra of 6.5YbYSZ ceramic sample after heat-treated different time. It can be seen from Fig. 4 that the changes of XRD patterns and Raman spectra of 6.5YbYSZ ceramic sample are the same as 8.5YSZ. Meanwhile, the characteristic peaks of t and t′ phases shown in Fig. 4 can also be observed after heat treatment for 358 h. Therefore, 6.5YbYSZ ceramic has better phase stability than 8.5YSZ. This result is consisting with above discussion about crystal.
Figure 4.
XRD patterns (a) 2θ = 27.5°–32.5°, (b) 2θ = 72.5°–75.5°, and (c) Raman spectra of 6.5YbYSZ ceramics after heat treatment for different times.
Variation of monoclinic phase composition of xYbYSZ (x = 0, 2.5, 4.5, 6.5, and 8.5) after heat treatment for different times
Monoclinic phase is an important factor to estimate the stability of YSZ ceramic materials. XRD is often used to detect the existence of m phase according to Garvie and Nicholson’s equation34,35:
| 1 |
where is the area of the diffraction peak related to the (hkl) crystal plane.
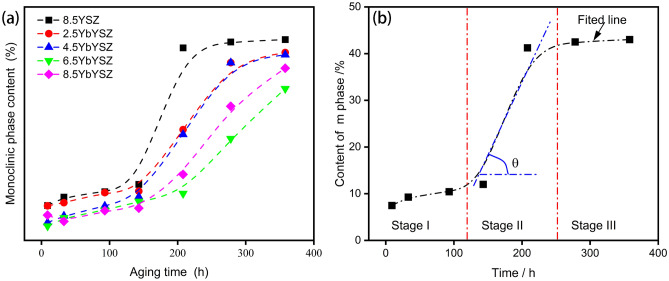
Figure 5 is the variation of monoclinic phase of xYbYSZ (x = 0, 2.5, 4.5, 6.5, and 8.5) ceramic samples after heat treatment at 1300 °C for 9, 33, 93, 143, 208, 278, and 358 h. It’s obvious seen that the addition of Yb3+ is beneficial for improving phase stability and 6.5YbYSZ ceramic sample has the best behavior. What’s more, the relationship between the content of the monoclinic phase and the heat-treated time presents an “S” curve. And the change of monoclinic phase content with different heat-treated time can be divided into three stages (as shown in Fig. 5b): (I) slow increase stage, (II) approximately linear increase stage, and (III) saturation stage. By comparing phase composition of xYbYSZ (x = 0, 2.5, 4.5, 6.5, and 8.5) ceramic samples after heat treatment for 33, 93, 143, 208, 278, and 358 h shown in Figs. 3 and 4, all ceramic samples have similarity transition process.
Figure 5.
The variation of m phase content of xYbYSZ ceramics (a) and fitted line of the m phase content of 8.5YSZ ceramic (b) after heat treatment at 1300 °C for 9, 33, 93, 143, 208, 278, and 358 h.
Therefore, monoclinic phase variation of 8.5YSZ ceramic sample was discussed to explore the formation reason of “S” curve. Comparing the XRD patterns of 8.5YSZ shown in Fig. 5b, Stage I was processed with two transition processes. One is the transition from t′ phase to t and c phase, and the other one is the transition from initial t phase to m phase. Therefore, Stage I is controlled by the stability of t′ phase and t phase. Therefore, the content of m phase in Stage I gradually increases with the prolongation of heat treatment time. The characteristic peaks of t′ phase vanished and c phase appeared. While in Stage II, the content of m phase sharply increases, and the characteristic peaks of t phase disappear. The characteristic peaks of c phase have little difference in this stage due to t′ phase exhausted in Stage I. Therefore, Stage II is major occurred transition from t phase to m phase, which belongs to martensitic transformation. In Stage III, all transformable phases are exhausted. The content of m phase gets maximized, and Stage III is almost horizontal.
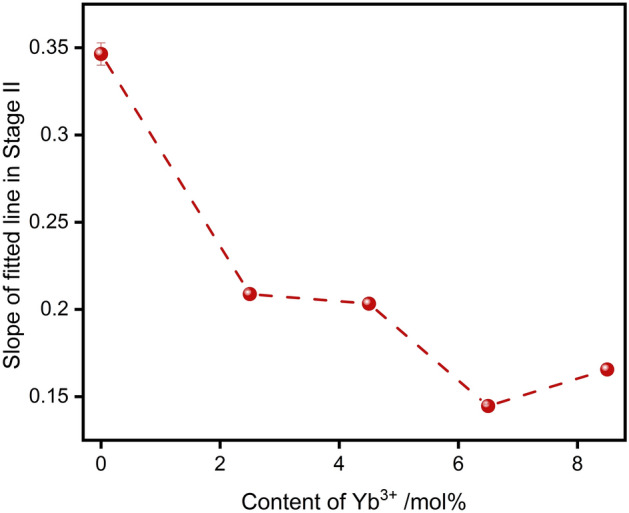
According to previous discussion about crystal structure, the incorporation of Yb3+ has effects on O–O coupling, which leads to form large-scale defect clusters difficult to move at high temperature. Meanwhile, the addition of Yb3+ is benefit for decreasing the tetragonality of initial t phase, which can improve the stability of t phase. The content of m phase in Stage I of xYbYSZ (x = 2.5, 4.5, 6.5, and 8.5) ceramic samples is lower than that of 8.5YSZ ceramic sample. And the duration of Stage I of xYbYSZ (x = 2.5, 4.5, 6.5, and 8.5) ceramic samples is longer than that of 8.5YSZ ceramic sample because of the formation of large-scale defect clusters. In Stage II, the content of the m phase transformed from t phase can be fitted as a line, and the slope of fitted line can reflect indirectly the transformability of t phase. As shown in Fig. 6, the slope of fitted line in Stage II is decrease with Yb3+ doped, and 6.5YbYSZ ceramic sample has the lowest slope. The transformable t phase comes from two sources, one is the initial t phase after sintered and the other comes from the transformation of t′ phase. The initial t phase of 6.5YbYSZ ceramic has better stability. Therefore, only the stability of the t-phase derived from the t′-phase transition needs to be discussed. The enhancement of O–O coupling in 6.5YbYSZ ceramics leads to the redistribution of oxygen vacancies in the crystal. Above all, 6.5YbYSZ has the best phase stability after heat treatment at 1300 °C.
Figure 6.

The slope of fitted line in Stage II.
Conclusions
YbxY0.085-xZr0.915O2-1.5x (x = 0, 0.025, 0.045, 0.065, and 0.085) ceramics were prepared using a solid-state reaction method. The content of t′ phase and the tetragonality of t′ phase increase with Yb3+ incorporation. What’s more, the addition of Yb3+ is good for enhancing O–O coupling, which leads to formation of large-scale defect clusters.
After the xYbYSZ (x = 0, 2.5, 4.5, 6.5, and 8.5) ceramic samples were heat-treated at 1300 °C for 33, 93, 143, 208, 278 and 358 h, the phase stability of the coexisting Yb3+ and Y3+ ceramic samples was better, and the m phase change showed an "S"-shaped curve. The “S” curve can be divided into three stages.
The decrease of tetragonality of t phase and O–O coupling was beneficial for improving the phase stability. 6.5YbYSZ ceramic showed the best stability performance after heat treatment at 1300 °C.
Acknowledgements
This work was supported by the National High Technology Research and Development Program of China (Grant No. 2015AA034403) and the National Nature Science Foundation of China (Grant No. 51762036).
Author contributions
C.Z. conceived, designed, and analyzed the work and wrote the manuscript. S.A. and X.S. helped with the revision and editing. All authors reviewed the manuscript.
Funding
Funding was provided by National High Technology Research and Development Program of China (Grant No. 2015AA034403), National Natural Science Foundation of China (Grant No. 51762036).
Data availability
All data generated or analyzed during this study are included in this published article, and the datasets used and analyzed during the current study are available from the corresponding author on reasonable request.
Competing interests
The authors declare no competing interests.
Footnotes
Publisher's note
Springer Nature remains neutral with regard to jurisdictional claims in published maps and institutional affiliations.
References
- 1.Mondal K, Nuñez L, Downey CM, Van Rooyen IJ. Thermal barrier coatings overview: Design, manufacturing, and applications in high-temperature industries. Ind. Eng. Chem. Res. 2021;60(17):6061. doi: 10.1021/acs.iecr.1c00788. [DOI] [Google Scholar]
- 2.Mondal K, Nuñez L, Downey CM, van Rooyen IJ. Recent advances in the thermal barrier coatings for extreme environments. Mater. Sci. Energy. Technol. 2021;4:208. doi: 10.1016/j.mset.2021.06.006. [DOI] [Google Scholar]
- 3.Wu S, Zhao Y, Li W, Liu W, Wu Y, Liu F. Research progresses on ceramic materials of thermal barrier coatings on gas turbine. Coatings. 2021;11(1):1. doi: 10.3390/coatings11010079. [DOI] [Google Scholar]
- 4.Chellaganesh D, Khan MA, Jappes JTW. Thermal barrier coatings for high temperature applications—A short review. Mater. Today Proc. 2021;45:1529. doi: 10.1016/j.matpr.2020.08.017. [DOI] [Google Scholar]
- 5.Cao X, Vassen R, Stoever D. Ceramic materials for thermal barrier coatings. J. Eur. Ceram. Soc. 2004;24:1. doi: 10.1016/S0955-2219(03)00129-8. [DOI] [Google Scholar]
- 6.Clarke DR, Levi CG. Materials design for the next generation thermal barrier coatings. Annu. Rev. Mater. Res. 2003;33:383. doi: 10.1146/annurev.matsci.33.011403.113718. [DOI] [Google Scholar]
- 7.Vaßen R, Jarligo MO, Steinke T, Mack DE, Stöver D. Overview on advanced thermal barrier coatings. Surf. Coat. Technol. 2010;205(4):938. doi: 10.1016/j.surfcoat.2010.08.151. [DOI] [Google Scholar]
- 8.Clarke DR, Oechsner M, Padture NP. Thermal-barrier coatings for more efficient gas-turbine engines. Mrs. Bull. 2012;37(10):891. doi: 10.1557/mrs.2012.232. [DOI] [Google Scholar]
- 9.Di Girolamo G, Blasi C, Brentari A, Schioppa M. Microstructural, mechanical and thermal characteristics of zirconia-based thermal barrier coatings deposited by plasma spraying. Ceram. Int. 2015;41:11776. doi: 10.1016/j.ceramint.2015.05.145. [DOI] [Google Scholar]
- 10.Mamivand M, Zaeem MA, El Kadiri H, Chen LQ. Phase field modeling of the tetragonal-to-monoclinic phase transformation in zirconia. Acta Mater. 2013;61(14):5223. doi: 10.1016/j.actamat.2013.05.015. [DOI] [Google Scholar]
- 11.Yi H, Che J, Liang G, Liu X. Effect of rare earth elements on stability and sintering resistance of tetragonal zirconia for advanced thermal barrier coatings. Curr. Comput.-Aided Drug Des. 2021;11(3):287. doi: 10.3390/cryst11030287. [DOI] [Google Scholar]
- 12.Li G, Xie H, Yang G, Liu G, Li C, Li C. A comprehensive sintering mechanism for TBCs-Part I: An overall evolution with two-stage kinetics. J. Am. Ceram. Soc. 2017;100:2176. doi: 10.1111/jace.14784. [DOI] [Google Scholar]
- 13.Li G, Xie H, Yang G, Liu G, Li C, Li C. A comprehensive sintering mechanism for TBCs-Part II: Multiscale multipoint interconnection-enhanced initial kinetics. J. Am. Ceram. Soc. 2017;100:4240. doi: 10.1111/jace.14940. [DOI] [Google Scholar]
- 14.Che J, Wang X, Liu X, Liang G, Zhang S. Outstanding sintering resistance in pyrochlore-type La2(Zr0.7Ce0.3)2O7 for thermal barrier coatings material. Ceram. Int. 2021;47(5):6996. doi: 10.1016/j.ceramint.2020.11.050. [DOI] [Google Scholar]
- 15.Li Q, Cui X, Li S, Yang W, Wang C, Cao Q. Synthesis and phase stability of scandia, gadolinia, and ytterbia co-doped zirconia for thermal barrier coating application. J. Therm. Spray. Technol. 2014;24(1–2):136. doi: 10.1007/s11666-014-0158-2. [DOI] [Google Scholar]
- 16.Guo L, Li M, Ye F. Phase stability and thermal conductivity of RE2O3 (RE=La, Nd, Gd, Yb) and Yb2O3 co-doped Y2O3 stabilized ZrO2 ceramics. Ceram. Int. 2016;42(6):7360. doi: 10.1016/j.ceramint.2016.01.138. [DOI] [Google Scholar]
- 17.Khor KA, Yang J. Transformability of t-ZrO2 and lattice parameters in plasma sprayed rare-earth oxides stabilized zirconia coatings. Scripta Mater. 1997;37(9):1279. doi: 10.1016/S1359-6462(97)00262-5. [DOI] [Google Scholar]
- 18.Zhu D, Nesbitt JA, Barrett CA, Mccue TR, Miller RA. Furnace cyclic oxidation behavior of multicomponent low conductivity thermal barrier coatings. J. Therm. Spray Technol. 2004;13(1):84. doi: 10.1361/10599630418185. [DOI] [Google Scholar]
- 19.Sun L, Guo H, Peng H, Gong S, Xu H. Influence of partial substitution of Sc2O3 with Gd2O3 on the phase stability and thermal conductivity of Sc2O3-doped ZrO2. Ceram. Int. 2013;39(3):3447. doi: 10.1016/j.ceramint.2012.09.100. [DOI] [Google Scholar]
- 20.Stecura S. New ZrO2-Yb2O3 plasma-sprayed coatings for thermal barrier applications. Thin Solid Films. 1987;150(1):15. doi: 10.1016/0040-6090(87)90305-1. [DOI] [Google Scholar]
- 21.Cairney JM, Rebollo NR, Rühle M, Levi CG. Phase stability of thermal barrier oxides: A comparative study of Y and Yb additions. Z. Metallkd/Mater. Res. Adv. Tech. 2007;98(12):1177. doi: 10.3139/146.101595. [DOI] [Google Scholar]
- 22.Feng J, Ren X, Wang X, Zhou R, Pan W. Thermal conductivity of ytterbia-stabilized zirconia. Scripta Mater. 2012;66(1):41. doi: 10.1016/j.scriptamat.2011.09.038. [DOI] [Google Scholar]
- 23.Sun L, Guo H, Peng H, Gong S, Xu H. Phase stability and thermal conductivity of ytterbia and yttria co-doped zirconia. Prog. Nat. Sci. 2013;23(4):440. doi: 10.1016/j.pnsc.2013.06.013. [DOI] [Google Scholar]
- 24.Guo L, Zhang C, Li M, Sun W, Zhang Z, Ye F. Hot corrosion evaluation of Gd2O3-Yb2O3 co-doped Y2O3 stabilized ZrO2 thermal barrier oxides exposed to Na2SO4+V2O5 molten salt. Ceram. Int. 2017;43(2):2780. doi: 10.1016/j.ceramint.2016.11.109. [DOI] [Google Scholar]
- 25.Guo L, Li M, Zhang C, Huang X, Ye F. Dy2O3 stabilized ZrO2 as a toughengin agent for Gd2Zr2O7 ceramic. Mater. Lett. 2017;188:142. doi: 10.1016/j.matlet.2016.11.038. [DOI] [Google Scholar]
- 26.Bouvier P, Gupta HC, Lucazeau G. Zone center phonon frequencies in tetragonal zirconia: Lattice dynamical study and new assignment proposition. J. Phys. Chem. Solids. 2001;62(5):873. doi: 10.1016/S0022-3697(00)00243-2. [DOI] [Google Scholar]
- 27.Viazzi C, Bonino JP, Ansart F, Barnabé A. Structural study of metastable tetragonal YSZ powders produced via a sol-gel route. J. Alloy Compd. 2008;452(2):377. doi: 10.1016/j.jallcom.2006.10.155. [DOI] [Google Scholar]
- 28.Toby BH, Von Dreele RB. GSAS-II: The genesis of a modern open-source all purpose crystallography software package. J. Appl. Crystallogr. 2013;46(2):544. doi: 10.1107/S0021889813003531. [DOI] [Google Scholar]
- 29.Naumenko AP, Berezovska NI, Biliy MM, et al. Vibrational analysis and Raman spectra of tetragonal zirconia. Phys. Chem. Solid State. 2008;9(1):121. [Google Scholar]
- 30.Toby BH. EXPGUI, a graphical user interface for GSAS. J. Appl. Crystallogr. 2001;34(2):210. doi: 10.1107/S0021889801002242. [DOI] [Google Scholar]
- 31.Zyuzin DA, Cherepanova SV, Moroz EM, et al. X-ray, Raman and FTIRS studies of the microstructural evolution of zirconia particles caused by the thermal treatment. J. Solid State Chem. 2006;179(10):2965. doi: 10.1016/j.jssc.2006.04.057. [DOI] [Google Scholar]
- 32.Bouvier P, Lucazeau G. Raman spectra and vibrational analysis of nanometric tetragonal zirconia under high pressure. J. Phys. Chem. Solids. 2000;61(4):569. doi: 10.1016/S0022-3697(99)00242-5. [DOI] [Google Scholar]
- 33.Garvie RC, Nicholson PS. Phase analysis in zirconia systems. J. Am. Ceram. Soc. 1972;55(6):303. doi: 10.1111/j.1151-2916.1972.tb11290.x. [DOI] [Google Scholar]
- 34.Weng W, Wu W, Hou M, Liu T, Wang T, Yang H. Review of zirconia-based biomimetic scaffolds for bone tissue engineering. J. Mater. Sci. 2021;56(14):8309. doi: 10.1007/s10853-021-05824-2. [DOI] [Google Scholar]
- 35.Witz G, Shklover V, Steurer W, Bachegowda S, Bossmann HP. Phase evolution in yttria-stabilized zirconia thermal barrier coatings studied by rietveld refinement of X-ray powder diffraction patterns. J. Am. Ceram. Soc. 2007;90(9):2935. doi: 10.1111/j.1551-2916.2007.01785.x. [DOI] [Google Scholar]
Associated Data
This section collects any data citations, data availability statements, or supplementary materials included in this article.
Data Availability Statement
All data generated or analyzed during this study are included in this published article, and the datasets used and analyzed during the current study are available from the corresponding author on reasonable request.


