Abstract
Spatial and temporal variations in sediment microbial community structure in a eutrophic lake polluted with inorganic mercury were identified using polar lipid fatty acid (PLFA) analysis. Microbial community structure was strongly related to mercury methylation potential, sediment organic carbon content, and lake location. Pore water sulfate, total mercury concentrations, and organic matter C/N ratios showed no relationships with microbial community structure. Seasonal changes and changes potentially attributable to temperature regulation of bacterial membranes were detectable but were less important influences on sediment PLFA composition than were differences due to lake sampling location. Analysis of biomarker PLFAs characteristic of Desulfobacter and Desulfovibrio groups of sulfate-reducing bacteria suggests that Desulfobacter-like organisms are important mercury methylators in the sediments, especially in the Lower Arm of Clear Lake.
The mercury cycle is a complex biogeochemical system involving both biotic and abiotic transformations (48). The production of methylmercury (CH3Hg+) is of particular interest because methylmercury is more toxic and mobile than the precursor Hg2+ ion and because methylmercury bioaccumulates in food chains. Because mercury cannot be broken down to an innocuous by-product, remediation of mercury-contaminated sites is dependent upon gaining an understanding of the factors that make mercury bioavailable and mobile. Controls on mercury methylation in natural environments such as lakes are not well understood. Abiotic mercury methylation in natural environments appears to be of minor importance (1). In contrast, microbial mercury methylation has been shown to occur in a variety of marine, estuarine, and lacustrine environments. Microorganisms from diverse taxonomic groups have been shown to methylate mercury in laboratory studies (40). However, several previous studies have indicated that sulfate-reducing bacteria are the primary mercury methylators in freshwater and estuarine anoxic sediments (10, 11, 18, 19). Factors influencing microbial methylmercury production include microbial community composition, mercury availability, carbon availability, and the abundance of electron acceptors such as sulfate.
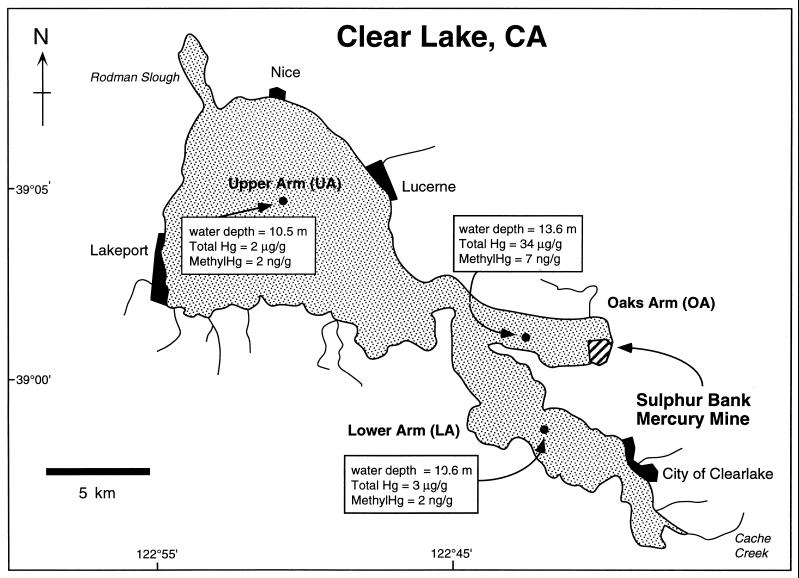
Clear Lake is a mercury-polluted, eutrophic lake located in the northern Coast Ranges, California (Fig. 1). Preliminary studies conducted at Clear Lake suggested that mercury methylation potential (methylation of added Hg2+) in the sediments is only partially attributable to sulfate-reducing bacteria (28). The current study focuses on identifying spatial and temporal variations in sediment microbial community structure and relationships between microbial community composition, mercury methylation potential, and other sediment characteristics in Clear Lake. In environments such as soils and sediments, high microbial diversity and the difficulty in culturing native organisms make culture-based methods inadequate or inefficient for differentiating microbial communities. Within such environments, lipid analysis has become an important ecological tool (4, 9, 16). We used polar lipid fatty acid (PLFA) analysis to describe microbial communities in Clear Lake in two distinct ways. First, we used sediment PLFA composition to identify spatial and temporal variation in sediment microbial communities within Clear Lake. Using multivariate statistical methods, we then tested relationships between PLFA composition and sediment characteristics (potential explanatory variables). These analyses indicate which measured environmental factors are the most important controls on microbial community structure and also identify relationships between microbial community structure and mercury methylation potential. Second, we quantified specific PLFA biomarkers as indicators of microbial groups. Because sulfate-reducing bacteria have been implicated in environmental mercury methylation in previous studies, we compiled a database of published information about the PLFA composition of sulfate-reducing bacteria to identify biomarkers for sulfate-reducing bacterial groups in Clear Lake sediments.
FIG. 1.
Map of Clear Lake. Sample locations are shown with water depths and sediment total mercury and methylmercury concentrations per gram (dry weight) of sediment (0 to 4 cm) (43). These concentrations represent typical total Hg and methylmercury distributions in the lake (see reference 41). The OA site is closest to the source of mercury contamination (Sulfur Bank Mine). The LA site is closest to the lake outlet and experiences the bulk of water movement through Clear Lake. The UA site is farthest from the Sulfur Bank Mine and receives the major stream inflows into the lake.
Our results show that mercury methylation potential, sediment organic carbon, and lake sample location are strongly related to changes in sediment microbial community structure. Based on analysis of PLFA biomarkers for sulfate-reducing bacterial groups, Desulfobacter species dominated sulfate reducer populations at all lake locations and also made up a greater portion of the microbial biomass at sites with higher mercury methylation potential.
MATERIALS AND METHODS
Sediment collection.
Sediment samples were collected in April and July of 1997. One sample location was chosen in each of three major arms of the lake (Fig. 1). Samples were collected from a boat with an Eckman dredge. In April, bulk surficial (0 to 4 cm) sediments were collected from three separate dredges per lake location. In July, a similar protocol was used, except that each dredge was subcored twice. The two subcores from each dredge were sectioned into 0- to 4- and 4- to 8-cm depth intervals and homogenized, resulting in one 0- to 4-cm and one 4- to 8-cm sample per dredge. Samples were transported on ice and were stored at 2°C until processed (<24 h).
C and N elemental analyses.
A portion of each sediment sample was freeze-dried, pulverized in a steel ball mill, and analyzed for total C and N using an elemental analyzer (Fisons NA 1500 Series 2).
Mercury methylation potential in sediment slurries.
Mercury methylation potential assays were carried out in anoxic sediment slurries made from sectioned cores. Sediments (0 to 4 cm) were slurried with surficial water from the Upper Arm (UA) site amended to 125 ppm of Hg2+ (as HgCl2) in the ratio of 1 part sediment to 2 parts (wt/vol) water and sparged with O2-free N2. One slurry made from each pair of sections was frozen immediately for an initial methylmercury measurement, and the other slurry was incubated at in situ temperature in the dark, static (unshaken), for 5 days. Incubations were ended by freezing the slurries. Sediment slurries were analyzed for methylmercury at Battelle Marine Science Laboratory (Sequim, Wash.) using the method of Bloom (2a). Extracts were derivatized with sodium tetraethyl borate to form volatile ethyl-mercury compounds, which were subsequently separated using gas chromatography and detected by cold vapor atomic fluorescence (2, 27).
Because inorganic Hg additions to the sediment slurries were roughly 4 to 60 times ambient levels, the resulting mercury methylation rates are considered “potential” rates representative of the activity of a stimulated population. The Hg amendments employed have been shown previously (E. E. Mack, unpublished data) to saturate methylation potential at the three study sites. The effect of added inorganic mercury on microbial community composition was tested by measuring sediment PLFA profiles before and after incubations (methods described below).
PLFA analyses.
Sediment samples were frozen (−80°C) within 24 h of collection, lyophilized, homogenized, and stored frozen (−20°C) until analysis. Triplicate (April 1997) or duplicate (July 1997) 1-g subsamples were extracted with a one-phase solvent extractant using a modification of the method of Bligh and Dyer (5). Polar lipids (including phospholipids) were separated from neutral lipids and glycolipids using solid-phase extraction columns (0.50 g of Si; Supelco, Inc., Bellefonte, Pa.). The polar lipid fraction was subjected to mild alkaline methanolysis, and the resulting fatty acid methyl esters (FAMEs) were extracted with two aliquots of hexane. The hexane was evaporated under N2 at room temperature, and FAMEs derived from polar lipids were redissolved in hexane containing an internal standard (19:0 FAME). Samples were analyzed by capillary gas chromatography (Hewlett-Packard 6890) using a 25-m Ultra-2 column (J&W Scientific). Peaks were identified using 33 bacterial FAME standards and MIDI peak identification software (Microbial ID, Inc., Newark, Del.). Peak identifications were confirmed by capillary gas chromatography-mass spectrometry (GC-MS). The GC-MS system consisted of a Finnigan MAT GCQ system (ion trap) operated in positive ionization mode with electron ionization (70 eV). FAME isomers were separated on a 30-m capillary column (DB-5MS; 0.25-mm internal diameter; film thickness, 0.25 μm; J&W Scientific). Double bond positions in monounsaturated fatty acids were confirmed by GC-MS analysis of their dimethyldisulfide adducts (30).
Fatty acids are described using the nomenclature “number of carbons:number of unsaturations,” followed by double bond locations referenced from the omega (ω), or aliphatic, end of the molecule. For example, “18:1ω7” denotes an 18-carbon, monoenoic fatty acid with a double bond at carbon 7. Unsaturated fatty acids with unknown double bond locations are followed by a capital letter. Other conventions are listed as follows: cy, cyclopropyl group; i or a (or br), iso- or anteiso-branched (or unspecified branching); c or t, cis- or trans- double bond configuration; 10me, methyl-branched at C-10 (from carboxylic end); 2OH or 3OH, hydroxy substitution at C-2 or C-3 (from carboxylic end); unk, unknown.
Statistical analyses.
Fatty acid data were analyzed using four statistical ordination methods designed to explore the structure of large multivariate data sets. Ordination methods have the common goal of arranging sample points in space such that points which fall close together have similar values for variables. We used several ordination methods in order to assure a robust interpretation of differences in PLFA composition among samples (22). The first ordination method, principal component analysis (PCA), is analogous to multiple linear regression and is widely used to summarize multivariate data sets of many types (6, 12). Fatty acid data for PCAs were converted to mole percentages in order to eliminate the effect of differences in total PLFA abundance (microbial biomass) among lake locations. Peaks included in the analyses accounted for more than 95% of named peaks in each sample. PCA ordinations were calculated using correlation (rather than covariance) matrices (22). Some recent reports in the statistical literature suggest that compositional data sets (such as PLFA abundances expressed in mole percent) are subject to artifacts when analyzed using PCA (21, 39, 42). As a result of this concern, we also analyzed PLFA results using correspondence analysis (CA) (17). One potential advantage of CA over PCA is that ordinations are the same regardless of whether nanomole or mole percent (compositional) data are used (21). PLFA data for CA ordinations were input as nanomoles per gram. CAs were based on the same set of fatty acid peaks as were PCA analyses.
PCA and CA ordination methods are unconstrained, in the sense that no information about potential environmental driving forces (explanatory variables) is included in the calculations. Only relationships among samples and variables (fatty acids) are considered. Constrained, or direct gradient analysis, forms of both PCA and CA show the relationship of samples and variables (fatty acids) to measured environmental gradients. Redundancy analysis (RDA) is the direct gradient analysis form of PCA (36). Canonical correspondence analysis (CCA) is the direct gradient analysis form of CA (32, 45). Both RDA and CCA allow the significance of measured environmental gradients to be tested explicitly using a Monte Carlo simulation. The Monte Carlo test returns a P value associated with the effect of the environmental variable on the PLFA composition of the samples.
Rules for interpreting ordination plots are different for PCA and RDA than for CA and CCA (24). PCAs and RDAs in our study indicated relationships among samples and fatty acids very similar to those indicated by CA and CCA. For simplicity, we report ordination results only for CA and CCA. All ordination analyses were performed using Canoco software (Microcomputer Power, Inc., Ithaca, N.Y.). Lab replicate PLFA analyses were averaged before ordination analyses.
Other statistical analyses were performed using the general linear models function of SAS (SAS Institute, Inc., Cary, N.C.). PLFA content and mercury methylation potential of surficial sediments were regressed against the average carbon content (three replicate dredge samples) at each site. The effect of bottom water temperature on potentially temperature-sensitive fatty acid ratios was tested using one-way analyses of variance (by sample date) in which both depth intervals from July samples were included and treated as a single group of observations. Methylmercury concentrations in methylation potential assays were compared using two-tailed Student's t tests.
RESULTS
Physical and chemical characteristics of Clear Lake sediments.
Sediment pH at all of the Clear Lake sampling sites was slightly alkaline on both sample dates (7.7 to 7.8). Pore water sulfate concentrations in the top 5 cm ranged from 30 to 110 μM at the Oaks Arm (OA) site, 50 to 100 μM at the Lower Arm (LA) site, and 40 to 150 μM at the UA site over a 14-month period (28). Lake bottom temperatures were 13°C in April 1997 and 25°C in July 1997. These temperatures are characteristic of temperatures recorded at the same locations over a 3-year period (41).
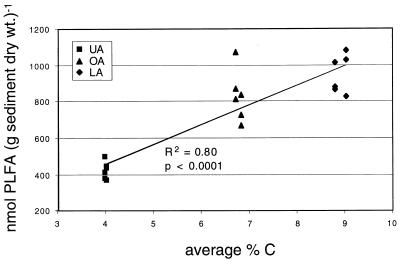
The total nanomoles of PLFA in Clear Lake sediment samples was correlated with percent carbon in sediments (Fig. 2). The LA sediment samples consistently had the highest organic carbon contents, followed by the OA samples. Carbon contents for replicate dredge samples had very small coefficients of variation (<2.3%). C-to-N ratios at all sites ranged between 7.7 and 8.5 and did not show any significant relationship with lake location, sediment depth, or sampling date (data not shown).
FIG. 2.
Percent carbon and total PLFA content of surficial (0- to 4-cm) Clear Lake sediments. Three replicate dredge samples from each lake location on April and July sampling dates are shown. Carbon contents for replicate dredge samples had very small coefficients of variation (<2.3%).
PLFA composition of Clear Lake sediments.
A set of 37 consistently quantified fatty acid peaks (out of 71 detected) was selected for statistical analysis. The 37 fatty acids included in the analyses sum to greater than 95% of the total nanomoles of PLFA in each sample and had coefficients of variation below 10% in lab replicates. Minor peaks not reproducibly quantified due to detection limits were omitted. Lab replicate PLFA analyses were averaged before ordination analyses.
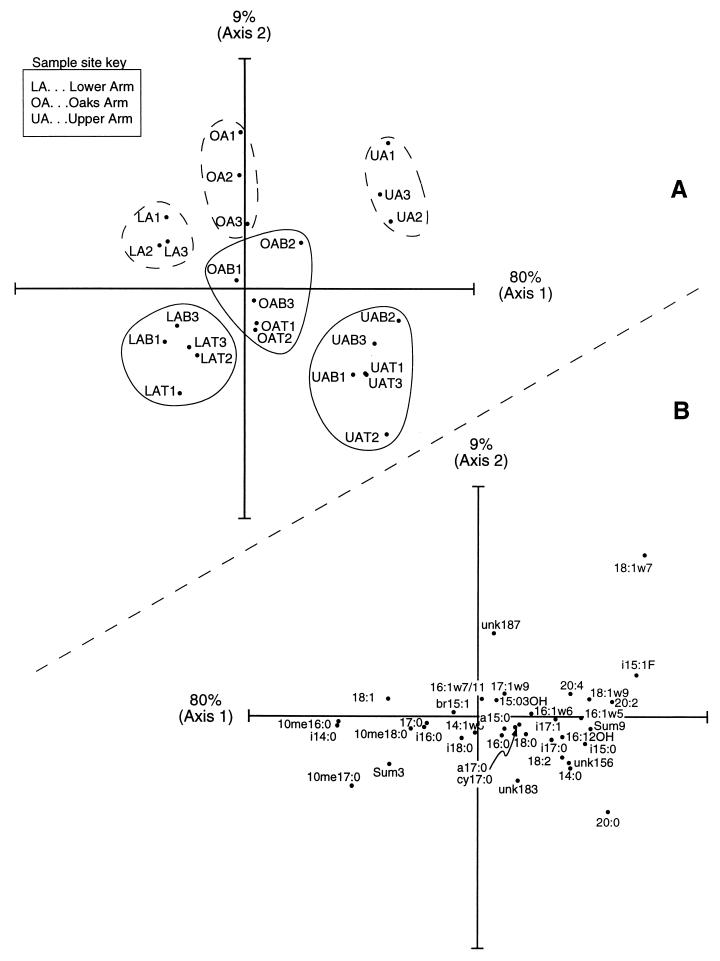
In both indirect (CA and PCA) and direct (CCA and RDA) gradient analyses, LA and OA samples were tightly grouped except for two outliers. These outliers (LAB2 and OAT3) contain especially high amounts of 20:4 and 18:2 polyunsaturated fatty acids. These polyunsaturates are characteristic of eukaryotes and may be associated with invertebrates in Clear Lake sediments. We removed several chironomids from LA sediments and extracted their polar lipids using the procedure described for sediments. The chironomids had a PLFA composition typical for eukaryotic organisms (20) and contained primarily saturated and unsaturated even, straight-chain fatty acids. The polyunsaturated fatty acids 20:4 and 18:2 represented 23% of total chironomid PLFA. The two outlier samples have been omitted from the ordination shown in Fig. 3.
FIG. 3.
(A) CA ordination of PLFA abundance data for Clear Lake sediment samples (outliers LAB2 and OAT3 omitted). The plot shows 89% of the total variability in the data set. Each point represents the average of duplicate or triplicate PLFA analyses. Separate dredges are represented by independent points and are identified by numbers 1 through 3. July samples are additionally identified by either “B” (bottom; 4- to 8-cm depth) or “T” (top; 0- to 4-cm depth). Samples which lie close together have similar fatty acid compositions. Ellipsoids drawn on the plot are meant to aid in identifying samples from the same location and sample date (dashed line, April; solid line, July). (B) CA ordination scores for PLFA variables (outlier samples LAB2 and OAT3 omitted). The expected abundance of each fatty acid decreases with distance from its location in the plot. Fatty acids which lie close to samples in panel A above when the plot origins are superimposed are likely to have a high relative abundance in those samples. For example, fatty acid i14:0 is likely to have the highest abundance in samples from the LA.
Samples from the same lake location grouped together regardless of sediment depth, and samples from different lake locations consistently separated along the first (most important) ordination axis (Fig. 3A). Both PCA and CA ordinations explained greater than 50% of the total variation in PLFA composition on the first axis. Relationships between community PLFA composition and lake location, sampling date, and sediment carbon content were determined using direct gradient analyses (CCA and RDA) with Monte Carlo simulations. Lake location was a highly significant explanatory variable (P < 0.001). Sediment percent carbon was also highly significant (P < 0.001) and produced ordinations almost identical to those which included lake location as an environmental variable. Sampling date was not significant as an explanatory variable (P > 0.05). When samples from a given lake location were analyzed in separate ordinations, sampling date was significant for the UA site (P < 0.001) but not significant for the LA and OA sites (P > 0.05).
Effect of temperature on sediment PLFA composition.
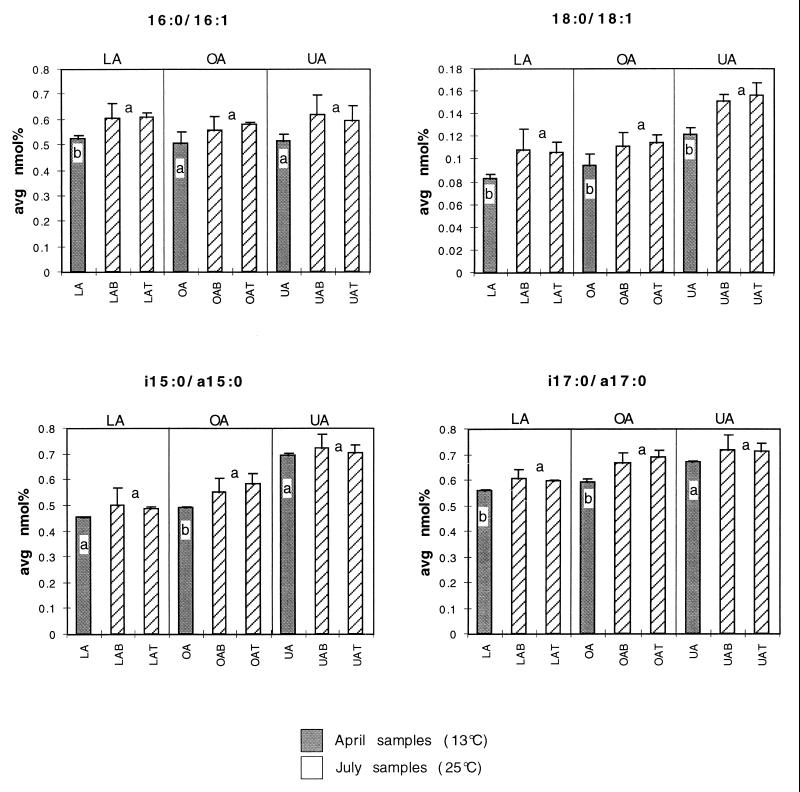
The in situ temperature of Clear Lake bottom water increased from 13°C in April to 25°C in July 1997. Since temperature adaptations of phospholipid membranes may have contributed to changes in PLFA composition, we looked for shifts in fatty acids which are expected to play a role in regulating phospholipid membrane fluidity. Many bacteria respond to increased temperature by decreasing the amount of fatty acid unsaturation in their membranes. Other strategies for decreasing membrane fluidity in response to elevated temperature include increasing the proportion of branched-chain fatty acids or increasing the ratio of iso- to anteiso-branched fatty acids (25). Ratios of saturated to monounsaturated isomers in 16- or 18-carbon fatty acids were slightly higher in July samples at all lake locations, as expected for an increase in temperature (Fig. 4). Ratios of i17:0/a17:0 and i15:0/a15:0 were also slightly higher in July samples, consistent with a membrane adaptation to higher temperature (Fig. 4). Amounts of branched versus unbranched fatty acids (mole percent) changed very little across lake locations and sample dates and did not show a consistent trend with temperature (data not shown).
FIG. 4.
Effect of temperature on Clear Lake sediment PLFA composition. Fatty acid ratios shown are expected to increase with an increase in temperature. July samples (higher temperature) are identified with crosshatched bars. Error bars are 1 standard deviation (n = 3). Samples with different lowercase letters are significantly different at the 95% confidence interval in one-way analyses of variance.
Mercury methylation potential in Clear Lake sediments.
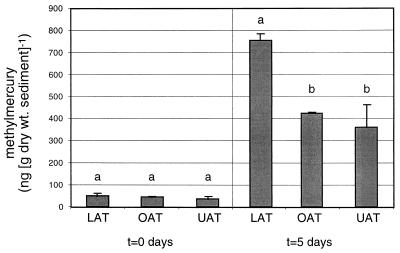
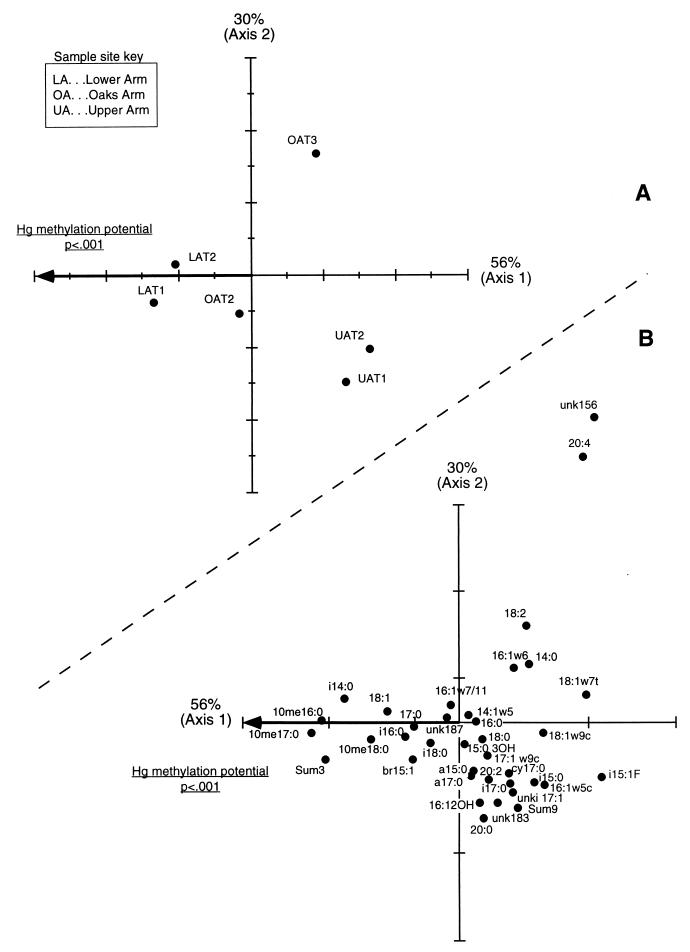
Initial sediment methylmercury concentrations at the three lake sites were not significantly different (0.2 < P < 0.9). Therefore, differences in methylation potential derive from differences in methylmercury concentrations observed after 5 days with added mercury (Fig. 5). In spite of small sample sizes (n = 2 dredges for each site/incubation time), methylation potential at the LA site is significantly greater than at the other two sites (P < 0.05). Methylation potential at the three sites was correlated with sediment percent carbon (r2 = 0.82, P < 0.02) but was uncorrelated with total PLFA (r2 = 0.48). CCA ordination of the sediment PLFA composition with mercury methylation potential as an explanatory variable (Fig. 6) produced sample and PLFA biplots remarkably similar to those produced by including environmental variables for percent carbon or lake location. Mercury methylation potential was a highly significant explanatory variable (P < 0.001). The addition of 125 ppm of Hg2+ to sediment slurries did not change microbial community structure or total biomass based on PLFA analysis of the sediments before and after 5-day mercury methylation potential incubations (data not shown).
FIG. 5.
Mercury methylation potential in surficial (0- to 4-cm) Clear Lake sediments. Methylmercury concentrations at initial (t = 0 days) and final (t = 5 days) incubation times are shown. Error bars are ±1 standard deviation (n = 2 dredge samples). Within each of the two panels of the graph, bars with different letters are significantly different (P < 0.05, two-tailed Student's t test).
FIG. 6.
(A) CCA ordination of PLFA abundance data for Clear Lake sediment samples (0- to 4 cm). The plot shows 86% of the total variability in the data set. Mercury methylation values (nanograms per gram [dry weight] of sediment) were divided by total nanomoles of PLFA (microbial biomass). Since only one environmental variable was included in the analysis (Hg methylation potential), it is 100% correlated with the first CCA axis. (B) CCA ordination scores for PLFA variables. As for CA ordinations, the expected abundance of each fatty acid decreases with distance from its location in the plot, and fatty acids which lie close to samples in panel A above when the plot origins are superimposed are likely to have a high relative abundance in those samples.
Published data on PLFA composition of sulfate-reducing bacteria.
PLFA biomarkers for sulfate-reducing bacterial groups have been identified by previous researchers and are shown in Table 1. Some of these biomarkers were determined for a small subset of isolates and may not be present in, or exclusive to, all members of the groups which they are reported to represent. To provide a more comprehensive comparison of the reported biomarkers with published PLFA abundances in sulfate-reducing bacterial isolates, we compiled available information into a database containing 100 strains (3, 7, 13–15, 26, 34, 43, 46). PLFA abundances in the database are expressed in mole percentages. Desulfovibrio (n = 52), Desulfobacter (n = 16), and Desulfobulbus (n = 6) were the most commonly reported genera. Twelve genera have at least one representative in the database. An “other” category includes “Spirillum” and “fat vibrio” (14), Thermosulfobacterium commune (46), isolates 3801 and 3794 (15), and two examples of Geobacter metallireducens (26). Sulfate-reducing archaea are not included in the database.
TABLE 1.
PLFA biomarkers for sulfate-reducing bacterial groups
The published PLFA analyses were of variable quality and resolution. In order to include some data sets we would otherwise have discarded due to poor gas chromatography peak resolution or differences in analytical methods, we grouped some structurally similar fatty acids into summed aggregates. For example, iso- and anteiso-15:1 isomers were summed and reported as “br15:1.” Although some detailed information is lost using this approach, it allowed us to compare the largest possible number of isolates. Fatty acids of 13 carbons or less in chain length were not reported in some published analyses. In addition, OH-substituted fatty acids derived from polar lipids were sometimes reported jointly with lipopolysaccharide OH fatty acids, making it difficult to compare OH-substituted fatty acid abundances among different studies. As a result of these analytical limitations in previous studies, fatty acids 11:0, 12:0, a13:0, i13:0, 13:0, and OH-substituted fatty acids were omitted from ordination analyses of the compiled database.
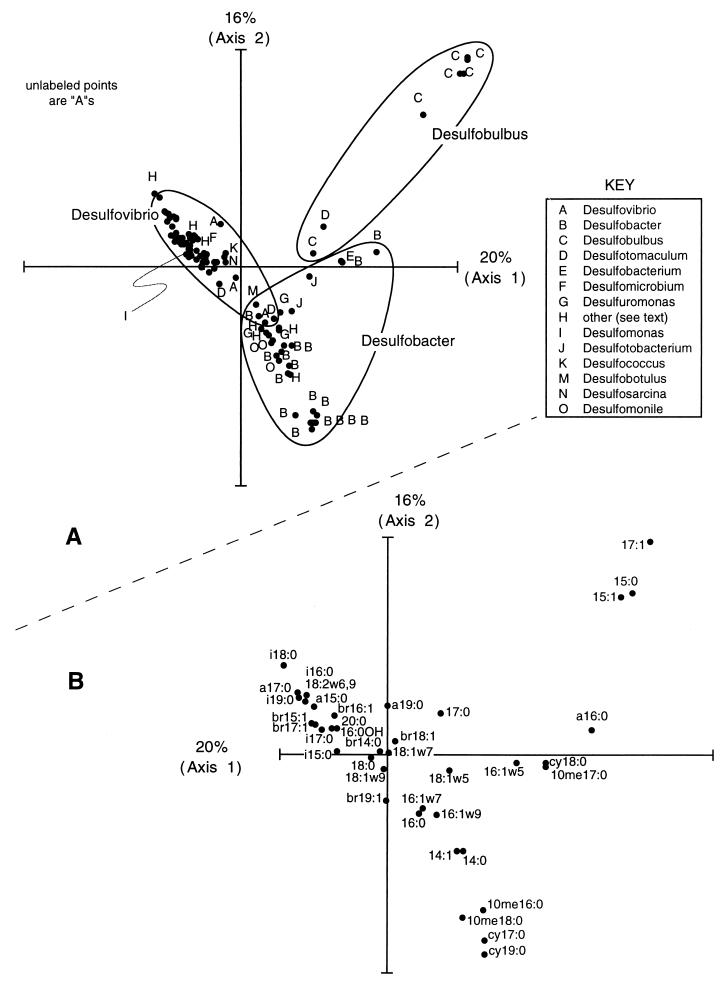
CA and PCA ordinations of the pure culture PLFA database showed three clusters of isolates containing Desulfobacter, Desulfobulbus, and Desulfovibrio isolates (Fig. 7). Relationships between isolates in the ordination plots reflect their taxonomic identity, as suggested by previous studies comparing the PLFA compositions of 25 (26) or 40 (46) strains of sulfate-reducing bacteria. Desulfovibrio isolates in the database are characterized by high relative amounts of branched saturated and branched monounsaturated fatty acids. Four Desulfovibrio isolates contained the polyunsaturated fatty acid 18:2 (<1 mol%), which was not detected in any other isolates in the database. Desulfobacter isolates were associated with high relative amounts of methyl-branched and cyclopropyl fatty acids, especially 10me16:0, cy17:0, and cy19:0. The fatty acid 10me18:0 was detected in a single isolate (0.5 mol%, marine Desulfobacter sp. strain 3ac10 [14]). Desulfobulbus isolates in the database were characterized by a high abundance of unbranched fatty acids (17:1, 15:1, and 15:0). Other genera are represented by very few strains in the database and fell between or within the Desulfovibrio, Desulfobulbus, or Desulfobacter groups on ordination plots.
FIG. 7.
(A) CA ordination of PLFA abundance data for sulfate-reducing bacterial isolates. Samples which are plotted close together have similar PLFA compositions. Strains included in the “other” category (H) are given in the text. Ellipsoids drawn on the plot are meant to aid in identifying isolates of the same genus. (B) CA ordination scores for PLFA variables in the pure culture database. The expected abundance of each fatty acid decreases with distance from its location in the plot. Fatty acids which are plotted close to samples in panel A when plot origins are superimposed are likely to have a high relative abundance in those samples.
Average contents of biomarker PLFAs for Desulfovibrio (br17:1), Desulfobacter (10me16:0), and Desulfobulbus (17:1) in selected genera from the database are shown in Table 2. Biomarker fatty acids for Desulfovibrio (br17:1) were detected in 48 out of 52 Desulfovibrio PLFA analyses but were also detected in six isolates assigned to other genera including Desulfomonas (46), Desulfomicrobium (46), Desulfococcus (26), Desulfotomaculum (26), Desulfuromonas (26), and Desulfosarcina (26). The Desulfobacter biomarker (10me16:0) was detected in 10 out of 11 Desulfobacter PLFA profiles but was also detected in three isolates assigned to Desulfotomaculum (26), Geobacter (26), or Desulfobacterium (46). The Desulfobulbus biomarkers (17:1) were detected in all Desulfobulbus PLFA analyses but were also detected in numerous isolates from at least nine other genera (Table 2).
TABLE 2.
Biomarker PLFA content for sulfate-reducing bacterial isolates in published studies
| Genus | na | Fatty acid abundanceb
|
||
|---|---|---|---|---|
| br17:1 (Desulfovibrio biomarker) | 10me16:0 (Desulfobacter biomarker) | 17:1 (Desulfobulbus biomarker) | ||
| Desulfovibrio | 52 | 25 ± 13c | 0 ± 0 [<1] | 0 ± 1 [<4] |
| Desulfobacter | 16 | 0 ± 1 [<2] | 11 ± 6d | 1 ± 3 [<11] |
| Desulfobulbus | 6 | 0 ± 0 [ND] | 0 ± 0 [ND] | 44 ± 15 |
| All others | 26 | 4 ± 8 [<26]e | 0 ± 2 [<8]f | 2 ± 5 [<19]g |
Number of occurrences in the database.
Average ± standard deviation [< maximum value] mole percent of total PLFA. ND, not detected.
Four isolates contained no detectable i17:1 isomers (48).
One Desulfobacter isolate contained no detectable 10me16:0 (8).
Detected in six isolates assigned to other genera (Desulfomonas and Desulfomicrobium [48] and Desulfococcus, Desulfotomaculum, Desulfuromonas, and Desulfosarcina [28]; also detected in four unknown isolates [15, 16]).
DISCUSSION
Microbial community structure in Clear Lake sediments is significantly related to a gradient in organic carbon among the lake sample sites. In contrast, inorganic mercury concentration appeared to have no effect on community structure, either in microcosm mercury methylation potential assays or in lake sediments with differing total Hg concentrations (Fig. 1). Pore water sulfate concentrations and sediment organic matter C/N ratios were not significantly different among lake locations and therefore cannot be responsible for the differences in community composition that we observed. Sediment PLFA patterns did not change significantly between 0- to 4- and 4- to 8-cm depths, likely due to intense sediment bioturbation by chironomid larvae and oligochaete worms (41).
Mercury methylation potential was positively correlated with sediment percent carbon, highlighting the importance of heterotrophic biological activity for driving mercury methylation in Clear Lake sediments. A positive correlation between mercury methylation and percent carbon in sediments has also been reported in previous studies (8, 23, 31). Sediment percent carbon was also positively correlated with mercury methylation potential expressed per nanomole of PLFA (microbial biomass). This correlation is explained by the observed changes in microbial community structure from the LA site (high percent C) to the UA site (low percent C) and suggests that high-carbon sites host microbial communities with higher mercury methylation activity per unit of microbial biomass.
Previous studies have proposed the use of PLFA biomarkers for distinguishing sulfate-reducing bacterial groups from each other (Table 1) (14, 35, 46). Ordination analyses of the compiled fatty acid database for pure cultures of sulfate-reducing bacteria generally support the use of previously published biomarkers for grouping pure cultures. Other studies have used biomarker PLFAs to identify the presence and abundance of sulfate-reducing bacterial groups in natural environments (9, 33, 44, 47). These studies assumed that other bacteria in environmental samples did not contain significant amounts of the sulfate reducer biomarkers. Biomarkers for Desulfobulbus species consist of straight-chain saturated and monounsaturated PLFAs (15:0, 15:1, and 17:1) which are known to be widely distributed among bacterial taxa. As a result, this group is not likely to be easily studied in environmental samples using PLFA analysis. In contrast, biomarkers for Desulfovibrio (br17:1) and Desulfobacter (10me-PLFA) are more narrowly distributed or are present in small amounts in bacteria other than sulfate reducers (37), suggesting that these two genera are likely to be the major sources of their respective biomarker fatty acids in environmental samples. The fatty acid 10me16:0 is a trace component of some high-G+C gram-positive strains but is a major component of Desulfobacter strains. Likewise, branched monounsaturates comprise a small percentage (<10%) of fatty acids in a few high-G+C gram-positive groups but usually represent a large percentage (>30%) of Desulfovibrio fatty acids. The small number of available PLFA profiles for sulfate-reducing isolates in genera other than Desulfovibrio and Desulfobacter limits interpretation of environmental PLFA profiles with respect to these organisms.
Although the PLFA database for environmental bacterial isolates is limited, putative sulfate reducer biomarkers for Desulfovibrio and Desulfobacter groups are potentially very useful for environments such as anoxic sediments dominated by the activity of sulfate-reducing bacteria. Interpretation of Clear Lake sediment PLFA data based on sulfate reducer biomarkers leads to several hypotheses which can be tested in future studies. We assumed that an average cell contains 7.31 × 10⁻⁸ nmol of PLFA (29). Based on the pure culture data in Table 2, the biomarker fatty acid 10me16:0 makes up roughly 25% of Desulfobacter PLFAs. Similarly, br17:1 fatty acids are approximately 11% of Desulfovibrio PLFAs. Based on these conversion factors, the bacterial community at the LA site has 91% Desulfobacter (1.4 × 10¹⁰ cells/g of sediment [dry weight]), 2% Desulfovibrio (2.7 × 10⁸ cells/g), and 7% other organisms. In contrast, the UA site has 33% Desulfobacter (2.2 × 10⁹ cells/g), 3% Desulfovibrio (2.2 × 10⁸ cells/g), and 64% other organisms. The OA site has a community composition intermediate between those of the LA and UA sites. It is unlikely that sulfate-reducing bacteria can account for as much as 91% (LA) of the sediment bacterial biomass, since they depend on fermentation products produced from complex organic matter by large populations of other heterotrophic bacteria. However, the estimates above are useful as comparative measures of community structure at different lake locations. Sulfate-reducing bacteria constitute a larger portion of the sediment community at the LA site, which also had higher mercury methylation potential than the other two sample sites. The positive correlation between sulfate-reducing bacterial biomass and mercury methylation is interesting in light of previous work at the same sample locations, which showed that sulfate reduction and mercury methylation potential are highly correlated at the LA site but only weakly correlated at the OA and UA sites (28). Together, these results suggest that sulfate reducers are important for mercury methylation in Clear Lake sediments, but other unknown mercury methylators may also be important, especially outside the LA.
Desulfobacter populations (or sulfate-reducing bacteria with similar PLFA composition) were much more abundant than Desulfovibrio populations at all lake sampling sites and were also more abundant at sites with higher mercury methylation potential per unit of microbial biomass. Desulfovibrio populations were most abundant at the UA site, which had the lowest mercury methylation potential per unit of biomass. Results from Clear Lake are consistent with those from a previous microcosm study (38), which reported that mercury methylation potential in freshwater lake sediments was highly correlated with the abundance of PLFA 10me16:0 (Desulfobacter biomarker). In an estuarine sediment studied using oligonucleotide probes (11), the peak in mercury methylation occurred at the same sediment depth as peaks in rRNA from several groups of sulfate-reducing bacteria including members of the family Desulfovibrionaceae and Desulfobacter species. Since there is no evidence that sulfate-reducing bacterial species have different mercury methylating abilities, the observed correlation between mercury methylation potential and Desulfobacter biomarker PLFA freshwater environments may simply reflect the dominance of Desulfobacter species among sulfate-reducing bacterial populations in lacustrine sediments studied to date.
Our results suggest that further eutrophication of Clear Lake may increase mercury methylation, either by altering sediment microbial communities or by increasing sediment organic carbon loading. Sulfate-rich waters from mining pits adjacent to the OA of Clear Lake appear to be a major source of sulfur in the lake (41) and could contribute to increased production of methylmercury. Future mercury remediation studies in the Clear Lake basin should consider sulfur inputs and cycling. However, the lack of a strong relationship between sulfate reduction and mercury methylation at two lake sample sites also suggests that other bacterial groups which methylate mercury are potentially important in the UA and OA of Clear Lake.
ACKNOWLEDGMENTS
This work was supported by the U.S. Environmental Protection Agency Center for Ecological Health Research, the NIEHS Superfund Basic Research Program (2P42 ES04699), and the USEPA Office of Exploratory Research (grant no. R825433 to T. H. Suchanek and P. J. Richerson).
We are grateful for the assistance of Tom Suchanek and the staff at the Clear Lake Environmental Research Center.
REFERENCES
- 1.Berman M, Bartha R. Levels of chemical vs. biological methylation of mercury in sediments. Bull Environ Contam Toxicol. 1986;36:401–404. doi: 10.1007/BF01623527. [DOI] [PubMed] [Google Scholar]
- 2.Bloom N. Determination of picogram levels of methylmercury by aqueous phase ethylation, followed by cryogenic gas chromatography with cold vapour atomic fluorescence detection. Can J Fish Aquat Sci. 1989;46:1131–1140. [Google Scholar]
- 2a.Bloom N S, Coleman J A, Barber L. Artifact formation of methyl mercury during aqueous distillation and alternative techniques for the extraction of methyl mercury from environmental samples. Fresenius J Anal Chem. 1997;358:371–377. [Google Scholar]
- 3.Boon J J, de Leeuw J W, van der Hoek G J, Vosjan J H. Significance and taxonomic value of iso and anteiso monoenoic fatty acids and branched β-hydroxy acids in Desulfovibrio desulfuricans. J Bacteriol. 1977;129:1183–1191. doi: 10.1128/jb.129.3.1183-1191.1977. [DOI] [PMC free article] [PubMed] [Google Scholar]
- 4.Boschker H T S, Nold S C, Wellsbury P, Bos D, De Graaf W, Pel R, Parkes R J, Cappenberg T E. Direct linking of microbial populations to specific biogeochemical processes by 13C-labelling of biomarkers. Nature (London) 1998;392:801–805. [Google Scholar]
- 5.Bossio D A, Scow K M. Impacts of carbon and flooding on the metabolic diversity of microbial communities in soils. Appl Environ Microbiol. 1995;61:4043–4050. doi: 10.1128/aem.61.11.4043-4050.1995. [DOI] [PMC free article] [PubMed] [Google Scholar]
- 6.Brereton R G. Chemometrics: applications of mathematics and statistics to laboratory systems. New York, N.Y: Ellis Horwood; 1990. [Google Scholar]
- 7.Brink D E, Vance I, White D C. Detection of Desulfobacter in oil field environments by non-radioactive DNA probes. Appl Microbiol Biotechnol. 1994;42:469–475. [Google Scholar]
- 8.Callister S M, Winfrey M R. Microbial methylation of mercury in Upper Wisconsin River [USA] sediments. Water Air Soil Pollut. 1986;29:453–465. [Google Scholar]
- 9.Coleman M L, Hedrick D B, Lovley D R, White D C, Pye K. Reduction of iron-III in sediments by sulphate-reducing bacteria. Nature (London) 1993;361:436–438. [Google Scholar]
- 10.Compeau G C, Bartha R. Sulfate-reducing bacteria: principal methylators of mercury in anoxic estuarine sediment. Appl Environ Microbiol. 1985;50:498–502. doi: 10.1128/aem.50.2.498-502.1985. [DOI] [PMC free article] [PubMed] [Google Scholar]
- 11.Devereux R, Winfrey M R, Winfrey J, Stahl D A. Depth profile of sulfate-reducing bacterial ribosomal RNA and mercury methylation in an estuarine sediment. FEMS Microbiol Ecol. 1996;20:23–31. [Google Scholar]
- 12.Digby P G N, Kempton R A. Multivariate analysis of ecological communities. New York, N.Y: Chapman and Hall; 1987. [Google Scholar]
- 13.Dowling N J E, Nichols P D, White D C. Phospholipid fatty acid and IR spectroscopic analysis of a sulfate-reducing consortium. FEMS Microbiol Ecol. 1988;53:325–334. [Google Scholar]
- 14.Dowling N J E, Widdel F, White D C. Phospholipid ester-linked fatty acid biomarkers of acetate-oxidizing sulfate-reducers and other sulfide-forming bacteria. J Gen Microbiol. 1986;132:1815–1826. [Google Scholar]
- 15.Edlund A, Nichols P D, Roffey R, White D C. Extractable and lipopolysaccharide fatty acid and hydroxy fatty acid profiles from Desulfovibrio species. J Lipid Res. 1985;26:982–988. [PubMed] [Google Scholar]
- 16.Findlay R H. The use of phospholipid fatty acids to determine microbial community structure. 1996. pp. 1–17. , section 4.1.4. In A. D. Akkermans et al. (ed.), Molecular microbial ecology manual. Kluwer Academic Publishers, Dordrecht, The Netherlands. [Google Scholar]
- 17.Gauch H G, Jr, Whittaker R H, Wentworth T R. A comparative study of reciprocal averaging and other ordination techniques. J Ecol. 1977;65:157–174. [Google Scholar]
- 18.Gilmour C C, Henry E A. Mercury methylation in aquatic systems affected by acid deposition. Environ Pollut. 1991;71:131–170. doi: 10.1016/0269-7491(91)90031-q. [DOI] [PubMed] [Google Scholar]
- 19.Gilmour C C, Henry E A, Mitchell R. Sulfate stimulation of mercury methylation in freshwater sediments. Environ Sci Technol. 1992;26:2281–2287. [Google Scholar]
- 20.Harwood J L, Russell N J. Lipids in plants and microbes. London, United Kingdom: George Allen & Unwin; 1984. [Google Scholar]
- 21.Jackson D A. Compositional data in community ecology: the paradigm or peril of proportions? Ecology. 1997;78:929–940. [Google Scholar]
- 22.Jackson D A. Multivariate analysis of benthic invertebrate communities: the implication of choosing particular data standardizations, measures of association, and ordination methods. Hydrobiologia. 1993;268:9–26. [Google Scholar]
- 23.Jackson T A. Methyl mercury levels in a polluted prairie river-lake system: seasonal and site-specific variations, and the dominant influence of trophic conditions. Can J Fish Aquat Sci. 1986;43:1873–1887. [Google Scholar]
- 24.Jongman R H G, ter Braak C J F, van Tongeren O F R, editors. Data analysis in community and landscape ecology. Cambridge, United Kingdom: Cambridge University Press; 1995. [Google Scholar]
- 25.Kaneda T. Iso-fatty and anteiso-fatty acids in bacteria—biosynthesis, function, and taxonomic significance. Microbiol Rev. 1991;55:288–302. doi: 10.1128/mr.55.2.288-302.1991. [DOI] [PMC free article] [PubMed] [Google Scholar]
- 26.Kohring L L, Ringelberg D B, Devereux R, Stahl D A, Mittelman M W, White D C. Comparison of phylogenetic relationships based on phospholipid fatty acid profiles and ribosomal RNA sequence similarities among dissimilatory sulfate-reducing bacteria. FEMS Microbiol Lett. 1994;119:303–308. doi: 10.1111/j.1574-6968.1994.tb06905.x. [DOI] [PubMed] [Google Scholar]
- 27.Liang L, Bloom N S, Horvat M. Simultaneous determination of mercury speciation in biological materials by GC-CVAFS after ethylation and room-temperature precollection. Clin Chem. 1994;40:602–607. [PubMed] [Google Scholar]
- 28.Mack E E. Ph.D. dissertation. University of California, Davis; 1998. [Google Scholar]
- 29.Neidhardt F C, Ingraham J L, Schaechter M. Physiology of the bacterial cell. Sunderland, Mass: Sinauer Associates, Inc.; 1990. [Google Scholar]
- 30.Nichols P D, Guckert J B, White D C. Determination of monounsaturated fatty acid double-bond position and geometry for microbial monocultures and complex consortia by capillary gas chromatography-mass spectrometry of their dimethyldisulfide adducts. J Microbiol Methods. 1986;5:49–56. [Google Scholar]
- 31.Pak K R, Bartha R. Mercury methylation and demethylation in anoxic lake sediments and by strictly anaerobic bacteria. Appl Environ Microbiol. 1998;64:1013–1017. doi: 10.1128/aem.64.3.1013-1017.1998. [DOI] [PMC free article] [PubMed] [Google Scholar]
- 32.Palmer M W. Putting things in even better order: the advantages of canonical correspondence analysis. Ecology. 1993;74:2215–2230. [Google Scholar]
- 33.Parkes R J. Analysis of microbial communities within sediments using biomarkers. In: Fletcher M, Gray T R G, Jones J G, editors. Ecology of microbial communities. Cambridge, United Kingdom: Cambridge University Press; 1987. pp. 147–178. [Google Scholar]
- 34.Parkes R J, Calder A G. The cellular fatty acids of three strains of Desulfobulbus, a propionate-utilizing sulphate-reducing bacterium. FEMS Microbiol Ecol. 1985;31:361–363. [Google Scholar]
- 35.Parkes R J, Dowling N J E, White D C, Herbert R A, Gibson G R. Characterization of sulphate-reducing bacterial populations within marine and estuarine sediments with different rates of sulphate reduction. FEMS Microbiol Ecol. 1993;102:235–250. [Google Scholar]
- 36.Rao C R. The use and interpretation of principal component analysis in applied research. Sankhya Ser A. 1964;26:329–358. [Google Scholar]
- 37.Ratledge C, Wilkinson S G, editors. Microbial lipids. San Diego, Calif: Academic Press Limited; 1989. [Google Scholar]
- 38.Regnell O, Tunlid A, Ewald G, Sangfors O. Methyl mercury production in freshwater microcosms affected by dissolved oxygen levels: role of cobalamin and microbial community composition. Can J Fish Aquat Sci. 1996;53:1535–1545. [Google Scholar]
- 39.Reyment R A. Compositional data analysis. Terra. 1988;100:29–34. [Google Scholar]
- 40.Robinson J B, Tuovinen O H. Mechanisms of microbial resistance and detoxification of mercury and organomercury compounds: physiological, biochemical and genetic analyses. Microbiol Rev. 1984;48:95–124. doi: 10.1128/mr.48.2.95-124.1984. [DOI] [PMC free article] [PubMed] [Google Scholar]
- 41.Suchanek T H, Richerson P J, Mullen L H, Brister L L, Becker J C, Maxson A E, Slotton D G. Interim final report, Sulphur Bank Mercury Mine Superfund site. San Francisco, Calif: U.S. Environmental Protection Agency Region IX Superfund Program; 1997. [Google Scholar]
- 42.Tangri D, Wright R V S. Multivariate analysis of compositional data: applied comparisons favour standard principal components analysis over Aitchison's loglinear contrast method. Archaeometry. 1993;35:103–115. [Google Scholar]
- 43.Taylor J, Parkes R J. The cellular fatty acids of the sulphate-reducing bacteria, Desulfobacter sp., Desulfobulbus sp. and Desulfovibrio desulfuricans. J Gen Microbiol. 1983;129:3303–3309. [Google Scholar]
- 44.Taylor J, Parkes R J. Identifying different populations of sulfate-reducing bacteria within marine sediment systems, using fatty acid biomarkers. J Gen Microbiol. 1985;131:631–642. [Google Scholar]
- 45.Ter Braak C J F. Canonical correspondence analysis: a new eigenvector technique for multivariate direct gradient analysis. Ecology (Tempe) 1986;67:1167–1179. [Google Scholar]
- 46.Vainshtein M, Hippe H, Kroppenstedt R M. Cellular fatty acid composition of Desulfovibrio species and its use in classification of sulfate-reducing bacteria. Syst Appl Microbiol. 1992;15:554–566. [Google Scholar]
- 47.White D C, Davis W M, Nickels J S, King J D, Bobbie R J. Determination of the sedimentary microbial biomass by extractable lipid phosphate. Oecologia. 1979;40:51–61. doi: 10.1007/BF00388810. [DOI] [PubMed] [Google Scholar]
- 48.Winfrey M R, Rudd J W M. Environmental factors affecting the formation of methylmercury in low pH lakes. Environ Toxicol Chem. 1990;9:853–870. [Google Scholar]


