

Abstract
This retrospective hospital-based study examines all SARS-CoV-2 nosocomial infections in 1 US health care system during the Omicron surge vs an earlier wave when wild-type variants predominated.
The SARS-CoV-2 Omicron variant is more contagious than prior variants, leading to large increases in community cases. Little is known, however, about the incidence of nosocomial SARS-CoV-2 infections with Omicron vs prior variants.
Methods
We retrospectively identified all SARS-CoV-2 cases diagnosed in 12 hospitals within the Mass General Brigham health care system between July 1, 2020, and February 28, 2022. All patients were tested on admission with polymerase chain reaction (PCR) assays, and, starting November 2020, were retested 72 hours after admission to identify cases with virus incubating on admission. Retesting was also required for new symptoms, after possible exposures, before aerosol-generating procedures, and before discharge if requested by destination facilities.
We calculated monthly incidence rates for SARS-CoV-2 infections first identified on hospital days 5 or later, 8 or later, and 15 or later per 1000 non–COVID-19 patient-days. We selected these periods as increasingly likely to identify hospital-acquired infections, given the incubation period of SARS-CoV-2 (wild-type median 5 days, Delta 4 days, and Omicron 3 days).1 We excluded patients flagged for COVID-19 for less than 72 hours, an indication the hospital’s infection control team deemed the PCR a false positive or residual RNA from resolved infection (patients who died or were discharged within 72 hours of admission were included so long as they were still flagged for COVID-19).2 Non–COVID-19 patient-days included all patient-days except those contributed by patients while isolated for COVID-19.
We compared the incidence of hospital-onset cases during December 15, 2021, to February 28, 2022, when the Omicron variant predominated, vs December 15, 2020, to February 28, 2021, when wild-type virus predominated. Infection control policies were similar across periods and included universal masking, daily employee health attestations, testing on admission and 72 hours after admission, visitor restrictions, contact tracing, and free on-demand testing for employees (eTable in the Supplement). Employee vaccinations began mid-December 2020, and all employees were required to be vaccinated by October 2021. Risk ratios with 95% CIs were calculated with OpenEpi.com version 3.0; statistical significance was defined as a 95% CI that excluded 1. The study was approved by the Mass General Brigham institutional review board with a waiver of informed consent.
Results
There were 295 771 patients admitted for 1 825 610 hospital-days (mean, 6.2 days per admission); 13 392 admissions included a diagnosis of SARS-CoV-2 infection (53.3% men; mean age, 61.3 years) and 434 cases (3.2%) were diagnosed on hospital day 5 or later. Of these, 178/3820 (4.7%) were diagnosed during the 2021-2022 Omicron winter surge and 111/3218 (3.4%) during the 2020-2021 winter surge (Table). The incidence of hospital-onset infections was significantly higher during the winter 2021-2022 Omicron surge vs the prior winter surge: 0.87 vs 0.56 cases per 1000 patient-days for diagnoses on hospital day 5 or later (relative risk [RR], 1.54; 95% CI, 1.22-1.95), 0.57 vs 0.35 for diagnoses on hospital day 8 or later (RR, 1.62; 95% CI, 1.21-2.18), and 0.37 vs 0.16 for diagnoses on hospital day 15 or later (RR, 2.31; 95% CI, 1.53-3.49). The increase in hospital-onset infections during the Omicron wave vs the prior winter wave mirrored similar increases in community and health care worker case numbers during these same periods (Figure).
Table. Summary of COVID-19 Admissions and Hospital-Onset COVID-19 Rates During the Omicron Winter Surge vs the Prior Winter Surge.
| Winter 1, wild-type variants, Dec 15, 2020-Feb 28, 2021 | Winter 2, Omicron strain, Dec 15, 2021-Feb 28, 2022 | |
|---|---|---|
| Cases in Massachusetts | 286 917 | 685 346 |
| Total admissions to Mass General Brigham hospitals | 34 202 | 33 571 |
| Patient-days | 221 587 | 231 630 |
| Admissions with COVID-19 | 3218 | 3820 |
| COVID-19 patient-days | 24 117 | 26 099 |
| Non–COVID-19 patient-days | 197 470 | 205 531 |
| COVID-19–positive employeesa | 846 | 5798 |
| Patients first diagnosed with COVID-19 on hospital day ≥5, No. (rate/1000 non–COVID-19 patient-days) | 111 (0.56) | 178 (0.87) |
| Relative risk for winter 2 vs 1 (95% CI) | NA | 1.54 (1.22-1.95) |
| Patients first diagnosed with COVID-19 on hospital day ≥8, No. (rate/1000 non–COVID-19 patient-days) | 70 (0.35) | 118 (0.57) |
| Relative risk for winter 2 vs 1 (95% CI) | NA | 1.62 (1.21-2.18) |
| Patients first diagnosed with COVID-19 on hospital day ≥15, No. (rate/1000 non–COVID-19 patient-days) | 32 (0.16) | 77 (0.37) |
| Relative risk for winter 2 vs 1 (95% CI) | NA | 2.31 (1.53-3.49) |
Abbreviation: NA, not applicable.
Including physicians, nurses, nursing support personnel, physician assistants, physical therapists, occupational therapists, speech therapists, and respiratory therapists.
Figure. Incidence of Hospital-Onset Infection.
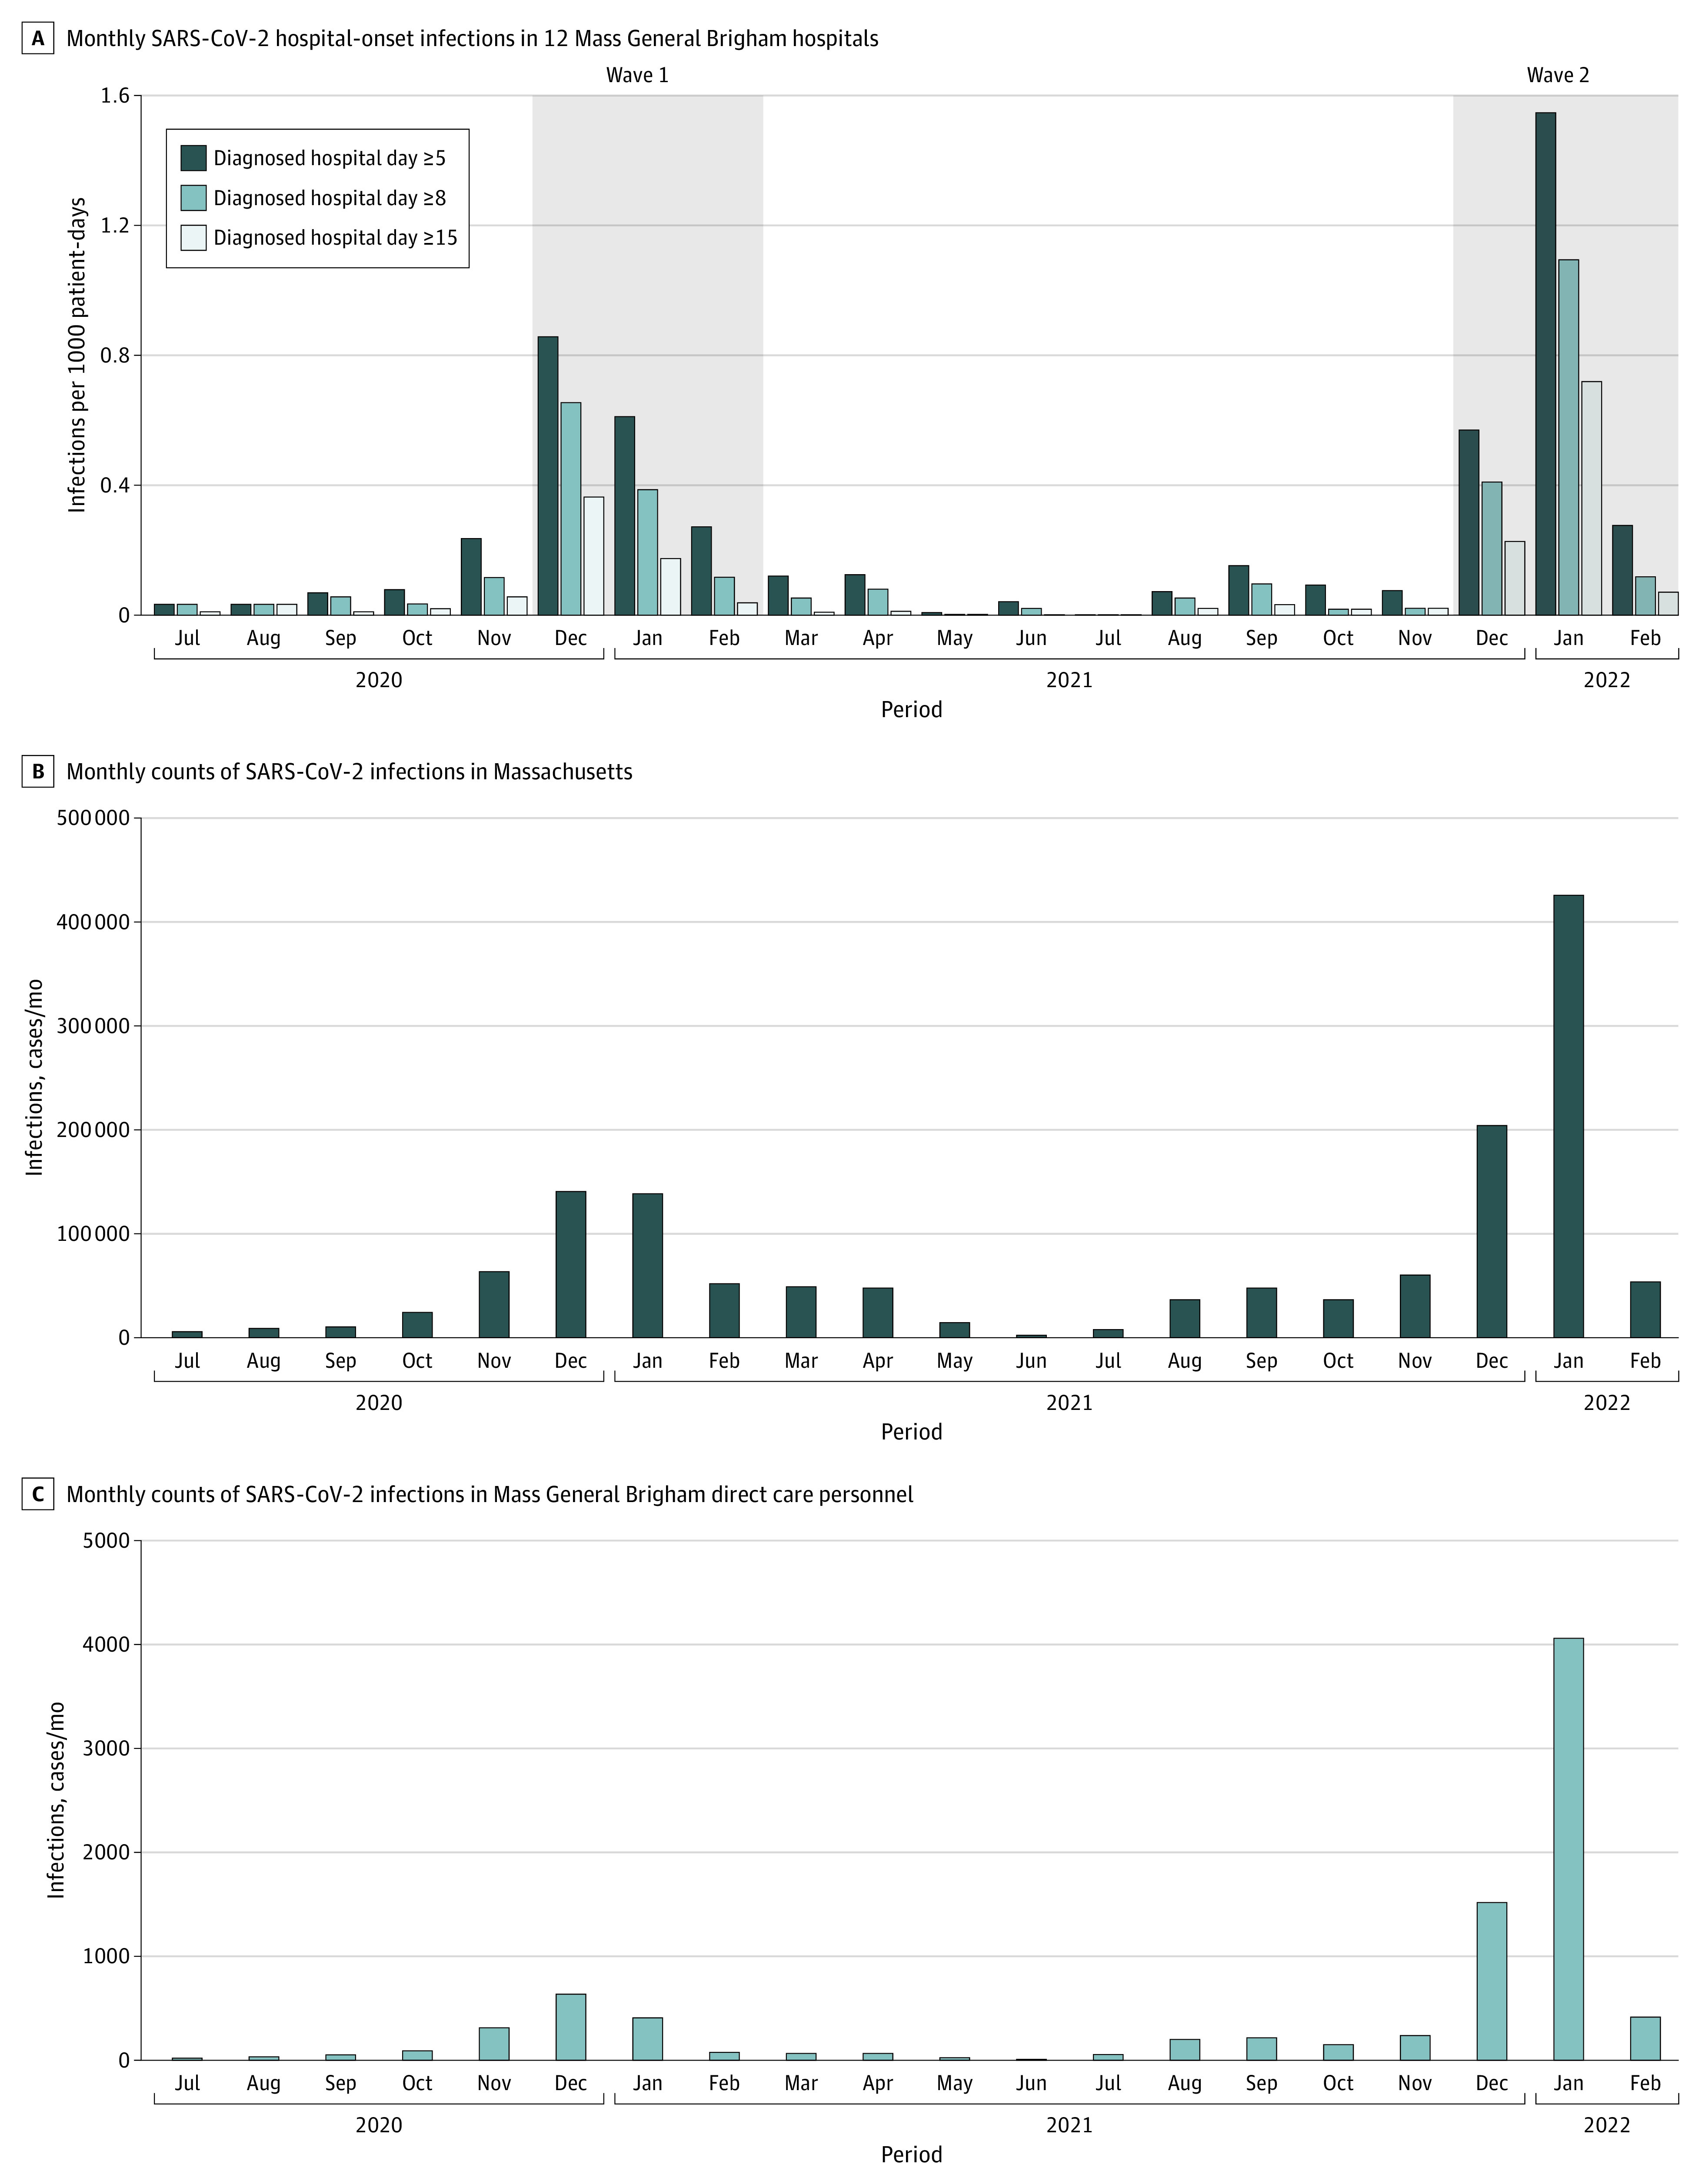
Months reflect the date of diagnosis. C, Direct care personnel included physicians, nurses, nursing support personnel, physician assistants, physical therapists, occupational therapists, speech therapists, and respiratory therapists.
Discussion
The Omicron surge was associated with a significant increase in hospital-onset SARS-CoV-2 infections compared with the prior winter surge. Possible reasons include the Omicron surge’s very high community and health care worker incidence rates, as well as Omicron’s greater contagiousness. Sources of nosocomial infections include health care workers, visitors, and other patients.3
Study limitations include possible underdetection of hospital-acquired cases owing to lack of serial testing, failure to test patients with asymptomatic or paucisymptomatic infections, or disease onset after discharge. Time since admission is a limited proxy for nosocomial infection. Some hospital-acquired cases may be misidentified as community acquired because the incubation period for SARS-CoV-2 can be fewer than 5 days, particularly for Omicron. Conversely, some community-acquired cases might only have been identified more than 5 days after admission because of a long incubation period or delayed testing. Findings may not be generalizable to hospitals with fewer baseline infection control measures (eg, vaccination requirements, testing all patients on admission and 72 hours after admission).4
The increase in hospital-onset infections associated with the Omicron variant despite consistent infection control policies and mandated employee vaccinations underscores the risk of nosocomial transmission, especially when community incidence rates are high, and the need for enhanced infection control strategies.5,6
Section Editors: Jody W. Zylke, MD, Deputy Editor; Kristin Walter, MD, Associate Editor.
eTable. Differences in Infection Control Policies Between the 2 Waves
References
- 1.Backer JA, Eggink D, Andeweg SP, et al. Shorter serial intervals in SARS-CoV-2 cases with Omicron BA.1 variant compared with Delta variant, the Netherlands, 13 to 26 December 2021. Euro Surveill. 2022;27(6):2200042. doi: 10.2807/1560-7917.ES.2022.27.6.2200042 [DOI] [PMC free article] [PubMed] [Google Scholar]
- 2.Rhee C, Baker MA, Kanjilal S, et al. Prospective clinical assessments of hospitalized patients with positive SARS-CoV-2 PCR tests for necessity of isolation. Open Forum Infect Dis. 2021;8(7):ofab194. doi: 10.1093/ofid/ofab194 [DOI] [PMC free article] [PubMed] [Google Scholar]
- 3.Klompas M, Baker MA, Rhee C, et al. A SARS-CoV-2 cluster in an acute care hospital. Ann Intern Med. 2021;174(6):794-802. doi: 10.7326/M20-7567 [DOI] [PMC free article] [PubMed] [Google Scholar]
- 4.Lumley SF, Constantinides B, Sanderson N, et al. ; OUH Microbiology Laboratory; OUH Infection Prevention and Control Team . Epidemiological data and genome sequencing reveals that nosocomial transmission of SARS-CoV-2 is underestimated and mostly mediated by a small number of highly infectious individuals. J Infect. 2021;83(4):473-482. doi: 10.1016/j.jinf.2021.07.034 [DOI] [PMC free article] [PubMed] [Google Scholar]
- 5.Klompas M, Karan A. Preventing SARS-CoV-2 transmission in health care settings in the context of the Omicron variant. JAMA. 2022;327(7):619-620. doi: 10.1001/jama.2022.0262 [DOI] [PubMed] [Google Scholar]
- 6.Baker MA, Rhee C, Tucker R, et al. Rapid control of hospital-based SARS-CoV-2 Omicron clusters through daily testing and universal use of N95 respirators. Clin Infect Dis. Published online February 7, 2022. doi: 10.1093/cid/ciac113 [DOI] [PMC free article] [PubMed] [Google Scholar]
Associated Data
This section collects any data citations, data availability statements, or supplementary materials included in this article.
Supplementary Materials
eTable. Differences in Infection Control Policies Between the 2 Waves