

Abstract
pKa is an important property of a molecule which impacts many fields, such as drug design, catalysis, reactivity, and environmental toxicity. It is often necessary to measure pKa in nonaqueous media due to the poor solubility of an analyte in water, for example, many compounds of pharmaceutical interest. Although NMR methods to measure pKa in water are well established, determining pKa in organic solvents is laborious and problematic. We present an efficient one-shot method to determine the pKa of an analyte in an organic solvent in a single measurement. Diffusion of an acid into a basic solution of the analyte and a set of pH indicators establishes a pH gradient in the NMR tube. The chemical shift of a pH sensitive resonance of the analyte and the pH of the solution are then determined simultaneously as a function of position along the pH gradient by recording a chemical shift image of the NMR tube. The pKa of the analyte is then determined using the Henderson–Hasselbalch equation. The method can be implemented in any laboratory with a gradient equipped NMR high-field spectrometer and is demonstrated for a range of pharmaceutical compounds and inorganic phosphazene bases.
Introduction
The reactivity, conformation,1,2 solubility,3 and toxicity in the environment4 of a molecule can all be influenced by its protonation state. The acid dissociation constant, normally reported as its negative logarithm, pKa, is therefore an important and widely used parameter in catalysis, drug design pharmacology, and chemical synthesis.3,5 pKa is also a vital parameter in proton transfer reactions, self-assembly,6 and host guest chemistry.7 Acid/base catalysis is also used extensively in industrial processes.8−10
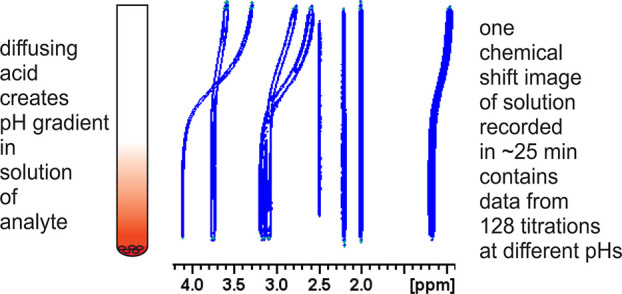
We recently described a one-shot procedure for the determination of pKa in aqueous solution that allows a complete NMR titration to be performed in a single measurement on a single sample in which a pH gradient has been established.11 The method eliminates the labor-intensive preparation of multiple samples of known pH required by traditional NMR based methods by recording a spatially resolved NMR spectrum of a solution of the analyte containing appropriate pH indicators. It is highly efficient both in quantity of sample and of instrument and operator time required.
However, many active pharmaceutical ingredients and drug candidates are too insoluble in water for the precise determination of their pKa in aqueous solution.12,13 Extension of aqueous methods for pKa determination to nonaqueous pKa measurements adds another degree of difficulty. For example, standard pH electrodes that have been designed for potentiometric determinations in aqueous media degrade rapidly in nonaqueous solvents,14 and pH standard solutions in nonaqueous media are not readily available. There is, therefore, significant interest in15,30,31 and need to determine pKa in nonaqueous media.5,16−18
In this paper, we extend our method to determinations in the biologically relevant pKa range in DMSO, an organic solvent commonly used in drug design when determining the pKa of poorly water-soluble drug candidates. The method can, in principle, easily be adapted to other organic and mixed solvent systems and can be implemented in any laboratory with access to a gradient equipped NMR spectrometer. Our sequences can be run under automation using robotic sample changers.
Experimental Section
Experiments were performed in Norell 502 NMR tubes on a Bruker AV-I 400 operating at 400.05 MHz for 1H equipped with a Bruker SampleJet sample changer using a Bruker QNP 1H-19F,31P,13C probe or manually on an AV-II 400 spectrometer operating at 400.20 MHz for 1H using a Bruker TBI 1H,31P;BB probe. Both spectrometers are equipped with a Bruker GRASP II gradient spectroscopy accessory including a CCU board and 10 A single channel current amplifier for a gradient strength up to 50 G/cm. In total, 16 dummy scans were used. A total of 128 increments and 8 scans per increment were acquired with an acquisition time of 1 s and a recycle delay of 0.1 s giving a total image acquisition time of 20 min.
The solid acids used were saccharin, Meldrum’s acid, barbituric acid, salicylic acid, niacin, aspirin, and 2,4-dinitrobenzoic acid, all obtained from Alfa Aesar. Experimentally determined limiting shifts and literature pKas of the indicators used are given in Table S1. Literature pKas of acids used are given in Table S2. Experimentally determined pKas of the indicators used are given in Table S4. The pKa is then determined by least-squares fitting of the data to eq 2, with pKa, δH, and δL as free variables. All solutions were prepared using anhydrous DMSO as 5 mL stock solutions in a N2 purged glovebox. To establish a pH gradient, 2–10 mg of solid acid was placed into the NMR tube and covered with four glass beads. The acid used in each titration is given in the Supporting Information (Sections S5 and S6, Tables S4–10, and titration curves 1–22).
| 1 |
δobs is the observed chemical shift and δH and δL are the fully protonated and fully deprotonated chemical shifts, respectively.
| 2 |
Provided that the amount of acid is in slight excess, this was found to have no effect on the precision of pKadet (section S9). The analyte solution was then carefully layered over the beads and the NMR tube placed in the spectrometer sample changer for the gradient to develop.
The sample changer was not temperature-controlled; the lab temperature was maintained between 18 and 20 °C. This temperature variation had no observable effect on the measurement. The spectrometer probe temperature during collection of the image was maintained at 25 ± 0.2 °C using a Bruker BVT3000 controller. Temperature equilibration occurred during the sample shimming and determination of the water solvent suppression frequency. All measurements were performed in at least duplicate over several months. Furthermore, several images were collected on single samples left in the spectrometer up to 32 h indicating that the precision of the measurements were not affected by differences in gradient equilibration temperatures or temperature equilibration times.
The high viscosity of DMSO solutions means that diffusion is slow; this is advantageous since it results in a wide time window during which useful images can be recorded. Typically, in DMSO useful gradients will be present from 8 to 32 h after addition of the analytical solution, with the optimal time being between 16 and 24 h (see section S8). Results in this paper were recorded after 20–24 h diffusion. Since the total acquisition time of an image is relatively short (∼20–30 min), if desired, the sample can be repeatedly removed from the spectrometer to the autosampler carousel, then replaced in the spectrometer after a further time interval for gradient development and remeasured to ensure an optimal image is obtained. An automation script is included in the Supporting Information.
Images were recorded using the phase encoded pulse sequence of Luy,19 adapted to include WATERGATE suppression of residual solvent resonances20 to yield a 1H NMR spectrum every 0.2 mm along the NMR-active region of the sample. A typical pulse sequence is included in the Supporting Information. A phase encoding gradient pulse of ∼242 μs was used and varied in strength from −27 to 27 G cm–1 in 128 increments. Time domain data files were transformed without zero-filling using sine bell apodization. A 128 slice CSI experiment had a total acquisition time of 20 min.
Chemical shift indicators, compounds of known pKa that exhibit a change in δobs with changing pH, are used to determine the solution pH in NMR titrations using the modified Henderson–Hasselbalch equation, eq 1. Protonated (δH) and deprotonated limiting shift (δL) of the indicator compounds were confirmed by independent measurements in acidified and basic DMSO solutions (sections S3 and S7). All indicators and analytes were assumed to be in fast exchange and were confirmed by observation of each as a single continuous sigmoidal trace in the image. Slow exchanging species display a noncontinuous trace which may still be used if the two peaks can be integrated and averaged, though likely at the cost of some precision in the determination. The tracked resonances of analytes and indicators were selected on the basis of sensitivity to pH and presence in an uncrowded spectral region to minimize overlap with other resonances.
The solution pH at each position along the sample is obtained from the chemical shifts of the NMR pH indicators and eq 1. A plot of δobs of the analyte against pH of the solution yields the titration curve of the analyte, section S6, titration curves 1–22. Typically, 60–80 useful data points for pH and pKa determination are obtained from an image.
Ackerman et al. have reported a detailed description of error determination in NMR titrations (eq 3).21 The uncertainty in the determination of pKa arises primarily from the uncertainty in the limiting chemical shifts and in the pKa values of the pH indicators used. The error in each pH measurement for an individual indicator, ΔpKa, far outweighs the second and third terms in our determinations (ΔδH and ΔδL ≈ 0.001 ppm). A minimum of two indicators are used in each titration; the error for each pH point is then the weighted average of the indicator errors. Error varies through the titration; the largest magnitude error in the indicators’ pKa has therefore been used as the error in the analyte pKa (±0.1 for all titrations).
| 3 |
The error in a single pH point in an NMR titration depends on the precision with which the pKa of the indicator is known and the precision of the measured chemical shift differences.
Results and Discussion
DMSO is widely used as an alternative solvent to water and is often the solvent of choice for medicinal chemists engaged in high-throughput screening of drugs and druglike molecules. It is a relatively inert polar aprotic solvent that can support a wide pH range: DMSO has been used to determine the acidities of trifluoromethanesulfonic acid (0.3)22 and diphenylmethane (32.2).23 DMSO can also be a more pharmacologically relevant solvent compared to water as it better replicates the lipophilic interior of membranes, which drug molecules must penetrate to reach their target.16
DMSO is hygroscopic; therefore, contamination of the sample with water must be considered. Table 1 compares the pKa of benzylamine and imidazole determined using our one-shot method in strictly anhydrous DMSO and in solutions to which 1% and 2% H2O has been added deliberately. No significant effect of water up to 2% by volume is seen, with differences in the values obtained for pKa all being less than the quoted error, demonstrating the utility of the method in a real laboratory setting.
Table 1. pKa Determined in Anhydrous DMSO and in 1% Water and 2% Water DMSO Solutions.
| analyte | pKadet (±0.1) anhydrous | pKadet (±0.1) 1% water | pKadet (±0.1) 2% water |
|---|---|---|---|
| benzylamine | 9.78 | 9.80 | 9.79 |
| imidazole | 6.46 | 6.40 | 6.44 |
To test the precision of the one-shot method in DMSO, the pKas of four basic indicators and two benzoic acids of known pKa were determined and compared with the literature.24
The NMR pH indicators used in the determinations were selected according to four criteria: a known pKa at a useful point in the pH scale, a proton with an observable 1H chemical shift change between δL and δH, a simple NMR spectrum that does not obscure the resonances of the analyte, and finally the indicators must not react with the analyte other than via proton dissociation. Each analyte was matched with a pair of appropriate pH indicators, and the NMR samples allowed to stand in the NMR autosampler while the pH gradient developed. In all cases, ΔpKalit, the differences between our determinations and the literature, is negligible, Table 2.
Table 2. pKa in DMSO (pKadet), Indicators and Acids Used, and the Difference from Literature Values (ΔpKa) for the Analytes.
| analyte | pKadet ± 0.1 | ΔpKalit | indicators | acid |
|---|---|---|---|---|
| 1-methylimidazole | 6.16 | +0.0126 | a, b | i |
| morpholine | 9.01 | +0.0727 | c, d | j |
| benzylamine | 9.78 | –0.0328 | e, f | k |
| diethylamine | 10.42 | +0.0229 | g, f | k |
| 2,4-dinitrobenzoic acid | 6.51 | –0.0130 | h, d | l |
| salicylic acid | 6.78 | –0.0231 | h, b or b, d | l |
| aspirin | 8.68 | d, c | l | |
| niacin | 8.60 | d, c or c, g | l | |
| imidazole | 6.46 | –0.53 to +1.36,32,26,33,34 | a, h | i |
The pKas of niacin and aspirin, for which no literature data in DMSO is available, were next determined. Two sets of indicators (dimethylbenzylamine and triethylamine and triethylamine and benzylamine, Table 2) were used in separate titrations of niacin to test the precision obtainable if a less than optimal choice of pH indicator is made. Despite the insensitivity of the benzylamine reporter resonances at a low pH, the results of the two titrations are in good agreement, showing that even with a single indicator, precise pKa data can be obtained (section S6, titration curves 18 and 19). The most similar compound to aspirin for which pKa data in DMSO is available is 2-acetamidobenzoic acid (pKa = 8.2 ± 0.1)25 in which the conjugate base is stabilized by an intramolecular hydrogen bond between the carboxylate and the amide proton. Deprotonation of 2-acetamidobenzoic acid is therefore expected to be more favorable than deprotonation of aspirin which does not possess a stabilizing internal hydrogen bond in its conjugate base. This expectation is borne out by our determined pKa of aspirin (8.68 ± 0.1).
A large range of values (5.1–6.94) has previously been reported for the pKa of imidazole (pKaimid) in DMSO. By our method we obtain a value of 6.46 ± 0.1, last row, Table 1. To further test the reliability and precision of our method, we have redetermined the pKas of 1-methylimidazole and salicylic acid using imidazole as the pH indicator. Table 3 compares the values for the pKa of 1-methylimidazole and salicylic acid obtained using our value and each value reported in the literature for pKa. Excellent agreement between the pKas of the two analytes and their literature values is only obtained using our value of pKaimid = 6.46. This consistency gives us confidence both in the precision of the method and in our determination of pKa.
Table 3. Comparison of pKas of 1-Methylimidazole and Salicylic Acid Determined Using the Various Literature Values for pKaimid.
Ionic strength is known to influence the observed pKa. It is usual therefore to conduct pKa titrations at constant ionic strength and extrapolate to infinite dilution using a correction to obtain a thermodynamic pKa.37 In a one-shot titration, such corrections are potentially problematic since the concentration of the charged species varies continuously throughout the solution. Fortuitously, using the thermodynamic pKa values of the indicators is expected to return the thermodynamic pKa values of the analyte directly, provided the analyte and indicators have the same charges as each other in their protonated/deprotonated states.
This is because the Davies-type correction for ionic strength considers only the charge and number of charged species present which does not change. In this situation, the corrections required to the pKa of the indicator and to the pKa of the analyte cancel (see the Supporting Information section S4). Inspection of Table 2 reveals that, in practice, accurate pKa values are returned for both the amine and carboxylic acid analytes studied. We conclude that, at the ionic strengths encountered in this work in DMSO (0.01 to 0.05 M), formal ionic strength corrections are not required. The ionic strength at the midpoint of each titration is provided in the Supporting Information (section S5, Tables S4–S10) since the pKa determination by NMR is most sensitive to ionic strength where pH ≈ pKa.21,38
To probe the effect of higher ionic strengths, titrations to determine the pKas of morpholine and 1-methylimidazole were performed with 0.1 and 0.2 M LiCl background electrolyte, Table 4. These analytes possess the same charges upon protonation/deprotonation as the indicators and so their pKa values are affected equally by ionic strength. No appreciable effect on the determined pKa was observed, with the variance in pKa being less than 0.1 pKa units (0.06). IUPAC guidelines39 confirm that NMR titrations with variable ionic strength are acceptable if chemical shifts are shown to be unaffected by ionic strength, which is consistent with the findings of Tynkkyen et al.38 and Wallace et al.11 We have confirmed that the limiting shifts of 2,6-lutidine, dimethylbenzylamine, and triethylamine are unaffected by ionic strength (section S7).
Table 4. Comparison of the pKa Determined by the One-Shot Method in DMSO Solution with No Background Electrolyte, 0.1 M LiCl, and 0.2 M LiCl.
| analyte | pKadet (±0.1) no electrolyte | pKadet (±0.1) 0.1 M LiCl | pKadet (±0.1) 0.2 M LiCl |
|---|---|---|---|
| morpholine | 9.01 | 9.03 | 8.97 |
| 1-methylimidazole | 6.16 | 6.14 | 6.17 |
The method is not limited to compounds of pharmaceutical interest but is also effective in determining the pKa of compounds outside the biological pKa range.
Cyclotriphosphazenes, Figure 1, are water insoluble inorganic bases that have first pKas spanning the range 4–12 which find application as phase transfer catalysts for reactions in organic solvents40 and as building blocks for supramolecular assemblies.41
Figure 1.

Hexa-aminocyclotriphosphazene. See Table 5 for substituent R.
Protonation of cyclotriphosphazenes occurs exclusively at the ring nitrogens.42 The mono- and diprotonation reactions show distinct chemical shift changes allowing pKa1 = 11.65 and pKa < 4 of IPPN to be studied.
Feakins et al. found the second protonation of these bases to be considerably less favorable than the first, pKa1 being around 10 units greater than pKa in nitrobenzene.43 In this work, the acidic diffusants were chosen to avoid multiple protonation and to span as narrow a pH range as possible, allowing us to focus on pKa1, Table 5. The pKas of IPPN and hexa-benzylamino cyclotriphosphazene (BnPN) follow the trend in basicity identified by Feakins,43 i.e., that hexa-amino cyclotriphosphazenes have similar basicity to the parent amine. Hexa-morpholino cyclotriphosphazene (morphPN) however does not follow this trend, having a much lower pKa than morpholine (4.22 vs 8.94). This may be due to steric blocking of the phosphazene ring nitrogen protonation sites by the morpholine rings which do not have the flexibility of the pendant benzyl or isopropyl groups in IPPN and BnPN.
Table 5. pKa Values for Three Hexa-amino Cyclotriphosphazenes and the Indicators and Acid Used in Each Titration.
| analyte | pKadet (±0.1) | indicators | acid |
|---|---|---|---|
| IPPN (R = NHiPr) | 11.65 | dea, pyr | barbituric |
| BnPN (R = NHBn) | 9.80 | mor,a dea | barbituric |
| morphPN (R = N(CH2CH2)2O) | 4.22 | lut, izl | saccharin |
Morpholine.27
Conclusions
An efficient one-shot NMR titration method for pKa determination in DMSO has been shown to be applicable to acids and bases. The method gives precise results, agreement with literature values being within ±0.1 pKa units for both acidic and basic analytes. The method is robust and insensitive to ionic strength (up to 0.2 M) and water contamination (up to 2%) and opens the door to similar pKa determination methods in other nonaqueous and mixed solvent systems. The method has wide applicability and is already being adopted in commercial drug discovery programs.
Acknowledgments
J.A.I. thanks the EPSRC for financial support, Grants EP/F000316/1 and EP/C005643/1. G.S. thanks the EPSRC for a studentship Grant EP/N509693/1. M.W. thanks the Royal Commission for the Exhibition of 1851 for a Research Fellowship and UKRI for a Future Leaders Fellowship (Grant MR/T044020/1). K.B. thanks AstraZeneca (Grant 10045297) and the University of Liverpool for financial support. We thank Miss Megan Carr for experimental assistance.
Supporting Information Available
The Supporting Information is available free of charge at https://pubs.acs.org/doi/10.1021/acs.analchem.2c00200.
Author Contributions
The manuscript was written through contributions of all authors. All authors have given approval to the final version of the manuscript.
The authors declare no competing financial interest.
Notes
Raw experimental data is available at DOI: 10.17638/datacat.liverpool.ac.uk/1678.
Supplementary Material
References
- Young J. A. T.; Collier R. J. Anthrax Toxin: Receptor Binding, Internalization, Pore Formation, and Translocation. Annu. Rev. Biochem. 2007, 76 (1), 243–265. 10.1146/annurev.biochem.75.103004.142728. [DOI] [PubMed] [Google Scholar]
- Sakurai K.; Goto Y. Principal component analysis of the pH-dependent conformational transitions of bovine β-lactoglobulin monitored by heteronuclear NMR. Proc. Natl. Acad. Sci. U. S. A. 2007, 104 (39), 15346–15351. 10.1073/pnas.0702112104. [DOI] [PMC free article] [PubMed] [Google Scholar]
- Manallack D. T. The pKa distribution of drugs: application to drug discovery. Perspect. Med. Chem. 2007, 1, 25–38. [PMC free article] [PubMed] [Google Scholar]
- Roggatz C. C.; Fletcher N.; Benoit D. M.; Algar A. C.; Doroff A.; Wright B.; Wollenberg Valero K. C.; Hardege J. D. Saxitoxin and tetrodotoxin bioavailability increases in future oceans. Nat. Clim. Change 2019, 9 (11), 840–844. 10.1038/s41558-019-0589-3. [DOI] [Google Scholar]
- Dardonville C. Automated techniques in pKa determination: Low, medium and high-throughput screening methods. Drug, Discovery Today Technol. 2018, 27, 49–58. 10.1016/j.ddtec.2018.04.001. [DOI] [PubMed] [Google Scholar]
- Du X.; Zhou J.; Shi J.; Xu B. Supramolecular Hydrogelators and Hydrogels: From Soft Matter to Molecular Biomaterials. Chem. Rev. 2015, 115 (24), 13165–13307. 10.1021/acs.chemrev.5b00299. [DOI] [PMC free article] [PubMed] [Google Scholar]
- Beer P. D.; Gale P. A. Anion Recognition and Sensing: The State of the Art and Future Perspectives. Angew. Chem., Int. Ed. 2001, 40 (3), 486–516. 10.1002/1521-3773(20010202)40:3<486::AID-ANIE486>3.0.CO;2-P. [DOI] [PubMed] [Google Scholar]
- Kresge A. The Brønsted relation–recent developments. Chem. Soc. Rev. 1973, 2 (4), 475–503. 10.1039/CS9730200475. [DOI] [Google Scholar]
- Tanabe K.; Hölderich W. F. Industrial application of solid acid–base catalysts. Appl. Catal., A 1999, 181 (2), 399–434. 10.1016/S0926-860X(98)00397-4. [DOI] [Google Scholar]
- Busca G. Acid Catalysts in Industrial Hydrocarbon Chemistry. Chem. Rev. 2007, 107 (11), 5366–5410. 10.1021/cr068042e. [DOI] [PubMed] [Google Scholar]
- Wallace M.; Adams D. J.; Iggo J. A. Titrations without the Additions: The Efficient Determination of pKa Values Using NMR Imaging Techniques. Anal. Chem. 2018, 90 (6), 4160–4166. 10.1021/acs.analchem.8b00181. [DOI] [PubMed] [Google Scholar]
- Cox B. Introduction. In Acids and Bases: Solvent Effects on Acid-Base Strength; Oxford University Press: Oxford, U.K., 2013. [Google Scholar]
- Lipniski C. Molecular Drug Properties: Measurement and Prediction. In Methods and Principles in Medicinal Chemistry; Mannhold R., Ed.; Wiley-VCH: Weinheim, Germany, 2008; Vol. 37, pp 257–283. [Google Scholar]
- Thermo Fisher Scientific Water Analysis Instruments. Measuring pH of Non-Aqueous and Mixed Samples, Application Note 007; 2014.
- Kütt A.; Selberg S.; Kaljurand I.; Tshepelevitsh S.; Heering A.; Darnell A.; Kaupmees K.; Piirsalu M.; Leito I. pKa values in organic chemistry – Making maximum use of the available data. Tetrahedron Lett. 2018, 59 (42), 3738–3748. 10.1016/j.tetlet.2018.08.054. [DOI] [Google Scholar]
- Rossini E.; Bochevarov A. D.; Knapp E. W. Empirical Conversion of pKa Values between Different Solvents and Interpretation of the Parameters: Application to Water, Acetonitrile, Dimethyl Sulfoxide, and Methanol. ACS Omega 2018, 3 (2), 1653–1662. 10.1021/acsomega.7b01895. [DOI] [PMC free article] [PubMed] [Google Scholar]
- Pracht P.; Grimme S. Efficient Quantum-Chemical Calculations of Acid Dissociation Constants from Free-Energy Relationships. J. Phys. Chem. A 2021, 125 (25), 5681–5692. 10.1021/acs.jpca.1c03463. [DOI] [PubMed] [Google Scholar]
- Yang Q.; Li Y.; Yang J.-D.; Liu Y.; Zhang L.; Luo S.; Cheng J.-P. Holistic Prediction of the pKa in Diverse Solvents Based on a Machine-Learning Approach. Angew. Chem., Int. Ed. 2020, 59 (43), 19282–19291. 10.1002/anie.202008528. [DOI] [PubMed] [Google Scholar]
- Trigo-Mouriño P.; Merle C.; Koos M. R. M.; Luy B.; Gil R. R. Probing Spatial Distribution of Alignment by Deuterium NMR Imaging. Chem.—Eur. J. 2013, 19 (22), 7013–7019. 10.1002/chem.201300254. [DOI] [PubMed] [Google Scholar]
- The pulse sequences used are available from the authors.
- Ackerman J. J. H.; Soto G. E.; Spees W. M.; Zhu Z.; Evelhoch J. L. The NMR chemical shift pH measurement revisited: Analysis of error and modeling of a pH dependent reference. Magn. Reson. Med. 1996, 36 (5), 674–683. 10.1002/mrm.1910360505. [DOI] [PubMed] [Google Scholar]
- McCallum C.; Pethybridge A. D. Conductance of acids in dimethyl-sulfoxide—II. Conductance of some strong acids in DMSO at 25°C. Electrochim. Acta 1975, 20 (11), 815–818. 10.1016/0013-4686(75)87002-2. [DOI] [Google Scholar]
- Bordwell F. G. Equilibrium acidities in dimethyl sulfoxide solution. Acc. Chem. Res. 1988, 21 (12), 456–463. 10.1021/ar00156a004. [DOI] [Google Scholar]
- Titrations were also performed on a series of benzoic acids without ortho groups (benzoic acid, m-toluic acid, and p-chlorobenzoic acid), section S6, curves 1–22.
- Emenike B. U.; Liu A. T.; Naveo E. P.; Roberts J. D. Substituent Effects on Energetics of Peptide-Carboxylate Hydrogen Bonds as Studied by 1H NMR Spectroscopy: Implications for Enzyme Catalysis. J. Org. Chem. 2013, 78 (23), 11765–11771. 10.1021/jo401762m. [DOI] [PubMed] [Google Scholar]
- Benoit R. L.; Boulet D.; Séguin L.; Fréchette M. Protonation of purines and related compounds in dimethylsulfoxide and water. Can. J. Chem. 1985, 63 (6), 1228–1232. 10.1139/v85-209. [DOI] [Google Scholar]
- Um I.-H.; Lee E.-J.; Jeon S.-E. Effect of solvent on reactivity and basicity: aminolyses of p-nitrophenyl acetate in H2O and in DMSO. J. Phys. Org. Chem. 2002, 15 (8), 561–565. 10.1002/poc.483. [DOI] [Google Scholar]
- Bowden K.; Hirani S. I. J. The acidity of weak carbon acids. Part 5. The kinetic acidities of substituted benzyl cyanides using substituted benzylamines as bases. J. Chem. Soc., Perkin Trans. 2 1990, (11), 1889–1891. 10.1039/p29900001889. [DOI] [Google Scholar]
- Bowden K.; Nadvi N. The Acidity of Weak Carbon Acids. Part 3. The Kinetic Activities of Substituted Benzyl Cyanides using Secondary Aliphatic Amines and Guanidines as Bases. J. Chem. Res., Miniprint 1990, (10), 2473–2481. [Google Scholar]
- Kolthoff I. M.; Chantooni M. K. Substituent effects on dissociation of benzoic acids and heteroconjugation of benzoates with p-bromophenol in acetonitrile, N,N-dimethylformamide, and dimethyl sulfoxide. Intramolecular hydrogen bonding in o-hydroxybenzoic acids and their anions. J. Am. Chem. Soc. 1971, 93 (16), 3843–3849. 10.1021/ja00745a001. [DOI] [Google Scholar]
- Kolthoff I. M.; Chantooni M. K.; Bhowmik S. Dissociation constants of uncharged and monovalent cation acids in dimethyl sulfoxide. J. Am. Chem. Soc. 1968, 90 (1), 23–28. 10.1021/ja01003a005. [DOI] [Google Scholar]
- Neuvonen H.; Neuvonen K. Investigation of the applicability of cis-urocanic acid as a model for the catalytic Asp–His dyad in the active site of serine proteases based on 1H NMR hydrogen bonding studies and spectroscopic pKa measurements. J. Chem. Soc., Perkin Trans. 2 1998, (7), 1665–1670. 10.1039/a708832i. [DOI] [Google Scholar]
- Crampton M. R.; Robotham I. A. Acidities of Some Substituted Ammonium Ions in Dimethyl Sulfoxide. J. Chem. Res., Synop. 1997, (1), 22–23. 10.1039/a606020j. [DOI] [Google Scholar]
- Kozak A.; Czaja M.; Chmurzyński L. Investigations of (acid+base) equilibria in systems modelling interactions occurring in biomolecules. J. Chem. Thermodyn. 2006, 38 (5), 599–605. 10.1016/j.jct.2005.07.013. [DOI] [Google Scholar]
- Benoit R. L.; Fréchette M.; Lefebvre D. 2,6-Di-tert-butylpyridine: an unusually weak base in dimethylsulfoxide. Can. J. Chem. 1988, 66 (5), 1159–1162. 10.1139/v88-190. [DOI] [Google Scholar]
- Ritchie C. D.; Lu S. Proton transfers among oxygen and nitrogen acids and bases in dimethyl sulfoxide solution. J. Am. Chem. Soc. 1990, 112 (21), 7748–7756. 10.1021/ja00177a040. [DOI] [Google Scholar]
- Cox B. Determination of Dissociation Constants. In Acids and Bases: Solvent Effects on Acid-Base Strength; Oxford University Press: Oxford, U.K., 2013. [Google Scholar]
- Tynkkynen T.; Tiainen M.; Soininen P.; Laatikainen R. Anal. Chim. Acta 2009, 648, 105. 10.1016/j.aca.2009.06.047. [DOI] [PubMed] [Google Scholar]
- Popov K.; Rönkkömäki H.; Lajunen L. H. J. Pure Appl. Chem. 2006, 78, 663. 10.1351/pac200678030663. [DOI] [Google Scholar]
- Craven M.; Yahya R.; Kozhevnikova E. F.; Robertson C. M.; Steiner A.; Kozhevnikov I. V. Alkylaminophosphazenes as Efficient and Tuneable Phase-Transfer Agents for Polyoxometalate-Catalysed Biphasic Oxidation with Hydrogen Peroxide. ChemCatChem. 2016, 8 (1), 200–208. 10.1002/cctc.201500922. [DOI] [Google Scholar]
- Steiner A. Supramolecular Structures of Cyclotriphosphazenes. In Polyphosphazenes for Biomedical Applications; Andrianov A. K., Ed.; John Wiley & Sons, Incorporated: Hoboken, NJ, 2009; pp 411–454. [Google Scholar]
- Allcock H. R. Recent advances in phosphazene (phosphonitrilic) chemistry. Chem. Rev. 1972, 72 (4), 315–356. 10.1021/cr60278a002. [DOI] [Google Scholar]
- Feakins D.; Last W. A.; Shaw R. A. 855. Structure and basicity. Part II. The basicity of fully aminolysed cyclotriphosphazatrienes and cyclotetraphosphazatetraenes in nitrobenzene and water. J. Chem. Soc. 1964, (0), 4464–4471. 10.1039/jr9640004464. [DOI] [Google Scholar]
Associated Data
This section collects any data citations, data availability statements, or supplementary materials included in this article.