
Fig. 3.
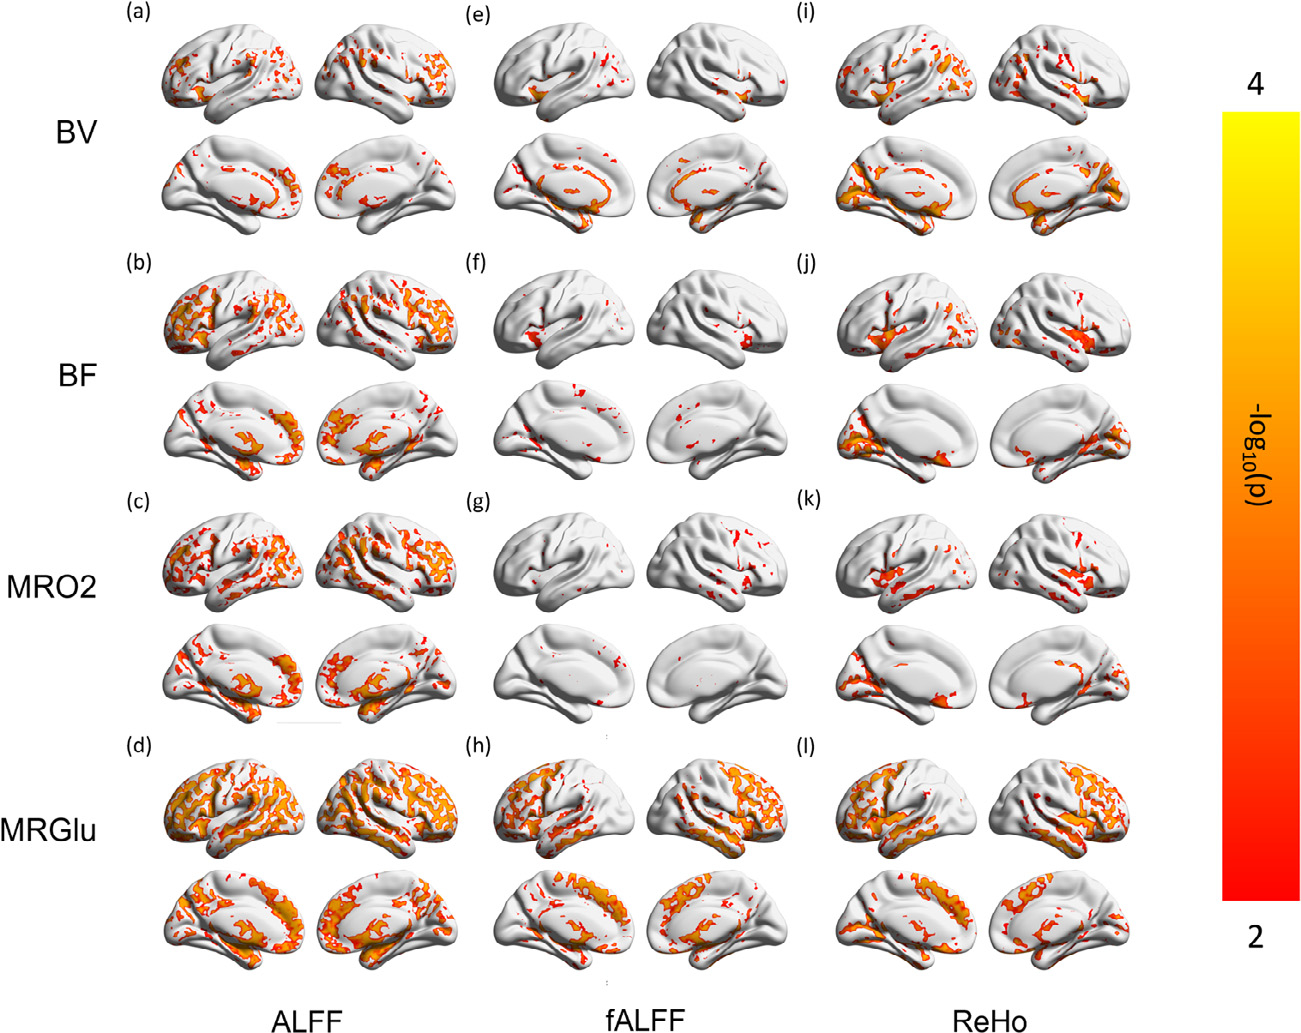
Regions Showing Different Regional Contrast in the Voxel-wise BOLD-PET Paired Comparisons.
Maps from individual subjects in each modality are z-normalized as Fig. 2, maintaining regional contrast, and compared pair-wise, resulting in voxel-wise p maps. Scale of the color bar before negative log transform is (0.0001, 0.01). Regions of gray color do not have significantly different values (z-normalized), indicating the spatial contrast are not significantly different.