Abstract
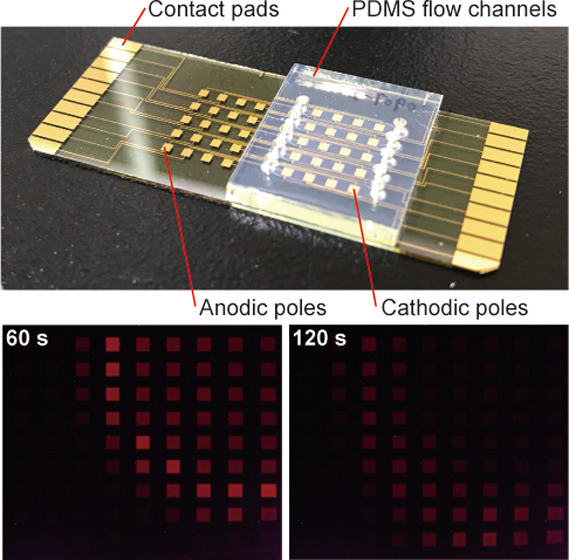
Bipolar electrodes (BPEs) with arrays of cathodic and anodic poles were developed for use in closed bipolar systems. To increase the number of BPEs in the array, the anodic and cathodic poles were connected with each other using thin leads. A further increase in the number of BPEs was achieved by forming the cathodic and anodic poles of the BPEs and the leads in different layers. A device with 9 × 10 arrays of cathodes and anodes was thus realized. When using this device to sense hydrogen peroxide (H2O2), the sensitivity and linear range of calibration plots could be adjusted by changing the driving voltage and the area ratio between the cathodic and anodic poles. The devices were used to image H2O2 and obtain time-lapse images for the diffusion and dilution of H2O2. Furthermore, DNA detection was demonstrated using an electroactive intercalator. The sensitivity could be improved by making the anodic poles smaller with respect to the cathodic pole and concentrating the electrochemiluminescence (ECL) in a small area. The ECL intensity changed according to the target DNA concentration in the solution.
1. Introduction
There is an increasing demand for the imaging and multiplexed detection of molecules related to cellular functions. For this purpose, devices based on electrochemical principles have advantages with regard to miniaturization, integration, and batch fabrication as well as high sensitivity.1 A straightforward approach to miniaturizing and integrating a large number of sensing elements is to simply use more individual components such as three-electrode systems.2,3 However, this results in a larger number of contact pads to be connected to the external instrument. To solve this problem, electrodes with the same roles can be connected by common leads and arranged in the form of a matrix.4−6 Although this method significantly reduces the number of contact pads (from the product of rows and columns to their sum), it still has limitations. Eventually, a much larger number of sensing elements (e.g., hundreds, thousands, or more) and the signal processing circuits may be all integrated using the CMOS technology.7−9 However, when the system contains easily degraded parts (such as biomaterials) or when disposable devices are desired, the high fabrication cost of the CMOS technology is unfavorable.
Bipolar electrochemistry is an attractive solution to the aforementioned problems.10−13 Bipolar electrochemical systems contain one or more electrically isolated strips of electrodes called the bipolar electrodes (BPEs). In the initial development stage, open bipolar systems with the BPEs immersed in a single solution were mainly used (Figure 1A). When a voltage is applied between two driving electrodes immersed in the solution, a potential gradient is generated. The potential differences generated at the interface between the solution and the BPE polarize the two ends of the BPE to work as the cathode and the anode. Because the BPEs are not connected to external instruments, the redox reaction on one pole related to detection is reported via electrochemiluminescence (ECL) on the other pole. Open bipolar systems are advantageous in integrating a large number of BPEs.14 However, electroactive materials that may react on the anodic and/or cathodic poles of the BPE coexist in the same solution, which could influence the output signal. To address this issue, closed bipolar systems with the cathodic and anodic poles immersed in different solutions are widely used now (Figure 1B). Although the open and closed bipolar systems only differ structurally by a wall that separates the two solutions, they have quite dissimilar working principles. In a closed bipolar system, the relationship between the driving voltage, E, and the potentials of the driving electrodes and the poles of the BPE with respect to the solution they contact is expressed by Kirchhoff’s second law as follows, when the ohmic drop in the solutions can be neglected
here, Δφ(D1), Δφ(D2), Δφ(C), and Δφ(A) are the potentials of the driving electrodes 1 and 2, the cathodic pole, and the anodic pole with respect to the solution, respectively.
Figure 1.
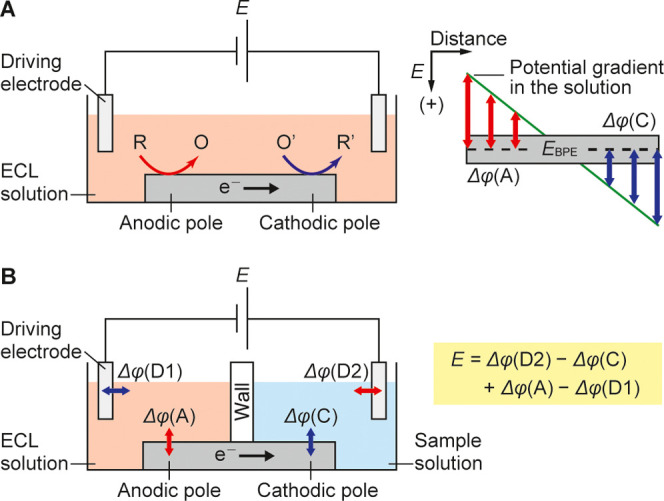
Schematic diagram and working principles of (A) open and (B) closed bipolar electrochemical systems. The figure on the right side of panel A illustrates the relation between the potential gradient in the solution and the polarization in different parts of the BPE.
Compared with the open bipolar system, there is a limitation in the number of integrated BPEs in the closed bipolar system because of the presence of the wall that separates two solutions. Indeed, previous closed bipolar systems for multiplexed detection integrated only a limited number of BPEs.15−22 Nevertheless, to realize high-density BPE arrays, bundles of insulated fibers or pores in a membrane were used to form a large number of tiny BPEs, and the resultant device was used to demonstrate chemical imaging.23−26 However, this type of system has not been used in applications other than imaging, and batch fabrication and simplification of the entire measurement setup are also the remaining issues. A reason for the limitations in multiplexed detection using closed bipolar systems with a small number of BPEs lies in the use of simple strips of rectangular BPEs. The cathodic and anodic poles are the critical parts for redox reactions, while the part between them merely functions as a conductor to pass electrons. Therefore, as long as the connecting parts can pass electrons without any problems, their layout may be optimized to further increase the number of integrated BPEs.
In this study, we fabricated a closed bipolar system with BPE arrays consisting of a matrix of cathodic and anodic poles connected with leads for chemical imaging and multiplexed sensing. The system was successfully used for imaging hydrogen peroxide (H2O2) and multiplexed detection of DNA.
2. Experimental Section
2.1. Reagents and Materials
All reagents and materials used for fabricating and characterizing the devices were obtained from commercial sources: glass wafers (TEMPAX Float; diameter: 3 inch; thickness: 500 μm) from Schott Japan (Tokyo, Japan); positive photoresist (S1818G) from Dow Chemical (Midland, MI); polyimide precursor solution (SP-341) from Toray Industries (Tokyo, Japan); poly(dimethylsiloxane) (PDMS; KE-1300T) and curing agent (CAT1300) from Shin-Etsu Chemical (Tokyo, Japan); platinum wire (diameter: 0.5 mm) from Nilaco (Tokyo, Japan); tris (2,2′-bipyridyl) dichloro-ruthenium(II) hexahydrate (Ru(bpy)3Cl2·6H2O), buffer of tris(hydroxyethyl) aminomethane (Tris), ethylenediaminetetraacetic acid (EDTA) (TE buffer, pH 7.4), 6-mercapto-1-hexanol (MCH), and methylene blue (MB) from Sigma-Aldrich Japan (Tokyo, Japan); tri-n-propylamine (TPA) and other reagents from Wako Pure Chemical Industries (Osaka, Japan). All chemicals were reagent grade. Deionized Milli-Q water (18.2 MΩ cm; Millipore, Billerica, MA) was used to prepare all solutions.
Single-stranded probe DNA (pDNA) and target DNA (tDNA) were obtained from Eurofins Genomics (Tokyo, Japan) with the following sequences:
pDNA: 5′-SH-C6-GCA TCG TAA GTC GTC AGT CAG CTA-3′
tDNA: 5′-TAG CTG ACT GAC GAC TTA CGA TGC-3′
Solutions containing pDNA, MCH, or tDNA were prepared with TE buffer (pH 7.4) containing 10 mM tris, 1 mM EDTA, and 100 mM NaCl. An MB solution (100 μM) was prepared with 50 mM phosphate buffer solution (PBS) at pH 7.4 containing 100 mM KNO3.
2.2. Structure and Fabrication of Bipolar Electrode Array
Structures of the fabricated BPE arrays and the experimental setup are shown in Figure 2. The BPEs were fabricated using a thin-film process, and the details are described in the Supporting information. Platinum BPEs were used for basic characterization and imaging, whereas gold BPEs were used for immobilizing pDNA strands. Each BPE consisted of square areas for the cathodic and anodic poles and a lead that connects them. The width of the lead was 70 μm for all BPEs.
Figure 2.
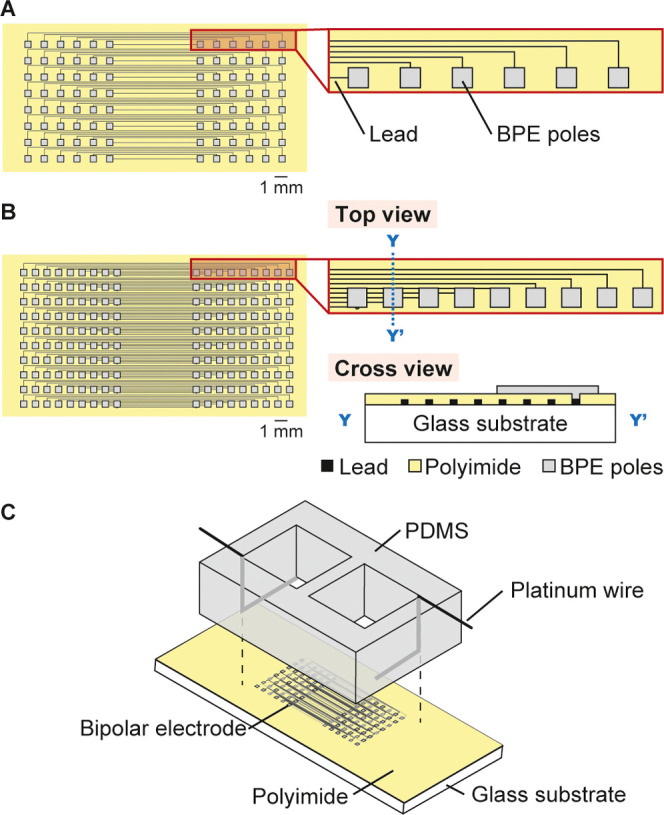
Devices with an array of BPEs. Electrode layouts of (A) type I device with arrays of 6 × 8 cathodic and anodic poles and (B) type II device with arrays of 9 × 10 cathodic and anodic poles. Cross section along the Y–Y′ line is shown on the bottom right of panel B. (C) Experimental setup with the BPEs on a glass substrate and PDMS chambers with driving electrodes placed atop the glass substrate.
We fabricated two types of devices named types I and II. In the type I device (Figure 2A), the cathodic and anodic poles and leads were formed on the same glass plane. Areas other than the anodic and cathodic poles were insulated with a polyimide layer. Platinum and gold BPEs were formed using arrays of 4 × 5 and 6 × 8 cathodic and anodic poles, respectively. Dimensions of the cathodic and anodic poles were generally 500 μm × 500 μm. BPEs with different cathode and anode areas were also fabricated (Figure S1), which will be discussed later. For the gold BPEs, dimensions of the cathodic and anodic poles were 1000 μm × 1000 μm and 100 μm × 100 μm, respectively.
In the type II device (Figure 2B), the arrays of the cathodic and anodic poles and the leads were formed in different layers. First, only the leads were formed on the glass substrate, and then the polyimide insulating layer was formed. The insulating layer was opened at the ends of the leads for the corresponding cathodic and anodic poles. Then, square patterns that will function as the cathodic and anodic poles were formed to cover the exposed lead areas and establish electrical connections (Figure S2). Only platinum BPEs were used for type II devices, and the dimensions of the cathodic and anodic poles were 500 μm × 500 μm.
2.3. Fabrication of the Chamber and Construction of the Setup
A PDMS chamber (height: 10 mm) was formed by replica molding, and the details are described in the Supporting information. The chamber was placed on the glass substrate with BPEs and slightly pressed for fixing (Figure 2C). The arrays of anodic and cathodic poles were exposed in the chamber. Platinum wires (diameter: 0.5 mm) serving as the driving electrodes were fixed at the longitudinal ends of the chamber using a polyimide tape. The ECL chamber was then filled with 50 mM PBS (pH 7.4) containing 5 mM Ru(bpy)32+, 25 mM TPA, and 100 mM KNO3 as a supporting electrolyte. The sensing chamber was filled with 50 mM PBS (pH 7.4) containing the analyte to be detected and 100 mM KNO3.
2.4. Detection of ECL
The device with the BPEs and PDMS chamber was placed in the dark, and a constant voltage was applied between the two driving electrodes using a DC power supply (PMX110-0.6A, Kikusui Electronics, Kanagawa, Japan). ECL was captured with a CCD camera (VB-7010, Keyence, Osaka, Japan) attached to a fluorescence stereomicroscope (VB-G25, Keyence, Osaka, Japan). The sensitivity and exposure time of the camera were, respectively, set at ISO 200 and 60 s for multiplexed sensing and H2O2 imaging, while they were set at ISO 1600 and 30 s for DNA sensing. ECL intensity data were extracted with ImageJ (NIH) from a single pixel at the center of the related anodic poles in the captured photograph.
2.5. Modification of BPE Arrays for DNA Detection
A type I device with gold BPEs was used for DNA detection. To clean the surface of the BPEs, chips with BPEs were immersed for 10 min in a solution containing 50 mM KOH and 30% H2O2 (w/w). Then, the surface of the cathodic poles was cleaned by scanning 90 cycles at potentials between −1.0 and +1.2 V (vs Ag/AgCl) at a scan rate of 1.0 V/s in a solution containing 100 mM KNO3 and 10 mM K3[Fe(CN)6] until the shape of the voltammogram stabilized.
To modify the surface of BPEs, a piece of PDMS with five straight flow channels (height: 100 μm) was attached to the cathode side of the BPEs (Figure S3). The flow channels were used to accommodate solutions containing pDNA, MCH, or tDNA. The surface of cathodic poles was first kept in a 20 μM solution of thiolated single-stranded pDNA overnight and then in 1.0 mM MCH for 1 h, forming a self-assembled monolayer containing pDNA and MCH on the surface. MCH was used to block the surface of the gold electrode.27,28 After each step, the PDMS flow channels were removed, and the BPEs were rinsed with pure water and dried with nitrogen gas.
For the hybridization of pDNA and tDNA, the PDMS flow channels were again attached to the glass substrate with BPEs after pDNA modification. Then, standard solutions containing tDNA were injected into the flow channels and incubated for 2 h. Then, the flow channels were removed, and the BPEs were rinsed with pure water to remove excess tDNA. Next, the BPEs were immersed in a 100 μM MB solution and incubated for 1 h. The BPEs were rinsed with pure water and then used in the experiments. The whole procedure was performed at room temperature.
2.6. Characterization Using the Three-Electrode System
Immobilization and hybridization of DNAs were first examined using one of the cathodic poles as the working electrode in a conventional three-electrode system (Figure S4). The PDMS chamber shown in Figure 2C was attached to the glass substrate with BPEs, and only the cathodic chamber was filled with 50 mM PBS containing 100 mM KNO3 (pH 7.4). A commercial liquid-junction Ag/AgCl reference electrode (2060A-10T, Horiba; Kyoto, Japan) was inserted into the solution. The internal solution of the Ag/AgCl electrode was 3.0 M KCl. The platinum wire fixed at the end of the PDMS chamber was used as the auxiliary electrode.
2.7. Detection of tDNA
ECL from the BPEs with hybridized pDNA and tDNA on the cathodic poles was detected using the setup mentioned earlier in Figure 2C. The anodic chamber was filled with the ECL solution, whereas the cathodic chamber was filled with 50 mM PBS (pH 7.4) containing 100 mM KNO3.
3. Results and Discussion
3.1. Multiplexed Sensing and Imaging of H2O2
In the fabricated devices, the cathodic and anodic poles were connected with 70 μm wide lead patterns of different lengths. Table S1 summarizes the measured resistances of the shortest and longest leads used in type I and II devices. Even with the longest leads, the resistance was approximately 300 Ω. In contrast, the current flowing through a lead was anticipated to be on the order of a few μA, as per our previous results obtained using BPEs with cathodic and anodic poles of similar sizes.29 Therefore, the ohmic drop at the leads was expected to be negligible. To confirm this, we filled the sensing chamber of a type I device with a 4 × 5 array with 50 mM PBS (pH 7.4) containing 100 mM KNO3 and examined the ECL generated following the reduction of dissolved oxygen on the cathodic poles. The ECL images obtained at two different driving voltages are shown in Figure S5. Uniform ECL was observed from all anodic poles, although the length of leads in the device ranged from 5.7 to 22.5 mm. This result demonstrates that the conductivity of 70 μm wide leads is sufficient and that the lead length only has negligible influence.
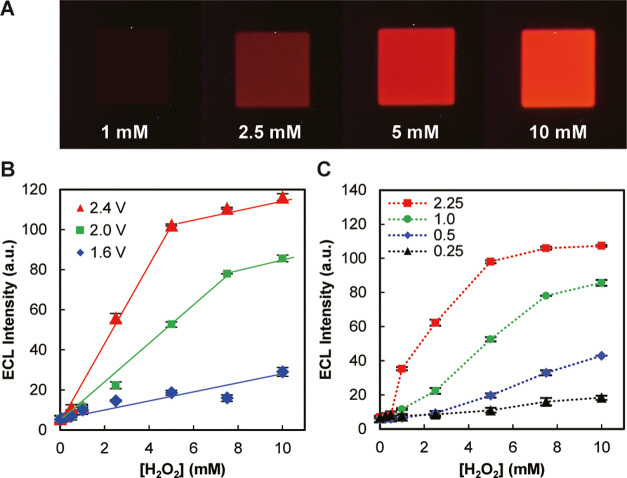
Another type I device with the same cathodic and anodic areas (1000 μm × 1000 μm) was then used to detect H2O2 in standard solutions of different concentrations. Figure 3A shows ECL images obtained with 1, 2.5, 5, and 10 mM H2O2. Under a fixed driving voltage, the ECL became brighter with the increase in H2O2 concentration. Figure 3B shows the dependence of ECL intensity on the H2O2 concentration at various applied voltages. An enhanced sensitivity was clearly observed upon increasing the driving voltage, and the ECL intensity increased linearly at lower concentrations. The ECL intensity tends to become saturated because the ECL reaction on the anodic pole becomes rate-limiting at higher H2O2 concentrations.
Figure 3.
Device response to H2O2. (A) ECL images obtained with 1, 2.5, 5, and 10 mM H2O2. Driving voltage: 2.4 V. (B) Dependence of ECL intensity on H2O2 concentration obtained at different driving voltages (1.6, 2.0, and 2.4 V). (C) Dependence of ECL intensity on H2O2 concentration obtained with different area ratios of cathodic and anodic poles (Ac/Aa = 0.25, 0.5, 1, and 2.25). Driving voltage: 2.0 V. The symbols and error bars in B (n = 9) and C (n = 3) indicate, respectively, the means and standard deviations of ECL intensities, which were measured experimentally from separate anodic poles in the same device under the designated conditions.
The above experiments used an array of BPEs with cathodic and anodic poles having the same area. When the device is used to not only detect the target analyte but also measure its concentration, it is important to know which side of the poles is rate-limiting. To check this influence, BPEs with cathodic poles of different areas were used (Figure S1), while the area of the anodic poles was fixed (1000 μm × 1000 μm), and the results are shown in Figure 3C. At an area ratio of Ac/Aa = 1 (Ac and Aa are the areas of cathodic and anodic poles, respectively), a linear relation between the ECL intensity and the H2O2 concentration was observed below 7.5 mM. Upon increasing the Ac/Aa ratio, the sensitivity increased; however, the linear range of the calibration plot decreased at the same time. The opposite tendency was observed when decreasing Ac/Aa. As shown in Figure 3B,C, the sensitivity and the linear range of the calibration plot can be adjusted by changing both the applied driving voltage and the Ac/Aa ratio. When the analyte concentration is very low (such as the case of DNA sensing, which will be discussed later), Ac/Aa should be as large as possible subject to the limitation of observing ECL in small spots, and the driving voltage should be as small as possible to minimize the influence of redox-active interferents.
Figure 4A,B shows the diffusion and dilution of H2O2 after dropping 20 μL of 100 mM H2O2 solution at different locations in the sensing chamber of a type I device. The array of cathodic poles is shown on the right side of the figure, with the location of dropped H2O2 solution indicated by orange arrows. Note that the ECL image of the spreading H2O2 on the array of cathodic poles in the sensing chamber is a mirror image of that of the ECL image in the anodic chamber. In both cases shown in Figure 4, ECL was initially observed in a localized area near the dropped solution. As time elapsed, however, the area became larger and the ECL intensity decreased overall, suggesting that the H2O2 concentration decreased as a result of diffusion in the horizontal direction and a change in the diffusion layer due to the consumption of H2O2 by the cathodic poles. Imaging was also conducted using a type II device with an array of 9 × 10 cathodes and anodes (Figure 5). The same tendency was observed with higher spatial resolution.
Figure 4.
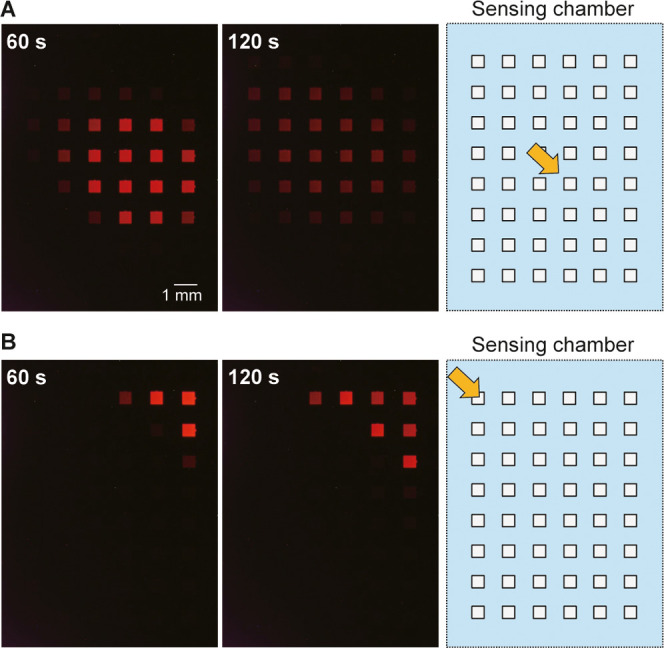
Change in ECL intensity on the array of anodic poles when a H2O2 solution (100 mM, 20 μL) was dropped onto 1 mL of 50 mM PBS (pH 7.4) containing 100 mM KNO3 at (A) the center or (B) the upper left part of the array of cathodic poles. The type I device contained an array of 6 × 8 cathodes and anodes. Left: ECL images taken at 60 and 120 s after dropping the solution. The rightmost figure is the layout of the array of cathodic poles, with the orange arrow indicating the location of the dropped H2O2 solution. Applied voltage: 2.4 V.
Figure 5.
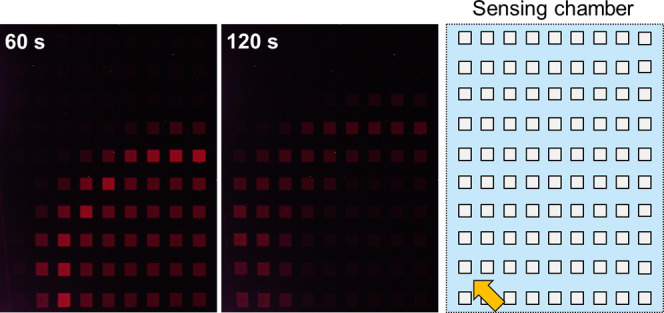
Diffusion of H2O2 in a type II device with an array of 9 × 10 cathodic and anodic poles. From left to right: ECL images captured at 60 and 120 s after dropping 10 μL of 100 mM H2O2 solution onto 1 mL of 50 mM PBS (pH 7.4) containing 100 mM KNO3, and a layout of the array of cathodic poles in the sensing chamber. The orange arrow indicates the location where the H2O2 solution was dropped. Applied voltage: 2.4 V.
Resolution of the images can be improved by simply decreasing the size of cathodic and anodic poles and the distance between neighboring poles, as well as increasing the density of cathodic and anodic poles. The current thin-film process is capable of fabricating the cathodic and anodic poles of submicrometer dimensions. Here, a trivial but challenging problem is where and how to place the lead patterns. In the type II device, the lead patterns were separated from the patterns of cathodic and anodic poles and formed in different layers. A straightforward method will be further separating the lead patterns into more layers and making them thinner while maintaining sufficient conductivity. As we stressed earlier, an advantage of our devices is using conventional thin-film technology to batch-fabricate arrays of BPEs, which will help lower the production cost of the devices.
3.2. Application to DNA Sensing
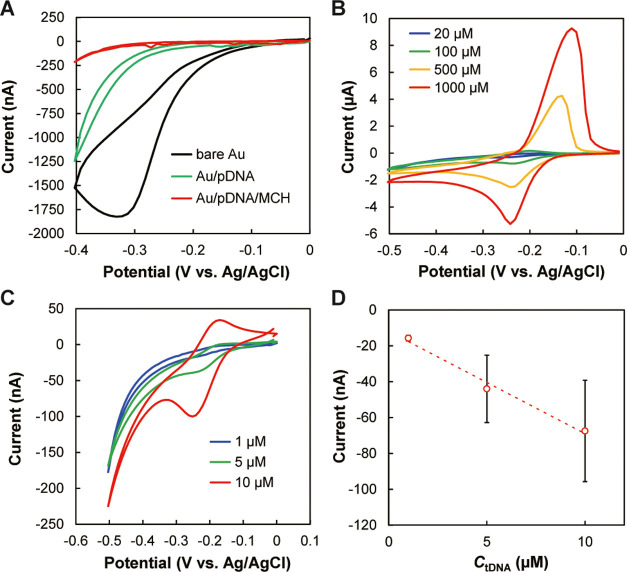
Figure 6 shows the principle of DNA detection. The electroactive MB works as an intercalator for insertion into double-stranded DNAs, and this can be used to detect hybridization between tDNA and pDNA on the cathodic poles of the gold BPEs. MB intercalated in the double strand is reduced by applying an appropriate potential to the electrode, and therefore the hybridization can be detected from the increase in current.30,31 First, we checked the modification of gold BPEs and detection using MB, using one of the cathodes of the BPEs as the working electrode in a conventional three-electrode system (Figure S4). Figure 7A shows changes in the cyclic voltammograms after each modification step of the electrode surface. With a bare gold electrode, a wave corresponding to the reduction of dissolved oxygen was observed. After immobilizing pDNA, there was a distinct decrease in current, suggesting that the immobilized pDNA blocked the diffusion of oxygen. Further modification of the electrode surface with MCH decreased the current significantly and the voltammogram became more featureless, indicating the successful modification with MCH. Cyclic voltammograms of free MB in solutions without DNAs were also measured (Figure 7B) as compared to those of MB intercalated in double-stranded DNAs. Redox peaks of MB were observed, and the peak currents increased with the increase in MB concentration. Electron transfer between the electrode and MB intercalated in double-stranded DNAs (made of pDNA and tDNA) was also confirmed from the cyclic voltammogram (Figure 7C). The peaks were observed at the same potentials as in Figure 7B, suggesting that electron transfer occurred between the electrode and MB. The reduction peak current increased with the increase in tDNA concentration (Figure 7D), demonstrating that tDNA can be detected using pDNA immobilized on the gold electrode.
Figure 6.
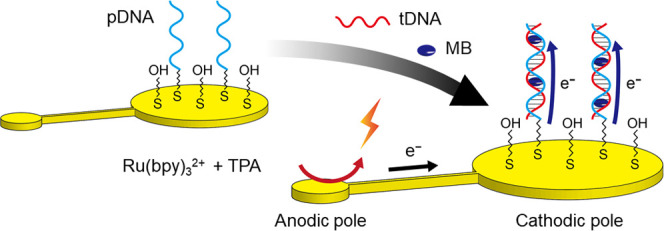
Principle of DNA detection on BPE, with illustrations of the hybridization of pDNA and tDNA and the electron transfer to MB.
Figure 7.
DNA sensing using MB as a DNA intercalator and a three-electrode system. (A) Changes in cyclic voltammograms in 50 mM PBS (pH 7.4) containing 100 mM KNO3 after sequential modification with pDNA and MCH on a bare gold electrode. (B) Cyclic voltammograms obtained with 20, 100, 500, and 1000 μM MB and a bare gold electrode as the working electrode. (C) Cyclic voltammograms after incubating 1, 5, or 10 μM tDNA and 100 μM MB on the gold electrode with immobilized pDNA and MCH. (D) Dependence of the reduction peak current in panel C on tDNA concentration (CtDNA) (n = 3). The red circles and error bars indicate the averages and standard deviations. All cyclic voltammograms were obtained at a scan rate of 50 mV/s.
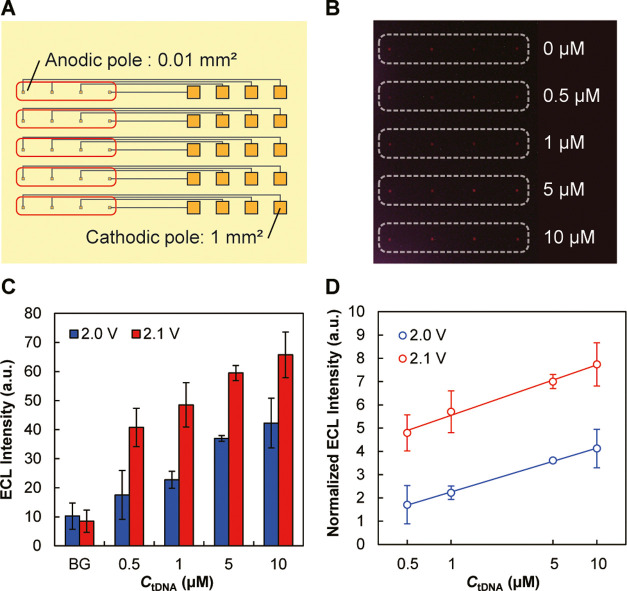
Next, DNA sensing was performed in a closed bipolar system with an array of 4 × 5 gold BPEs (Figure 8A). Five rows of BPEs were placed in five separate PDMS flow channels, and five solutions containing tDNA at 0, 0.5, 1, 5, and 10 μM were introduced into the flow channels to hybridize the tDNA with the immobilized pDNA. After removing the flow channels and rinsing the BPEs with pure water, the array of BPEs was immersed in 100 μM MB solution to intercalate MB in the double-stranded DNAs, followed by ECL detection. We first used BPEs with Ac/Aa = 1. However, under the rate-limiting condition of the cathodic pole, the ECL was too weak to be detected. Therefore, the area of the anodic poles was decreased to 1/100 with respect to that of the cathodic poles (Ac/Aa = 100) to concentrate the emitted ECL within smaller areas (Figure 8A). At this area ratio, ECL could be detected, as shown in Figure 8B (and magnified images in Figure S6), and the ECL intensity increased with increasing tDNA concentration (Figure 8C,D).
Figure 8.
DNA sensing using a BPE array. (A) BPE array used for this purpose, with the area ratio of the cathodic to the anodic pole (Ac/Aa) of 100. Areas surrounded by the red lines correspond to the white dotted line in panel B. (B) ECL images obtained after incubating the BPEs with 0, 0.5, 1, 5, and 10 μM tDNA solutions and 100 μM MB solution in each flow channel. Driving voltage: 2.1 V. A magnified image of panel B is provided as Figure S6 in the Supporting information. (C) Dependence of ECL intensity on the concentration of tDNA obtained at driving voltages of 2.0 and 2.1 V. “BG” indicates the background intensity obtained from areas without ECL emission. (D) Dependence of ECL intensity normalized by the background intensity on tDNA concentration. Panels (C) and (D) display the average values and standard deviations of ECL intensities obtained from the four anodic poles at the same CtDNA (n = 4).
In this experiment, we checked the response down to 500 nM. If the detection limit is defined as three times the standard deviation of the background, then it is around this concentration, which is relatively high compared with previous works using MB as an intercalator but based on different detection principles.32−35 The relatively high detection limit is not due to the detection chemistry but mainly to the method of measuring the ECL intensity using image analysis. Here, the ECL was captured by digital photography and its intensity was calculated from the images. The detection limit could be lowered by measuring the ECL intensity using photomultipliers or photodiodes instead. This approach is applicable in the case of a single sensor. However, it will be extremely difficult for a large number of ECL spots because the same number of photomultipliers or photodiodes will then have to be collected or integrated, and an additional structure is required to shield the ECL from neighboring sensing sites. Therefore, the application of these techniques will be unrealistic. In comparison, it is more realistic to extract ECL intensity information using the appropriate software from captured digital images. Recently, there is a growing interest in using smartphones for processing the signals from sensors,36−41 which may be suitable for using our devices in practical applications. To improve the detection sensitivity in this case, one option would be changing the DNA detection chemistry. On the other hand, there is also room for improving various electrochemical aspects of the device. We have previously proposed coulometric devices coupled with silver deposition to realize highly sensitive detection.42,43 In this technique, the analyte is first converted into silver, whose amount is then measured by coulometry. The amount of deposited silver is directly related to the charge generated in the redox reactions, which is the integral of current. The integral of the ECL intensity over the exposure time is directly related to the charge generated during this period. Therefore, if the intercalator is first converted into silver and then ECL is generated on the cathodic pole (instead of the anodic pole) following the oxidation of silver, much stronger ECL could be recorded within a short period of time to reduce the influence of the background. This could effectively lower the detection limit.
4. Conclusions
Unlike open bipolar systems in which all parts of the BPEs are immersed in a single solution, it was not straightforward to batch-fabricate devices with arrays of many cathodic and anodic poles for closed bipolar systems. Here, we increased the number of cathodic and anodic poles of BPEs by simply connecting them with thin leads and arranging the cathodic and anodic poles in the form of matrices. The number of integrated BPEs was further increased by separating the cathodic/anodic poles and the leads into different layers.
The fabricated device was used to image H2O2 as an electroactive analyte, as well as its diffusion and dilution. The sensitivity and linear range of calibration plots can be adjusted by changing the area ratio Ac/Aa between the cathodic and anodic poles. The devices were also used for multiplexed DNA detection. To facilitate measurement and improve the detection sensitivity, it is effective to reduce the Ac/Aa ratio. The ECL intensity can be correlated with the concentration of DNA to be detected.
Although it is challenging to record many ECL signals and achieve high sensitivity, our devices fabricated using a simple method realized a large number of integrated sensing sites. These devices may be useful basic tools for clinical analysis and cell engineering.
Acknowledgments
This study was supported by a Grant-in-Aid for Scientific Research (No. 21H01958) under the Japan Society for the Promotion of Science (JSPS).
Supporting Information Available
The Supporting Information is available free of charge at https://pubs.acs.org/doi/10.1021/acsomega.2c02298.
Device fabrication; measurement of lead resistances; length and resistance of the shortest and longest leads in types I and II devices; BPEs with cathodic and anodic poles in different area ratios; magnified views of the type II device; device with gold BPEs and PDMS flow channels used for modifying the cathodic poles and detecting DNAs; setup of the three-electrode system; ECL from the array of platinum anodic poles at the driving voltages of 3.6 and 4.0 V; and magnified version of the ECL images in Figure 8B (PDF)
Author Contributions
The manuscript was written through contributions of all authors. These authors contributed equally to this manuscript.
The authors declare no competing financial interest.
Supplementary Material
References
- Sassa F.; Biswas G. C.; Suzuki H. Microfabricated electrochemical sensing devices. Lab Chip 2020, 20, 1358–1389. 10.1039/C9LC01112A. [DOI] [PubMed] [Google Scholar]
- Kojima K.; Hiratsuka A.; Suzuki H.; Yano K.; Ikebukuro K.; Karube I. Electrochemical protein chip with arrayed immunosensors with antibodies immobilized in a plasma-polymerized film. Anal. Chem. 2003, 75, 1116–1122. 10.1021/ac0257391. [DOI] [PubMed] [Google Scholar]
- Abdellaoui S.; Noiriel A.; Henkens R.; Bonaventura C.; Blum L. J.; Doumèche B. A 96-well electrochemical method for the screening of enzymatic activities. Anal. Chem. 2013, 85, 3690–3697. 10.1021/ac303777r. [DOI] [PubMed] [Google Scholar]
- Lam B.; Das J.; Holmes R. D.; Live L.; Sage A.; Sargent E. H.; Kelley S. O. Solution-based circuits enable rapid and multiplexed pathogen detection. Nat. Commun. 2013, 4, 2001. 10.1038/ncomms3001. [DOI] [PubMed] [Google Scholar]
- Zhang H.; Oellers T.; Feng W.; Abdulazim T.; Saw E. N.; Ludwig A.; Levkin P. A.; Plumeré N. High-density droplet microarray of individually addressable electrochemical cells. Anal. Chem. 2017, 89, 5832–5839. 10.1021/acs.analchem.7b00008. [DOI] [PubMed] [Google Scholar]
- Han J.-H.; Kim S.; Choi J.; Kang S.; Pak Y. K.; Pak J. J. Development of multi-well-based electrochemical dissolved oxygen sensor array. Sens. Actuators, B 2020, 306, 127465. 10.1016/j.snb.2019.127465. [DOI] [Google Scholar]
- Kim B. N.; Herbst A. D.; Kim S. J.; Minch B. A.; Lindau M. Parallel recording of neurotransmitters release from chromaffin cells using a 10×10 CMOS IC potentiostat array with on-chip working electrodes. Biosens. Bioelectron. 2013, 41, 736–744. 10.1016/j.bios.2012.09.058. [DOI] [PMC free article] [PubMed] [Google Scholar]
- Rothe J.; Frey O.; Stettler A.; Chen Y.; Hierlemann A. Fully integrated CMOS microsystem for electrochemical measurements on 32 ×32 working electrodes at 90 frames per second. Anal. Chem. 2014, 86, 6425–6432. 10.1021/ac500862v. [DOI] [PMC free article] [PubMed] [Google Scholar]
- Inoue K. Y.; Matsudaira M.; Nakano M.; Ino K.; Sakamoto C.; Kanno Y.; Kubo R.; Kunikata R.; Kira A.; Suda A.; et al. Advanced LSI-based amperometric sensor array with light-shielding structure for effective removal of photocurrent and mode selectable function for individual operation of 400 electrodes. Lab Chip 2015, 15, 848–856. 10.1039/C4LC01099J. [DOI] [PubMed] [Google Scholar]
- Mavré F.; Anand R. K.; Laws D. R.; Chow K.-F.; Chang B.-Y.; Crooks J. A.; Crooks R. M. Bipolar electrodes: A useful tool for concentration, separation, and detection of analytes in microelectrochemical systems. Anal. Chem. 2010, 82, 8766–8774. 10.1021/ac101262v. [DOI] [PubMed] [Google Scholar]
- Fosdick S. E.; Knust K. N.; Scida K.; Crooks R. M. Bipolar electrochemistry. Angew. Chem., Int. Ed. 2013, 52, 10438–10456. 10.1002/anie.201300947. [DOI] [PubMed] [Google Scholar]
- Zhang X.; Zhai Q.; Xing H.; Li J.; Wang E. Bipolar electrodes with 100% current efficiency for sensors. ACS Sens. 2017, 2, 320–326. 10.1021/acssensors.7b00031. [DOI] [PubMed] [Google Scholar]
- Rahn K. L.; Anand R. K. Recent advancements in bipolar electrochemical methods of analysis. Anal. Chem. 2021, 93, 103–123. 10.1021/acs.analchem.0c04524. [DOI] [PubMed] [Google Scholar]
- Chow K.-F.; Mavré F.; Crooks J. A.; Chang B.-Y.; Crooks R. M. A large-scale, wireless electrochemical bipolar electrode microarray. J. Am. Chem. Soc. 2009, 131, 8364–8365. 10.1021/ja902683f. [DOI] [PubMed] [Google Scholar]
- Wu M.-S.; Liu Z.; Shi H.-W.; Chen H.-Y.; Xu J.-J. Visual electrochemiluminescence detection of cancer biomarkers on a closed bipolar electrode array chip. Anal. Chem. 2015, 87, 530–537. 10.1021/ac502989f. [DOI] [PubMed] [Google Scholar]
- Zhang H.-R.; Wang Y.-Z.; Zhao W.; Xu J.-J.; Chen H.-Y. Visual color-switch electrochemiluminescence biosensing of cancer cell based on multichannel bipolar electrode chip. Anal. Chem. 2016, 88, 2884–2890. 10.1021/acs.analchem.5b04716. [DOI] [PubMed] [Google Scholar]
- Lu H.-J.; Zhao W.; Xu J.-J.; Chen H.-Y. Visual electrochemiluminescence ratiometry on bipolar electrode for bioanalysis. Biosens. Bioelectron. 2018, 102, 624–630. 10.1016/j.bios.2017.12.008. [DOI] [PubMed] [Google Scholar]
- Wang Y.-Z.; Ji S.-Y.; Xu H.-Y.; Zhao W.; Xu J.-J.; Chen H.-Y. Bidirectional electrochemiluminescence color switch: An application in detecting multimarkers of prostate cancer. Anal. Chem. 2018, 90, 3570–3575. 10.1021/acs.analchem.8b00014. [DOI] [PubMed] [Google Scholar]
- Ino K.; Yaegaki R.; Hiramoto K.; Nashimoto Y.; Shiku H. Closed bipolar electrode array for on-chip analysis of cellular respiration by cell aggregates. ACS Sens. 2020, 5, 740–745. 10.1021/acssensors.9b02061. [DOI] [PubMed] [Google Scholar]
- Guo R.; Hu S.; Wang Z. A portable electrochemiluminescence bipolar electrode array for the visualized sensing of Cas9 activity. Analyst 2020, 145, 3569–3574. 10.1039/D0AN00678E. [DOI] [PubMed] [Google Scholar]
- Wang F.; Liu Y.; Fu C.; Li N.; Du M.; Zhang L.; Ge S.; Yu J. Paper-based bipolar electrode electrochemiluminescence platform for detection of multiple miRNAs. Anal. Chem. 2021, 93, 1702–1708. 10.1021/acs.analchem.0c04307. [DOI] [PubMed] [Google Scholar]
- Liu Y.; Zhang N.; Pan J.-B.; Song J.; Zhao W.; Chen H.-Y.; Xu J.-J. Bipolar electrode array for multiplexed detection of prostate cancer biomarkers. Anal. Chem. 2022, 94, 3005–3012. 10.1021/acs.analchem.1c05383. [DOI] [PubMed] [Google Scholar]
- Anderson T. J.; Defnet P. A.; Zhang B. Electrochemiluminescence (ECL)-based electrochemical imaging using a massive array of bipolar ultramicroelectrodes. Anal. Chem. 2020, 92, 6748–6755. 10.1021/acs.analchem.0c00921. [DOI] [PubMed] [Google Scholar]
- Guerrette J. P.; Percival S. J.; Zhang B. Fluorescence coupling for direct imaging of electrocatalytic heterogeneity. J. Am. Chem. Soc. 2013, 135, 855–861. 10.1021/ja310401b. [DOI] [PubMed] [Google Scholar]
- Qin X.; Li Z.-Q.; Zhou Y.; Pan J.-B.; Li J.; Wang K.; Xu J.-J.; Xia X.-H. Fabrication of high-density and superuniform gold nanoelectrode arrays for electrochemical fluorescence imaging. Anal. Chem. 2020, 92, 13493–13499. 10.1021/acs.analchem.0c02918. [DOI] [PubMed] [Google Scholar]
- Oja S. M.; Zhang B. Imaging transient formation of diffusion layers with fluorescence-enabled electrochemical microscopy. Anal. Chem. 2014, 86, 12299–12307. 10.1021/ac5035715. [DOI] [PubMed] [Google Scholar]
- Herne T. M.; Tarlov M. J. Characterization of DNA probes immobilized on gold surfaces. J. Am. Chem. Soc. 1997, 119, 8916–8920. 10.1021/ja9719586. [DOI] [Google Scholar]
- Levicky R.; Herne T. M.; Tarlov M. J.; Satija S. K. Using self-assembly to control the structure of DNA monolayers on gold: A neutron reflectivity study. J. Am. Chem. Soc. 1998, 120, 9787–9792. 10.1021/ja981897r. [DOI] [Google Scholar]
- Mutalib N. A. A.; Deng Y.; Hsueh A. J.; Kariya K.; Kurihara T.; Suzuki H. Control of interfacial potentials and redox reactions on bipolar electrodes using Ag/AgCl. Electroanalysis 2021, 33, 2123–2127. 10.1002/elan.202100202. [DOI] [Google Scholar]
- Kelley S. O.; Boon E. M.; Barton J. K.; Jackson N. M.; Hill M. G. Single-base mismatch detection based on charge transduction through DNA. Nucleic Acids Res. 1999, 27, 4830–4837. 10.1093/nar/27.24.4830. [DOI] [PMC free article] [PubMed] [Google Scholar]
- Boon E. M.; Jackson N. M.; Wightman M. D.; Kelley S. O.; Hill M. G.; Barton J. K. Intercalative stacking: A critical feature of DNA charge-transport electrochemistry. J. Phys. Chem. B 2003, 107, 11805–11812. 10.1021/jp030753i. [DOI] [Google Scholar]
- Gu J.; Lu X.; Ju H. DNA sensor for recognition of native yeast DNA sequence with methylene blue as an electrochemical hybridization indicator. Electroanalysis 2002, 14, 949–954. . [DOI] [Google Scholar]
- Han X.; Fang X.; Shi A.; Wang J.; Zhang Y. An electrochemical DNA biosensor based on gold nanorods decorated graphene oxide sheets for sensing platform. Anal. Biochem. 2013, 443, 117–123. 10.1016/j.ab.2013.08.027. [DOI] [PubMed] [Google Scholar]
- Izadi Z.; Sheikh-Zeinoddin M.; Ensafi A. A.; Soleimanian-Zad S. Fabrication of an electrochemical DNA-based biosensor for Bacillus cereus detection in milk and infant formula. Biosens. Bioelectron. 2016, 80, 582–589. 10.1016/j.bios.2016.02.032. [DOI] [PubMed] [Google Scholar]
- Hua H.; Liu Y.; Guan X.; Li Y. DNA nanosensors based on the use of single gold nanowire electrodes and Methylene Blue as an intercalator. Mikrochim. Acta 2018, 185, 152. 10.1007/s00604-018-2703-z. [DOI] [PubMed] [Google Scholar]
- Roda A.; Michelini E.; Zangheri M.; Fusco M. D.; Calabria D.; Simoni P. Smartphone-based biosensors: A critical review and perspectives. TrAc, Trends Anal. Chem. 2016, 79, 317–325. 10.1016/j.trac.2015.10.019. [DOI] [Google Scholar]
- Zhang D.; Liu Q. Biosensors and bioelectronics on smartphone for portable biochemical detection. Biosens. Bioelectron. 2016, 75, 273–284. 10.1016/j.bios.2015.08.037. [DOI] [PubMed] [Google Scholar]
- Huang X.; Xu D.; Chen J.; Liu J.; Li Y.; Song J.; Ma X.; Guo J. Smartphone-based analytical biosensors. Analyst 2018, 143, 5339–5351. 10.1039/C8AN01269E. [DOI] [PubMed] [Google Scholar]
- Xu D.; Huang X.; Guo J.; Ma X. Automatic smartphone-based microfluidic biosensor system at the point of care. Biosens. Bioelectron. 2018, 110, 78–88. 10.1016/j.bios.2018.03.018. [DOI] [PubMed] [Google Scholar]
- Kanchi S.; Sabela M. I.; Mdluli P. S.; Inamuddin; Bisetty K. Smartphone based bioanalytical and diagnosis applications: A review. Biosens. Bioelectron. 2018, 102, 136–149. 10.1016/j.bios.2017.11.021. [DOI] [PubMed] [Google Scholar]
- Sun A. C.; Hall D. A. Point-of-care smartphone-based electrochemical biosensing. Electroanalysis 2019, 31, 2–16. 10.1002/elan.201800474. [DOI] [Google Scholar]
- Ikemoto K.; Seki T.; Kimura S.; Nakaoka Y.; Tsuchiya S.; Sassa F.; Yokokawa M.; Suzuki H. Microfluidic separation of redox reactions for coulometry based on metallization at the mixed potential. Anal. Chem. 2016, 88, 9427–9434. 10.1021/acs.analchem.6b01234. [DOI] [PubMed] [Google Scholar]
- Anshori I.; Takie S.; Suzuki H. Active junctions to improve sensitivity and detection limit of a microdevice based on coulometry coupled with silver metallization. Electroanalysis 2019, 31, 1630–1634. 10.1002/elan.201800825. [DOI] [Google Scholar]
Associated Data
This section collects any data citations, data availability statements, or supplementary materials included in this article.


