Abstract
The visual benefit of correcting high-order aberrations may not be fully realized due to neural mechanisms that compensate for the aberrations of the eye. We examined the extent to which these neural mechanisms might be susceptible to perceptual learning in an adaptive optics (AO)-corrected test of visual resolution. Visual resolution was measured in an adaptive optics scanning laser ophthalmoscope (AOSLO) in 3 conditions: (1) low-order correction (defocus and astigmatism) without AO, (2) 3-mm pupil with AO correction, and (3) 5.81-mm pupil with AO correction. Measurements were made on both eyes in all three conditions before training. Subjects underwent 5 days of monocular training in both AO-corrected conditions and were retested in all three conditions in both eyes after training. The range of minimum angle of resolution (MAR) for each condition was: (1) without AO: 0.53–0.95 arcmin, (2) AO 3-mm pupil: 0.33–0.6 arcmin, and (3) AO 5.81-mm pupil: 0.36–0.56 arcmin. AO correction provided an immediate and significant improvement in visual resolution. There was no significant difference in resolution when correcting aberrations over a 5.81-mm pupil versus a 3-mm pupil. Training on this task provided a minimal improvement in performance. Adaptation to aberrations did not hinder AO correction from providing an immediate visual benefit.
Keywords: adaptive optics, visual resolution, visual acuity, perceptual learning, aberrations, AOSLO
Introduction
It is well known that the optical aberrations of the eye impose a fundamental limit to visual resolution (Campbell & Green, 1965). The pattern of ocular aberrations is unique for each individual (Porter, Guirao, Cox, & Williams, 2001), and it has been hypothesized that the visual system may have evolved a neural mechanism to optimize perception by minimizing the effects of these persistent aberrations (Artal et al., 2004). Evidence suggests that the visual benefit of correcting high-order aberrations might not be fully realized due to neural mechanisms that naturally compensate for the aberrations of the eye (Artal et al., 2004; Chen, Artal, Gutierrez, & Williams, 2007; Sabesan & Yoon, 2010). This is supported by the finding that the best subjective image quality is experienced when an observer views a stimulus through an aberration profile that is only partially corrected (Chen et al., 2007). This has led to the suggestion that some of the visual benefits of the correction of ocular aberrations may not be realized immediately or may be undone by the nervous system’s compensation for the previous aberration state of the eye (Artal et al., 2004; Villegas, Alcón, & Artal, 2008). AO correction of the aberrations of the eye has been shown to improve optical quality both for imaging the retina and for delivering high-resolution stimuli (Liang, Williams, & Miller, 1997). Combined real-time imaging and stimulus delivery in the AOSLO has the potential to allow the performance of the visual system to be assessed unobstructed by the limitations imposed by the imperfect optics of the eye. However, the question remains as to whether the adult human visual system can take full advantage of the unprecedented image quality that is afforded by AO immediately, or if there is some learning period during which a person needs to adapt to the new pattern of aberrations present while viewing an AO-corrected image to obtain the best visual resolution possible. It has previously been shown that a visual benefit can be realized immediately after correction of the eyes’ high-order aberrations, improving visual performance in both contrast sensitivity and visual acuity tasks (Liang et al., 1997; Rossi & Roorda, 2010; Rossi, Weiser, Tarrant, & Roorda, 2007; Williams et al., 2000; Yoon, Jeong, Cox, & Williams, 2004; Yoon & Williams, 2002). However, no study to date has examined whether AO-corrected performance on a visual resolution task improves with training, or if performance is different when correcting aberrations over a large or a small pupil
Visual resolution and perceptual learning
The adult human visual system is well known to be plastic from the photoreceptors to the extrastriate visual areas of the cortex; sustained learning effects on visual tasks have been shown to take place after 1–2 h of training (Fine & Jacobs, 2002). However, performance increases from perceptual learning vary considerably between different visual tasks, with low-level tasks such as foveal resolution showing little or no improvement with training (Fine & Jacobs, 2002; Johnson & Leibowitz, 1979; Westheimer, 2001). Determining whether a task can be improved with training can provide insight into the neural stages upon which that task relies (Westheimer, 2001). Westheimer (2001) has stated that “It can be argued that where there is no learning the processing is of a more primitive kind, more robust and nearer to sensory organs.” It is generally accepted that foveal visual resolution in the adult has reached an optimal value, has a strong retinal basis, and depends on the spacing of retinal elements in an elementary way (Westheimer, 2001). However, there is large variability in resolution measurements obtained across observers, even when corrected optically using conventional spectacle lenses, with “normal” visual resolution having a range of 0.5 to 1 arcmin in normal observers (Westheimer, 2003). Much of this variability may be due to the wide variability in optical aberrations and their effect on retinal image quality. Although resolution tasks have been shown to exhibit little or no sustained improvements with training (Fine & Jacobs, 2002; Johnson & Leibowitz, 1979; Westheimer, 2001), it has been shown that neural adaptation mechanisms that minimize the effects of optical blur on perception exist. These fast-adapting mechanisms work to optimize perception based upon the spatial frequency content of the entire visual scene (Georgeson & Sullivan, 1975; Webster, Georgeson, & Webster, 2002).
Since a standard (no-AO) resolution task itself is not expected to show any improvement with training, using an AO-corrected visual resolution task to look for threshold reductions with training may provide insight into any effect that adaptation to optical aberrations have on visual resolution. If the visual system continues to compensate for aberrations that are no longer present after AO correction, this would presumably negatively affect AO-corrected visual resolution measures (Artal et al., 2004). If there is some residual compensatory mechanism hindering performance in an AO-corrected visual resolution task, there may be some improvement if the person is trained in that task. To test whether or not this is the case, a perceptual learning paradigm was implemented in the AOSLO, whereby vision was initially tested both with and without adaptive optics compensation of high-order aberrations, followed by five consecutive days of training with explicit feedback and then retested following the training period.
AO-corrected performance for different pupil sizes: The role of information beyond the cone Nyquist limit
In addition to looking at the visual systems ability to learn how to fully take advantage of the optical improvement afforded by AO, the effect of AO correction over different pupil diameters was simultaneously examined. To achieve AO compensation of ocular aberrations in AOSLO, it is necessary to induce mydriasis and cycloplegia with drugs. This allows for measurement and correction of aberrations over a large pupil (improving optical quality both for imaging and delivering stimuli) and removes the dynamic aberration changes that occur with accommodation. Although many observers obtain quite large pupil sizes, the AOSLO system used herein allowed for a maximum pupil diameter of 5.81 mm over which those aberrations could be both measured and corrected. However, the effective pupil size can be adjusted to be smaller than this maximum diameter. Since optical image quality is expected to increase with increasing pupil size (if optical aberrations are eliminated and diffraction alone dominates), performance was tested and participants were trained on a visual resolution task while aberrations were corrected over both the maximum 5.81-mm pupil and a smaller 3-mm pupil. Any differences in performance and improvement afforded by training in each condition can provide insight into the information an observer uses to make a decision in the resolution task. Specific interest is in information above the Nyquist limit of the cone mosaic, which is expected to result in aliasing by the photoreceptor mosaic (Williams, 1985). It has been shown that this information can provide a cue to the orientation of a grating, allowing some observers to achieve supra-Nyquist resolution in an orientation identification task (Williams & Coletta, 1987). AO correction over the larger pupil will introduce spatial frequencies into the eye that are twice as high as those in the smaller pupil, well beyond the theoretical Nyquist limit of the cone mosaic, allowing the role of this information to be assessed in this task. Although the contrast of spatial frequencies beyond the Nyquist limit will be low, it is possible that this information may introduce aliasing noise in the 5.81-mm condition, which could in fact hinder performance. This manipulation will also provide insight into the spatial frequencies that are used to make a decision in the tumbling E visual resolution task.
The purpose of this study was two-fold: (1) to examine if the benefit afforded by AO correction of optical aberrations improves with training and (2) to assess whether there is a significant benefit achieved when correcting aberrations over a large pupil relative to a small pupil. The visual benefit of training was assessed under two AO-corrected conditions: (1) AO correction over a 3-mm pupil and (2) AO correction over a 5.81-mm pupil. Visual resolution was assessed in both eyes prior to training in the two AO-corrected conditions and also without AO correction. For the tests done without AO correction, visual resolution was measured with low-order (defocus and astigmatism) correction only. Each observer was then trained in both AO conditions for five consecutive days. A post-training resolution measurement was made on the following day.
Methods
Subjects
Four observers participated in this study, three emmetropes (S1–S3) and one myope (S4). Informed consent was obtained from the participants after the nature of the study and possible complications were explained verbally and in writing. This experiment was approved by the University of California, Berkeley Committee for the Protection of Human Subjects. Three of the observers (S1, S3, and S4) had extensive experience in visual psychophysical tasks, while one observer (S2) was naive.
Stimulus presentation and retinal imaging in AOSLO
The AOSLO was used to project a high-contrast stimulus onto the retina of each observer. The stimulus (a Snellen E) was scanned onto the retina in a raster fashion with a 658-nm (red) diode laser. Details on the AOSLO system used for this experiment can be found elsewhere (Grieve, Tiruveedhula, Zhang, & Roorda, 2006; Poonja, Patel, Henry, & Roorda, 2005; Roorda et al., 2002; Rossi et al., 2007). Only system details relevant to this experiment will be discussed herein. Imaging field size was set to be 48 arcmin × 60 arcmin, with the center 6 arcmin optimized to be over the most linear portion of the sinusoidal horizontal scan. Linearization of the central portion of the scan was accomplished by projecting a checkerboard target of known pixel dimensions onto the calibration grid and setting them to be in register. This resulted in the central 6 × 6 arcmin area being linear to within less than 1 pixel; each pixel was 0.025 × 0.025 arcmin. Optimization of the central portion of the raster scan was essential for ensuring that the Snellen E stimulus used for resolution testing was not distorted horizontally, which would have been a cue to stimulus orientation and would have invalidated the resolution measurements (Rossi & Roorda, 2010; Rossi et al., 2007).
To produce the Snellen E in the raster scan, the beam was modulated using an acousto-optic modulator, placed in the path of the beam prior to the entrance pupil of the system. The stimulus was presented in Maxwellian view (Westheimer, 1966) and appeared to the observer as black on a bright red background (negative contrast). The Weber contrast was approximately −1. Image quality was not degraded by the frequency response of the AOM because of its very high frequency (up to 50 MHz). The AOSLO stimulus delivery technique is described in detail elsewhere (Poonja et al., 2005; Rossi et al., 2007)
Mydriasis and cycloplegia were induced with 1 drop of 2.5% phenylephrine and 1 drop of 1% tropicamide ~20 min prior to the start of the experimental session and were maintained throughout with an additional drop, if necessary. Head stabilization was maintained with a dental impression bite bar mounted on an X–Y–Z stage. Ocular aberrations were measured using the AOSLO’s Shack–Hartmann wavefront sensor (SHWS), which had 241 lenslets over a 5.81-mm pupil. A digital CCD camera detected the focused spots, and aberrations were fit to a 10th-order Zernike polynomial (Grieve et al., 2006; Roorda et al., 2002). Low-order aberrations (sphere and astigmatism) were corrected using standard trial lenses placed into the AOSLO system near the spectacle plane (~14 mm from the entrance pupil). The RMS error from the SHWS was used to optimize this correction objectively to within 0.1 D.
Participants were then subjectively refracted while viewing a static 20/20 Snellen E stimulus through their spectacle correction in the AOSLO system. This was done because (1) RMS wavefront error has been shown to be a poor predictor of subjective image quality (Applegate, Ballentine, Gross, Sarver, & Sarver, 2003; Applegate, Marsack, Ramos, & Sarver, 2003; Chen, Singer, Guirao, Porter, & Williams, 2005) and (2) even though the AO system corrects ocular aberrations, it does not necessarily focus the corrected image onto the photoreceptor plane. A fixed defocus level was determined by placing small amounts of defocus onto the deformable mirror and asking the participant to report which looked clearer. If a fixed defocus level was needed, it was placed onto the deformable mirror for the experimental trials. This was done separately for each condition. For the AO conditions, aberrations were corrected through the best spectacle lens correction and a second subjective refraction was performed. Subjects usually did not require any additional defocus, and if they did, it was generally very small ~0.05 diopters. After AO correction, the preferred focal plane was the one that also provided the best and brightest image of the photoreceptors.
The laser power varied day to day but was always between 14.6 and 19 μW, with a mean power of 16.4 μW, which corresponded to an average retinal illuminance of ~6.5 log Trolands for the 5.81-mm pupil condition and ~5.9 log Trolands for the 3-mm pupil condition (Wyszecki & Stiles, 1982). Although at these light levels the photopigment is nearly 100% bleached, there is no indication that this would hinder the subject’s performance (Wyszecki & Stiles, 1982). Subjects adapted quickly to the bright field and had no problem performing the task comfortably. These light levels were used so that an image could be obtained of the retina during psychophysical testing. During each psychophysical trial, a video of the retina was simultaneously acquired. Videos were acquired to determine the preferred retinal locus of fixation and to attempt to measure the cone spacing of the observer. Under the AO-corrected 3-mm pupil condition, an aperture stop in the AOSLO system was manually adjusted to limit the size of the pupil to 3 mm; a paper target placed at the pupil plane was used to check pupil size. In the AO-corrected 5.81-mm condition, the aperture was opened to allow for AO correction over the full 5.81-mm pupil.
Pre- and post-training visual resolution measurements
Measurements of visual resolution were obtained for each observer, under each condition, and for both eyes, before the start of training (pre) and after 5 days of training (post). For the AO-corrected conditions, an AO correction was performed at the beginning of each training session and then either: (1) after 35 trials, (2) when the observer noticed that the image quality had degraded, or (3) after the experimenter, monitoring AOSLO image quality, determined that the retinal image quality had decreased. Measurements of the residual wavefront aberration were stored to computer for offline analysis at several points throughout the experiment. Both eyes were tested in the pre- and post-stages to test for interocular transfer of any training effects to the untrained eye.
The method of constant stimuli was employed to measure resolution thresholds. Seven different stimulus sizes were used for each measurement, with the gap in the E, corresponding to the MAR for that letter size ranging from 0.25 arcmin to 1 arcmin in 0.125 arcmin steps (corresponding to Snellen sizes of 20/5 to 20/20). These letter sizes were selected because they corresponded to integer numbers of raster lines in the gap. In a four-alternative forced-choice task, observers judged the orientation of the Snellen E by indicating the direction of the parallel strokes of the E relative to the orthogonal stroke (either right, left, up, or down). Stimulus duration was 1 s (30 AOSLO stimulus frames). The observer initiated each trial with a key press on a computer keyboard. After a short delay (~200 ms), the stimulus appeared in one of four randomly chosen orientations. The observer then responded with a key press on the arrow keys of a computer keyboard. The experiment was controlled using MATLAB (The MathWorks, Natick, MA, USA) and custom software. The measurement consisted of obtaining 10 orientation judgments for each of the 4 orientations and 7 letter sizes, resulting in 280 stimulus trials per measurement (40 trials of each stimulus size). Data were then fit to a Weibull psychometric function, using MATLAB software, which determined the smallest letter size that the observer could correctly judge the orientation of at the 72.4% correct level. Pre- and post-training measurements were identical except for the range of stimulus sizes used. Post-training measurements for all but the non-AO condition of observer S4 used one smaller letter, with the gap in the E being 0.125 arcmin (Snellen equivalent of 20/2.5), corresponding to the range of sizes used for the training session.
Training
Each observer spent 1 h/day training, with the time split equally between each AO-corrected condition (~30 min spent on each condition). Training sessions were limited to 1 h to minimize the effects of fatigue (Beard, Levi, & Reich, 1995) and carried out over multiple days because of the role of sleep in consolidating learning (Karni, Tanne, Rubenstein, Askenasy, & Sagi, 1994). Training was monocular and condition order was alternated on each day. For five consecutive days, 504 trials were completed in each condition (1008 total trials per day), consisting of 18 presentations each of the 28 stimuli.
The largest letter size used for pre-training threshold measurements (1 arcmin; 20/20 Snellen) was not used in the training sessions because it was found in the pre-training session that all observers could correctly identify the orientation of that letter after AO correction 100% of the time. Therefore, a smaller letter, with 0.125 arcmin gap (20/2.5 Snellen) replaced the 1 arcmin (20/20 Snellen) E for the training sessions. This was done so that training could focus on those letter sizes that might improve with training.
For one observer, S4, no training was done on training day 1 in the 3-mm condition due to a software malfunction, and only a partial training session was done in the 5.81-mm condition. Thresholds reported for day 1 for S4 are from ~15 min of training on that day (252 trials). Observer S4 should be considered to have only four full days of training; based on the results from the other observers, we do not believe that this loss of training significantly disrupted the outcome.
During training sessions, auditory feedback was provided after each trial. Feedback consisted of a computer voice stating either “correct” or “incorrect,” and if the latter, also either “up,” “down,” “left,” or “right.” Feedback was controlled with the same MATLAB software that controlled the experiment. Explicit feedback was given after each trial because it has been shown that stronger learning effects can occur when feedback is given (Fine & Jacobs, 2002; Herzog & Fahle, 1997).
Results
MAR is plotted versus day for each observer’s trained eye in both AO conditions in Figure 1.
Figure 1.
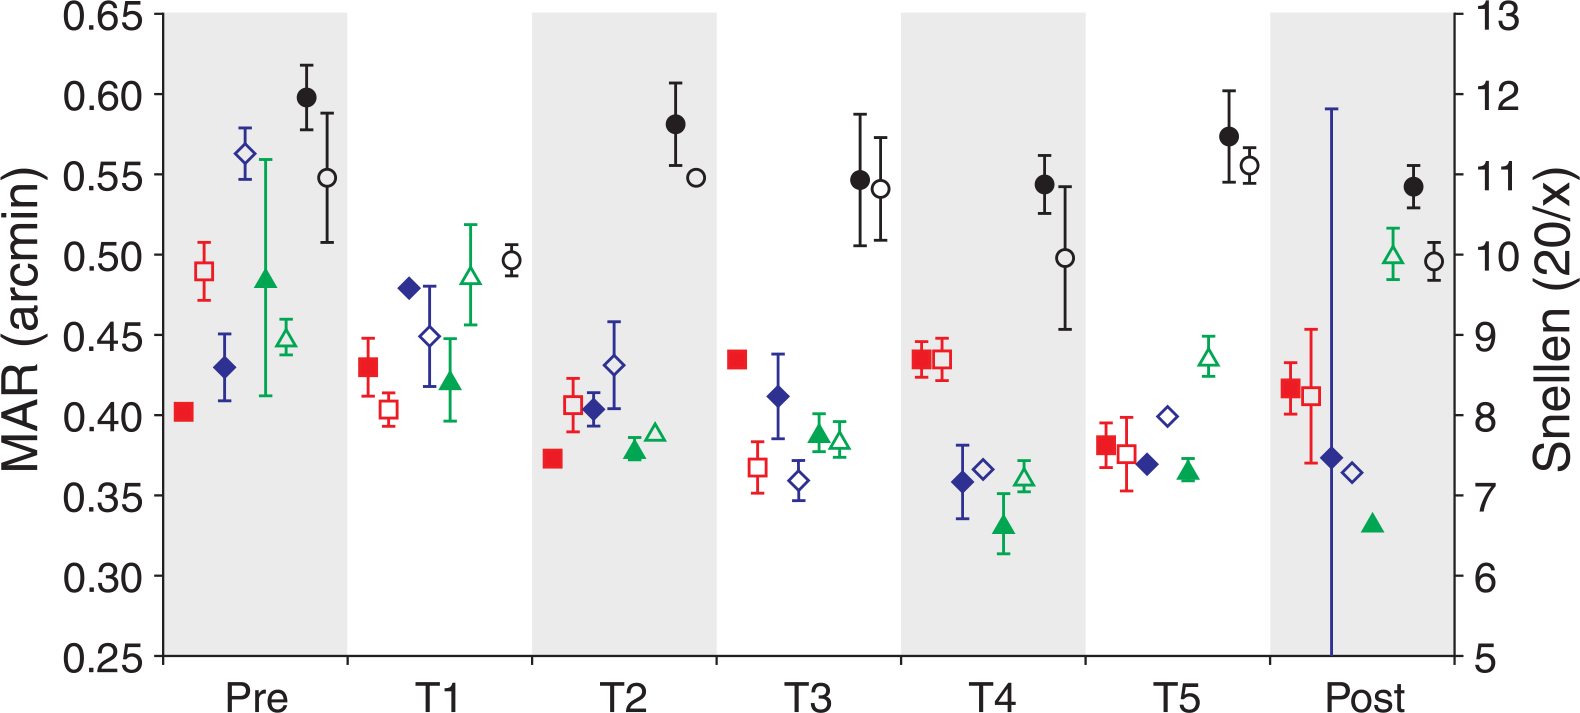
MAR as a function of time. MAR for each observer is plotted prior to (Pre), during (T1–T5), and after (Post) training for the 3-mm (filled symbols) and 5.81-mm (open symbols) conditions. Observers S1–S4 are shown as red squares, blue diamonds, green triangles, and black circles, respectively. Error bars represent ±1 SD of the threshold fit.
Psychometric functions for the observer who exhibited the most improvement from training, S3, are shown for the 5.81-mm pupil condition in Figure 2. Observers performed quite well immediately in both AO-corrected conditions; prior to training visual resolution was significantly better in both the 3-mm (p = 0.00018; paired t-test) and 5.81-mm (p = 0.002; paired t-test) AO-corrected conditions compared to the no adaptive optics condition for all eyes tested. Interestingly, when all measurements for the trained eyes are considered, there was no significant difference between the measurements obtained in either AO condition (p = 0.4814; paired t-test). Bland–Altman analysis (Bland & Altman, 1986) confirmed that there was good agreement between the measurements obtained in the AO conditions (Figure 3). Only one observer, S4, consistently performed better in one condition (the 5.81-mm pupil condition). Post-training thresholds for the trained eye were lower for 3 of the 4 observers for each AO-corrected condition; thresholds were worse in the post-training session for S1 in the 3-mm condition and S3 in the 5.81-mm condition.
Figure 2.
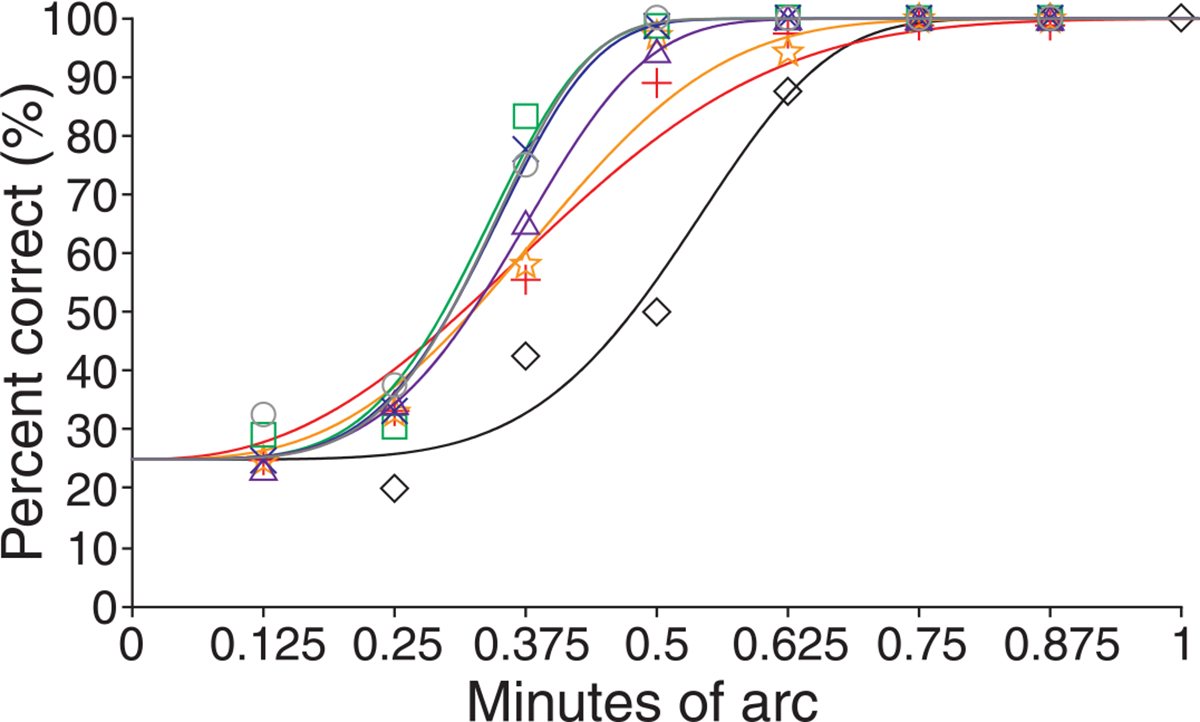
Psychometric functions for observer S3 in the AO-corrected 5.81-mm pupil condition. Examples of the Weibull psychometric functions used to estimate resolution threshold. Symbols show empirical data while solid lines show fitted psychometric function (lines colored to correspond with symbols). Pre-training, training day 1–5, and post-training empirical data are shown as black diamonds, red crosses, orange stars, green squares, blue Xs, purple triangles, and gray circles, respectively.
Figure 3.
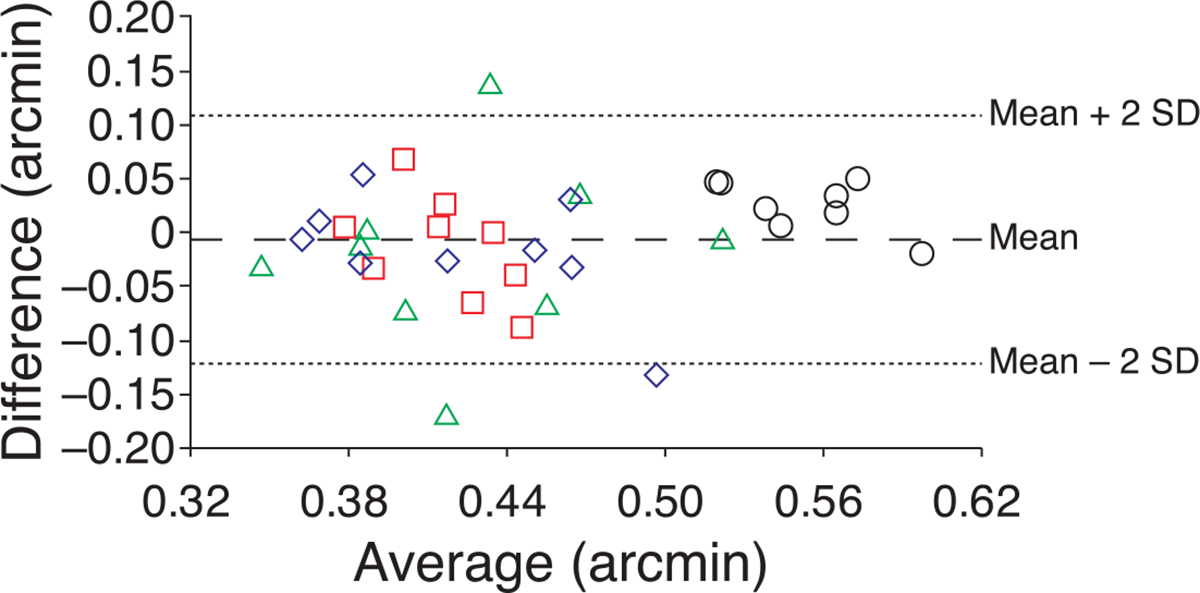
Bland–Altman plot shows good agreement between results obtained in each AO condition. The difference (3 mm–5.81 mm) is plotted versus the mean. The MARs (in arcmin) obtained in the 3-mm and 5.81-mm AO-corrected conditions were similar for all observers. The mean difference was very close to zero (−0.007 arcmin) and the SD was 0.057 arcmin. Observers S1–S4 are shown as red squares, blue diamonds, green triangles, and black circles, respectively. This figure includes all measurements obtained with AO correction, including measurements from the untrained eyes.
There was not a significant difference between the pre- and post-training thresholds for the trained eyes in either the 3-mm (p = 0.1691; paired t-test) or 5.81-mm condition (p = 0.2719; paired t-test). Linear regression lines were fit to the data of each observer individually and averaged. A negative slope would indicate a reduction in threshold across time, potentially indicating learning. Individual slopes were negative but close to zero for all but the 3-mm data set of observer S1. The average slope of all observers was negative but very close to zero for both the 3-mm (−0.0113; SD = 0.0097; n = 4) and 5.81-mm conditions (−0.0097; SD = 0.0124; n = 4) and were not significantly different from zero in either the 3-mm (p = 0.1016) or 5.81-mm (p = 0.217) condition.
This type of analysis may obscure learning effects that happened during the course of training because observers tended to improve on the resolution task during the first few days of training, reaching a minimum value on either day 3 or 4, after which thresholds tended to either remain flat or fluctuate. Pre-training thresholds were therefore compared to the best acuities obtained during the training period. The best acuities were obtained on training day 3 for S1 and training day 4 for all other observers. The best resolution overall was obtained by observer S3 on training day 4, with MAR of 0.33 arcmin in the 3-mm pupil condition. The best MAR for observer S1 was 0.37 arcmin obtained on training day 3 in the 5.81-mm condition, while the best MAR for observer S2, of 0.36 arcmin, was obtained in the 3-mm condition on training day 4. Observer S4, the sole myope examined, always had the worst resolution, with best resolution of 0.5 arcmin obtained on training day 4 in the 5.81-mm condition; this MAR was also obtained in the post-training measurement session for this observer. The best thresholds obtained throughout the course of training were not significantly better than the pre-training thresholds in the 3-mm condition (p = 0.0646; paired t-test) but were significantly better in the 5.81-mm condition (p = 0.0129; paired t-test). Although the training sessions were long, fatigue did not affect the threshold measurements, with no significant difference found between thresholds obtained in either the first or second training session on each training day (p = 0.3877; paired t-test).
Pre- and post-training thresholds for the untrained eyes are shown in Figure 4. There were slight improvements in the post-training measurements for the untrained eyes of all observers in both conditions. However, overall improvement was not significant for either the 3-mm (p = 0.053; paired t-test) or 5.81-mm condition (p = 0.157; paired t-test). Pre- and post-training measurements without adaptive optics correction are shown in Figure 5. For the trained eye, there was a slight elevation of threshold in two of the four eyes, while for the untrained eye, all subjects performed worse in the post-training session. Pre- and post-training measurements made without AO correction were not significantly different (p = 0.1813; paired t-test).
Figure 4.
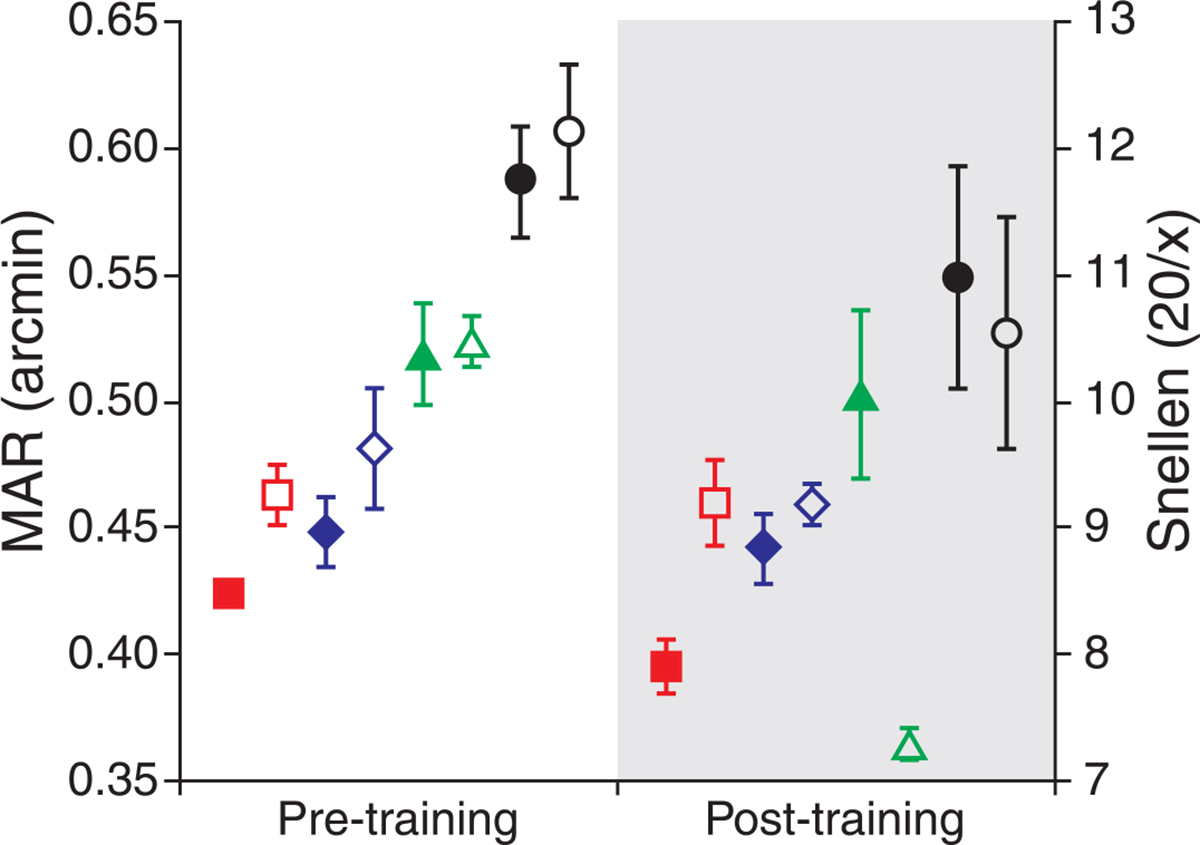
Pre- and post-training thresholds for the untrained eye. Modest threshold reduction was seen in the untrained eyes of each observer for both the 3-mm (filled symbols) and 5.81-mm (open symbols) AO-corrected conditions. These improvements were not statistically significant. Observers S1–S4 are shown as red squares, blue diamonds, green triangles, and black circles, respectively. Error bars represent ±1 SD of the threshold fit.
Figure 5.
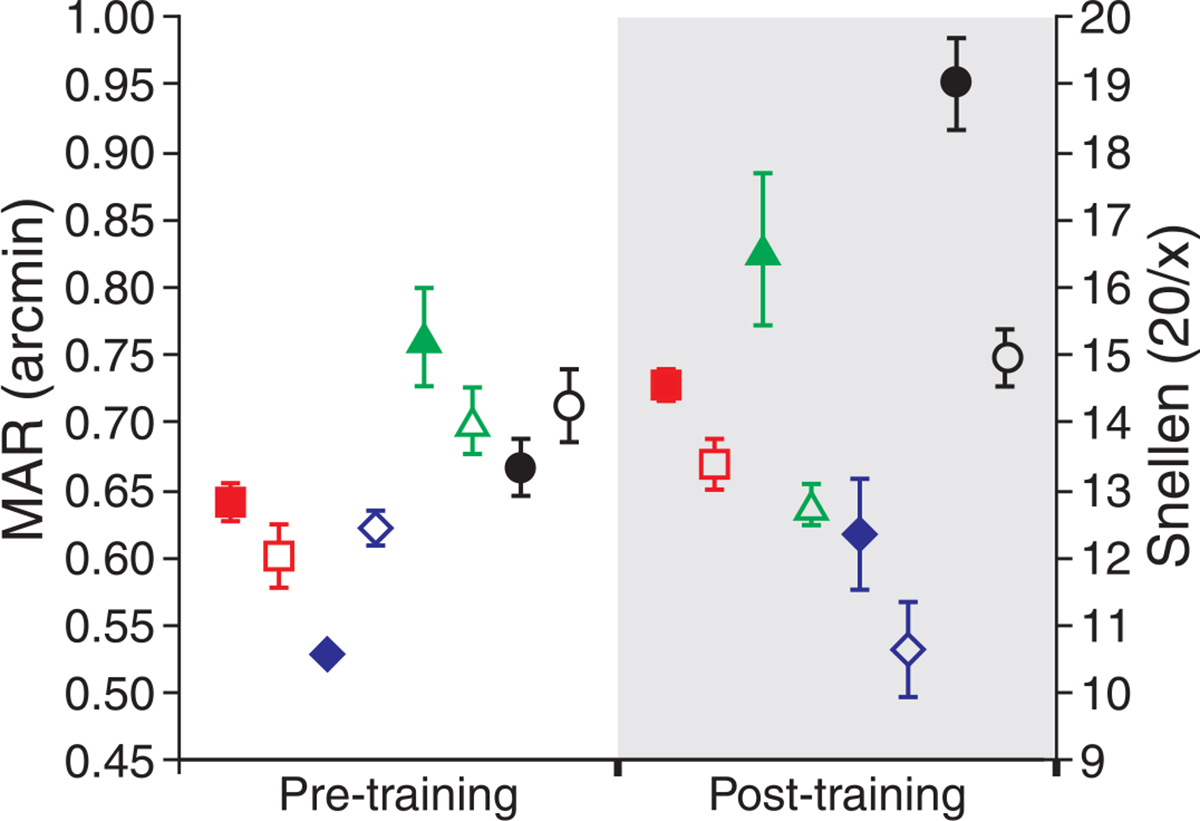
MAR without AO correction before and after training. Visual resolution without AO correction improved slightly for two observers for the trained eye (open symbols). Threshold elevations were seen for all observers for the untrained eye (filled symbols). Observers S1–S4 are shown as red squares, blue diamonds, green triangles, and black circles, respectively. Error bars represent ±1 SD of the threshold fit.
The errors observers make and how those errors change with training may provide insight into the information used by an observer to make a decision on the perceived orientation of the stimulus. Errors were broken up into two types based on the difference in degrees of the response orientation from the actual orientation, either 90° or 180°. For each stimulus orientation, there are two possible 90° errors, while there is only one possible 180° error; this results in chance probabilities of ~66% for 90° errors and ~33% for 180° errors. The data for the trained eye of each observer is shown in Figure 6 for both adaptive-optics-corrected conditions. Figure 6 clearly shows that the error rates for the different error types stayed flat throughout the course of training and in all cases were very close to the expected values (shown as the dashed lines in Figure 6). The mean error rate for 90° errors was 68.1% (SD = 2.2; n = 27) for the 3-mm pupil condition and 67.7% (SD = 2; n = 28) for the 5.81-mm pupil condition. The mean error rate for 180° errors was 31.9% (SD = 2.2; n = 27) for the 3-mm pupil condition and 32.3% (SD = 2; n = 28) for the 5.81-mm pupil condition.
Figure 6.

Percentage of 90° and 180° errors. The percentages of 90° errors (filled symbols) and 180° errors (open symbols) were very similar to the expected value (dashed lines) for each measurement and did not change with training in either the 3-mm (a) or 5.81-mm (b) adaptive optics condition. Observers S1–S4 are shown as red squares, blue diamonds, green triangles, and black circles, respectively.
Since the measurements obtained in each AO-corrected condition were not significantly different, we combined all trials obtained on each day to examine the effect of training on AO-corrected visual resolution irrespective of pupil size. When combined, the large number of trials allowed resolution thresholds to be estimated with a higher degree of accuracy than for each condition individually. MAR for the combined data is plotted versus day in Figure 7. Only four training days (T2–T5) were considered for observer S4, because only those days that had full training sessions in both conditions were considered. Threshold estimates for the combined data were similar to the individual pupil conditions but showed a much clearer overall trend toward improvement with training for all subjects than was seen for the individual conditions. For each observer, the threshold versus time data followed a somewhat bilinear form, with an initial linear period of threshold reduction over the first 3–4 days of training (depending on the observer) followed by either a slight elevation or fluctuation in threshold over the remaining measurements. Linear regression lines were fit to the first four threshold measurements (the pre-training measurement and training days 1–3). Each observer was found to have a negative slope over this time period. The mean slope was −0.027 (SD = 0.0104), significantly different from zero (p = 0.0137). Regression lines fit to the data from each observer for the time period from training day 3 to the post-training session were found to have a mean slope of 0.002 (SD = 0.008), which was not significantly different from zero (p = 0.6152).
Figure 7.
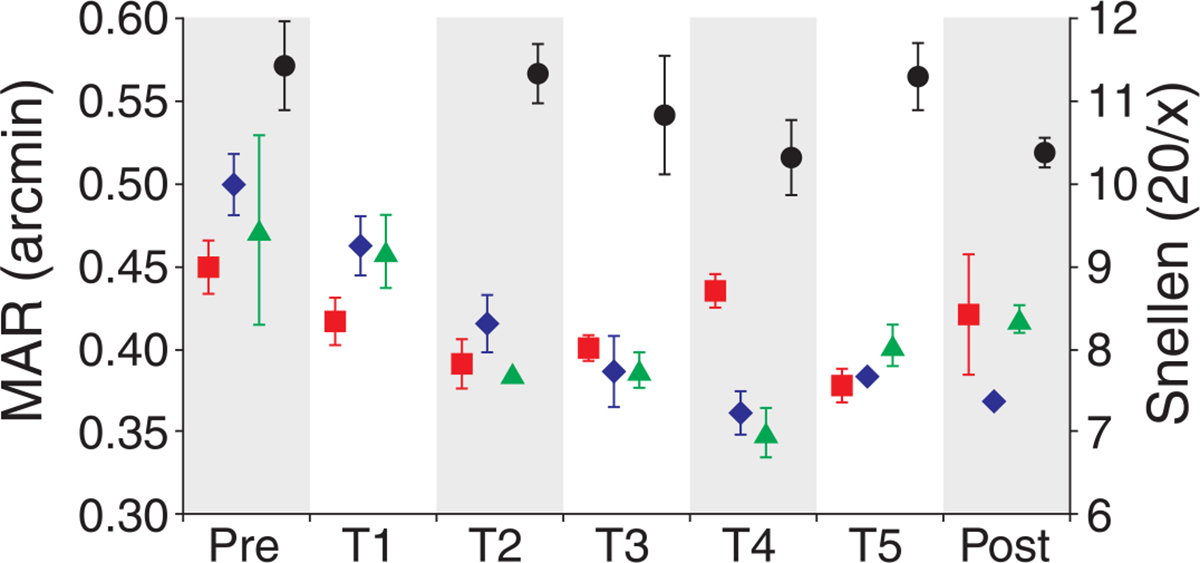
MAR for combined responses. MAR for each observer is plotted prior to (Pre), during (T1–T5), and after (Post) training for the combined responses from both AO-corrected conditions. Observers S1–S4 are shown as red squares, blue diamonds, green triangles, and black circles, respectively. Error bars represent ±1 SD of the threshold fit.
Since the three emmetropic observers obtained thresholds that were much lower than the myopic observer, it is difficult to obtain an estimate of the mean threshold reduction with training for all observers based solely on the raw threshold estimates. We therefore scaled each measurement by their pre-training threshold to examine the relative reduction in threshold. This was done by dividing each threshold measurement by the pre-training measurement and multiplying by 100; this transforms each measurement into the percent of pre-training MAR. These data are plotted versus time in Figure 8. With this transformation, it is possible to average each measurement and estimate the mean performance improvement with training, as a percentage of pre-training thresholds, for the four observers. Data were averaged for all four observers for each day except for training day 1, where only 3 were averaged as there was not a complete training session for observer S4. The averaged data reached a minimum of ~83% of the pre-training threshold on training day 4; this shows that the mean improvement from training was a threshold reduction of ~17% from the pre-training MAR. The mean data are fit well with a quadratic polynomial with the formula: y = 0.9173×2 − 9.4946x + 108.75 (R2 = 0.98), shown as the dashed curve in Figure 8.
Figure 8.
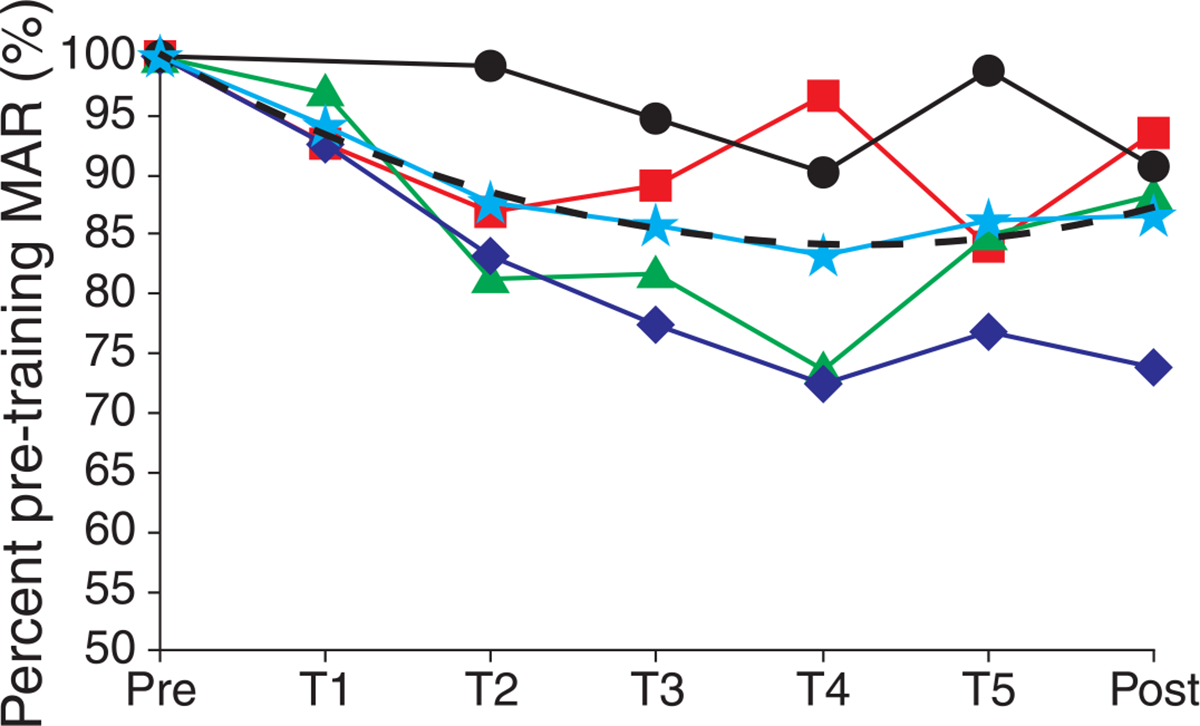
Performance as percentage of pre-training MAR. The improvement in resolution is plotted on a normalized scale so that all observers can be compared relative to their own pre-training MAR. For each observer, threshold measurements from the combined AO responses (shown in Figure 7) were divided by the observers pre-training MAR and multiplied by 100 yielding a relative measurement of performance: percent of pre-training MAR. Observers S1–S4 are shown as red squares, blue diamonds, green triangles, and black circles, respectively. The average of all observers on each day is shown as a cyan star; the averaged data were fit well with a quadratic polynomial (dashed curve).
Another way to look at the data is to examine how performance for each letter size changed over the course of training. Plotting the percent correct responses for each letter size for each day allowed linear regression lines to be fit for each letter size for each observer. These data are shown for the 0.25, 0.375, 0.5, and 0.625 arcmin letters in Figure 9. Although positive slopes were observed on other letter sizes for individual observers, when all observers are considered together, the only letter size with a mean slope that was significantly different from zero was the 0.375 arcmin letter size (p = 0.0165; t-test; one sample). This suggests that a large portion of the observed threshold reduction can be attributed to increased performance on this letter size alone. This was confirmed by comparing the pre- and post-training performance of each letter size. This analysis showed that the only letter size that had significantly different post-training performance for all observers was the 0.375 arcmin letter (p = 0.0023; t-test; paired). The mean percent correct for this letter size for all observers improved from 46.3% correct (SD = 14.4, n = 4) in the pre-training measurement session to 62.2% correct in the post-training session (SD = 16.8, n = 4).
Figure 9.
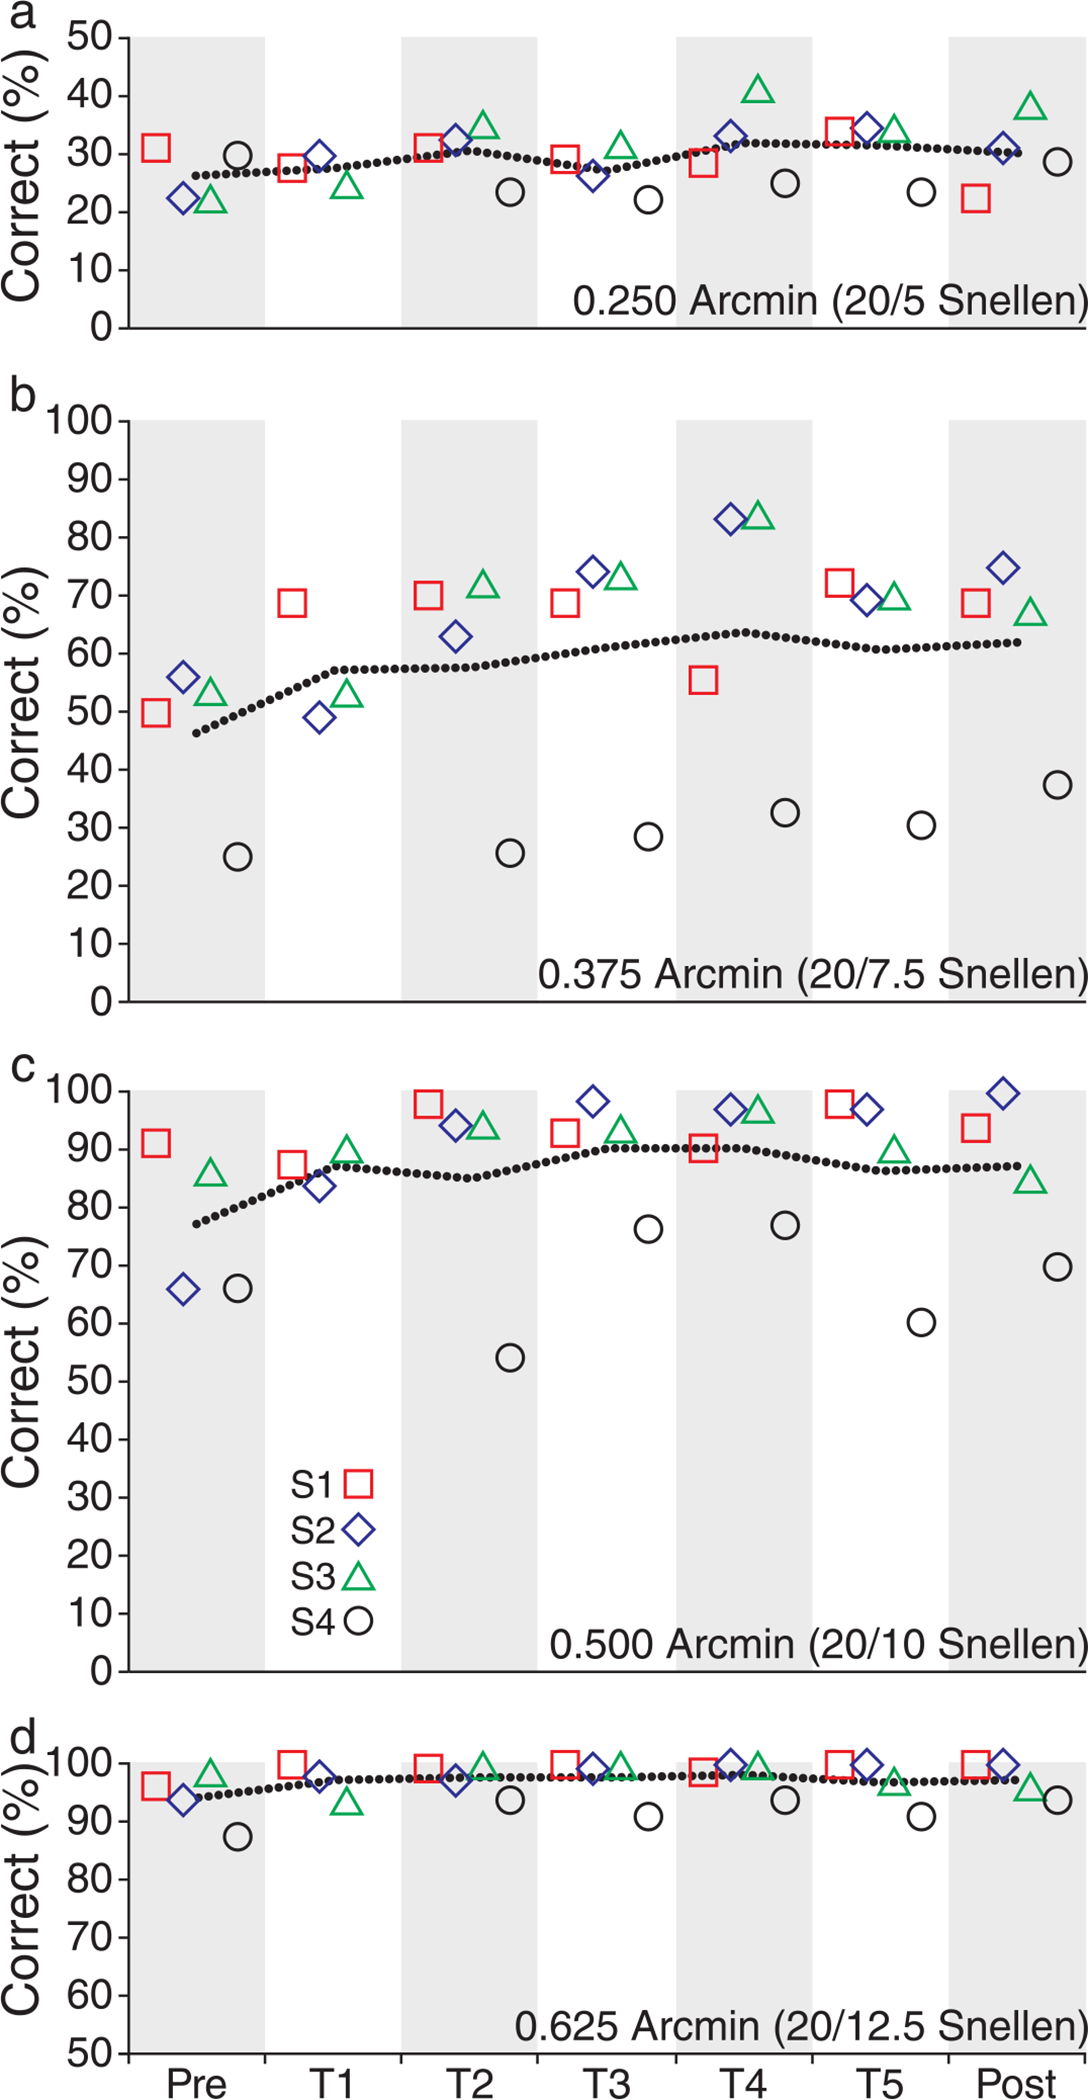
Percent correct responses for letter sizes near threshold. Percent correct responses for each of four letter sizes used during the experiment are plotted as a function of time for each observer. The letter sizes shown have gaps in the E of (a) 0.25, (b) 0.375, (c) 0.5, and (d) 0.625 arcmin. The corresponding Snellen equivalent sizes are (a) 20/5, (b) 20/7.5, (c) 20/10, and (d) 20/12.5. The percentages of correct responses for the 0.25 and 0.625 arcmin letters were relatively flat, while the 0.375 and 0.5 arcmin letters showed improvement with training, which varied depending upon the observer. Significant improvement was found for the 0.325 arcmin letter but not for the 0.5 arcmin letter. Observers S1–S4 are shown as red squares, blue diamonds, green triangles, and black circles, respectively. The dashed line shows the mean percent correct for all observers as a function of time. Note the difference in scale between (a) and (d).
Measurements of the residual wavefront aberration after AO correction allowed the modulation transfer function of the eye for each observer in each condition to be estimated (Figure 10). For the 3-mm pupil with AO, estimated MTFs were very close to the diffraction limit for each observer. In the 5.81-mm condition, there was higher contrast than in the 3-mm condition at all spatial frequencies for all observers (except for a small range of spatial frequencies for S1). However, the MTFs in the 5.81-mm condition were not as close to the diffraction limit and exhibited more intersubject variability than for the 3-mm condition.
Figure 10.
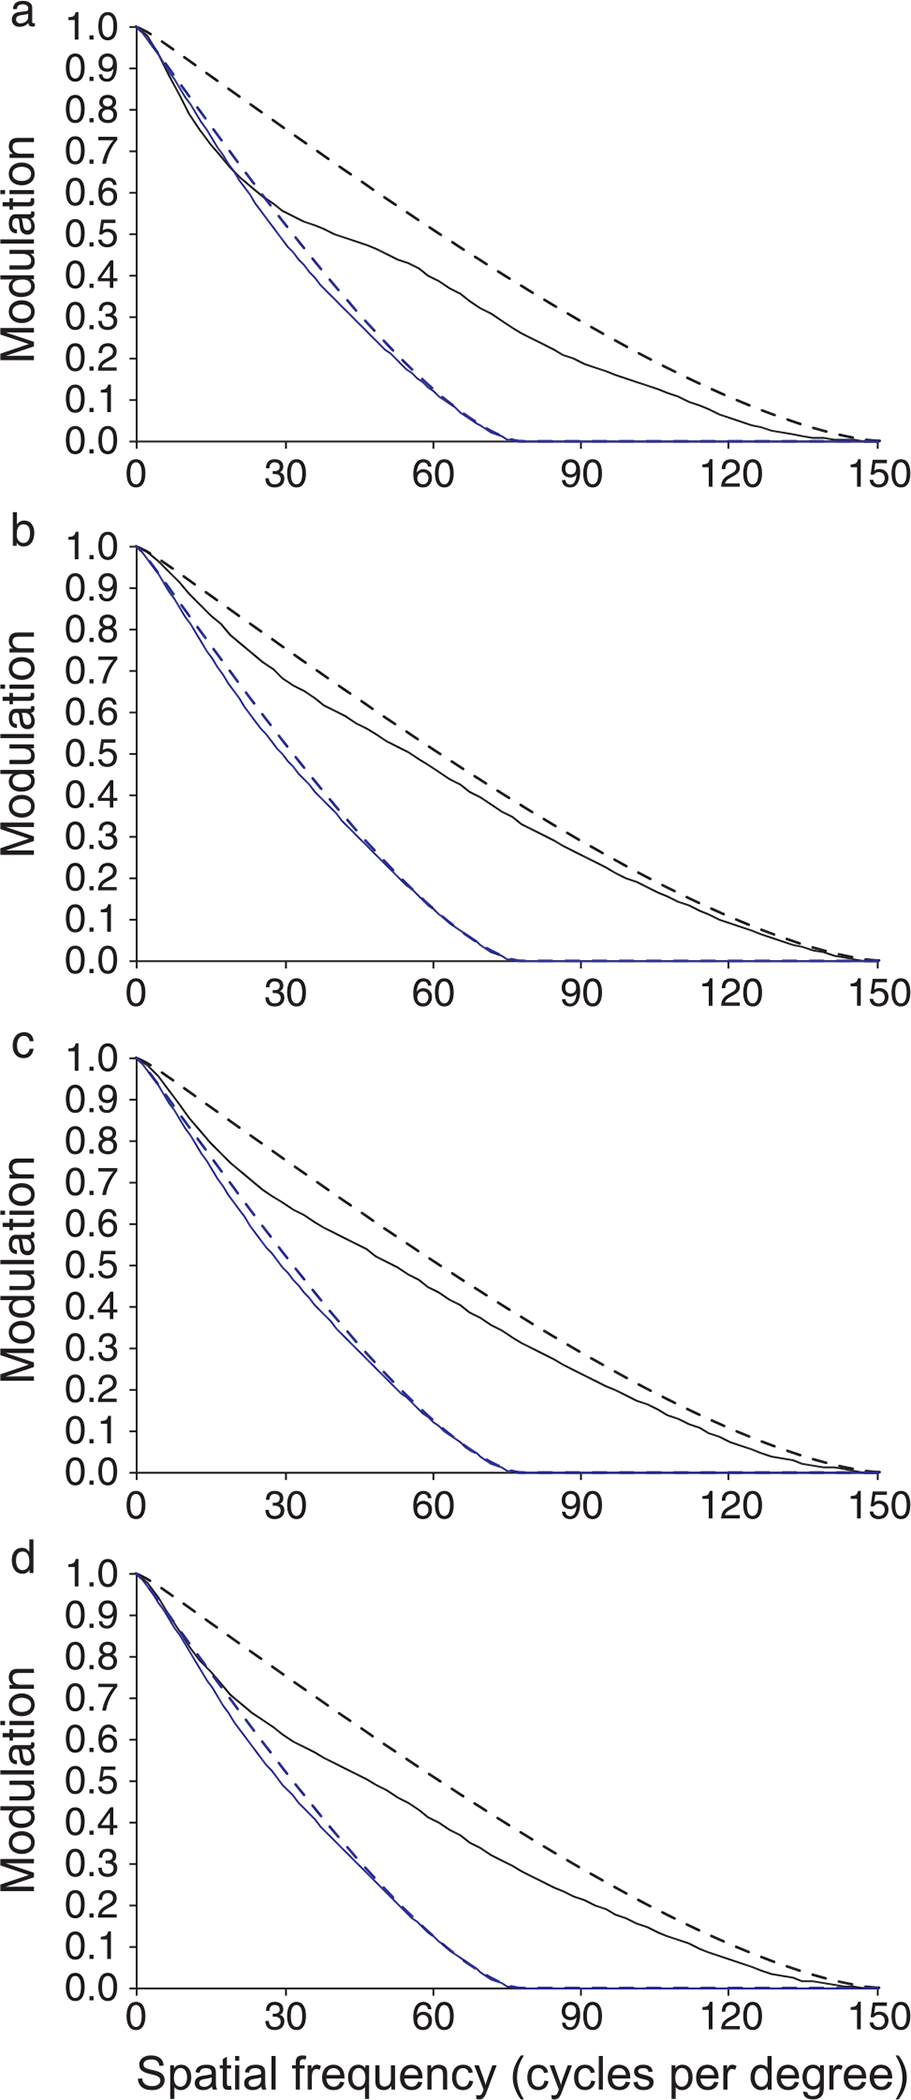
MTFs estimated from measured wavefront aberration after AO correction: (a) S1, (b) S2, (c) S3, and (d) S4. MTFs for the 3-mm condition (solid blue lines) were very close to the diffraction limit (dashed blue lines) for all observers. MTFs for the 5.81-mm condition (solid black lines) were worse than the diffraction limit (dashed black lines) and exhibited more variability.
Discussion
Visual benefit of AO correction is immediate
It appears clear that there was an improvement in visual resolution resulting from training in this task; however, it was minimal and did not appear to be sustained for all observers. Training improved performance most for the naïve observer, S2, suggesting that it is possible that the previous psychophysics experience of the other observers may have slightly reduced the performance improvement from training in this task. However, the visual benefit afforded by AO correction for this task was very rapid, with observers able to take advantage of the improved optical image quality to achieve much better resolution thresholds immediately. This finding is beneficial, for it shows that observers’ own aberrations do not hinder them from performing extremely well in a visual resolution task after AO correction. The thresholds obtained were excellent, with each emmetropic observer approaching or exceeding Snellen equivalent values of 20/8.
Thresholds were slightly better than expected from the theoretical average sampling limit of the cone mosaic, which is thought to be around 0.5 arcmin, but not beyond the range of sampling limits estimated from the data of Curcio, Sloan, Kalina, and Hendrickson (1990). The decision to use a 72.4% correct threshold for this study resulted in threshold estimates being very low; using a more conservative threshold would increase these values. Since the psychometric functions are quite steep, it is possible that the actual resolution threshold was closer to the average Nyquist limit than these thresholds suggest.
The myopic observer never reached the threshold levels obtained by the emmetropic observers. Refractive error is an important factor that must be considered when making predictions about the visual benefits of AO correction. There is a growing body of evidence suggesting that visual resolution and high spatial frequency contrast sensitivity are reduced in myopia (Atchison, Schmid, & Pritchard, 2006; Coletta & Watson, 2006; Collins & Carney, 1990; Fiorentini & Maffei, 1976; Jaworski, Gentle, Zele, Vingrys, & McBrien, 2006; Liou & Chiu, 2001; Radhakrishnan, Pardhan, Calver, & O’Leary, 2004; Strang, Winn, & Bradley, 1998; Subbaram & Bullimore, 2002; Thorn, Corwin, & Comerford, 1986). We previously showed that myopic observers perform worse than emmetropic observers in AO-corrected tests of visual resolution (Rossi et al., 2007).
Visual benefit of AO was similar for both pupil sizes despite the optical benefits of a larger pupil
The most interesting finding of the present study was that AO correction over a 3-mm pupil provided the same visual benefit as AO correction over a 5.81-mm pupil. This was surprising, given the theoretical improvement in optical quality a larger pupil affords after AO correction. Why does such a significant optical improvement not provide a measurable increase in performance? There were likely different limiting factors involved for each condition. For the 3-mm pupil, diffraction dominates (Liang et al., 1997); it can be seen clearly from the MTFs in Figure 10 that the residual wavefront aberration after AO correction yields an MTF that is very similar to that computed for diffraction alone. This results in lower contrast at all spatial frequencies relative to the 5.81-mm condition. This reduced contrast, especially at the highest spatial frequencies, is probably the main optical factor limiting performance in the 3-mm condition.
For the 5.81-mm pupil, the benefits of higher contrast at lower spatial frequencies may be offset by the presence of spatial frequencies beyond the photoreceptor Nyquist limit, which may introduce aliasing distortions. Aliasing is the introduction of spurious low spatial frequencies due to undersampling of high spatial frequencies (Williams, 1985). Figure 11 compares the average MTF computed from the residual wavefront aberration measured for all observers. The shaded region highlights the area of the MTF above 60 cycles per degree, which is the commonly accepted theoretical nominal Nyquist frequency of the cone mosaic (Williams & Coletta, 1987). The entire shaded region represents the aliasing zone for the 5.81-mm pupil while the darker portion of the shaded region denotes the aliasing zone for the 3-mm pupil. Although the 3-mm pupil does introduce a range of spatial frequencies above the nominal Nyquist limit, the contrast of these spatial frequencies is theoretically much higher for the 5.81-mm condition and extends across a larger range including many higher spatial frequencies. Although both conditions are ultimately limited by the Nyquist limit of the cone mosaic and post-receptoral neural processing (Rossi & Roorda, 2010; Williams & Coletta, 1987), these optical differences are important factors governing visual resolution. It should be noted that a larger pupil may provide more of a benefit for a detection task, as opposed to the resolution task examined here. This is due to the fact that observers may rely on different information when making a judgment in a detection task versus the tumbling E resolution task examined here.
Figure 11.
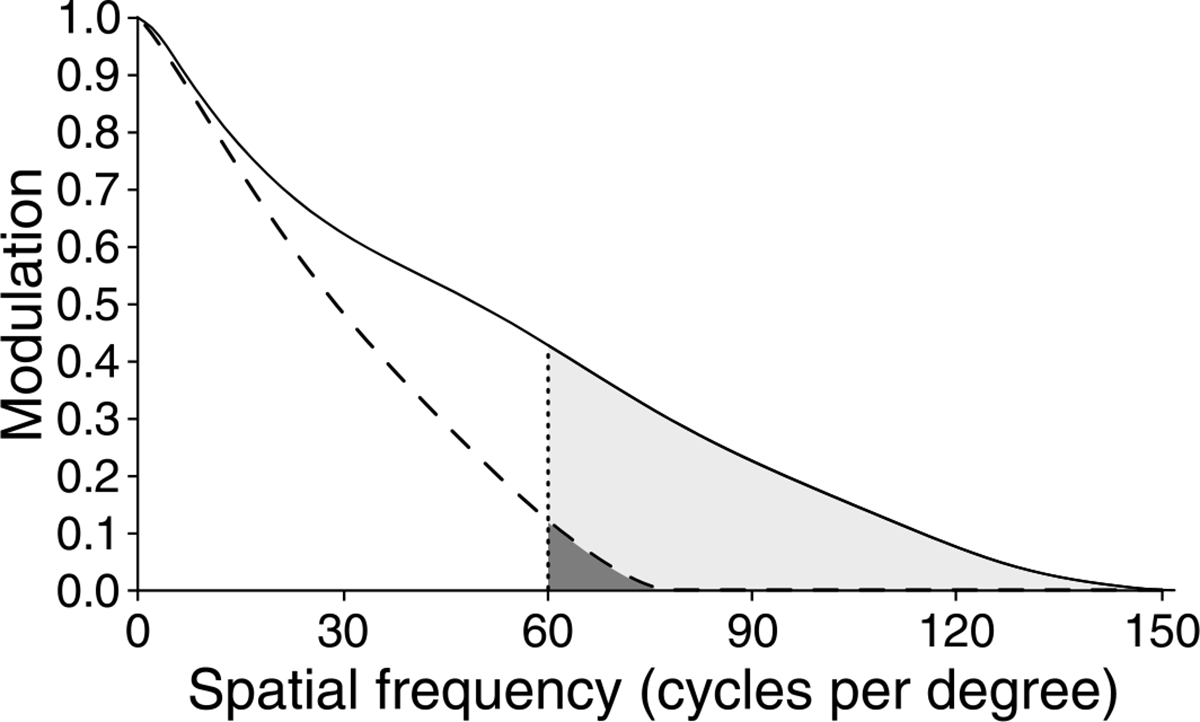
Information beyond the Nyquist limit. Average MTFs for the 3-mm (dashed line) and 5.81-mm (solid line) adaptive-optics-corrected conditions. Vertical dotted line marks the theoretical Nyquist limit of the cone mosaic; shaded areas represents aliasing zone. The aliasing zone is much larger for the 5.81-mm (entire shaded area) than 3-mm condition (darker shaded area).
What’s in an E?
One might ask why use a stimulus such as the tumbling E for measuring visual resolution? This study provides a firm argument for the use of this stimulus. Although it has been shown that the difference in amplitude spectra of orthogonal orientations of both the Snellen E and Landolt C (the two most commonly used optotypes) yield a peak in information at spatial frequencies lower than those corresponding to the gap size (Bondarko & Danilova, 1997), it appears that these cues are not utilized. If observers picked up on this low-frequency information, either (1) a much larger improvement with training would have been observed or (2) much lower thresholds would have been measured initially. Figure 12 shows how the blur from diffraction only will affect the light distribution at the retina for a tumbling E of different sizes and orientations. These images were created by convolving the PSF for diffraction only, with the light distribution of different sized stimuli. Rows a–d show the effect of diffraction blur (for a 5.81-mm pupil) on the four orientations; each column represents a decrease in letter size of a factor of two. From left to right, the gap in the E is: 1, 0.5, 0.25, 0.125, and 0.0625 arcmin; the Snellen equivalent range is from 20/20 to 20/1.25.
Figure 12.
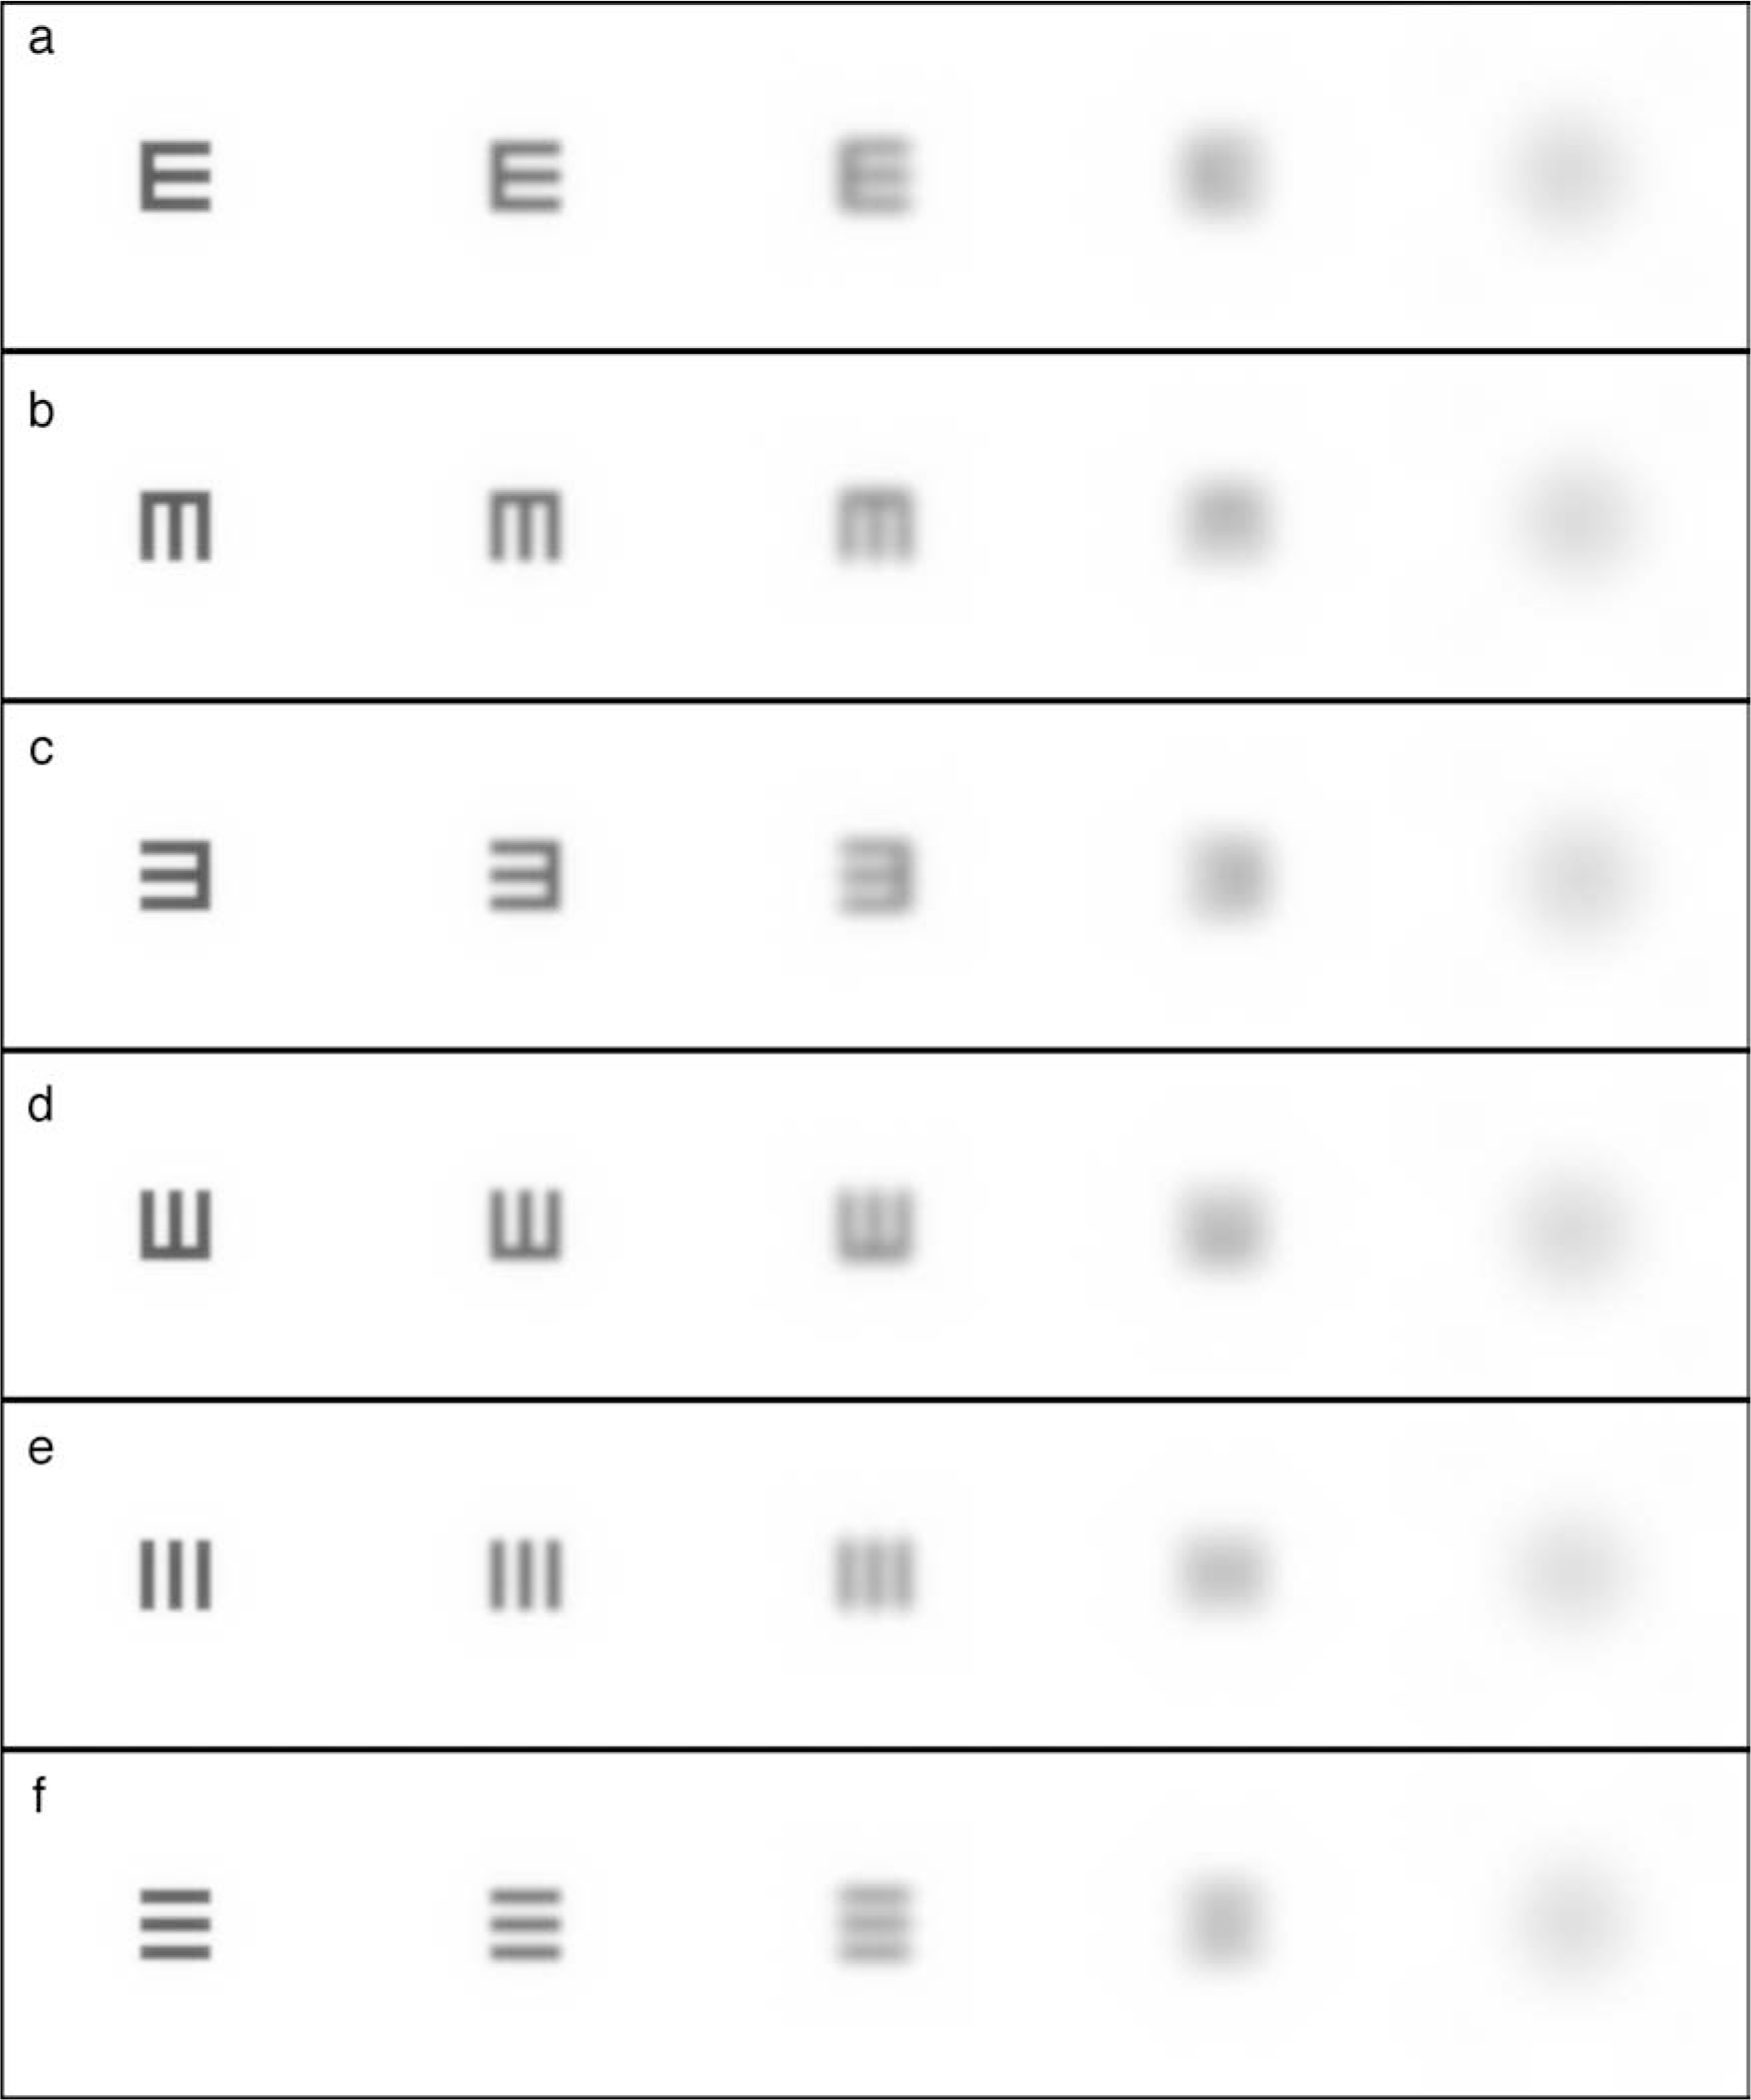
Effect of diffraction blur on tumbling Es and truncated square waves. Rows a–d show tumbling E; rows e and f show truncated square wave. Stimuli are scaled to be the same size so blur may be examined independent of letter size. Actual size halves in each column from left to right. Distances between two parallel strokes of E or two bars in grating are, from left to right: 1, 0.5, 0.25, 0.125, and 0.0625 arcmin. These correspond to Snellen equivalent sizes of 20/20, 20/10, 20/5, 20/2.5, and 20/1.25, respectively.
It can be seen from the letters with 0.125 arcmin gap in column 4 of Figure 12 that even when the information about the parallel strokes of the E have been obliterated by diffraction, the overall pattern looks like a gradient of luminance, being brightest on the side opposite the orthogonal stroke of the E. If observers were using this information, acuities might be expected to approach the smallest letter size used, achieving a MAR of 0.125 arcmin. However, although the low-frequency cue is apparent when looking at the magnified light distribution in Figure 12, it should be remembered that this letter is very small, only 0.625 arcmin high, which is only slightly larger than the spacing between the smallest cones in the center of the fovea. It is more plausible that a larger sized stimulus, such as the 0.25 arcmin (20/5) letter in the middle column of Figure 12, might, when sampled by the cone mosaic, more faithfully represent a luminance gradient that might provide a cue to orientation; however, if observers were using this information, performance on these letter sizes would be expected to markedly improve with training, but as shown in Figure 9a, this was not the case.
Another indication that observers were not relying on this low spatial frequency cue to make their decision is the fact that the errors that observers tended to make did not change with training (Figure 6). If observers learned to use the luminance gradient as a cue to orientation, they might tend to make more 180° errors. This is because the luminance gradient would have both an orientation (that of the embedded truncated square wave in the E) and a direction (darker on one edge than the other). It is plausible that if the observers used this information they would be more likely to get the orientation correct (either horizontal or vertical) and thus increase their error rate for 180° errors. However, error rates for the different error types did not change with training, providing further evidence that observers did not rely on low spatial frequency cues to make their decision in this orientation task.
Although letters are the most commonly used stimuli for measuring visual resolution (more commonly called visual acuity) in the clinic, the favorite stimulus of the vision science community is a grating or a Gabor patch (which is a grating within a Gaussian envelope). So, why not use gratings and just measure contrast sensitivity? One reason the Snellen E was chosen was practical, due to limitations at the time over control of the modulation of the laser in that the laser could only be turned on or off and not modulated to be at intermediate levels; this ruled out using sinusoidal light distributions such as Gabor patches.
A truncated square-wave stimulus could have been used in a two-alternative task, but a pilot study showed that even without training the square-wave task could achieve extremely low thresholds (less than 0.25 arcmin; Snellen equivalent of better than 20/5) when observers used a low spatial frequency cue. This cue is illustrated in rows e and f of Figure 12, which show truncated square waves of the same sizes as the tumbling Es. It can be seen in Figure 12, column 4, that when information about the grating is lost by blurring due to diffraction alone, the task reduces to simply a horizontal versus vertical width judgment, which is a hyperacuity task. The tumbling E task does not suffer from this limitation. The tumbling E task is therefore a powerful tool for studying the limits of visual resolution because it is easy for naïve observers to perform, it is efficient, it does not improve much with training, and it can be interpreted in a sampling limited framework (Anderson & Thibos, 1999).
Learning may not play a significant role in performance on the tumbling E task after AO correction, but it is possible that more complex tasks could show more dramatic benefits from training after AO correction. Recent advancements in the stimulus presentation capabilities of AO systems have allowed for the presentation of more complex stimuli, such as natural scenes (Sawides, Gambra, Pascual, Dorronsoro, & Marcos, 2010). There could be some consequences of AO correction, such as changes in subjective image quality, which may require a period of learning or adaptation. Going forward, it will be important to evaluate the role of adaptation state and learning effects on performance in tasks with more natural stimuli.
Conclusions
AO correction of ocular aberrations in the AOSLO allows observers to achieve an immediate and significant improvement in visual resolution.
Training in an AO-corrected visual resolution task provides a minimal improvement in performance.
Any adaptation to ones’ own aberrations does not hinder AO correction from providing an immediate visual benefit in this visual resolution task.
There is no significant difference in performance in a tumbling E task of visual resolution, when correcting aberrations over a 5.81-mm pupil versus a 3-mm pupil.
The tumbling E task is a powerful tool for studying the limits of visual resolution.
Acknowledgments
This research was supported by National Institutes of Health Grants EY014375 (A.R.) and T32 EY07043 (E.A.R.) and by the National Science Foundation Science and Technology Center for Adaptive Optics, managed by the University of California at Santa Cruz under Cooperative Agreement AST-9876783 (A.R.).
We wish to thank Dennis M. Levi, OD, Ph.D.; Karen K. DeValois, Ph.D.; Gerald Westheimer, OD, Ph.D., FRS, FAAO; and Joel M. Miller, Ph.D., for their helpful discussions concerning this study.
Contributor Information
Ethan A. Rossi, School of Optometry, University of California, Berkeley, CA, USA
Austin Roorda, School of Optometry, University of California, Berkeley, CA, USA.
References
- Anderson RS, & Thibos LN (1999). Sampling limits and critical bandwidth for letter discrimination in peripheral vision. Journal of the Optical Society of America A, 16, 2334–2342. [DOI] [PubMed] [Google Scholar]
- Applegate RA, Ballentine C, Gross H, Sarver EJ, & Sarver CA (2003). Visual acuity as a function of Zernike mode and level of root mean square error. Optometry and Vision Science, 80, 97–105. [DOI] [PubMed] [Google Scholar]
- Applegate RA, Marsack JD, Ramos R, & Sarver EJ (2003). Interaction between aberrations to improve or reduce visual performance. Journal of Cataract and Refractive Surgery, 29, 1487–1495. [DOI] [PubMed] [Google Scholar]
- Artal P, Chen L, Fernández EJ, Singer B, Manzanera S, & Williams DR (2004). Neural compensation for the eye’s optical aberrations. Journal of Vision, 4(4):4, 281–287, http://www.journalofvision.org/content/4/4/4, doi: 10.1167/4.4.4. [DOI] [PubMed] [Google Scholar]
- Atchison DA, Schmid KL, & Pritchard N (2006). Neural and optical limits to visual performance in myopia. Vision Research, 46, 3707–3722. [DOI] [PubMed] [Google Scholar]
- Beard BL, Levi DM, & Reich LN (1995). Perceptual learning in parafoveal vision. Vision Research, 35, 1679–1690. [DOI] [PubMed] [Google Scholar]
- Bland JM, & Altman DG (1986). Statistical methods for assessing agreement between two methods of clinical measurement. Lancet, i, 307–310. [PubMed] [Google Scholar]
- Bondarko VM, & Danilova MV (1997). What spatial frequency do we use to detect the orientation of a Landolt C? Vision Research, 37, 2153–2156. [DOI] [PubMed] [Google Scholar]
- Campbell FW, & Green DG (1965). Optical and retinal factors affecting visual resolution. The Journal of Physiology, 181, 576–593. [DOI] [PMC free article] [PubMed] [Google Scholar]
- Chen L, Artal P, Gutierrez D, & Williams DR (2007). Neural compensation for the best aberration correction. Journal of Vision, 7(10):9, 1–9, http://www.journalofvision.org/content/7/10/9, doi: 10.1167/7.10.9. [DOI] [PubMed] [Google Scholar]
- Chen L, Singer B, Guirao A, Porter J, & Williams DR (2005). Image metrics for predicting subjective image quality. Optometry and Vision Science, 82, 358–369. [DOI] [PubMed] [Google Scholar]
- Coletta NJ, & Watson T (2006). Effect of myopia on visual acuity measured with laser interference fringes. Vision Research, 46, 636–651. [DOI] [PubMed] [Google Scholar]
- Collins JW, & Carney LG (1990). Visual performance in high myopia. Current Eye Research, 9, 217–223. [DOI] [PubMed] [Google Scholar]
- Curcio CA, Sloan KR, Kalina RE, & Hendrickson AE (1990). Human photoreceptor topography. Journal of Comparative Neurology, 292, 497–523. [DOI] [PubMed] [Google Scholar]
- Fine I, & Jacobs RA (2002). Comparing perceptual learning across tasks: A review. Journal of Vision, 2(2):5, 190–203, http://www.journalofvision.org/content/2/2/5, doi: 10.1167/2.2.5. [DOI] [PubMed] [Google Scholar]
- Fiorentini A, & Maffei L (1976). Spatial contrast sensitivity of myopic subjects. Vision Research, 16, 437–438. [DOI] [PubMed] [Google Scholar]
- Georgeson MA, & Sullivan GD (1975). Contrast constancy: Deblurring in human vision by spatial frequency channels. The Journal of Physiology, 252, 627–656. [DOI] [PMC free article] [PubMed] [Google Scholar]
- Grieve K, Tiruveedhula P, Zhang Y, & Roorda A (2006). Multi-wavelength imaging with the adaptive optics scanning laser ophthalmoscope. Optics Express, 14, 12230–12242. [DOI] [PubMed] [Google Scholar]
- Herzog MH, & Fahle M (1997). The role of feedback in learning a vernier discrimination task. Vision Research, 37, 2133–2141. [DOI] [PubMed] [Google Scholar]
- Jaworski A, Gentle A, Zele AJ, Vingrys AJ, & McBrien NA (2006). Altered visual sensitivity in axial high myopia: A local postreceptoral phenomenon? Investigative Ophthalmology & Visual Science, 47, 3695–3702. [DOI] [PubMed] [Google Scholar]
- Johnson CA, & Leibowitz HW (1979). Practice effects for visual resolution in the periphery. Perception & Psychophysics, 25, 439–442. [DOI] [PubMed] [Google Scholar]
- Karni A, Tanne D, Rubenstein BS, Askenasy JJ, & Sagi D (1994). Dependence on REM sleep of overnight improvement of a perceptual skill. Science, 265, 679–682. [DOI] [PubMed] [Google Scholar]
- Liang J, Williams DR, & Miller DT (1997). Supernormal vision and high-resolution retinal imaging through adaptive optics. Journal of the Optical Society of America A, 14, 2884–2892. [DOI] [PubMed] [Google Scholar]
- Liou SW, & Chiu CJ (2001). Myopia and contrast sensitivity function. Current Eye Research, 22, 81–84. [DOI] [PubMed] [Google Scholar]
- Poonja S, Patel S, Henry L, & Roorda A (2005). Dynamic visual stimulus presentation in an adaptive optics scanning laser ophthalmoscope. Journal of Refractive Surgery, 21, 575–580. [DOI] [PubMed] [Google Scholar]
- Porter J, Guirao A, Cox IG, & Williams DR (2001). Monochromatic aberrations of the human eye in a large population. Journal of the Optical Society of America A, 18, 1793–1803. [DOI] [PubMed] [Google Scholar]
- Radhakrishnan H, Pardhan S, Calver RI, & O’Leary DJ (2004). Unequal reduction in visual acuity with positive and negative defocusing lenses in myopes. Optometry and Vision Science, 81, 14–17. [DOI] [PubMed] [Google Scholar]
- Roorda A, Romero-Borja W, Donnelly WJ III, Queener H, Hebert T, & Campbell M (2002). Adaptive optics scanning laser ophthalmoscopy. Optics Express, 10, 405–412. [DOI] [PubMed] [Google Scholar]
- Rossi EA, & Roorda A (2010). The relationship between visual resolution and cone spacing in the human fovea. Nature Neuroscience, 13, 156–157. [DOI] [PMC free article] [PubMed] [Google Scholar]
- Rossi EA, Weiser P, Tarrant J, & Roorda A (2007). Visual performance in emmetropia and low myopia after correction of high-order aberrations. Journal of Vision, 7(8):14, 1–14, http://www.journalofvision.org/content/7/8/14, doi: 10.1167/7.8.14. [DOI] [PubMed] [Google Scholar]
- Sabesan R, & Yoon G (2010). Neural compensation for long-term asymmetric optical blur to improve visual performance in keratoconic eyes. Investigative Ophthalmology & Visual Science, 51, 3835–3839. [DOI] [PMC free article] [PubMed] [Google Scholar]
- Sawides L, Gambra E, Pascual D, Dorronsoro C, & Marcos S (2010). Visual performance with real-life tasks under Adaptive-Optics ocular aberration correction. Journal of Vision, 10(5):19, 1–12, http://journalofvision.org/content/10/5/19, doi: 10.1167/10.5.19. [DOI] [PubMed] [Google Scholar]
- Strang NC, Winn B, & Bradley A (1998). The role of neural and optical factors in limiting visual resolution in myopia. Vision Research, 38, 1713–1721. [DOI] [PubMed] [Google Scholar]
- Subbaram MV, & Bullimore MA (2002). Visual acuity and the accuracy of the accommodative response. Ophthalmic & Physiological Optics, 22, 312–318. [DOI] [PubMed] [Google Scholar]
- Thorn F, Corwin TR, & Comerford JP (1986). High myopia does not affect contrast sensitivity. Current Eye Research, 5, 639. [DOI] [PubMed] [Google Scholar]
- Villegas EA, Alcón E, & Artal P (2008). Optical quality of the eye in subjects with normal and excellent visual acuity. Investigative Ophthalmology & Visual Science, 49, 4688–4696. [DOI] [PubMed] [Google Scholar]
- Webster MA, Georgeson MA, & Webster SM (2002). Neural adjustments to image blur. Nature Neuroscience, 5, 839–840. [DOI] [PubMed] [Google Scholar]
- Westheimer G (1966). The Maxwellian view. Vision Research, 6, 669–682. [DOI] [PubMed] [Google Scholar]
- Westheimer G (2001). Is peripheral visual acuity susceptible to perceptual learning in the adult? Vision Research, 41, 47–52. [DOI] [PubMed] [Google Scholar]
- Westheimer G (2003). Visual acuity. In Kaufman PL & Alm A (Eds.), Adler’s physiology of the eye (10th ed., pp. 453–469). St. Louis, MO: Mosby. [Google Scholar]
- Williams D, Yoon G-Y, Porter J, Guirao A, Hofer H, & Cox I (2000). Visual benefit of correcting higher order aberrations of the eye. Journal of Refractive Surgery, 16, S554–S559. [DOI] [PubMed] [Google Scholar]
- Williams DR (1985). Aliasing in human foveal vision. Vision Research, 25, 195–205. [DOI] [PubMed] [Google Scholar]
- Williams DR, & Coletta NJ (1987). Cone spacing and the visual resolution limit. Journal of the Optical Society of America A, 4, 1514–1522. [DOI] [PubMed] [Google Scholar]
- Wyszecki G, & Stiles WS (1982). Color science: Concepts and methods, quantitative data and formulae (2nd ed.). New York: John Wiley & Sons. [Google Scholar]
- Yoon GY, Jeong TM, Cox IG, & Williams DR (2004). Vision improvement by correcting higher order aberrations with phase plates in normal eyes. Journal of Refractive Surgery, 20, S523–S527. [DOI] [PubMed] [Google Scholar]
- Yoon G-Y, & Williams DR (2002). Visual performance after correcting the monochromatic and chromatic aberrations of the eye. Journal of the Optical Society of America A, 19, 266–275. [DOI] [PubMed] [Google Scholar]


