Abstract
We present snapshot hyperspectral light field tomography (Hyper-LIFT), a highly efficient method in recording a 5D (x, y, spatial coordinates; θ, φ, angular coordinates; λ, wavelength) plenoptic function. Using a Dove prism array and a cylindrical lens array, we simultaneously acquire multi-angled 1D en face projections of the object like those in standard sparse-view computed tomography. We further disperse those projections and measure the spectra in parallel using a 2D image sensor. Within a single snapshot, the resultant system can capture a 5D data cube with 270 × 270 × 4 × 4 × 360 voxels. We demonstrated the performance of Hyper-LIFT in imaging spectral volumetric scenes.
1. INTRODUCTION
An optical field can be characterized by a seven-dimensional (7D) plenoptic function, P (x, y, z, θ, φ, λ, t) (x, y, z, spatial coordinates; θ, φ, emittance angles; λ, wavelength; t, time) [1,2]. Recording light rays along all dimensions unveils a complete profile of the input scene, providing volumetric, spectral, and temporal information. However, a conventional image sensor measures only a two-dimensional (x, y) plenoptic function, throwing away much of the information and leading to an inefficient optical measurement.
Measuring a high-dimensional plenoptic function faces two main challenges: dimension reduction and measurement efficiency. On the one hand, because most photon detectors are in two dimensions (2D) (i.e., image sensors), one dimension (1D) (i.e., line sensors), or zero dimensions (0D) (i.e., single pixel sensors), capturing a high-dimensional plenoptic function with a low-dimensional detector usually requires extensive scanning along another dimension. For example, to acquire a plenoptic data cube (x, y, λ), a hyperspectral imager typically scans in either the spatial domain [3,4] or spectral domain [5–7], resulting in a prolonged acquisition. By contrast, snapshot techniques like an image mapping spectrometer (IMS) [8–11], coded aperture snapshot spectral imaging [12–14], and computed tomography imaging spectrometry [15,16] optically remap a 3D (x, y, λ) plenoptic data cube to a 2D detector array, enabling parallel measurement of data cube voxels and maximizing the light throughput [17,18]. To characterize this ability, we define a dimension reduction factor as , where NP and ND are the dimensionalities of the plenoptic function to be measured and the detector deployed, respectively. Because low-dimensional detectors usually image faster and cost less than their high-dimensional counterparts, the greater the ϵ, the higher the frame rate, and the more economical the system. On the other hand, under the conventional Nyquist sampling condition, measuring a high-dimensional plenoptic function usually requires the detector array to have a large number of elements, posing challenges with the data transfer and storage. An effective approach to break this limitation is compressed sensing [19–23], which allows using much fewer measurements to recover a scene, provided that the object can be considered sparse in a specific domain. To quantify the sampling efficiency, we define a compression ratio as , where SN and SC are the sampling number determined by the Nyquist–Shannon theorem and compressed sensing, respectively. The higher the r, the more efficient the measurement.
Although techniques have advanced significantly in reducing the dimensionality of a plenoptic function, it is nontrivial to build an imager with a large compression ratio while maintaining high image quality. For example, in hyperspectral light field imaging, to acquire a 5D data cube (x, y, θ, φ, λ), most current imagers [24–28] are built on Nyquist sampling and provide only a unity compression ratio r = 1. For a given detector array, this leads to a trade-off between the samplings along the spatial, spectral, and angular axes. For example, in an IMS-based hyperspectral light field camera [28], the total number of plenoptic data cube voxels is limited to 66 × 66 × 5 × 5 × 40 (x, y, θ, φ, λ), restricting its application in high-resolution imaging. Although this trade-off can be alleviated by using a multiple-camera configuration [24,25,29], it increases the system’s form factor and complexity. Alternatively, Xue et al. utilized compressed sensing to recover a 5D data cube (x, y, θ, φ, λ) of size 1000 × 1000 × 3 × 3 × 31 from undersampled measurements in the spectral domain but with only a modest compression ratio of 3.4 [30]. It is challenging to scale up the compression ratio because the freedom of choosing a low-coherence sensing matrix is limited by the fabrication complexity of filters with an arbitrary transmission spectral curve.
To overcome this problem, we present a new multidimensional imaging architecture and demonstrate it in 5D (x, y, θ, φ, λ) plenoptic imaging. The resultant method, referred to as snapshot hyperspectral light field tomography (Hyper-LIFT), can capture a 270 × 270 × 4 × 4 × 360 (x, y, θ, φ, λ) data cube using a 2D detector array in a single snapshot. Based on the same conceptual thread as light field tomography (LIFT) [31], Hyper-LIFT is highly efficient in acquiring the light field data through simultaneously recording en face parallel beam projections of the input scene along sparsely spaced angles, enabling a compression ratio of 16.8. Moreover, Hyper-LIFT captures additional spectral information by further dispersing the en face beam projections in the spectral domain. By converting the angular information to depths, we demonstrated Hyper-LIFT in hyperspectral volumetric imaging.
2. METHOD
A. Imaging Formation and Optical Setup
The core idea of Hyper-LIFT is to reformulate the light field acquisition as a sparse-view computed tomography (CT) problem. To create multi-angled en face parallel beam projections of an object, we put an array of rotated Dove prisms and cylindrical lenses at the pupil plane of a main objective lens and image the object from different perspectives. For a given perspective, the image formation model through a rotated Dove prism and a cylindrical lens (i.e., a subfield) is shown in Fig. 1. The Dove prism rotates the input perspective image by an angle of 2θ, where θ is the rotation angle of the Dove prism itself. The rotated perspective image is then imaged by a cylindrical lens. The resultant image is essentially a convolution of the geometric image of the rotated object and a line spread function provided by the cylindrical lens. We put a slit at the back focal plane of the cylindrical lens and sample the image along the horizontal axis. The 1D signals obtained is a “projection” of the object at the angle of 2θ, resembling the projection measurement in traditional x-ray CT. The image formation can be formulated as
| (1) |
where g is the vectorized two-dimensional (2D) perspective image, Rθ is the rotation operator representing the function of the Dove prism at the angle θ, T denotes the signal integration by the cylindrical lens at the 1D slit, and bθ is the 1D signal sampled by the slit. After passing through a diffraction grating, the 1D projection is dispersed along the vertical axis. The final image is measured by a 2D detector array, and the spectral channels of the projection are obtained simultaneously.
Fig. 1.
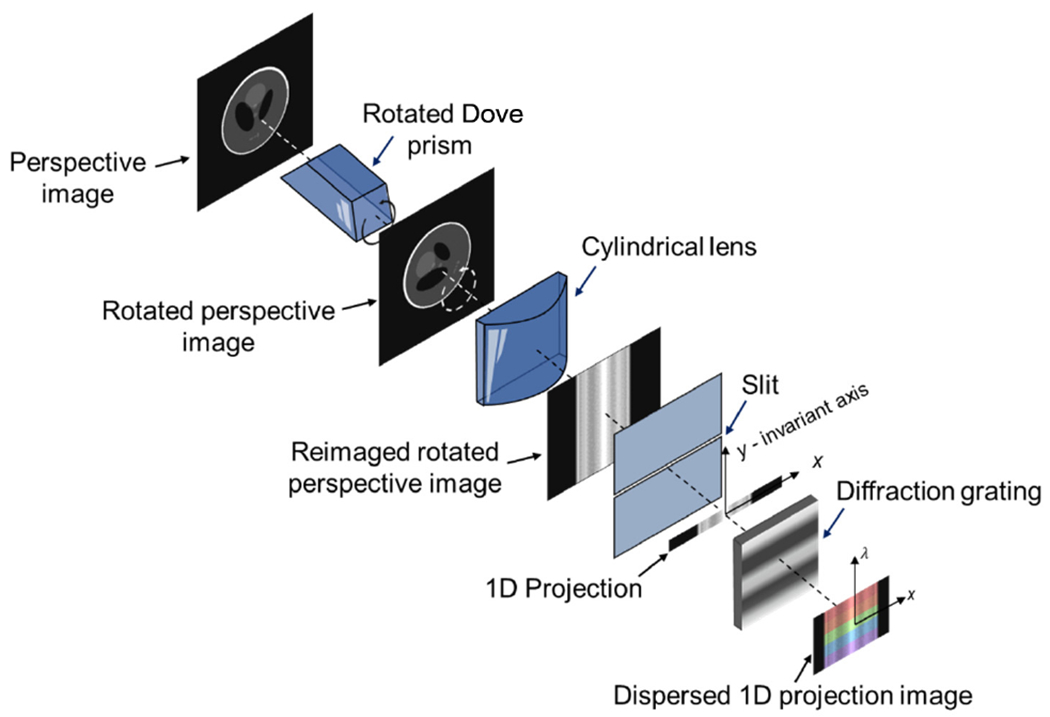
Image formation model.
In Hyper-LIFT, we use an array of Dove prisms with varied rotation angles to acquire the dispersed en face projections in parallel. The forward model with n Dove prisms can be formulated as
| (2) |
where A is the forward operator representing the parallel beam projections at different angles, and b(λ) is the sinogram at wavelength λ. Because each Dove prism observes the same scene from different perspectives, the light field is naturally sampled in the projection data with an angular resolution equal to the number of Dove prisms.
The schematic of the optical setup is shown in Fig. 2. The object locates at the front focal plane of an objective lens (f = 50 mm, f/# = 1.4). The field of view of the system is ~ 3 mm. A Dove prism array that comprises 16 multi-angled Dove prisms (height = 2 mm, length = 8.4 mm, and spacing between adjacent prisms = 2.9 mm) is located at the back focal plane of the objective lens. After the Dove prism array, a 5 × 1 cylindrical lens array (height = 2 mm, length = 12 mm, focal length = 20 mm) focuses the collimated beam onto a 4 × 1 slit array (width = 10 μm), which slices the input image. The resultant 1D projections are reimaged to a CCD sensor (Lumenera, Lt16059H; pixel pitch = 7.4 μm) using a 4 f relay system (f = 100 mm, f/# = 2). A transmission diffraction grating (300 groves/mm) is located at the Fourier plane of the relay system to disperse the projections. The Dove prism array and cylindrical lens array are detailed in Supplement 1.
Fig. 2.
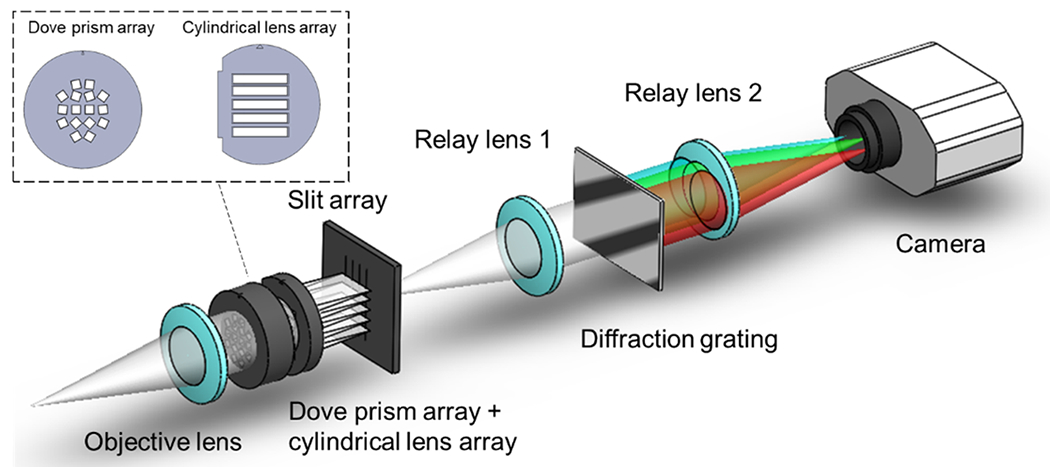
Optical schematic of a Hyper-LIFT camera.
In Hyper-LIFT, the spatial sampling of the projections can be calculated as the height of a Dove prism divided by the camera pixel pitch. The spectral sampling of the reconstructed data cube is limited by the spacing between adjacent Dove prisms. The angular sampling is determined by the number of Dove prisms and their locations at the pupil plane. In our setup, the reconstructed data cube has a dimension of 270 × 270 × 4 × 4 × 360 (x, y, θ, φ, λ). Noteworthily, in Hyper-LIFT, only the voxels along the spectral dimension are directly mapped onto the 2D sensor, while the spatial and angular voxels are multiplexed in projection measurement. Additionally, instead of acquiring the entire set of projections under the Nyquist sampling condition, Hyper-LIFT measures only a sparse subset of the projections based on compressed sensing. By contrast, previous multidimensional imagers [26–28,32] directly map plenoptic data cube voxels to a 2D image sensor. As a result, the size of the reconstructed data cube is limited by the available sensor pixels, leading to a trade-off between spatial, angular, and spectral sampling. Using compressed sensing, Hyper-LIFT alleviates this trade-off, thereby enabling the measurement of a large format plenoptic function.
Like conventional sparse-view CT, Hyper-LIFT requires the object to be sparse in a specific domain. We quantified the resolution under such a condition by imaging a point object (a 10 μm pinhole). The lateral and axial resolution resolutions are measured as the full width half-maximum (FWHM) of the impulse response along the lateral and axial direction, respectively (in Supplement 1, Fig. S3). The measured lateral and axial resolutions are 22 μm and 1 mm, respectively.
B. Image Reconstruction
In Hyper-LIFT, because the number of projections n is smaller than the pixel resolution of the input perspective image, Eq. (2) is under-determined and hence can be considered as a sparse-view CT problem [33]. The image reconstruction of a monochromatic scene can be achieved by iteratively solving the optimization problem:
| (3) |
where φ(g) is a transform function that sparsifies the image, ⋅1 is the l1 norm, and ρ is the hyperparameter that weights the regularization term. More details of solving this inverse problem and the sparsity requirements can be found in [31]. A reconstruction example of a planar monochromatic scene is shown in Fig. 3. To limit the illumination bandwidth, a 3 nm bandpass filter centered at 532 nm was placed right after a broadband light source (Amscope, HL250-AS). The ground truth and a raw image captured by the Hyper-LIFT camera are shown in Figs. 3(a) and 3(b), respectively. The sliced projections are along the vertical axis, and the spectra of the projections are dispersed along the horizontal axis. To perform image reconstruction, we first divide the raw image into 16 subfields, each containing a projection. Next, the projections are extracted based on their center coordinates, which can be calibrated by imaging an optical pinhole. Finally, the object is reconstructed using Eq. (3), and the reconstruction result is illustrated in Fig. 3(c).
Fig. 3.
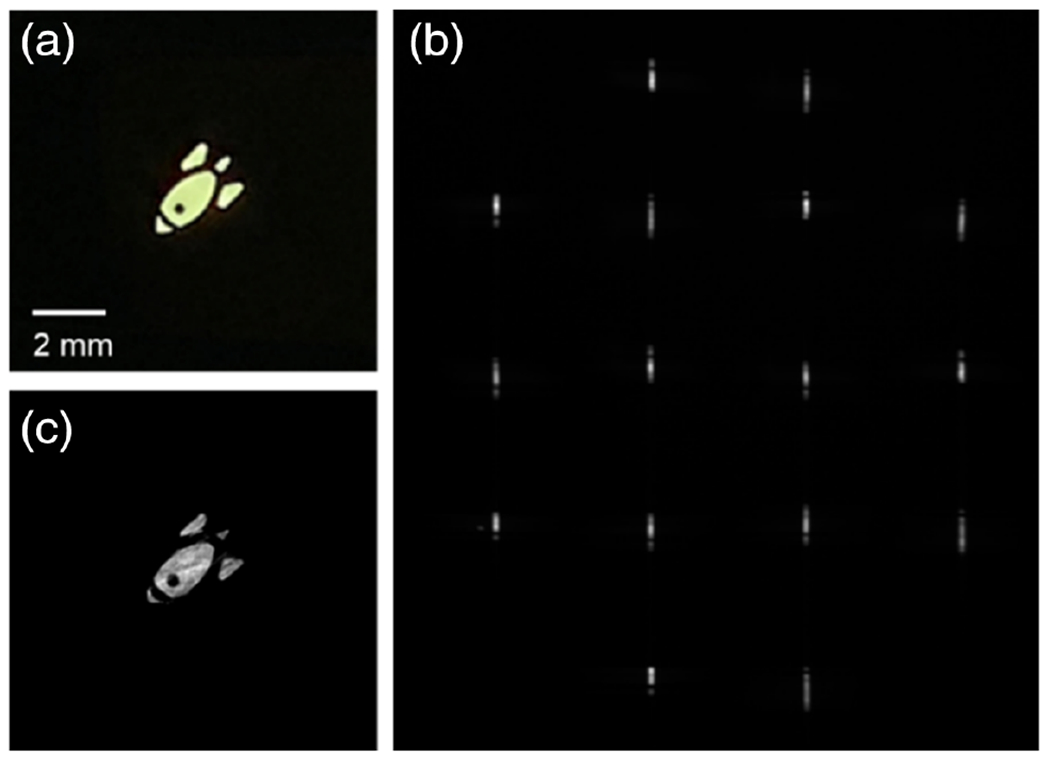
Reconstruction of a planar object illuminated by monochromatic light (wavelength, 532 nm). (a) Ground-truth photographic image. (b) Raw Hyper-LIFT image. (c) Reconstructed image.
To reconstruct images at different wavelengths, we apply Eq. (3) to the corresponding sinogram b(λ). Because the spectrum is dispersed along one axis, the projection at wavelength λ can be directly obtained by extracting the line image at the corresponding position, which can be deduced from the chromatic dispersion curve of the diffraction grating. The calibration of the dispersion curve is detailed in Supplement 1. The spectral range and resolution can be deduced from the dispersion curve, and they are 90 nm and 0.25 nm, respectively, in the current setup. It is worth noting that the spectral range and resolution are scalable by using a different dispersion element or a different focal length relay system.
The whole reconstruction process can be divided into two steps: wavelength selection and CT reconstruction. Because the spectrum is directly dispersed on the detector using a diffraction grating, projections at different wavelength can be extracted using the dispersion curve, where the computational cost is negligible. In the CT reconstruction process, the image reconstruction speed is mainly dependent on the reconstruction algorithm applied. For example, when simply applying the inverse Radon transform through fast Fourier transform, the object can be reconstructed instantaneously. However, when using an iterative algorithm to improve image quality, the reconstruction takes ~5 s for each wavelength on a personal computer (CPU, Intel Core i7-5700HQ).
C. Digital Refocusing
In a conventional light field camera, the acquired light field L can be parameterized by the aperture plane (u, v) and the image plane (x, y) as shown in Fig. 4(a). For a synthetic image plane (x′, y′) defined by a shifting parameter α, the irradiance can be calculated as [34]
| (4) |
Fig. 4.
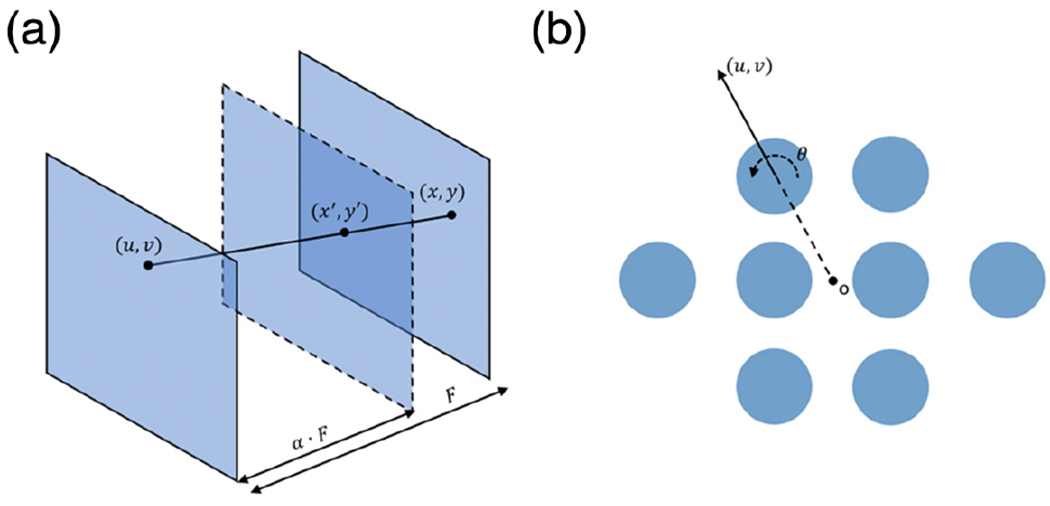
Digital refocusing in Hyper-LIFT. (a) Refocusing a synthetic image plane in a conventional light field camera. (b) In Hyper-LIFT, the shifting vector is determined by the pupil coordinate and the rotation angle of the Dove prism. Each blue circle denotes a Dove prism.
Digital refocusing is achieved by shifting and adding up subaperture images. Unlike conventional light field cameras, Hyper-LIFT employs a Dove prism array to rotate the input scene, and their effect must be accounted for when calculating the shifting vector. Here, we denote the original shifting vector as s ⋅ (u, v), where (u, v) is image translation direction vector and s is the translation distance (i.e. shearing parameter). As illustrated in Fig. 4(b), the vector (u, v) is determined by the pupil coordinate and the rotation angle of the Dove prism. If the Dove prism is rotated by θ/2, the resultant shifting vector can be derived as follows:
| (5) |
Because Dove prisms rotate the input scene based on total internal reflection (TIR), an extra flipping matrix is added to reflect the redirection of light rays. The updated shifting vector is then applied to translating subaperture projections to obtain an updated sinogram. The final refocused image can be reconstructed using a classic computational tomography algorithm, such as analytic filtered backprojection [35].
3. RESULTS
A. Hyperspectral Imaging of a Planar Object
We first demonstrated our system in imaging a rainbow planar object [Fig. 3(a)]. The illumination setup is shown in Fig. 5(a). A linear variable visible range bandpass filter (Edmund optics, 88365) is located at the conjugate plane of the planar object, illuminated by a broadband light source. To fit more wavelengths into the field of view, a 3.3:1 lens pair (Thorlabs, MAP1030100-A) is used to demagnify the linear filter. In this way, each lateral coordinate of the planar object is encoded with a unique color. At a given location, the spectral resolution of the linear variable filter is 7–20 nm. The raw image captured by the Hyper-LIFT camera is shown in Fig. 5(b). Compared to the monochromatic data in Fig. 3(b), the spectrum is dispersed along the horizontal axis. The projections at different wavelengths are extracted based on the chromatic dispersion curve. The pseudo-colored reconstructed panchromatic image and four representative color channels are shown in Fig. 5(c). A video shows the sweeping of wavelengths of the captured scene from 510 to 540 nm, with a step size = 1 nm (Visualization 1). This experiment demonstrates the hyperspectral imaging capability of our system.
Fig. 5.
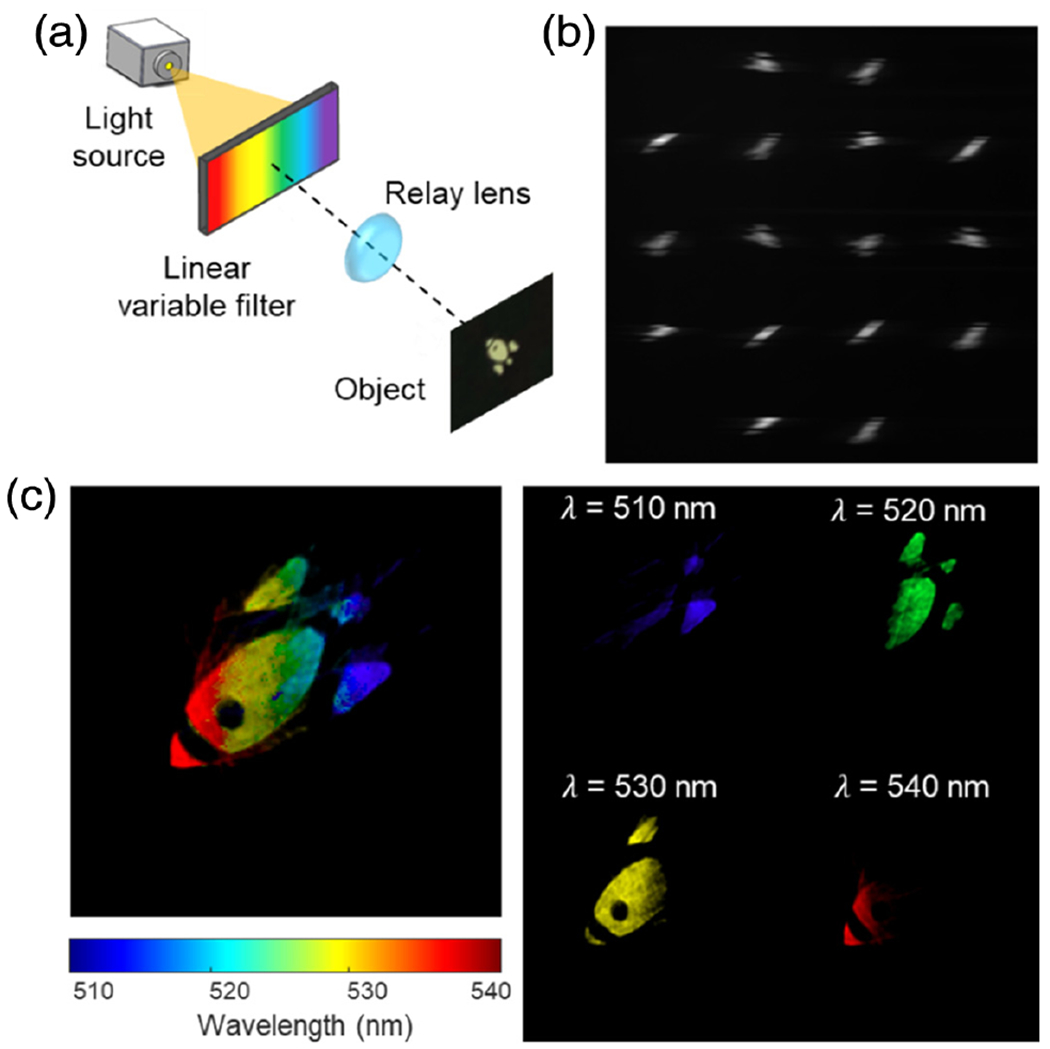
Hyperspectral imaging of a planar object. (a) Illumination setup. (b) Raw Hyper-LIFT image. (c) Pseudo-colored reconstructed panchromatic image and four representative color channels.
B. Hyperspectral Volumetric Imaging of a 3D Object
To demonstrate hyperspectral volumetric imaging enabled by light field capture, we imaged a 3D-printed object illuminated by a broadband light source. To avoid cross talk between adjacent subaperture images, a 40 nm bandpass filter at 550 nm is used to limit the illumination bandwidth. An en face photograph of the object is shown in Fig. 6(a). The letters “U” and “C” were 3D printed at different depths (depth difference = 6 mm). The object is imaged to the front focal plane of the objective lens by a demagnifying relay lens pair (Thorlabs, MAP1030100-A). To render a focal image stack, digital refocusing is performed by calculating the shifting direction vector (u, v) and then changing the shearing parameter s in Eq. (5). In practice, the shearing parameter s can be converted to a real depth. The shearing to depth calibration is detailed in Supplement 1. The reconstructed 3D image and two representative numerically refocused images at the two letters’ depths are shown in Fig. 6(b). The pixel intensities within the boxed area in Fig. 6(b) are averaged, and a spectrum is shown in Fig. 6(c). A video shows the sweeping of focal plane images from −3 to 3 mm at 532 nm (Visualization 2). Finally, we quantified the level of defocus by calculating the sharpness of the object at each refocused depth [Fig. 6(d)]. Here sharpness is defined by , where I(x, y) is the pixel value at the letter location. The sharpness of letters “U” and “C” reaches a maximum at 0.8 mm and 0 mm, respectively, which gives the physical depth of two letters in the object space of Hyper-LIFT.
Fig. 6.
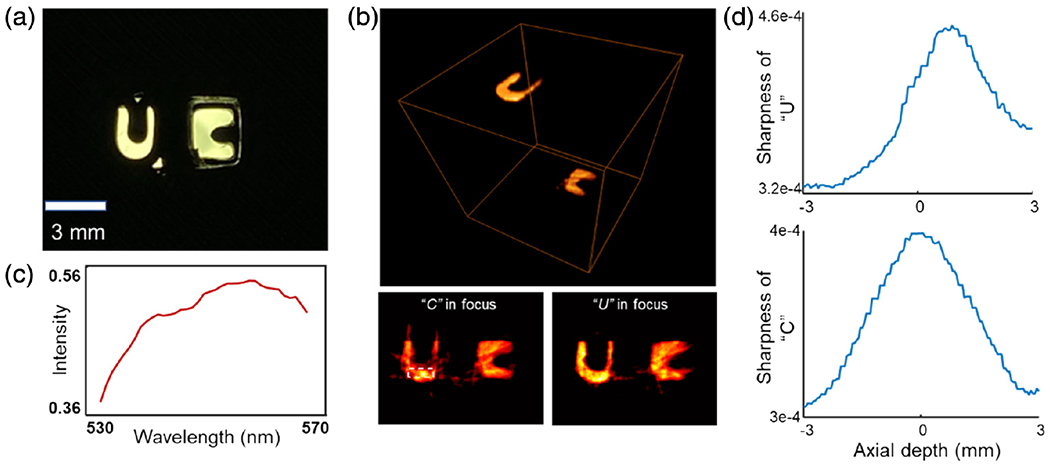
Hyperspectral volumetric imaging of a 3D object. (a) Ground-truth en face image of the object. “U” and “C” were printed at two different depths. (b) Reconstructed 3D image and two numerically refocused images at the letters’ depths. (c) Spectrum averaged within the dashed boxed area in the low left panel of (c). (d) Sharpness versus depth at two letter locations.
4. DISCUSSION
The application of hyperspectral light field imaging continues to expand, with a variety of technologies sprouting in the past five years. Despite impressive functionality, these techniques have not been discussed in a common framework. Multidimensional imagers are typically evaluated in terms of the snapshot factor [18], which describes the portion of the plenoptic data cube voxels that can be seen by the imager at a time. The greater the snapshot factor, the higher the light throughput. However, the snapshot factor does not reflect the easiness of acquiring high-dimensional data with practical photodetectors. Therefore, we added two additional metrics—dimension reduction factor ϵ and data compression ratio r—to fully characterize the performance of multidimensional imagers. As an example, Table 1 shows a comparison of several state-of-the-art single-camera-based hyperspectral light field imagers, where Hyper-LIFT shows a clear edge over other imagers in the overall performance.
Table 1.
Comparison of Hyperspectral Light Field Imagers in Snapshot Factor ξ, Dimension Reduction Factor ϵ, and Data Compression Ratio r
| ξ | ϵ | r | |
|---|---|---|---|
| Tunable filter hyperspectral light field camera [38] | 0.09–0.13 | 2.5 | 1 |
| Spatial-scanning hyperspectral light field camera [39] | 0.04 | 2.5 | 1 |
| Light field Fourier transform imaging spectroscopy (FTIS) [26] | 1 | 2.5 | 1 |
| Light field IMS [28] | 1 | 2.5 | 1 |
| Spectrally coded catadioptric mirror array imaging [30] | 1 | 2.5 | 3.4 |
| Hyper-LIFT | 1 | 2.5 | 16.8 |
It is noteworthy that, when designing the system, the light efficiency is collectively determined by the desired spectral resolution and the field of view (FOV). On the one hand, a wider slit increases the light throughput, but it also increases the cross talk between adjacent color channels, resulting in a reduced spectral resolution. On the other hand, imaging a large FOV can reduce the light efficiency because an off-axis field point requires the cylindrical lens to provide an elongated line spread function (LSF) in order to extend the signals to the slit location, which, in turn, decreases the irradiance at the slit. Therefore, there is a trade-off between the light throughput and the spectral resolution and the FOV.
Like standard CT, the spatial resolution of Hyper-LIFT is collectively determined by the number of projections and the angle distribution. By contrast, the spectral dimension is directly mapped to the camera without resolution loss. Figure 7(a) shows the peak signal-to-noise ratio (PSNR) versus the number of projections in the reconstructed image for a simulated circular object. The result indicates that the larger the number of the projections, the higher the PSNR. Additionally, Hyper-LIFT provides a uniform projection angle distribution from 0 to π, which minimizes the correlations in the projection data and maximizes information content for reconstruction [31]. This is made possible by using a rotated Dove prism array. By contrast, our previous LIFT system creates the projections using rotated cylindrical lenses, leading to a limited view problem. More specifically, the LIFT system only captures the projections with an angle in , rather than . Therefore, the features along vertical dimension cannot be faithfully reconstructed (a more detailed discussion can be found in supplementary materials of Ref. [31]). To demonstrate the capability of Hyper-LIFT in overcoming this problem, we imaged a group of bars of a USAF resolution target (Group 0 element 6) along both horizontal and vertical directions [Fig. 7(b)]. We further plot the intensity along the dashed line in both images. The average FWHM of a bar is 11 and 12 pixels along the vertical and horizontal direction, respectively. This result indicates that our system has the ability to equally resolve the object features along two orthogonal directions.
Fig. 7.
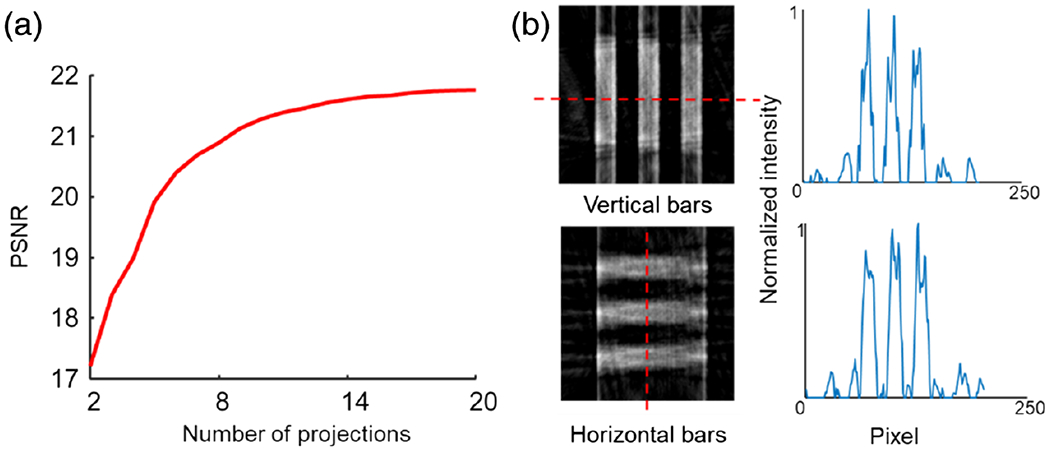
Reconstruction quality in Hyper-LIFT. (a) Peak signal-to-noise ratio (PSNR) versus number of projections. (b) Resolving USAF resolution bars along the vertical and horizontal directions. The light intensities (right panel) were plot along the dashed lines in the reconstructed images.
In conclusion, we developed and experimentally demonstrated a versatile snapshot Hyper-LIFT imager. As shown in Table 1, the system outperforms other state-of-the-art hyperspectral light field imagers in both the snapshot factor and data compression ratio allowed, and it is the only imager that can perform a large-scale hyperspectral light field measurement using a 2D detector array with a moderate format. Because the frame rate of cameras is generally proportional to the reciprocal of the total number of camera pixels in use, our compressed measurement scheme has an advantage in imaging speed. For example, when reading out only the regions of interest (ROIs) that receive light signals from the camera, our system can measure a 5D data cube (x, y, θ, φ, λ) with 270 × 270 × 4 × 4 × 360 voxels at 30 Hz. By contrast, our previous uncompressed (i.e., direct mapping) hyperspectral light field camera [28] can operate at only 5 Hz, even when measuring a data cube of a much smaller size (66 × 66 × 5 × 5 × 40 voxels). This capability is highly desired in imaging applications that simultaneously require a high spatial, spectral, and temporal resolution, such as snapshot spectral-domain optical coherent tomography (SD-OCT) [36,37], where the previous system suffers from the trade-off between the spatial and spectral resolution. Therefore, we believe the Hyper-LIFT approach will be uniquely positioned in addressing the leading challenges in multidimensional optical imaging [2].
Supplementary Material
Funding.
National Institutes of Health (R01EY029397).
Footnotes
Disclosures. The authors declare no conflicts of interest.
Supplemental document. See Supplement 1 for supporting content.
Data availability.
Data and codes underlying this work may be obtained from the corresponding author upon reasonable request.
REFERENCES
- 1.Adelson EH and Bergen JR, “The plenoptic function and the elements of early vision,” in Computational Models of Visual Processing (MIT, 1991), pp. 3–20. [Google Scholar]
- 2.Gao L and Wang LV, “A review of snapshot multidimensional optical imaging: measuring photon tags in parallel,” Phys. Rep 616, 1–37 (2016). [DOI] [PMC free article] [PubMed] [Google Scholar]
- 3.Abdo M, Badilita V, and Korvink J, “Spatial scanning hyperspectral imaging combining a rotating slit with a Dove prism,” Opt. Express 27, 20290–20304 (2019). [DOI] [PubMed] [Google Scholar]
- 4.Hsu YJ, Chen C-C, Huang C-H, Yeh C-H, Liu L-Y, and Chen S-Y, “Line-scanning hyperspectral imaging based on structured illumination optical sectioning,” Biomed. Opt. Express 8, 3005–3016 (2017). [DOI] [PMC free article] [PubMed] [Google Scholar]
- 5.Cu-Nguyen P-H, Grewe A, Hillenbrand M, Sinzinger S, Seifert A, and Zappe H, “Tunable hyperchromatic lens system for confocal hyperspectral sensing,” Opt. Express 21, 27611–27621 (2013). [DOI] [PubMed] [Google Scholar]
- 6.Di Caprio G, Schaak D, and Schonbrun E, “Hyperspectral fluorescence microfluidic (HFM) microscopy,” Biomed. Opt. Express 4, 1486–1493 (2013). [DOI] [PMC free article] [PubMed] [Google Scholar]
- 7.Phillips MC and Hô N, “Infrared hyperspectral imaging using a broadly tunable external cavity quantum cascade laser and microbolometer focal plane array,” Opt. Express 16,1836–1845 (2008). [DOI] [PubMed] [Google Scholar]
- 8.Gao L, Kester RT, and Tkaczyk TS, “Compact image slicing spectrometer (ISS) for hyperspectral fluorescence microscopy,” Opt. Express 17, 12293–12308 (2009). [DOI] [PMC free article] [PubMed] [Google Scholar]
- 9.Gao L, Smith RT, and Tkaczyk TS, “Snapshot hyperspectral retinal camera with the image mapping spectrometer (IMS),” Biomed. Opt. Express 3, 48–54 (2012). [DOI] [PMC free article] [PubMed] [Google Scholar]
- 10.Gao L, Kester RT, Hagen N, and Tkaczyk TS, “Snapshot image mapping spectrometer (IMS) with high sampling density for hyperspectral microscopy,” Opt. Express 18,14330–14344 (2010). [DOI] [PMC free article] [PubMed] [Google Scholar]
- 11.Pawlowski ME, Dwight JG, Nguyen T-U, and Tkaczyk TS, “High performance image mapping spectrometer (IMS) for snapshot hyperspectral imaging applications,” Opt. Express 27, 1597–1612 (2019). [DOI] [PMC free article] [PubMed] [Google Scholar]
- 12.Wagadarikar A, John R, Willett R, and Brady D, “Single disperser design for coded aperture snapshot spectral imaging,” Appl. Opt 47, B44–B51 (2008). [DOI] [PubMed] [Google Scholar]
- 13.Wagadarikar AA, Pitsianis NP, Sun X, and Brady DJ, “Video rate spectral imaging using a coded aperture snapshot spectral imager,” Opt. Express 17, 6368–6388 (2009). [DOI] [PubMed] [Google Scholar]
- 14.Wang L, Xiong Z, Gao D, Shi G, and Wu F, “Dual-camera design for coded aperture snapshot spectral imaging,” Appl. Opt 54, 848–858 (2015). [DOI] [PubMed] [Google Scholar]
- 15.Ford BK, Descour MR, and Lynch RM, “Large-image-format computed tomography imaging spectrometer for fluorescence microscopy,” Opt. Express 9, 444–453 (2001). [DOI] [PubMed] [Google Scholar]
- 16.Descour M and Dereniak E, “Computed-tomography imaging spectrometer: experimental calibration and reconstruction results,” Appl. Opt 34, 4817–4826 (1995). [DOI] [PubMed] [Google Scholar]
- 17.Hagen N and Kudenov M, “Review of snapshot spectral imaging technologies,” Opt. Eng 52, 090901 (2013). [Google Scholar]
- 18.Hagen N, Gao L, Tkaczyk T, and Kester R, “Snapshot advantage: a review of the light collection improvement for parallel high-dimensional measurement systems,” Opt. Eng 51, 111702 (2012). [DOI] [PMC free article] [PubMed] [Google Scholar]
- 19.Rivenson Y, Stern A, and Javidi B, “Overview of compressive sensing techniques applied in holography [Invited],” Appl. Opt 52, A423–A432 (2013). [DOI] [PubMed] [Google Scholar]
- 20.Brady DJ, Choi K, Marks DL, Horisaki R, and Lim S, “Compressive holography,” Opt. Express 17, 13040–13049 (2009). [DOI] [PubMed] [Google Scholar]
- 21.Clemente P, Durán V, Tajahuerce E, Andrés P, Climent V, and Lancis J, “Compressive holography with a single-pixel detector,” Opt. Lett 38, 2524–2527 (2013). [DOI] [PubMed] [Google Scholar]
- 22.Rivenson Y, Stern A, and Rosen J, “Reconstruction guarantees for compressive tomographic holography,” Opt. Lett 38, 2509–2511 (2013). [DOI] [PubMed] [Google Scholar]
- 23.Horisaki R, Tanida J, Stern A, and Javidi B, “Multidimensional imaging using compressive Fresnel holography,” Opt. Lett 37, 2013–2015 (2012). [DOI] [PubMed] [Google Scholar]
- 24.Xiong Z, Wang L, Li H, Liu D, and Wu F, “Snapshot hyperspectral light field imaging,” in IEEE Conference on Computer Vision and Pattern Recognition (CVPR) (IEEE, 2017), pp. 3270–3278. [Google Scholar]
- 25.Zhu K, Xue Y, Fu Q, Kang SB, Chen X, and Yu J, “Hyperspectral light field stereo matching,” IEEE Trans. Pattern Anal. Mach. Intell 41, 1131–1143 (2019). [DOI] [PubMed] [Google Scholar]
- 26.Zhu S, Gao L, Zhang Y, Lin J, and Jin P, “Complete plenoptic imaging using a single detector,” Opt. Express 26, 26495–26510 (2018). [DOI] [PubMed] [Google Scholar]
- 27.Lv X, Li Y, Zhu S, Guo X, Zhang J, Lin J, and Jin P, “Snapshot spectral polarimetric light field imaging using a single detector,” Opt. Lett 45, 6522–6525 (2020). [DOI] [PubMed] [Google Scholar]
- 28.Cui Q, Park J, Smith RT, and Gao L, “Snapshot hyperspectral light field imaging using image mapping spectrometry,” Opt. Lett 45, 772–775 (2020). [DOI] [PMC free article] [PubMed] [Google Scholar]
- 29.Holloway J, Mitra K, Koppal S, and Veeraraghavan A, “Generalized assorted camera arrays: robust cross-channel registration and applications,” IEEE Trans. Image Process. 24, 823–835 (2015). [DOI] [PubMed] [Google Scholar]
- 30.Xue Y, Zhu K, Fu Q, Chen X, and Yu J, “Catadioptric hyperspectral light field imaging,” in IEEE Conference on Computer Vision and Pattern Recognition, October 2017, pp. 985–993. [Google Scholar]
- 31.Feng X and Gao L, “Ultrafast light field tomography for snapshot transient and non-line-of-sight imaging,” Nat. Commun 12, 2179 (2021). [DOI] [PMC free article] [PubMed] [Google Scholar]
- 32.Park J, Feng X, Liang R, and Gao L, “Snapshot multidimensional photography through active optical mapping,” Nat. Commun 11, 5602 (2020). [DOI] [PMC free article] [PubMed] [Google Scholar]
- 33.Kudo H, Suzuki T, and Rashed EA, “Image reconstruction for sparse-view CT and interior CT-introduction to compressed sensing and differentiated backprojection,” Quant. Imag. Med. Surg 3, 147–161 (2013). [DOI] [PMC free article] [PubMed] [Google Scholar]
- 34.Ng R, Levoy M, Brédif M, Duval G, Horowitz M, and Hanrahan P, “Lightfield photography with a hand-held plenoptic camera,” Stanford Technical Report CTSR 2005-02 (2005), pp. 1–11. [Google Scholar]
- 35.Kak AC and Slaney M, Principles of Computerized Tomographic Imaging (IEEE, 1988). [Google Scholar]
- 36.Nguyen T-U, Pierce MC, Higgins L, and Tkaczyk TS, “Snapshot 3D optical coherence tomography system using image mapping spectrometry,” Opt. Express 21, 13758–13772 (2013). [DOI] [PMC free article] [PubMed] [Google Scholar]
- 37.Iyer RR, Žurauskas M, Cui Q, Gao L, Smith RT, and Boppart SA, “Full-field spectral-domain optical interferometry for snapshot three-dimensional microscopy,” Biomed. Opt. Express 11, 5903–5919 (2020). [DOI] [PMC free article] [PubMed] [Google Scholar]
- 38.Leitner R, Kenda A, and Tortschanoff A, “Hyperspectral light field imaging,” Proc. SPIE 9506, 950605 (2015). [Google Scholar]
- 39.Wetzstein G, Ihrke I, Gukov A, and Heidrich W, “Towards a database of high-dimensional plenoptic images,” in International Conference on Computational Photography (ICCP) (2011). [Google Scholar]
Associated Data
This section collects any data citations, data availability statements, or supplementary materials included in this article.
Supplementary Materials
Data Availability Statement
Data and codes underlying this work may be obtained from the corresponding author upon reasonable request.


