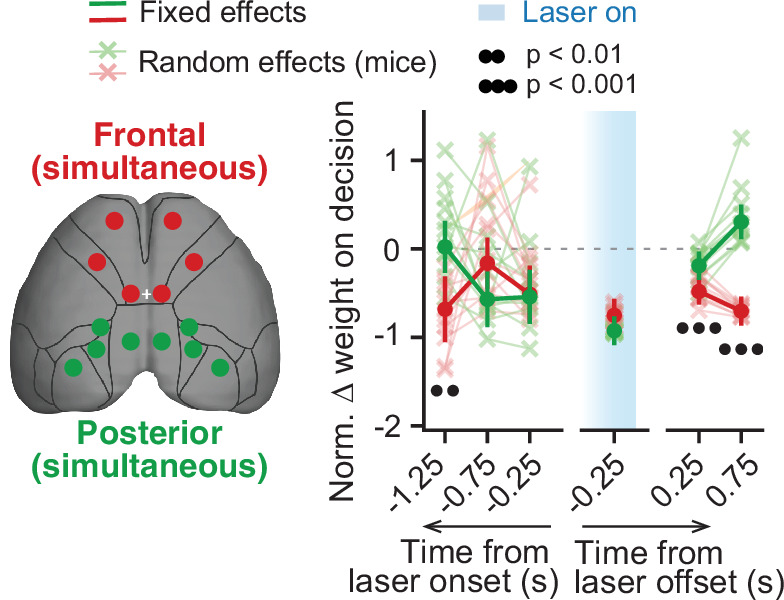
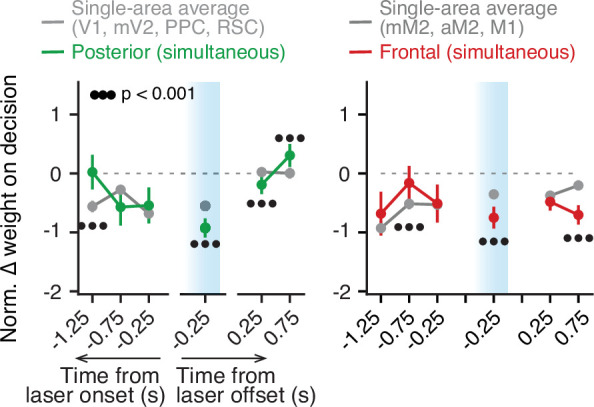
Figure 3. Simultaneous inactivation of frontal or posterior cortical areas confirms distinct contributions to sensory-evidence-based decisions.
Comparison of the effect of simultaneous posterior or frontal cortical inactivation on the use of sensory evidence as recovered from the mixed-effects logistic regression models combined across mice and inactivation epochs, with 10-fold cross-validation. For each area, we plot normalized evidence weights for inactivation trials as in Figure 2. Thin gray lines and crosses, mouse random effects (posterior: n=11, frontal: n=11). Error bars, ± SEM on coefficient estimates. Black circles below the data points indicate p-values from z-tests on the coefficients, with false discovery rate correction (captions on top, see Materials and methods for details).

Figure 3—figure supplement 1. Sensory-evidence information from different areas is combined unevenly.

