Abstract
Clinical studies have demonstrated that epidermal pigmentation level can affect cerebral oximetry measurements. To evaluate the robustness of these devices, we have developed a phantom-based test method that includes an epidermis-simulating layer with several melanin concentrations and a 3D-printed cerebrovascular module. Measurements were performed with neonatal, pediatric and adult sensors from two commercial oximeters, where neonatal probes had shorter source-detector separation distances. Referenced blood oxygenation levels ranged from 30 to 90%. Cerebral oximeter outputs exhibited a consistent decrease in saturation level with simulated melanin content; this effect was greatest at low saturation levels, producing a change of up to 15%. Dependence on pigmentation was strongest in a neonatal sensor, possibly due to its high reflectivity. Overall, our findings indicate that a modular channel-array phantom approach can provide a practical tool for assessing the impact of skin pigmentation on cerebral oximeter performance and that modifications to algorithms and/or instrumentation may be needed to mitigate pigmentation bias.
1. Introduction
1.1. Clinical performance of cerebral oximeters
Cerebral oximetry for real-time monitoring of blood oxygen saturation represents one of the most common clinical applications of near-infrared spectroscopy (NIRS) [1]. These devices have been reported as beneficial in monitoring to mitigate health risks in neonatal and pediatric surgeries [2–4] as well as for adult procedures [5,6]. They are widely used for timely and actionable cerebral monitoring during surgery, particularly cardiac procedures to help minimize the impact of desaturation on neurological functions [7,8]. Additionally, cerebral oximetry has been shown to provide earlier detection of desaturation than pulse oximetry [9] and to safeguard pediatric brain activity and reduce neurological impairments in neonatal intensive care [10].
These positive clinical findings are tempered by reports of inconsistency in saturation measurements from different oximeter models and a lack of consensus amongst clinicians regarding the reliability of these devices, particularly when used for absolute measurements [11,12]. Commercial systems incorporate different design features, optical components, and processing algorithms. While individual device algorithms are proprietary and not disclosed, the literature indicates that they are typically based on the Beer-Lambert law and incorporate a priori knowledge of the spectral absorption signatures of key chromophores (e.g., oxy- and deoxy-hemoglobin) as well as tissue scattering properties [13,14]. Unlike pulse oximeters, which selectively measure arterial saturation by calculating the ratio of changes in reflectance due to pulsation at two wavelengths, cerebral oximeters perform steady-state measurements of bulk (venous and arterial) saturation using two source-detector distances. In this technique, measurements at the shorter separation distance – which provide a smaller mean penetration depth – are used to correct for the impact of the superficial layers on the larger distance (deeper) measurement. Given the many system design variables, it is not unexpected that when faced with confounding biological factors such as variations in patient anatomy, physiology and optical properties, oximeter measurements are not always in agreement. One of the biological factors that is known to impact NIRS measurements is skin pigmentation.
1.2. Skin pigmentation tissue optics
Human epidermal melanin is highly effective at attenuating ultraviolet (UV) light that causes photochemical damage to skin, yet it also exhibits substantial absorption through visible and NIR wavelengths. This natural chromophore has a large absorption cross section and its concentration – which varies widely in humans due to both genetics and sun exposure – strongly impacts light attenuation and visualized skin color [15,16]. The two primary types of melanin found in the epidermis – eumelanin and pheomelanin – exhibit sufficiently similar absorption decay rates that they are considered a single chromophore in studies focusing on red and NIR wavelengths [17]. A series of widely cited studies by Jacques and colleagues have elucidated the absorption spectra of human melanin, showing an exponential decay with wavelength, including a decrease of over 50% across the spectral range often employed for cerebral oximetry (700-900 nm) [18–21]. These articles have also provided methods for estimating the absorption coefficient of pigmented epidermis (Section 2.4), which can be an order of magnitude greater than blood (Fig. 1).
Fig. 1.
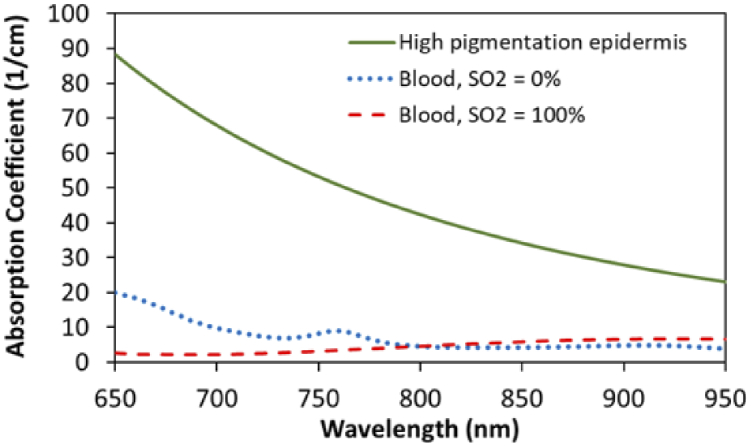
Estimated absorption coefficient spectra for highly pigmented epidermis (Mf =43%) compared to oxygenated and deoxygenated blood (150 g/liter Hb) [19,25].
Skin tone is often evaluated in clinical studies using the Fitzpatrick phototype scale. This scale was originally developed to rate skin susceptibility to UV damage without regard to skin visual appearance, yet in recent decades it has been co-opted to subjectively quantify skin pigmentation [22]. While visual color has also been shown to correlate moderately well with objective measurements of epidermal melanin concentration [23,24], in this study we quantify pigmentation level in terms of the melanosome volume fraction (Mf) parameter described by Jacques [20].
1.3. Effect of skin pigmentation on oximetry
In vivo studies of Vis-NIR reflectance provide strong evidence of the impact of skin pigmentation. Measurements in highly pigmented subjects have shown nearly complete absorption of light at short visible wavelengths, with attenuation decreasing in magnitude across red and near-infrared regions (e.g., a reduction of ∼65% at 700 nm relative to light skin subjects) [26]. The effect of pigmentation on oximetry devices that measure Vis-NIR reflectance at the dermal surface was first noted in early studies of pulse oximetry when a higher rate of data points with insufficient signal were found [27]. In landmark healthy human subject studies, commercial pulse oximeters produced higher estimates of arterial saturation (SpO2, where SaO2 is the true value) for dark skin than light skin [28,29]. Although consensus on this effect has not been universal [30], there has recently been increased interest in this issue due to journal correspondence from Sjoding et al. [31]. This letter introduced evidence of a higher rate of ‘occult hypoxemia’ (undetected low SaO2) in self-identified black patients as well as a positive pigmentation bias of 1-2% across the 85-95% SaO2 range.
Sensitivity to variations in skin pigmentation has also been observed in estimates of oxygen saturation using regional tissue oximeters for brain and muscle (StO2, where SRO2 is the true value). Theoretically, one would expect the higher pigmentation levels in the forehead region to more strongly impact detected optical signals than the palmar finger [32] and nailbed tissue illuminated by most pulse oximeters. In seminal clinical research, Bickler et al. determined that tissue oximeters tended to underestimate cerebral StO2 in patients with high pigmentation levels [12]. A study of nearly 3300 cardiac surgery patients also reported a negative bias correlated with skin pigmentation [33]. The magnitude of these effects has been shown to be device-dependent; in a study of five commercial tissue oximeters, one device was found to be robust to pigmentation whereas the others exhibited negative bias [34]. These findings suggest the need for well-controlled parametric investigations with tissue-simulating phantoms to better understand potential pigmentation bias in cerebral oximetry.
1.4. Phantom-based test methods
Controlled desaturation studies in healthy volunteers represent the primary consensus approach to evaluating oximeter performance, but are expensive and present risks to subjects, primarily due to the need for collection of venous samples from the jugular bulb [35]. Ethical constraints also restrict the range of safe SRO2 and total hemoglobin concentration (ctHb) during these studies and preclude enrollment of pediatric and neonatal subjects. Even when completed safely, the combination of jugular and arterial blood draws recommended for reference measurements in clinical studies does not provide a true gold standard reference for cerebral blood oxygenation. Phantom-based testing represents a powerful approach for evaluating/comparing cerebral oximeters that is not subject to the aforementioned limitations and carries no risks to humans. Furthermore, it enables parametric study of isolated changes in tissue properties on performance under controlled conditions using well-characterized samples – such as through gold standard CO-oximeter referencing [36]. As a result, there is growing recognition of the potential for phantoms to complement or replace clinical studies in the evaluation of cerebral oximeters [35].
In recent years, phantom-based test methods based on lipid-blood solutions have been implemented to facilitate development and characterization of cerebral oximeter performance [37–39]. We have also recently introduced a 3D-printed channel-array phantom approach that provides similar results in a less burdensome manner, with easily modifiable geometry that can be readily shared as digital files [40]. However, we are only aware of one prior study that has addressed phantom-based testing of tissue oximeters (one continuous wave, one frequency domain) for robustness to pigmentation. This study simulated variable epidermal pigmentation using neutral density (ND) filters in a layered phantom approach [41]. Results indicated a high degree of light attenuation, but no impact on oxygen saturation readings. The authors stated that the ND filters used provided a spectral decay across Vis-NIR wavelengths, yet no direct comparison with melanin absorption was provided. Additionally, the phantom contained no blood and the absolute saturation level displayed by the continuous wave device was not stated.
A variety of approaches have been used to fabricate tissue-simulating phantoms with realistic optical representation of human pigmentation for other optical diagnostic modalities [41–43]. One phantom intended for photoacoustic and elastography imaging included a 0.12-mm-thick layer incorporating gelatin and synthetic melanin [42]. However, this phantom required vacuum sealed storage to ensure stability, as hydrogel phantoms are susceptible to desiccation. Soyemi et al. [44] developed a two-layer skin-mimicking phantom to study skin pigmentation effects in Vis-NIR spectroscopy using synthetic melanin as well, yet this phantom was also based on a hydrogel. More stable epidermis-simulating phantom layers have been fabricated from molded polydimethylsiloxane (PDMS) silicone and nail polish remover (NPR; acetone) doped with ground coffee [45]. This approach offers low cost, simplicity, and good spectral accuracy, but it is unable to achieve high absorption values matching maximum expected pigmentation levels. A tissue-mimicking material (TMM) that provides accurate representation of epidermal optical properties in a stable matrix would be useful to test device robustness to skin pigmentation.
The purpose of this study was to develop tools and knowledge that will facilitate evaluation of cerebral oximeter robustness to skin pigmentation and help minimize racial disparities in health care. Specifically, our goals were to: (1) develop bio-relevant TMMs for epidermal phantom layers simulating a range of melanin levels; and (2) implement a modular phantom approach to execute a parametric study of the impact of pigmentation on two clinical cerebral oximeters.
2. Methods
2.1. Modular phantom design
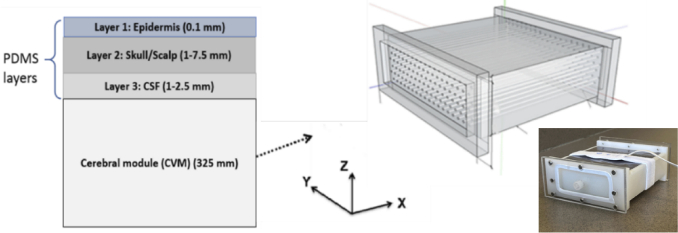
Our phantom development strategy involved fabricating pigmented epidermal TMM layers and combining them with a reformulated modular phantom based on our prior research [40]. The new modular phantom consisted of four components (Fig. 2): the 3D-printed cerebrovascular module (CVM) and three superficial layers based on a PDMS matrix. The CVM contains a dense array of fluid channels that can be filled with bovine blood tuned to different oxygenation levels. The PDMS layers simulated the epidermis (Layer 1), scalp/skull (Layer 2) and the cerebrospinal fluid (CSF) in the subarachnoid space (Layer 3). Four versions of the CVM were designed and fabricated representing neonatal and adult subjects at high and low ctHb levels.
Fig. 2.
Schematic of modular cerebral oximetry phantom with layer thicknesses noted (left, not to scale) and illustration of CVM design along with a photo of the phantom (right).
2.2. CVM fabrication
We modified our first generation CVM [40] to more accurately represent neonatal and adult cerebral optical properties and different ctHb levels. Target property values were based on the recently published cerebral oximetry standard [35]. To better tune the CVM scattering spectrum, we used a stereolithography 3D-printer (Form 2, Formlabs, Inc., Somerville, MA, USA) with customized methacrylate photopolymer resin composites that were well-matched with human brain optical properties. Mixtures of proprietary clear and white resins were used to print CVMs representing neonatal (81%clear and 19% white, by volume) and adult (68% clear and 32% white) subjects.
Optical properties were characterized using the Inverse Adding Doubling (IAD) approach [46] based on diffuse reflectance and total transmittance measurements of samples in an integrating sphere spectrophotometer (Lambda 1050, PerkinElmer Inc., Waltham, MA, USA). Samples were prepared in square molds (40 × 40 mm) with 2 mm thickness for the custom 3D printed resin. Total transmittance and diffuse reflectance of samples were measured using an integrating sphere spectrophotometer (Lambda 1050, PerkinElmer, Waltham, MA). Sphere measurements were calibrated using a Spectralon 99% reflectance standard (Labsphere, Inc., North Sutton, NH). Baselines of transmittance and reflectance were measured according to the IAD manual. Sample thicknesses were measured using digital calipers with 0.02 mm resolution. A reproducibility analysis indicated that errors in optical property calculations were less than 10%. A sample refractive index of 1.54 was used according to information provided by the manufacturer.
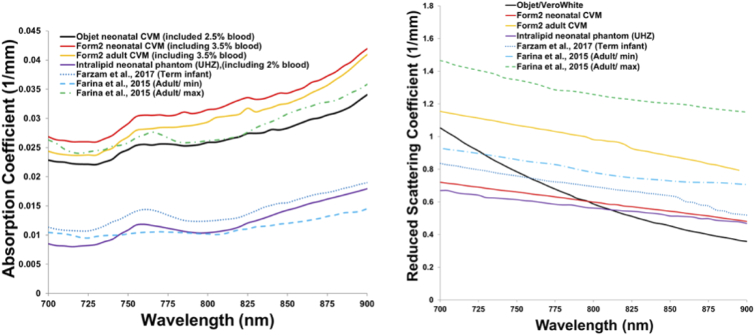
CVM optical properties are shown in Fig. 3 compared with literature data, including an estimate of a lipid-emulsion-based liquid phantom [38,39,47–49]. To facilitate direct comparisons in this figure, spectra for 3D-printed CVMs include the theoretical additional absorption by blood in the channels at 80% StO2 and 2.5% and 3.5% volume fractions for Objet (used in our prior study) and Form 2 3D-printers, respectively. As shown in Fig. 3, the primary modification in CVM optical properties from our prior version was a reduction in the curve slope to better match biological data. Based on this data, fitting equations for the new CVMs were found to be
| (1) |
| (2) |
where λ (wavelength) is in nm and is in mm-1.
Fig. 3.
Optical properties of the neonatal and adult CVMs in comparison to literature data [38,48,49]. Absorption due to blood was added analytically to the measured µa of the proprietary customized resins.
CVMs were constructed with overall dimensions of 120 × 120 × 50 mm, with the perfused channel-array region limited to a volume of 120 × 80 × 32.5 mm. An image from an STL design file is shown in Fig. 2. The distance from the top surface of each CVM to the top of the first horizontal row of channels was 1.0 mm. Mean channel diameters and corresponding blood volumes in the CVM were estimated using three redundant approaches: caliper measurements at both ends of selected channels combined with measurements of the CVM length, measuring the volume of water injected into 10 channels in each CVM, and measuring the volume of water required to fill the entire CVM then subtracting the dimensions of the end chambers and dividing by the number of channels. Vertical spacing between horizontal rows of channels (center to center distance) was fixed at 4.36 mm, and lateral spacing between channels was fixed at 4.6 mm. The channels in each row were offset laterally by 2.4 mm relative to adjacent rows. Channel diameter was adjusted to achieve different ctHb levels. Nominal vs. measured channel diameters for CVMs with ctHb = 33 µM, 46 µM and 75 µM were: 0.80 mm vs. 0.60 mm, 0.90 mm vs. 0.71 mm, and 1.12 mm vs. 0.97 mm, respectively. For neonatal CVMs, the volume of blood within the CVM channel-array regions was determined to be 1.3% and 3.5% of the total volume, producing ctHb levels of 33 and 75 µM. For adult CVMs, volume fractions were 1.9% and 3.5%, producing ctHb values of 46 and 75 µM.
2.3. Development of pigmented epidermal layers
Epidermal thickness (27-300 µm) shows significant inter-subject variability and is also correlated to human body site [50]. Facial epidermal thickness has been reported up to 100 µm [51]. Given the difficulties of fabricating such thin layers, and the desire to assess performance under a limiting-case scenario, we selected 100 µm as a target thickness for our epidermal layers. Target epidermal optical properties were determined from the approach described by Jacques [18–20]. Using this method, the epidermal absorption coefficient ( ) can be calculated as:
| (3) |
where Mf is the mean volume fraction of melanosomes in the epidermis, is the absorption coefficient of a typical melanosome, and is the “baseline” absorption coefficient for epidermal tissue without melanin. The following equation was determined to best describe the spectrum [19]:
| (4) |
where λ is in nm.
Melanosome volume fractions for different skin pigmentation levels have been estimated as 1.3-6.3% for light-skinned adults, 11-16% for medium pigmentation adults and 18-43% for darkly pigmented adults [18]. Based on these ranges, we selected the following Mf values to establish absorption coefficient targets for our epidermal phantom layers that span the biologically relevant range: 2%, 6%, 14%, 30%, and 43%. We approximate that these values correspond roughly to Fitzpatrick skin phototypes of I-II, III, IV, V, and VI, respectively.
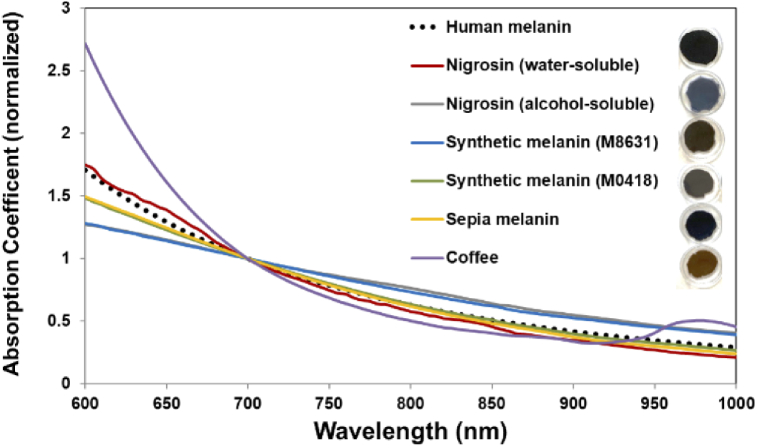
Adapting approaches from the literature, we evaluated potential melanin-simulating chromophores (Fig. 4): coffee (VIA instant dark coffee, Starbucks Corp., Seattle, WA, USA), India ink (Super Black, Speedball Art Inc., Statesville, NC, USA), two types of synthetic melanin (M0418 and M8631, Sigma-Aldrich,St. Louis, MO, USA), sepia melanin (M2649, Sigma-Aldrich), alcohol-soluble nigrosin (211680, Sigma-Aldrich), and water-soluble nigrosin (N-4754, Sigma-Aldrich). We fabricated the following samples: (1) water-soluble nigrosin, using 0.42 ml of stock solution – 10 ml NPR (Beauty 360, Original, CVS, Woonsocket, RI, USA) and 100 mg nigrosin – added to to 5 ml PDMS; (2) alcohol-soluble nigrosin, using 0.5 ml of stock solution – 100 mg alcohol-soluble nigrosin and 10 ml isopropyl alcohol 99% (Florida Laboratories, Inc., Fort Lauderdale, FL, USA) – added to 5 ml PDMS; (3,4) both synthetic melanins, using 1.5 ml of stock solution – 0.2 g of melanin and 5 ml acetone – added to 0.5 ml PDMS; (5) sepia melanin, using 1 ml of stock solution – 0.15 g of melanin and 5 ml acetone – added to 5 ml PDMS; and (6) instant coffee, using 2 ml of stock solution – 0.46 g of coffee and 10 ml stock solution – added to 5 ml PDMS [45]. We molded samples to a thickness of 2 mm and used IAD and spectrophotometer measurements to determine absorption coefficients (Fig. 4). Based on a comparison of these measurements to the literature, we determined that the absorption spectrum of water-soluble nigrosin across the 600-900 nm range most accurately matched human melanin. Synthetic melanin (M0418) and sepia melanin also provided very good approximation of human melanin, particularly above 800 nm. The epidermal TMM formulation was developed to provide a spectrum that was consistent with data from the literature (Fig. 5(b)); a fit of this curve yielded
| (5) |
where λ is in nm and is in mm-1 [19,52].
Fig. 4.
Measured absorption spectra of epidermal TMM samples (normalized at 700 nm), as compared to human melanin (from Eq. (4)). Images of TMM samples are shown.
Fig. 5.
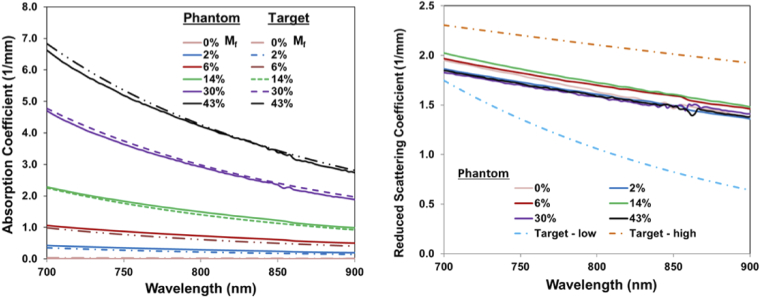
Absorption (left) and reduced scattering coefficients (right) of epidermis layer TMMs for the range of Mf values studied, compared with target data from the literature (dashed lines) [19,52].
2.4. Fabrication of epidermal layers
Having identified both a suitable TMM and target optical properties for the epidermal layers, we developed a protocol for fabricating the epidermis-mimicking layers. A solution of 30 mg water-soluble nigrosin diluted with 1 ml NPR was sonicated for 20 minutes (Aquasonic, Model 50 D, VWR scientific products, Radnor, PA, USA). Pigmented layers were achieved by mixing 0.04, 0.13, 0.3, 0.56 and 0.75 ml of the stock solution with 5 ml PDMS (Sylgard 184 Silicone Elastomer, Dow Corning Corp., Washington, DC, USA). To overcome hydrophobicity issues that initially limited the achievable nigrosin concentration range, we discovered that it was critical to emulsify the nigrosin-PDMS solutions through extended (∼10 hour) probe sonication (Q125, Qsonica LLC, Newtown, CT, USA). Subsequently, 1 g of TiO2 (Anatase titanium (IV) oxide, Sigma-Aldrich, St. Louis, MO, USA) was added to 17 ml PDMS curing agent (Dow Corning, Midland, MI, USA) and sonicated for 3 hours. The nigrosin-PDMS and TiO2-curing-agent solutions were then combined, and additional 0.6 ml of curing agent was added. This mixture was then stirred and degassed in a vacuum chamber for 30 minutes (Labfirst Scientific and Industrial Equipment LLC, Cheyenne, WY, USA). The uncured TMM was poured into a custom fabricated steel mold (120 × 120 × 0.1 mm) and a joint knife (Flexible, 6 In, Husky Inc., Atlanta, GA, USA) was used to spread the material evenly across the mold. Achieving the desired thickness required highly consistent motion of the knife edge. The filled mold was placed in an oven for 7-10 hours at 75 °C.
Measurements of and spectra were then acquired using the IAD approach and good agreement with target values was found (Fig. 5). Photos of completed epidermal layers are provided in Fig. 6. The stability of optical property spectra were verified after 4 months of storage at room temperature in epidermal phantom layers with Mf = 30% and 43%. The spectral distributions of µa and µs’ were unchanged over this interval and only a minor decrease (<5%) in the mean magnitude of these values was found. We validated the thickness of fabricated epidermal layers by measuring 13 points with an electronic height gauge (Starrett 3751AZ-6/150, Athol, MA, USA). The results for layer samples with Mf values of 0%, 2%, 6%, 14%, 30% and 43% were (mean ± standard deviation) 0.12 +/- 0.01 mm, 0.13 +/- 0.01 mm; 0.13 +/- 0.01 mm, 0.12 +/- 0.01 mm, 0.10 +/- 0.01 mm, and 0.11 +/- 0.01 mm, respectively.
Fig. 6.
Pigmented epidermal phantom layers used for oximeter testing, in position on the CVM.
The two other extracerebral phantom layers were also based on a PDMS matrix. One layer represented the scalp/skull region (Layer 2) and a second simulated subarachnoid CSF (Layer 3). The TMMs for these layers were doped with India ink as a chromophore and TiO2 as scatterer at biologically relevant concentrations. Phantoms were then molded to achieve the layer thicknesses indicated in Table 2. Additional details about the fabrication process and spectral properties of these layers can be found in our previous publication [40].
Table 2. Summary of phantom cases implemented.
| Phantom component | Neonatal case | Pediatric case | Adult case |
|---|---|---|---|
| CVM (optical properties) | Neonate | Neonate | Adult |
| CVM (ctHb) | 33, 75 µM | 33, 75 µM | 46, 75 µM |
| Epidermal layer thickness (L1) | 0.1 mm | 0.1 mm | 0.1 mm |
| Scalp/skull thickness (L2) | 1 mm | 5 mm | 7.5 mm |
| CSF thickness (L3) | 1 mm | 1 mm | 2.5 mm |
| Total extracerebral thickness | 3.1 mm | 7.1 mm | 11.1 mm |
2.5. Cerebral oximetry systems
We performed phantom measurements with two commercial cerebral oximeters in common clinical use. Oximeter A was a Fore-Sight Elite (CAS Medical Systems, Inc., Branford, CT, USA) that uses five wavelengths – 690, 730, 770, 810, and 870 nm – and has three types of sensors: a neonatal sensor (patients < 8 kg) with source-detector separation distances (SDs) of 10 and 25 mm, a pediatric sensor (> 3 kg) with SDs of 13 and 40 mm and an adult sensor (> 40 kg) with SDs of 15 and 50 mm. Oximeter B was a SenSmart X-100 (Nonin Medical, Inc., Plymouth, MN) that uses four wavelengths – 730, 760, 810, 880 nm – and has two types of sensors: one for patients < 40 kg (i.e., neonatal and pediatric patients) with SDs of 12.5 and 25 mm and one for patients > 40 kg (i.e., adult patients) with SDs of 20 and 40 mm. One of the sensors (Oximeter B > 40 kg) had a strongly adhesive surface, which required the addition of a thin (0.05 mm) transparent plastic sheet to enable placement and removal from the surface of the thin epidermal layer. Based on spectrophotometer measurements, this layer reduced detected reflectance levels by a relatively small amount (∼7%). A comparison of readings with and without this layer using the adult phantom geometry produced no measurable difference.
Optical properties for the CVM (bloodless), and scalp/skull and CSF layers are provided in Table 1 for the five peak wavelengths of the source for Oximeter A.
Table 1. Summary of optical properties for phantom layers 2, 3 and CVM.
| Phantom component | Neonatal case | Pediatric case | ||||||||
|---|---|---|---|---|---|---|---|---|---|---|
| Wavelength (nm) | Wavelength (nm) | |||||||||
| 690 | 730 | 770 | 810 | 870 | 690 | 730 | 770 | 810 | 870 | |
| L2 µs’ (mm-1) | 1.104 | 1.024 | 0.959 | 0.891 | 0.745 | 1.104 | 1.024 | 0.959 | 0.891 | 0.745 |
| L2 µa (mm-1) | 0.012 | 0.011 | 0.011 | 0.011 | 0.011 | 0.012 | 0.011 | 0.011 | 0.011 | 0.011 |
| L3 µs’ (mm-1) | 0.384 | 0.345 | 0.308 | 0.274 | 0.228 | 0.384 | 0.345 | 0.308 | 0.274 | 0.228 |
| L3 µa (mm-1) | 0.007 | 0.007 | 0.006 | 0.005 | 0.004 | 0.007 | 0.007 | 0.006 | 0.005 | 0.004 |
| CVM µs’ (mm-1) | 0.736 | 0.684 | 0.638 | 0.585 | 0.519 | 0.736 | 0.684 | 0.638 | 0.585 | 0.519 |
| CVM µa (mm-1) | 0.017 | 0.017 | 0.017 | 0.017 | 0.017 | 0.017 | 0.017 | 0.017 | 0.017 | 0.017 |
| Phantom component | Adult case | ||||
|---|---|---|---|---|---|
| Wavelength (nm) | |||||
| 690 | 730 | 770 | 810 | 870 | |
| L2 µs’ (mm-1) | 1.104 | 1.024 | 0.959 | 0.891 | 0.745 |
| L2 µa (mm-1) | 0.012 | 0.011 | 0.011 | 0.011 | 0.011 |
| L3 µs’ (mm-1) | 0.384 | 0.345 | 0.308 | 0.274 | 0.228 |
| L3 µa (mm-1) | 0.007 | 0.007 | 0.006 | 0.005 | 0.004 |
| CVM µs’ (mm-1) | 1.179 | 1.113 | 1.046 | 0.978 | 0.855 |
| CVM µa (mm-1) | 0.015 | 0.014 | 0.014 | 0.015 | 0.016 |
2.6. Controlling blood oxygenation levels
Bovine blood was used in the CVMs due to its optical similarity to human blood in oxygenated and deoxygenated states [53]. Fully oxygenated blood samples (defibrinated whole blood, Quad Five, Ryegate, MT, USA) were mixed with sodium dithionite (sodium hydrosulfite, Na2S2O4, technical grade 85%, Sigma-Aldrich) to induce desaturation. Stabilization of the blood oxygenation level occurred within 3 minutes after initiation. Measurements with a clinical grade CO-oximeter (Avoximeter 4000, Accriva Diagnostic, Instrumentation Laboratory, Bedford, MA, USA) were used to establish a concentration curve for saturation level vs. sodium dithionite concentration as well as verify low levels of methemoglobin, which can potentially be produced by side-reactions in this approach [54].
2.7. Experimental study protocol
Measurements were performed on phantoms simulating each of three age-range cases (neonatal, pediatric and adult), as described in Table 2. For each sensor/case studied, measurements were performed at two ctHb levels, six Mf levels, and four SRO2 levels. Target SRO2 values were 30%, 50% 70% and 90%, although some variation in these values was seen. At each SRO2 level, a fresh blood sample was used to minimize metHb formation. Experiments involved the following steps: (a) adding a pre-determined amount of an aqueous solution of sodium dithionite to bovine blood and mixing, (b) taking CO-oximetry reading of a drawn blood sample to verify SRO2 values before use, (c) injecting a blood sample into the CVM using a disposable syringe, (d) waiting 30 seconds before each measurement for sensor readings to become stable, and (e) performing one measurement in each of three orientations (perpendicular, parallel and diagonal – approximately 45° – to the channels).
Paired cerebral and CO-oximeter data were evaluated for accuracy using root-mean-square error (Arms), which incorporates contributions due to both bias and imprecision [35]:
| (6) |
where StO2i represents the mean oximeter measurement at the ith saturation level, SRO2i indicates the corresponding reference value, and n is the number of StO2 levels in the measurement set. We also applied a two-sided paired sample t-test and computed correlation coefficients between 2% and 43% Mf cases for each SRO2 levels and for each oximeter device/sensor. A P-value of <0.05 was chosen as the level of significance.
3. Results
3.1. Absolute saturation measurements
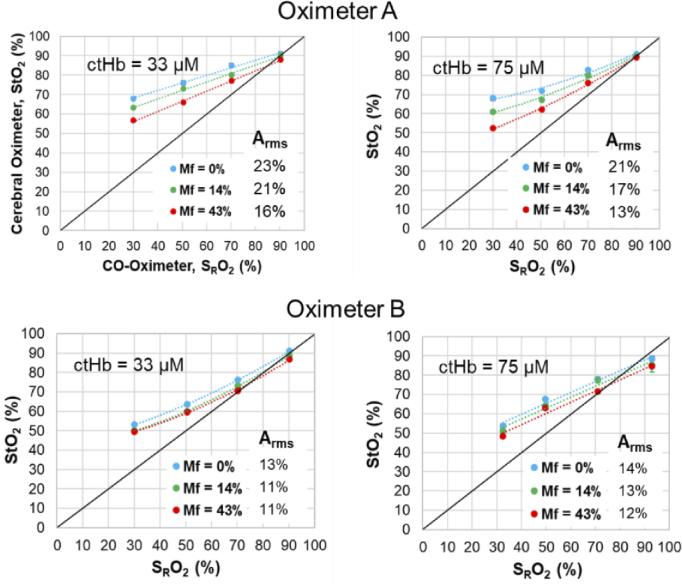
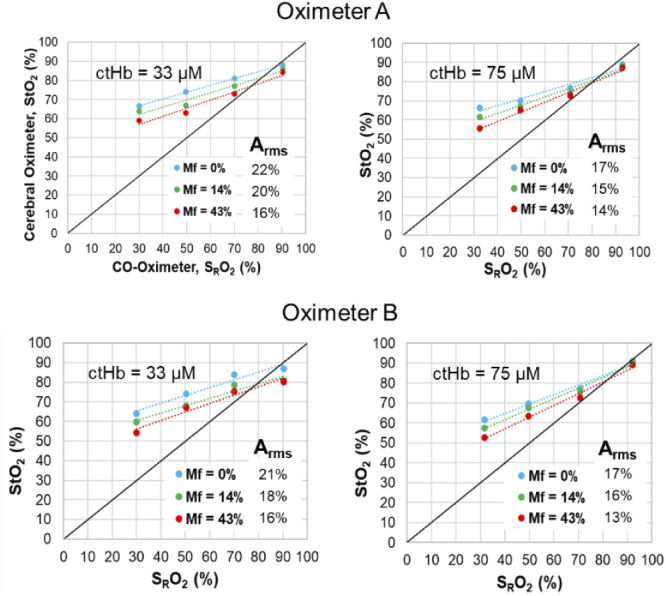
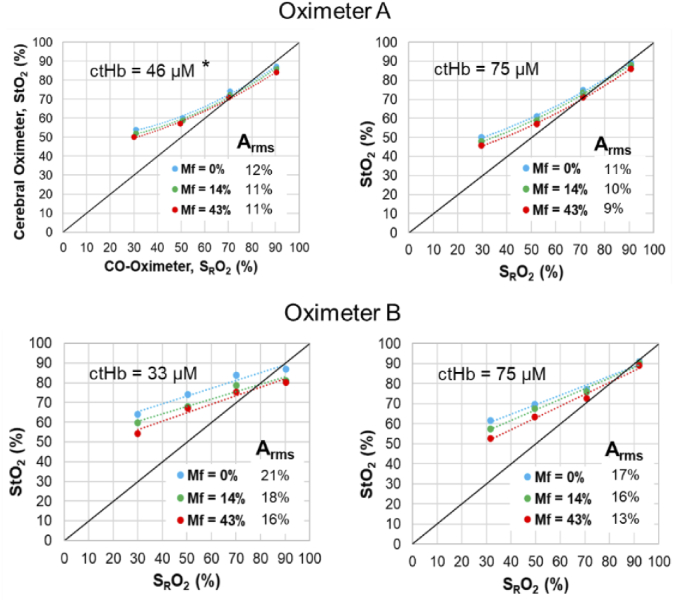
Phantom test results comparing StO2 vs. SRO2 are presented for each of the three age-range cases in Table 2 – neonatal (Fig. 7), pediatric (Fig. 8) and adult (Fig. 9). Although error bars are included in these graphs, few are visible since the standard deviation was less than 1% for for the vast majority of data points and less than 4% for the remaining few points. In the neonatal cases, results for Oximeter B tended to exhibit better accuracy and higher slopes (i.e., sensitivity levels) than Oximeter A, especially at low Mf values. For pediatric and adult cases, accuracy was quite similar for the two devices. Neonate and pediatric cases tended to show slopes less than 1.0, with bias being minimal at high SRO2 then increasing as saturation decreases. For Oximeter B, the same sensors were used in neonate and pediatric cases, yet the sensitivity and accuracy was better for the former; this may be an indication that increased scalp/skull layer thickness in the pediatric case caused a reduction in sensitivity to blood in the CVM. Adult cases showed somewhat better accuracy and sensitivity overall, but produced a negative bias at the highest SRO2 levels. The finding of less-than-ideal sensitivity to changes in SRO2 – curves with slopes less than 1.0 and significant positive bias at low SRO2 – has been common in prior phantom studies, where some have shown lower slopes [37] than our results and others [38,39] found similar values.
Fig. 7.
Neonatal phantom case results for Oximeter A neonatal sensor and Oximeter B neonatal-pediatric sensor, at two ctHb values and three Mf levels.
Fig. 8.
Pediatric phantom case results for Oximeter A pediatric sensor and Oximeter B neonatal-pediatric sensor, at two ctHb values and three Mf levels.
Fig. 9.
Adult phantom case results for Oximeter A and Oximeter B adult sensors, at two ctHb values and three Mf levels. *For Oximeter A measurements at ctHb = 46 µM, Layer 2 thickness of 5 mm was used as the device did not display results for 7.5 mm.
Differences in ctHb level had only a minor impact on measurement accuracy (statistically significant at a p-value of 0.08) and tended to be inconsistent as well, yet Arms values were in general lower for the higher (75 µM) ctHb cases. Of particular note is the fact that Oximeter A was not able to provide readings for the lower ctHb Adult case (46 µM) – possibly due to limited penetration depth – so a thinner scalp/skull layer (5 mm) was implemented for this case to generate the results in Fig. 9. The lack of a stronger trend with ctHb was somewhat unexpected given that a prior study showed reduced sensitivity at lower ctHb levels [38].
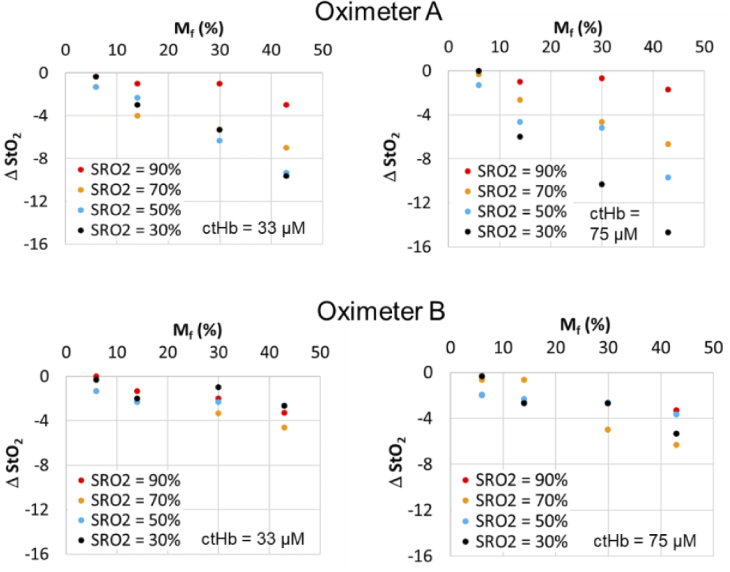
In almost all graphs in Fig. 7–9, substantial pigmentation-correlated effects are also apparent, with increasing melanin content causing a decrease in measured StO2. However, given that most measurements exhibited a positive bias relative to the gold standard SRO2, the change due to pigmentation actually improved both local bias and Arms. The few exceptions were seen at the highest SRO2 level, where Mf = 0% results showed minimal bias and greater Mf either produced an overall negative local bias or had minimal effect. The device that was most strongly impacted by pigmentation was the Oximeter A neonatal case, whereas the adult cases (Fig. 9) generally displayed the least change with Mf. A more detailed analysis of the effect of Mf is provided in the following section.
3.2. Relative impact of pigmentation on saturation estimates
Fig. 11.
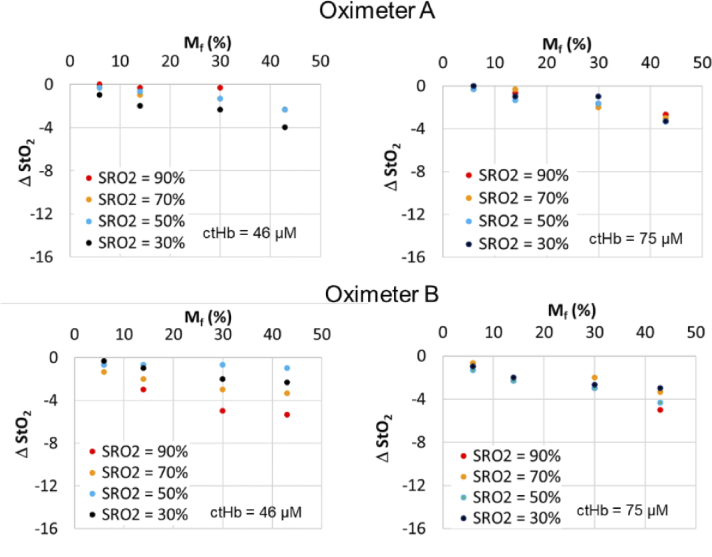
Change in StO2 relative to Mf = 2% case for Oximeter A pediatric sensor and Oximeter B neonatal-pediatric sensor using neonatal CVMs with two ctHb levels.
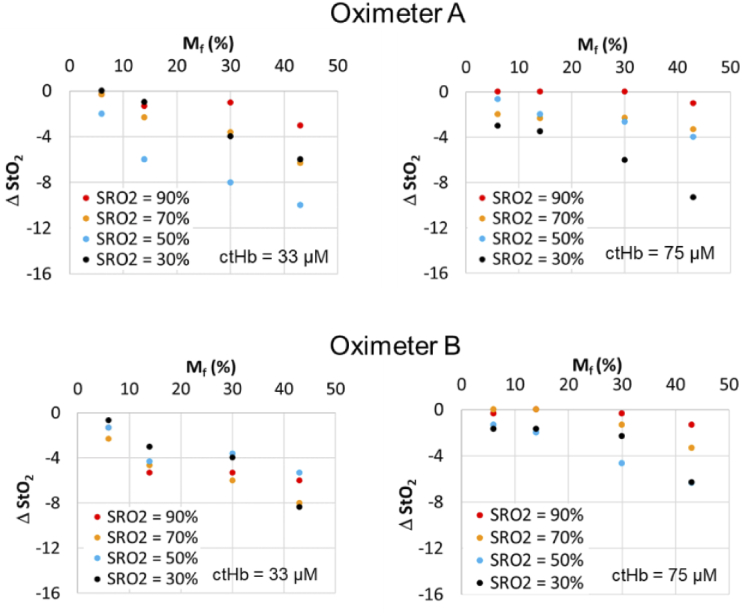
To focus on the changes brought about by increasing pigmentation – which may provide insight into the magnitude of impacts on cerebral oximeters and other transdermal reflectance-based technologies – we graphed the difference in measured StO2 between Mf = 2% and each of the higher Mf levels (ΔStO2). Results are presented for neonatal, pediatric and adult cases (Fig. 10–12). These data generally show a strong decrease in StO2 with increasing Mf, although the magnitude of this change ranged widely by sensor type as well as SRO2 and ctHb. Some of the greatest pigmentation-correlated impacts were seen for Oximeter A neonatal and pediatric sensors, with the ΔStO2 reaching -15% for the neonatal case and -10% for the pediatric case. While these strong effects were documented at low SRO2 values, the maximum ΔStO2 was only -3% when SRO2 was near 90%. These changes tended to be linearly proportional with Mf. Of the non-adult sensors, the Oximeter B neonatal/pediatric sensor showed greatest robustness to Mf, with the maximum ΔStO2 being -6% for the neonatal phantom case and -8% for the pediatric case.
Fig. 10.
Change in StO2 relative to Mf = 2% case for Oximeter A neonatal sensor and oximeter B neonatal-pediatric sensor, using neonatal CVMs with two ctHb levels.
Fig. 12.
Change in StO2 relative to Mf = 2% case for Oximeter A and B adult sensors using adult CVMs with two ctHb levels. Scalp/skull thickness for Oximeter A with ctHb of 46 µM is 5 mm.
In general, adult sensors exhibited the least sensitivity to epidermal pigmentation. The maximum ΔStO2 results for Oximeter A and B adult sensors were only -4% and -5%, respectively. While the latter device showed slightly greater changes due to Mf, only the results for Oximeter B with the 46 µM CVM produced a distinct trend with SRO2; however, this trend was reversed from that shown for neonate and pediatric cases, with the greatest change occurring for SRO2 = 90% rather than SRO2 = 30%.
Statistical analysis confirmed the difference between measured StO2 of high pigmentation and baseline (no melanin layer) is significant for all values associated with neonatal sensors and in some cases for pediatric and adult sensors. Adult sensor data for Oximeter B only showed a statistically significant reduction in StO2 for the highest Mf level. Overall, the impact of ctHb appears to have been relatively minimal on the existence of a pigmentation bias. For two sensor cases – e.g., Oximeter A neonate and Oximeter B neonate – higher ctHb levels appear to be correlated with greater pigmentation bias levels.
4. Discussion
4.1. Impact of epidermal pigmentation
By applying thin superficial layers that simulated biologically relevant variations in epidermal absorption to our existing channel-array phantom, we identified significant trends in the performance of commercial cerebral oximeters. Perhaps the clearest trend is an improvement in device accuracy – a reduction in Arms – with increasing Mf. While somewhat counter-intuitive, this finding stems from two effects that have been well documented in prior studies: (1) an overestimation of StO2 in low-pigmentation levels cases – particularly at lower saturation values, as demonstrated in phantom studies by Kleiser et al. and others [37–40] and (2) a negative bias with increasing pigmentation, as documented in the seminal clinical study by Bickler et al. [12]. When combined, the positive local bias in (1) is reduced by the negative local bias in (2), resulting in greater accuracy for higher Mf cases. However, the finding of a melanin-correlated improvement in accuracy may not have positive implications for highly pigmented patients. A prior phantom study [39] covering a wider range of cerebral oximeter models indicated that some did not exhibit significant positive bias in low pigmentation cases. If pigmentation bias is significant for such devices, StO2 values might fall below the reference value. Furthermore, clinicians may develop practices/habits that are effective for patients with light to moderate pigmentation. When they then treat high pigmentation patients, these same practices may no longer be appropriate since actual saturation values and sensitivity to changes in saturation may be greater than anticipated.
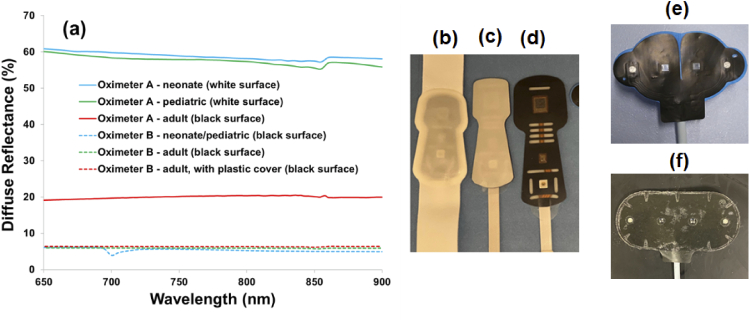
Phantom measurements consistently showed that all device/sensor combinations tested were influenced by epidermal pigmentation. The magnitude of this effect varied greatly, with maximum ΔStO2 ranging from 2 to 15% depending on phantom case, sensor type, and SRO2 level. The impact of pigmentation was greatest for Oximeter A with neonatal and pediatric sensors, and the influence of Mf and SRO2 on this relationship was particularly evident. These sensors use a turbid white cover, unlike the other sensors studied here. We measured the diffuse reflectance of each sensor surface using the integrating sphere spectrophotometer (Fig. 13). The neonate and pediatric sensors for Oximeter A both exhibited reflectivity of 55-60% across the Vis-NIR range. Of the three sensors that appeared black, the Oximeter A sensor had a reflectivity of about 20%, whereas the Oximeter B sensors had reflectivity levels of approximately 6%. Theoretically, greater sensor reflectivity should lead to an increase in the amount of light that passes through the epidermis and then returns into the tissue. While this effect likely reduces light loss at the surface and increases the detected reflectance, it may also increase the number of times that photons cross the epidermis. Resultant increases in superficial fluence may enhance sensitivity to melanin and lead to the type of results seen for Oximeter A neonatal and pediatric sensors. We note that a similar sensor feature – white sensor covers sometimes kept in place by clinicians during measurements to protect neonatal skin from adhesives on the sensor – have recently been shown to have an adverse impact on accuracy during clinical measurements [55]. Additionally, the ISO pulse oximeter standard (Section FF.6) provides a discussion and warning about the potential for blue bandages with absorption that decreases strongly and monotonically across the 650-800 nm range to cause erroneous results [56]. To better elucidate the role of sensor reflectivity and its impact on cerebral oximetry light-tissue interactions, we are currently performing a Monte Carlo modeling study. Additionally, sensor reflectivity could impact robustness to pigmentation for other related devices, including pulse oximeters, wearables and even photoacoustic imaging systems.
Fig. 13.
Surface reflectance of sensors, (a) as measured with a spectrophotometer, along with photos of sensors including Oximeter A (b) neonate (c) pediatric and (d) adult, as well as Oximeter B (e) neonate/pediatric and (f) adult.
The relatively minor impact of Mf on results for adult sensors is not entirely unexpected. For sensors with larger source-detector separation distances, the mean penetration depth of detected light tends to be larger. Thus, interactions with the epidermis are reduced in comparison to the shorter-distance sensors used for neonatal and pediatric patients. However, as with all reflectance sensors, light must traverse the epidermis twice in order to be detected, which can cause significant reduction and spectral alteration in detected reflectance [26].
Decreasing ctHb to below physiologically normal levels led to small but consistent increases in Arms for Oximeter A sensors, whereas Oximeter B did not show a consistent trend. Robustness to epidermal pigmentation also did not change in a significant or consistent manner as a function of ctHb level. In a prior phantom study [38], a strong decrease in sensitivity was documented as ctHb was reduced from 70 µM to 45 µM, and then to 25 µM. Thus, our finding of minimal impact with large changes in ctHb was an unexpected result. This issue requires additional study to elucidate the reason for these different findings and to determine the point at which reductions in ctHb significantly degrade accuracy and/or robustness to pigmentation.
In contrast to pulse oximetry, where a small positive bias in SpO2 due to pigmentation is typically reported [28,31], our results are in agreement with prior findings that cerebral oximeters tend to display a decrease in StO2 with Mf [12,33]. This negative trend may be due to melanin absorption being more spectrally similar to deoxy-Hb than oxy-Hb – especially at the shorter Vis-NIR wavelengths where melanin absorption makes the greatest impact on diffuse reflectance. An increase in Mf may impart a contribution similar to that of deoxy-Hb, leading to a decrease in estimated StO2, yet this impact should be mitigated to some extent by algorithms that use short-distance fibers to compensate for superficial chromophores. However, it is likely that these algorithms were designed more to correct for the impact of slightly deeper extracranial layers than the epidermis. To better mitigate pigmentation bias, it may be necessary to modify these algorithms to more directly compensate for the optical impact of epidermal melanin. Thus, additional study of both light-tissue interaction mechanisms and algorithms used in cerebral oximeters is warranted.
4.2. Phantom effectiveness
Prior phantom-based studies have not evaluated skin pigmentation’s impact on performance of commercial cerebral oximeters. However, these studies have often shown a small negative bias at high SRO2 values and larger positive bias at low SRO2 values [38,39]. Thus, overall, the slope of the accuracy curves – i.e., sensitivity to changes in SRO2 – was substantially less than unity, especially for phantoms with thicker, more biologically relevant superficial layers [37,57]. Our results for low Mf epidermis cases are in good agreement with trends from these prior studies.
Clinical evidence also provides some corroboration of our findings at higher Mf levels. The landmark study of healthy volunteer subjects by Bickler et al. [12] demonstrated a negative pigmentation-dependent bias in some cerebral oximeters, including a model similar to our Oximeter A (adult sensor). The magnitude of the difference between “light” and “dark” subjects was only about 3.4% on average, but found to be statistically significant (P < 0.001). Another study using a different cerebral oximeter reported a discrepancy between StO2 values in Caucasian (65 +/- 12%) and African-American (53 +/- 13%) adult undergoing cardiac surgery [33]. Although these findings have provided important evidence, additional clinical research for neonatal, pediatric and adult groups is warranted using modern oximeters, as well as an objective, quantitative approach for categorizing subject pigmentation level.
4.3. Best practices for standardized testing
Superficial phantom layers that replicate the spectral properties of pigmented epidermis have been produced in several prior studies. However, most prior TMMs have involved hydrogel formulations with limited shelf life and mechanical durability and/or not shown tunability across the full biologically-relevant range of epidermal absorption coefficients [19,20]. These TMMs have also not demonstrated the ability to produce plausible results in clinical devices. Thus, a primary outcome of this study is a novel silicone-based TMM that is stable, tunable and has been implemented with clinical cerebral oximeters. Furthermore, our approach has the potential to be used with liquid phantoms that incorporate solid walls of turbid polymers which simulate extracerebral regions [37,39] and should be adaptable to a variety of other optical devices including pulse oximeters, fNIRS (functional near-infrared spectroscopy) systems, wearable sensors and spatial frequency domain imagers.
In order to establish at a suitable standardized test method for assessing robustness of cerebral oximeters to epidermal pigmentation, several additional challenges should be addressed. While the aforementioned optical properties of epidermis proposed by Jacques are widely used, stronger evidence of their validity using modern techniques should be published and/or alternate values proposed. Further optimization of our phantom fabrication approach is needed to produce thinner epidermal layers that represent more typical biological values (e.g., ∼70 µm) rather than the limiting case scenario of 100-130 µm represented in our current phantom. Additionally, since the literature [58] indicates that neonate melanin content is lower at birth, and increases in the following months and years, quantitative characterization of the degree to which Mf evolves over time would help ensure more accurate predictions of device performance. Achieving these goals will help provide a strong foundation for the establishment of standardized performance testing best practices that enable the assessment of robustness to pigmentation with a high degree of confidence.
5. Conclusion
Ensuring that variations in skin pigmentation do not significantly alter the performance of medical devices is critical for optimizing public health in a diverse population. The phantom-based approach developed and implemented in this study represents a step towards achieving this goal for cerebral oximeters. Our results with this technique show good agreement with prior phantom and clinical studies, while also providing new insights into system performance. By isolating changes in key biological parameters, we were able to document that increasing melanin content decreased saturation values displayed by two commercial devices. This led to the somewhat counterintuitive effect of improving overall device accuracy, by reducing the high positive bias at low saturation levels produced in low pigmentation cases. The true clinical implications of this effect require further study. Phantom measurements also identified sensor-specific differences, including evidence that high sensor surface reflectivity may enhance the impact of epidermal melanin. In general, improving device robustness to skin pigmentation will likely require modifications in both instrumentation and algorithms.
The work presented here advances best practices towards a standardized test method for objective, quantitative assessment of device performance. Such an approach can be used to produce performance data that is complementary to clinical studies, as it avoids some of the limitations of these studies. Additionally, the methods and insights generated in this research may have practical implications for assessment of epidermal pigmentation effects across a range of other biophotonic technologies, including pulse oximetry, wearables, and photoacoustic imaging.
Acknowledgments
Three-dimensional printing was performed in the FDA Additive Manufacturing of Medical Products (AMMP) Lab, supported by the Office of the Chief Scientist’s Shared Resources program. The authors would also like to thank the following colleagues for helpful discussions, including Prof. David Busch (Univ. of Texas, Arlington), Prof. Yu Chen (Univ. of Massachusetts, Amherst), and members of the ISO-IEC Joint Working Group on Oximetry (AAMI EV/WG09 and ISO TC121 SC3/JWG10). This project was supported in part by an appointment to the Research Participation Program at the Center for Devices and Radiological Health, U.S. Food and Drug Administration, administered by the Oak Ridge Institute for Science and Education through an interagency agreement between the U.S. Department of Energy and FDA.
This article is dedicated to the memory of Mr. Gonzalo Mendoza, MS – an exceptional engineer and friend.
Funding
FDA10.13039/100000038 Office of Minority Health and Health Equity and FDA Perinatal Health Center of Excellence.
Disclosures
The mention of commercial products, their sources, or their use in connection with material reported herein is not to be construed as either an actual or implied endorsement of such products by the Department of Health and Human Services. This article reflects the views of the authors and should not be construed to represent FDA’s views or policies.
Data availability
Data underlying the results presented in this paper are not publicly available at this time but may be obtained from the authors upon reasonable request.
References
- 1.Desmond F. A., Namachivayam S., “Does near-infrared spectroscopy play a role in paediatric intensive care?” BJA Education 16(8), 281–285 (2016). 10.1093/bjaed/mkv053 [DOI] [Google Scholar]
- 2.van Bel F., Lemmers P., Naulaers G., “Monitoring neonatal regional cerebral oxygen saturation in clinical practice: value and pitfalls,” Neonatology 94(4), 237–244 (2008). 10.1159/000151642 [DOI] [PubMed] [Google Scholar]
- 3.Vannucci R. C., Perlman J. M., “Interventions for perinatal hypoxic-ischemic encephalopathy,” Pediatrics 100(6), 1004–1114 (1997). 10.1542/peds.100.6.1004 [DOI] [PubMed] [Google Scholar]
- 4.Wolf M., Ferrari M., Quaresima V., “Progress of near-infrared spectroscopy and topography for brain and muscle clinical applications,” J. Biomed. Opt. 12(6), 062104 (2007). 10.1117/1.2804899 [DOI] [PubMed] [Google Scholar]
- 5.Yu Y., Zhang K., Zhang L., Zong H., Meng L., Han R., “Cerebral near-infrared spectroscopy (NIRS) for perioperative monitoring of brain oxygenation in children and adults,” Cochrane Database Syst. Rev. 1, CD010947 (2018). 10.1002/14651858.CD010947.pub2 [DOI] [PMC free article] [PubMed] [Google Scholar]
- 6.Germon T. J., Kane N. M., Manara A. R., Nelson R. J., “Near-infrared spectroscopy in adults: effects of extracranial ischaemia and intracranial hypoxia on estimation of cerebral oxygenation,” Br. J. Anaesth. 73(4), 503–506 (1994). 10.1093/bja/73.4.503 [DOI] [PubMed] [Google Scholar]
- 7.Badenes R., García-Pérez M. L., Bilotta F., “Intraoperative monitoring of cerebral oximetry and depth of anaesthesia during neuroanesthesia procedures,” Curr. Opin. Anesthesiol. 29(5), 576–581 (2016). 10.1097/ACO.0000000000000371 [DOI] [PubMed] [Google Scholar]
- 8.Fischer G. W., “Recent advances in application of cerebral oximetry in adult cardiovascular surgery,” Semin. Cardiothorac. Vasc. Anesth. 12(1), 60–69 (2008). 10.1177/1089253208316443 [DOI] [PubMed] [Google Scholar]
- 9.Tobias J. D., “Cerebral oximetry monitoring with near infrared spectroscopy detects alterations in oxygenation before pulse oximetry,” J. Intensive Care Med. 23(6), 384–388 (2008). 10.1177/0885066608324380 [DOI] [PubMed] [Google Scholar]
- 10.Hyttel-Sorensen S., Pellicer A., Alderliesten T., Austin T., van Bel F., Benders M., Claris O., Dempsey E., Franz A. R., Fumagalli M., Gluud C., Grevstad B., Hagmann C., Lemmers P., van Oeveren W., Pichler G., Plomgaard A. M., Riera J., Sanchez L., Winkel P., Wolf M., Greisen G., “Cerebral near infrared spectroscopy oximetry in extremely preterm infants: phase II randomised clinical trial,” BMJ 350, g7635 (2015). 10.1136/bmj.g7635 [DOI] [PMC free article] [PubMed] [Google Scholar]
- 11.Dix L. M., van Bel F., Baerts W., Lemmers P. M., “Comparing near-infrared spectroscopy devices and their sensors for monitoring regional cerebral oxygen saturation in the neonate,” Pediatr. Res. 74(5), 557–563 (2013). 10.1038/pr.2013.133 [DOI] [PubMed] [Google Scholar]
- 12.Bickler P. E., Feiner J. R., Rollins M. D., “Factors affecting the performance of 5 cerebral oximeters during hypoxia in healthy volunteers,” Anesth. Analg. 117(4), 813–823 (2013). 10.1213/ANE.0b013e318297d763 [DOI] [PubMed] [Google Scholar]
- 13.Hyttel-Sorensen S., Kleiser S., Wolf M., Greisen G., “Calibration of a prototype NIRS oximeter against two commercial devices on a blood-lipid phantom,” Biomed. Opt. Express 4(9), 1662–1672 (2013). 10.1364/BOE.4.001662 [DOI] [PMC free article] [PubMed] [Google Scholar]
- 14.Lewis G. D., Messing W. P., Stewart M. C., II, “Optical cerebral oximeter,” U.S. patent 5,902,235 (11 May 1999).
- 15.Brenner M., Hearing V. J., “The protective role of melanin against UV damage in human skin,” Photochem. Photobiol. 84(3), 539–549 (2008). 10.1111/j.1751-1097.2007.00226.x [DOI] [PMC free article] [PubMed] [Google Scholar]
- 16.Mignon C., Tobin D. J., Zeitouny M., Uzunbajakava N. E., “Shedding light on the variability of optical skin properties: finding a path towards more accurate prediction of light propagation in human cutaneous compartments,” Biomed. Opt. Express 9(2), 852–872 (2018). 10.1364/BOE.9.000852 [DOI] [PMC free article] [PubMed] [Google Scholar]
- 17.Zonios G., Dimou A., Bassukas I., Galaris D., Tsolakidis A., Kaxiras E., “Melanin absorption spectroscopy: new method for noninvasive skin investigation and melanoma detection,” J. Biomed. Opt. 13(1), 014017 (2008). 10.1117/1.2844710 [DOI] [PubMed] [Google Scholar]
- 18.Jacques S. L., “Origins of tissue optical properties in the UVA, visible and NIR regions,” in OSA TOPS on Advances in Optical Imaging and Photon Migration, Alfano R. R., Fujimoto J.G., eds., pp. 364–371 (1996). [Google Scholar]
- 19.Jacques S. L., “Optical properties of biological tissues: a review,” Phys. Med. Biol. 58(11), R37–R61 (2013). 10.1088/0031-9155/58/11/R37 [DOI] [PubMed] [Google Scholar]
- 20.Jacques S. L., “Quick analysis optical spectra to quantify epidermal melanin and papillary dermal blood content of skin,” J. Biophotonics 8(4), 309–316 (2015). 10.1002/jbio.201400103 [DOI] [PubMed] [Google Scholar]
- 21.Jacques S. L., McAuliffe D. J., “The melanosome: threshold temperature for explosive vaporization and internal absorption coefficient during pulsed laser irradiation,” Photochem. Photobiol. 53(6), 769–775 (1991). 10.1111/j.1751-1097.1991.tb09891.x [DOI] [PubMed] [Google Scholar]
- 22.Fitzpatrick T. B., “The validity and practicality of sun-reactive skin types I through VI,” Arch. Dermatol. 124(6), 869–871 (1988). 10.1001/archderm.1988.01670060015008 [DOI] [PubMed] [Google Scholar]
- 23.Huang W.-S., Wang Y.-W., Hung K.-C., Hsieh P.-S., Fu K.-Y., Dai L.-G., Liou N.-H., Ma K.-H., Liu J.-C., Dai N.-T., “High correlation between skin color based on CIELAB color space, epidermal melanocyte ratio, and melanocyte melanin content,” PeerJ 6, e4815e4815 (2018). 10.7717/peerj.4815 [DOI] [PMC free article] [PubMed] [Google Scholar]
- 24.Eilers S., Bach D. Q., Gaber R., Blatt H., Guevara Y., Nitsche K., Kundu R. V., Robinson J. K., “Accuracy of self-report in assessing Fitzpatrick skin phototypes I through VI,” JAMA Dermatol. 149(11), 1289–1294 (2013). 10.1001/jamadermatol.2013.6101 [DOI] [PubMed] [Google Scholar]
- 25.Wray S., Cope M., Delpy D. T., Wyatt J. S., Reynolds E. O., “Characterization of the near infrared absorption spectra of cytochrome aa3 and haemoglobin for the non-invasive monitoring of cerebral oxygenation,” Biochim. Biophys. Acta 933(1), 184–192 (1988). 10.1016/0005-2728(88)90069-2 [DOI] [PubMed] [Google Scholar]
- 26.Mendenhall M. J., Nunez A. S., Martin R. K., “Human skin detection in the visible and near infrared,” Appl. Opt. 54(35), 10559–10570 (2015). 10.1364/AO.54.010559 [DOI] [PubMed] [Google Scholar]
- 27.Ries A. L., Prewitt L. M., Johnson J. J., “Skin color and ear oximetry,” Chest 96(2), 287–290 (1989). 10.1378/chest.96.2.287 [DOI] [PubMed] [Google Scholar]
- 28.Bickler P. E., Feiner J. R., Severinghaus J. W., “Effects of skin pigmentation on pulse oximeter accuracy at low saturation,” Anesthesiology 102(4), 715–719 (2005). 10.1097/00000542-200504000-00004 [DOI] [PubMed] [Google Scholar]
- 29.Feiner J. R., Severinghaus J. W., Bickler P. E., “Dark skin decreases the accuracy of pulse oximeters at low oxygen saturation: the effects of oximeter probe type and gender,” Anesth. Analg. 105(6), S18–S23 (2007). 10.1213/01.ane.0000285988.35174.d9 [DOI] [PubMed] [Google Scholar]
- 30.Foglia E. E., Whyte R. K., Chaudhary A., Mott A., Chen J., Propert K. J., Schmidt B., “The effect of skin pigmentation on the accuracy of pulse oximetry in infants with hypoxemia,” J Pediatr 182, 375–377.e2 (2017). 10.1016/j.jpeds.2016.11.043 [DOI] [PMC free article] [PubMed] [Google Scholar]
- 31.Sjoding M. W., Dickson R. P., Iwashyna T. J., Gay S. E., Valley T. S., “Racial bias in pulse oximetry measurement (Letter),” N. Engl. J. Med. 383(25), 2477–2478 (2020). 10.1056/NEJMc2029240 [DOI] [PMC free article] [PubMed] [Google Scholar]
- 32.Cheng E. Y., Hopwood M. B., Kay J., “Forehead pulse oximetry compared with finger pulse oximetry and arterial blood gas measurement,” J. Clin. Monit. 4(3), 223–226 (1988). 10.1007/BF01621821 [DOI] [PubMed] [Google Scholar]
- 33.Sun X., Ellis J., Corso P. J., Hill P. C., Chen F., Lindsay J., “Skin pigmentation interferes with the clinical measurement of regional cerebral oxygen saturation,” Br. J. Anaesth. 114(2), 276–280 (2015). 10.1093/bja/aeu335 [DOI] [PubMed] [Google Scholar]
- 34.Couch L. L., Roskosky M., Freedman B., Shuler M., “Effect of skin pigmentation on near infrared spectroscopy,” Am. J. Analyt. Chem. 06(12), 911–916 (2015). 10.4236/ajac.2015.612086 [DOI] [Google Scholar]
- 35.“Particular requirements for the basic safety and essential performance of cerebral tissue oximeter equipment,” ISO 80601-2-85:2021.
- 36.Kreeger R. N., Ramamoorthy C., Nicolson S. C., Ames W. A., Hirsch R., Peng L. F., Glatz A. C., Hill K. D., Hoffman J., Tomasson J., Kurth C. D., “Evaluation of pediatric near-infrared cerebral oximeter for cardiac disease,” Ann. Thorac. Surg. 94(5), 1527–1533 (2012). 10.1016/j.athoracsur.2012.05.096 [DOI] [PubMed] [Google Scholar]
- 37.Izzetoglu M., Pourrezaei K., Du J., Shewokis P. A., “Evaluation of cerebral tissue oximeters using multilayered dynamic head models,” IEEE Trans. Instr. Meas. 70, 1–12 (2021). 10.1109/TIM.2021.3066469 [DOI] [Google Scholar]
- 38.Kleiser S., Nasseri N., Andresen B., Greisen G., Wolf M., “Comparison of tissue oximeters on a liquid phantom with adjustable optical properties,” Biomed. Opt. Express 7(8), 2973–2992 (2016). 10.1364/BOE.7.002973 [DOI] [PMC free article] [PubMed] [Google Scholar]
- 39.Kleiser S., Ostojic D., Andresen B., Nasseri N., Isler H., Scholkmann F., Karen T., Greisen G., Wolf M., “Comparison of tissue oximeters on a liquid phantom with adjustable optical properties: an extension,” Biomed. Opt. Express 9(1), 86–101 (2018). 10.1364/BOE.9.000086 [DOI] [PMC free article] [PubMed] [Google Scholar]
- 40.Afshari A., Ghassemi P., Lin J., Halprin M., Wang J., Mendoza G., Weininger S., Pfefer T. J., “Cerebral oximetry performance testing with a 3D-printed vascular array phantom,” Biomed. Opt. Express 10(8), 3731–3746 (2019). 10.1364/BOE.10.003731 [DOI] [PMC free article] [PubMed] [Google Scholar]
- 41.Farzam P., Starkweather Z., Franceschini M. A., “Validation of a novel wearable, wireless technology to estimate oxygen levels and lactate threshold power in the exercising muscle,” Physiol. Rep. 6(7), e13664 (2018). 10.14814/phy2.13664 [DOI] [PMC free article] [PubMed] [Google Scholar]
- 42.Chen A. I., Balter M. L., Chen M. I., Gross D., Alam S. K., Maguire T. J., Yarmush M. L., “Multilayered tissue mimicking skin and vessel phantoms with tunable mechanical, optical, and acoustic properties,” Med. Phys. 43(6Part1), 3117–3131 (2016). 10.1118/1.4951729 [DOI] [PMC free article] [PubMed] [Google Scholar]
- 43.Saager R. B., Cuccia D. J., Durkin A. J., “Determination of optical properties of turbid media spanning visible and near-infrared regimes via spatially modulated quantitative spectroscopy,” J. Biomed. Opt. 15(1), 017012 (2010). 10.1117/1.3299322 [DOI] [PMC free article] [PubMed] [Google Scholar]
- 44.Soyemi O. O., Landry M. R., Yang Y., Idwasi P. O., Soller B. R., “Skin color correction for tissue spectroscopy: demonstration of a novel approach with tissue-mimicking phantoms,” Appl. Spectrosc. 59(2), 237–244 (2005). 10.1366/0003702053085151 [DOI] [PubMed] [Google Scholar]
- 45.Saager R. B., Kondru C., Au K., Sry K., Ayers F., Durkin A. J., “Multilayer silicone phantoms for the evaluation of quantitative optical techniques in skin imaging,” Proc. SPIE 7567-06, 1–8 (2010). [Google Scholar]
- 46.Prahl S. A., “The adding-doubling method,” in Optical-Thermal Response of Laser-Irradiated Tissue , Welch A. J., van Gemert M.J.C., eds. (Springer, 1995), pp. 101–129. [Google Scholar]
- 47.van der Zee P., Essenpreis M., Delpy D., “Optical properties of brain tissue,” Proc. SPIE 1888, 454–465 (1993). [Google Scholar]
- 48.Farzam P., Buckley E. M., Lin P.-Y., Hagan K., Grant P. E., Inder T. E., Carp S. A., Franceschini M. A., “Shedding light on the neonatal brain: probing cerebral hemodynamics by diffuse optical spectroscopic methods,” Sci. Rep. 7(1), 15786 (2017). 10.1038/s41598-017-15995-1 [DOI] [PMC free article] [PubMed] [Google Scholar]
- 49.Farina A., Torricelli A., Bargigia I., Spinelli L., Cubeddu R., Foschum F., Jäger M., Simon E., Fugger O., Kienle A., Martelli F., Di Ninni P., Zaccanti G., Milej D., Sawosz P., Kacprzak M., Liebert A., Pifferi A., “In-vivo multilaboratory investigation of the optical properties of the human head,” Biomed. Opt. Express 6(7), 2609–2623 (2015). 10.1364/BOE.6.002609 [DOI] [PMC free article] [PubMed] [Google Scholar]
- 50.Sandby-Moller J., Poulsen T., Wulf H. C., “Epidermal thickness at different body sites: relationship to age, gender, pigmentation, blood content, skin type and smoking habits,” Acta Derm. Venereol. 83(6), 410–413 (2003). 10.1080/00015550310015419 [DOI] [PubMed] [Google Scholar]
- 51.Freeman R. G., Cockerell E. G., Armstrong J., Knox J. M., “Sunlight as a factor influencing the thickness of epidermis,” J. Invest. Derm. 39(4), 295–298 (1962). 10.1038/jid.1962.115 [DOI] [PubMed] [Google Scholar]
- 52.Marchesini R., Cascinelli N., Brambilla M., Clemente C., Mascheroni L., Pignoli E., Testori A., Venturoli D. R., “In vivo spectrophotometric evaluation of neoplastic and non-neoplastic skin pigmented lesions. II: Discriminant analysis between nevus and melanoma,” Photochem. Photobiol. 55(4), 515–522 (1992). 10.1111/j.1751-1097.1992.tb04272.x [DOI] [PubMed] [Google Scholar]
- 53.Zijlstra W. G., Buursma A., “Spectrophotometry of hemoglobin: Absorption spectra of bovine oxyhemoglobin, deoxyhemoglobin, carboxyhemoglobin, and methemoglobin,” Comp. Biochem. Physiol B 118(4), 743–749 (1997). 10.1016/S0305-0491(97)00230-7 [DOI] [Google Scholar]
- 54.Dalziel K., O’Brien J. R., “Side reactions in the deoxygenation of dilute oxyhaemoglobin solutions by sodium dithionite,” Biochem. J. 67(1), 119–124 (1957). 10.1042/bj0670119 [DOI] [PMC free article] [PubMed] [Google Scholar]
- 55.Hansen M., Ostojic D, Kleiser S, Greisen G, Wolf M, “Not removing the glossy white cover from adhesive INVOS neonatal sensors affects the oxygenation measurement,” in Oxygen Transport to Tissue XLII (Springer Nature, 2021), pp. 353–357. [DOI] [PubMed] [Google Scholar]
- 56.“Particular requirements for basic safety and essential performance of pulse oximeter equipment,” ISO 80601-61:2017.
- 57.Nasseri N., Kleiser S., Ostojic D., Karen T., Wolf M., “Quantifying the effect of adipose tissue in muscle oximetry by near infrared spectroscopy,” Biomed. Opt. Express 7(11), 4605–4619 (2016). 10.1364/BOE.7.004605 [DOI] [PMC free article] [PubMed] [Google Scholar]
- 58.Bosschaart N., Mentink R., Kok J. H., van Leeuwen T. G., Aalders M. C., “Optical properties of neonatal skin measured in vivo as a function of age and skin pigmentation,” J. Biomed. Opt. 16(9), 097003 (2011). 10.1117/1.3622629 [DOI] [PubMed] [Google Scholar]
Associated Data
This section collects any data citations, data availability statements, or supplementary materials included in this article.
Data Availability Statement
Data underlying the results presented in this paper are not publicly available at this time but may be obtained from the authors upon reasonable request.


