Abstract
Carpal tunnel syndrome (CTS) is the most common entrapment neuropathy caused by impairment of the median nerve due to compression as it passes through the carpal tunnel.
The current gold standard in diagnosing CTS and nerve damage is by electrophysiological nerve conduction study (NCS). However, 10 to 25% of NCS results are falsely negative. Moreover, NCS remains an expensive and time-consuming procedure for patients. Ultrasonography serves as a real-time, well-tolerated, portable, and noninvasive tool for assessing the carpal tunnel.
This study aims to assess the role of high-frequency ultrasound of the median nerve at the wrist in evaluating CTS and correlate with NCS to determine whether sonography can be used as an alternative to NCS in diagnosing and grading CTS.
Keywords: cross-sectional area, CTS, flattening ratio, median nerve, NCS, palmar bowing
Introduction
Carpal tunnel syndrome (CTS) is the most common entrapment neuropathy caused by impairment of the median nerve due to compression as it passes through the carpal tunnel (carpal—from the Greek word karpos, meaning “wrist”). Sir James Paget (1854) was the first to describe the features of CTS 1 and is defined as “a constellation of clinical symptoms and signs caused by compression and slowing of the median nerve at the wrist.” 2 Diagnosis of CTS is usually based on characteristic symptoms.
The current gold standard in diagnosing CTS and nerve damage is by electrophysiological nerve conduction study (NCS). 3 However, 10 to 25% of NCS results are falsely negative. Moreover, NCS remains an expensive and time-consuming procedure for patients. 4 5 Ultrasonography serves as a real-time, well-tolerated, portable, and noninvasive tool for assessing the carpal tunnel. Although previous studies tried to determine the appropriate sonographic cutoff values to accurately diagnose and grade the severity of CTS, there is lack of consensus in the literature among different investigators.
Aims and Objectives
This study aims to assess the role of high-frequency ultrasound of the median nerve at the wrist in evaluating CTS and correlate with NCS results to determine whether sonography can be used as an alternative to NCS in diagnosing and grading CTS.
Anatomy
The carpal tunnel is an osteofibrous canal located in the volar aspect of the wrist. The boundaries of the carpal tunnel are the carpal bones forming the floor and the flexor retinaculum forming the roof. The flexor retinaculum is ∼3 to 4 cm wide and proximally attaches to the scaphoid tubercle on the radial side and to the pisiform bone on the ulnar side (proximal carpal tunnel or inlet) ( Fig. 1 ). Distally the flexor retinaculum attaches to the trapezoid tubercle on the radial side and to the hook of the hamate bone on the ulnar side (distal carpal tunnel or outlet) 6 ( Fig. 2 ).
Fig. 1.
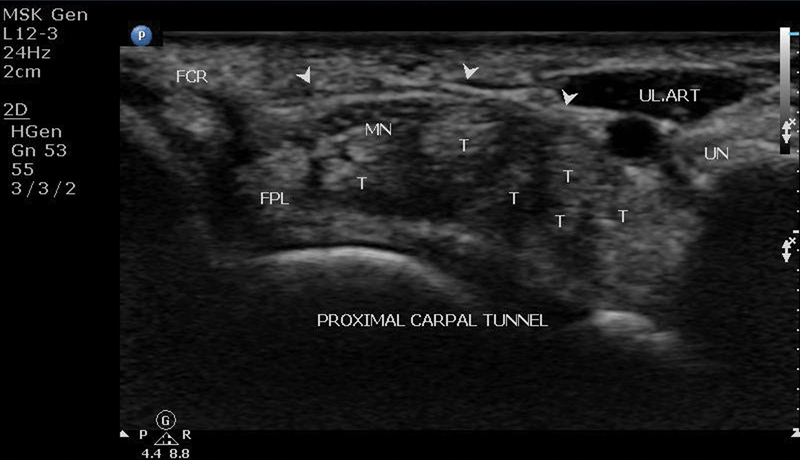
Ultrasound of proximal carpal tunnel: arrowheads, flexor retinaculum; FCR, flexor carpi radialis tendon; FPL, flexor pollicis longus tendon; MN, median nerve; T, flexor digitorum superficialis and profundus tendons.
Fig. 2.
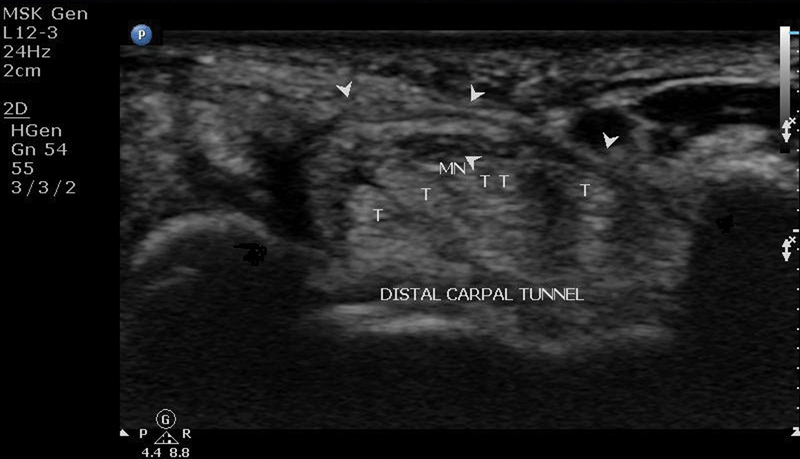
Ultrasound of distal carpal tunnel: H, hamate; MN, median nerve; arrowheads, flexor retinaculum; T, flexor digitorum superficialis and profundus tendons; TR, trapezium.
The carpal tunnel contains nine tendons and a nerve: the flexor pollicis longus, the four flexor digitorum superficialis (FDS), the four flexor digitorum profundus (FDP), and the median nerve.
Median Nerve
The median nerve 7 arises from the medial and lateral cords of the brachial plexus and is innervated by the C5-T1 nerve roots. The median nerve can be followed into the carpal tunnel from its location between the FDS and the FDP in the mid forearm. At the wrist the median nerve is superficially located just deep to the palmaris longus tendon and flexor retinaculum, lateral to the FDS tendons and medial to the flexor carpi radialis.
Individual fascicles are separated by collagen and are bundled together by epineurium to form nerves. These features give nerves a characteristic honeycomb appearance in the short axis where the hypoechoic nerve fascicles are surrounded by hyperechoic connective tissue and collagen ( Fig. 3A , B ). In the long axis, peripheral nerves appear coarse and hypoechoic, a finding that helps to distinguish nerves from adjacent tendons that appear more echogenic, compact, and fibrillar. 8 9
Fig. 3.
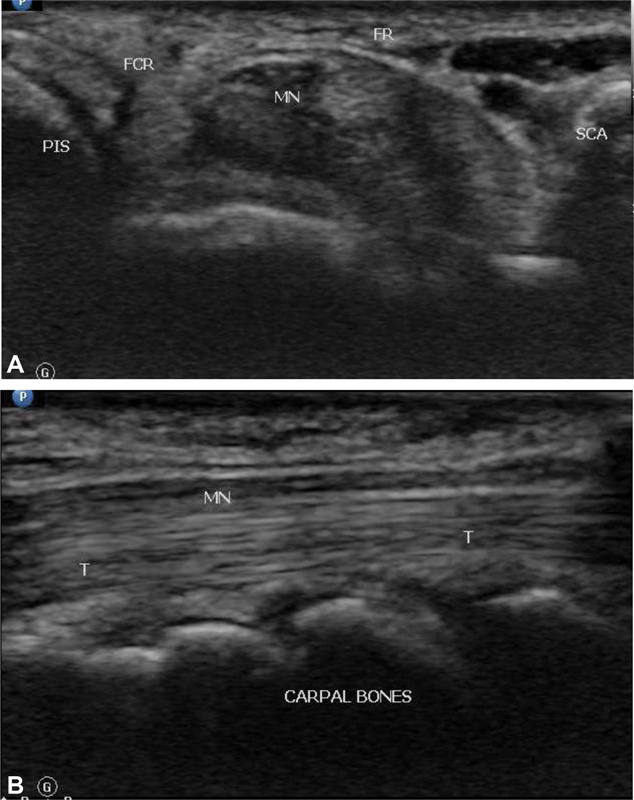
(Ultrasound image showing cross-section ( A ) and longitudinal section ( B ) of the normal median nerve. FR, flexor retinaculum; MN, median nerve; SCA, scaphoid; PIS, pisiform. T, flexor tendon in longitudinal plane.
Differentiation of median nerve and the tendons can be done by toggling the transducer and to look for anisotropy of the tendons surrounding the median nerve. The tendons will alternately be hypoechoic and hyperechoic, while the median nerve will remain hypoechoic and fascicular in appearance. 7
Carpal Tunnel Syndrome
CTS is a common, chronic, and disabling condition. The symptoms of CTS are pain, numbness, and tingling sensation in the hand. Majority of CTS cases occurs more frequently in females (65–80%) and between the ages of 40 and 60 years. 10 It is common in women and increased prevalence is seen with advancing age, obesity and occupation with strenuous, repetitive tasks, and in those making extensive use of vibrating tools. 11
Scenario in India: In a study conducted by Murthy and Meena 12 in South Indian population using electrodiagnostic studies, CTS constituted 7% of all the peripheral nerve disorders in general and 83.6% of entrapment neuropathies in particular.
The pathophysiology of CTS is not clearly understood and is presumed to be compression and tension within the carpal tunnel. 13 The high carpal tunnel pressure in patients with CTS causes obstruction to venous outflow, back pressure, and edema formation. The underlying etiology is often uncertain and multifactorial and, in majority of cases, is idiopathic. Secondary CTS may be related to abnormalities of the carpal tunnel or its content. From a meta-analysis conducted in 2008, it was demonstrated that sex, age, genetic and anthropometric factors (size of the carpal tunnel) were the most important predisposing factors. 14
Clinical Diagnosis
Due to its typical clinical presentation, many cases of CTS are already diagnosed by patient's history. The clinical presentation includes numbness, pain, and tingling of the hands with symptoms occurring more during night. In advanced stages, hypotrophy of the abductor pollicis brevis and opponens pollicis muscles may be observed. 15
The most commonly used clinical test for diagnosing CTS are Phalen's and Tinel's test. The Phalen's test is considered positive when symptoms are reproduced by full palmar flexion of the wrist with the elbow in full extension and the forearm in pronation. 16 The Tinel's sign is considered positive if electric shock-like sensation or paraesthesia occurs in the area supplied by the median nerve when percussion is done over the course of the median nerve just proximal to the carpal tunnel. 17
The effects of bias on the clinical diagnosis for CTS were studied by a systematic review, which concluded that unbiased studies are scarce and that the value of confounded studies for clinical practice is limited. 18
Electrophysiologic Studies
NCS are still the gold standard for the diagnosis of CTS. 19 Demyelination of nerve leads to reduced nerve conduction velocity that can be detected by NCS. The goal of the electrodiagnostic evaluation in clinically suspected CTS is to confirm CTS in an efficient and technically reliable way, while also being comprehensive enough to exclude mimickers or superimposed neurogenic processes. 20
CTS cases are graded according to their electrophysiological severity with a scale proposed by Stevens 21 into mild (prolonged sensory or mixed [palmar] distal latency or amplitude reduction), moderate (above, PLUS prolonged median motor distal latency), severe (absent sensory response or low amplitude motor response), and very severe CTS (absent routine sensory and thenar motor responses, lumbrical response may still be present with prolonged latency).
Imaging in Carpal Tunnel Syndrome
Ultrasound and magnetic resonance imaging (MRI) are the two imaging modalities that are used in investigating the entrapment neuropathies.
High-Frequency Ultrasound
Although ultrasonography is routinely done in CTS especially in preoperative cases, they have not completely replaced the electrophysiological studies and parameters are not clearly defined in relation to Indian context. The use of diagnostic ultrasound for diagnosing CTS appears to be a more cost-effective strategy than electrophysiological studies . 22
Magnetic Resonance Imaging
MRI with its higher spatial resolution can detect the morphological changes of the median nerve in CTS. Increased signal on T2w images, changes in the cross-sectional area (CSA), and flattening of the median nerve are the most common abnormalities in CTS patients. The drawbacks of MRI include its cost, availability, claustrophobia, long scan times, and contraindications in patients with cardiac pacemakers or certain metallic implants. 23
Imaging criteria for detection of CTS on ultrasonography and MRI are the same and include:
Swelling of the median nerve —This can be assessed at varying levels within the carpal tunnel.
Flattening ratio (FR) —Usually the median nerve is swollen in the proximal tunnel and flattens in the distal tunnel. This is measured by the FR.
Palmer bowing of the flexor retinaculum —This is seen secondary to increased pressure in the carpal tunnel.
The benefits of ultrasound over MRI include cost-effectiveness, portability, real-time and dynamic imaging, and the ability to scan extremity quickly and efficiently. Ultrasound can also be performed on patients who are not eligible for MRI. Any abnormal findings detected can be easily compared with the contralateral side
Inclusion Criteria
Patients aged 18 years and above with clinical suspicion of CTS by symptoms and clinical examination were included.
Exclusion Criteria
Previous wrist surgery or injury.
Anatomical variants like bifid median nerve on ultrasound examination.
Clinical suspicion of any other neuropathies, for example, cervical spondylosis, brachial plexopathy.
Equipment and Setting Specifications
Real-time gray scale ultrasonographic examination was performed using PHILIPS HD 15 ultrasound system. The transducer used for the study was L12–3 MHz linear array transducer. Hard copy image of the cases was acquired and also saved on PACS as soft copy for reviewing.
NCS was subsequently performed using an electromyography machine (Nihon Kohden, Tokyo, Japan) by a neurologist on the same day after completing the ultrasound.
Ultrasound Protocol
The patients were seated supine facing the examiner with the forearm extended and the fingers semiextended in a comfortable position ( Fig. 4 ).
Fig. 4.
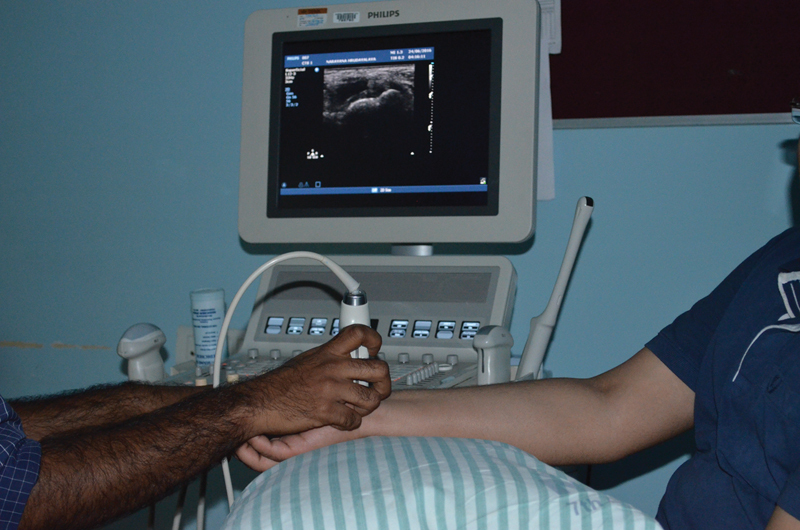
Wrist position and sonographic technique.
The various parameters assessed include the following.
Cross-Sectional Area of the Median Nerve
Axial images of the median nerve were taken at three levels and CSA was calculated at each level. CSA was measured by direct tracing with electronic calipers around the margin of the nerve excluding the hyperechoic epineural rim 24 ( Fig. 5A , B ).
Fig. 5.
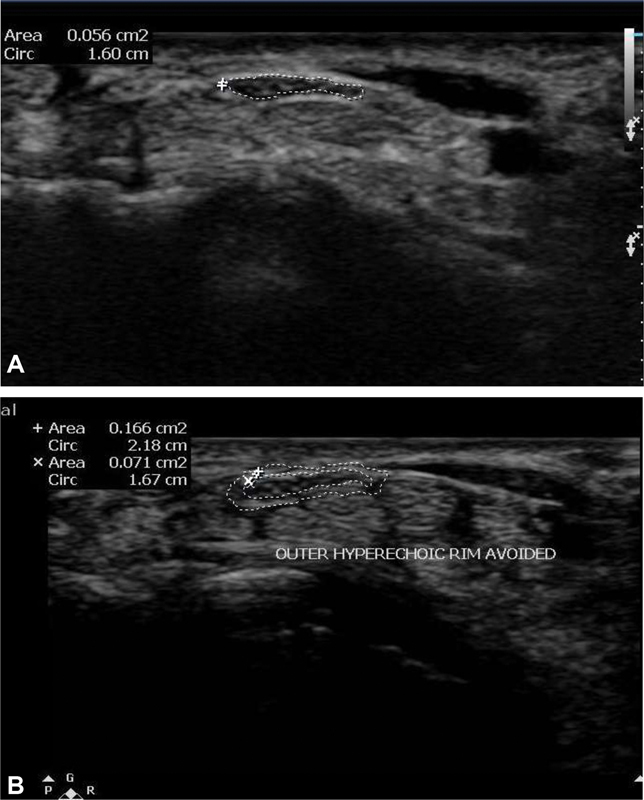
( A, B ) Ultrasound image showing correct method of measuring cross-sectional area of the median nerve. Hyperechoic epineural rim should be excluded from the caliper while taking cross-sectional area measurement.
Level 1—located just proximal to the tunnel inlet (CSA1).
Level 2—located at the pisiform bone level (CSA2), at the tunnel inlet.
Level 3—located at the hamate bone level, at the tunnel outlet (CSA3).
The area difference is calculated as:
Cross-sectional difference between inlet and proximal to the inlet (CSA2–1/CSA2–1)
Cross-sectional difference between inlet and outlet, inlet outlet ratio (CSA2–3 / CSA 2–3).
Flattening of the Median Nerve
FR was calculated using the ratio of mediolateral diameter to anteroposterior diameter of median nerve on cross-section image at the tunnel outlet ( Fig. 6 ).
Fig. 6.
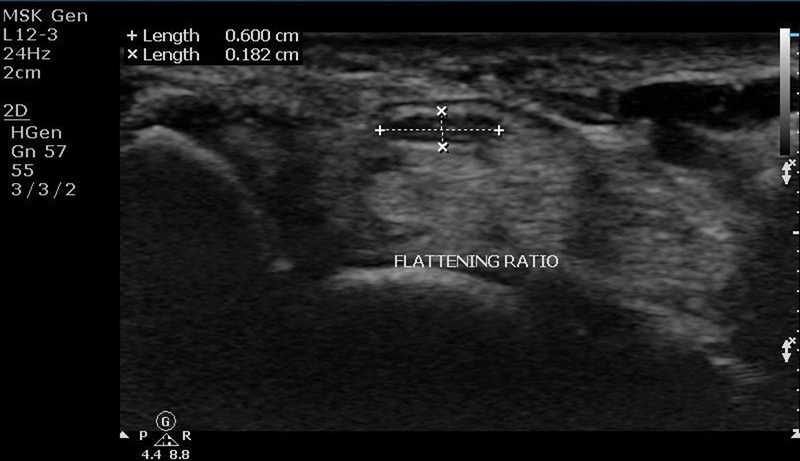
Ultrasound image showing method of measuring flattening ratio of the median nerve.
Bowing of the Flexor Retinaculum
Presence of increased palmar bowing of the flexor retinaculum was detected by measuring the apex of the flexor retinaculum from a straight line between the tubercle of trapezium and the hook of hamate at the distal tunnel ( Fig. 7 ).
Fig. 7.
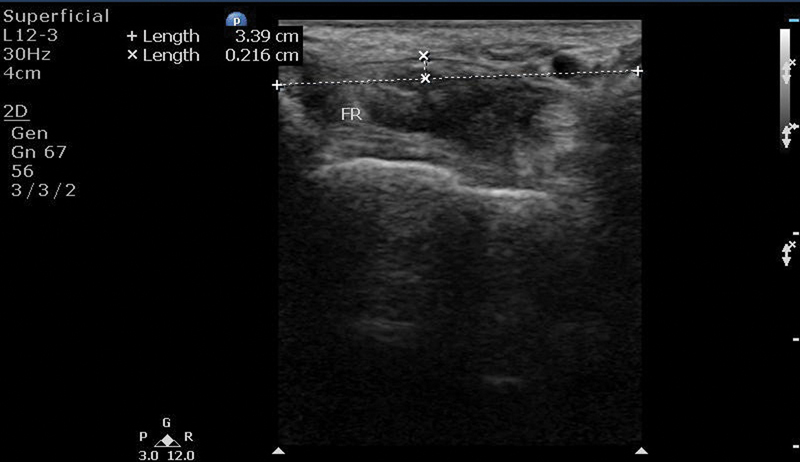
Diagram and ultrasonographic image showing method of measuring palmar bowing the flexor retinaculum.
Observation and Results
Statistical Analysis
Data was entered into Microsoft Excel data sheet and was analyzed using SPSS 22 version software. Categorical data was represented in the form of frequencies and proportions. Chi-square was used as test of significance. Continuous data was represented as mean and standard deviation. Independent t -test was used as test of significance to identify the mean difference between two groups. p -Value < 0.05 was considered as statistically significant.
Observations
The study was conducted on 88 wrists of 57 patients with clinical symptoms of CTS. Two wrists with clinical symptoms were excluded from the study. One affected wrist had bifid median nerve with persistent median artery and the other had prior history of surgery.
The measurements of the median nerve and flexor retinaculum were taken and compared with the findings of NCS.
CTS were observed more commonly among 40 to 60 years of age (average of 49.3 years).
CTS was bilateral in 31 and unilateral in 26 patients. Right wrist was more commonly affected than left with no significant association between side of the affected hand and severity of CTS. Most of the cases are idiopathic (46.6. %). Thirty-one affected wrists (35.2%) had diabetes mellitus, 18 (20.4%) rheumatoid arthritis, 12 (13.6%) hypothyroidism, and 1 wrist had flexor tenosynovitis.
The average body mass index (BMI) of the studied patients was 24.1 kg/m 2 On further analysis, significant association was observed between the severity of CTS and increasing BMI. Hence, BMI was a risk factor for increased severity of CTS.
The findings observed are as follows:
With increase in severity of NCS, there was increase in mean CSA1, CSA2, CSA3, CSA2–1, and CSA2–3 values ( Fig. 8 ).
Fig. 8.
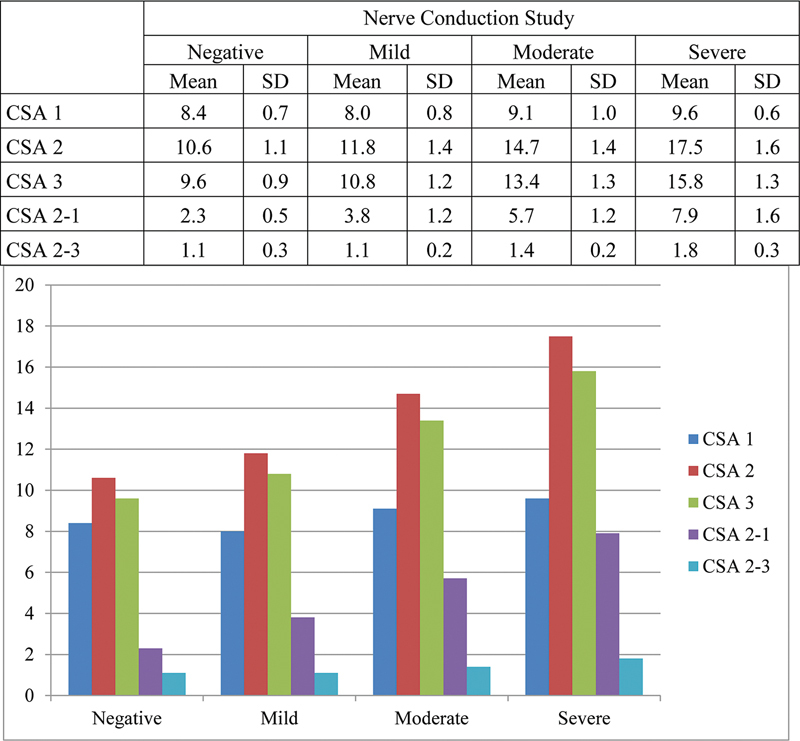
Mean cross-sectional area (CSA) values with respect to nerve conduction study (NCS) grading. SD, standard deviation.
Validity of CSA1 to detect severity of NCS is represented by receiver operating characteristic (ROC) curve. With increase in severity, area under the curve (AUC) was found increasing. Hence, CSA1 can detect severe NCS cases at the cutoff value at 9.15. However, there is wider confidence interval for CSA1 with p -value of 0.234 ( Fig. 9 ).
Fig. 9.
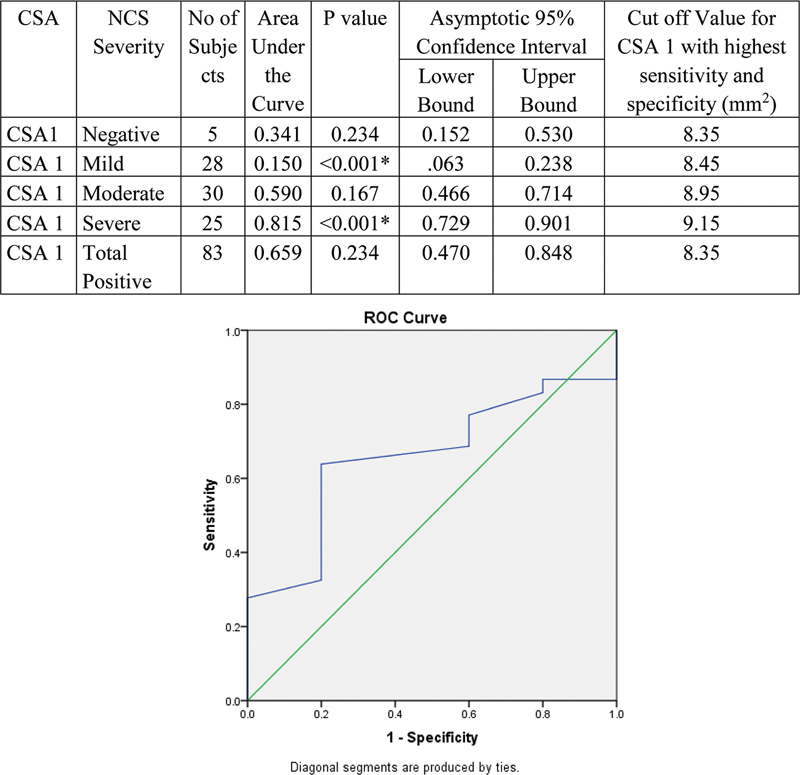
Validity of cross-sectional area (CSA1) in comparison with nerve conduction study (NCS) grade.
Validity of CSA2 to detect severity of NCS is represented by ROC curve. With increase in severity, AUC was found increasing. Hence, CSA2 can detect severe cases at the cutoff value at 15.75. Values > 15.75 will be severe and < 15.75 will be mild to moderate. Values < 12.1 will be negative ( Fig. 10 ).
Fig. 10.
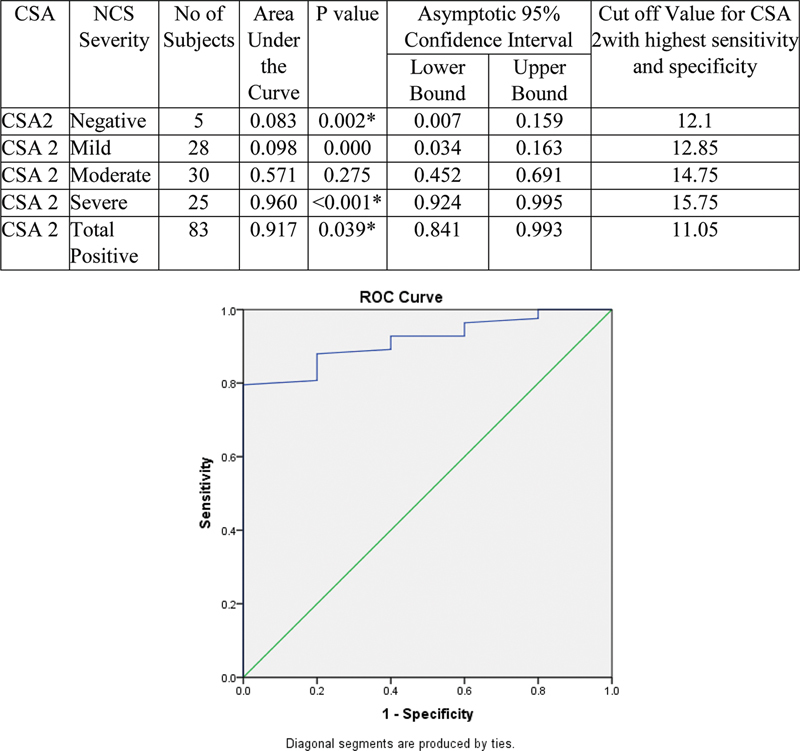
Validity of cross-sectional area (CSA2) in comparison with nerve conduction study (NCS) grade.
Validity of CSA3 to detect severity of NCS is represented by ROC curve. With increase in severity, AUC was found increasing. Hence, CSA3 can detect severe cases at the cutoff value at 14.15. Values > 14.15 will be severe and < 14.15 will be mild to moderate. Values < 10.65 will be negative ( Fig. 11 ).
Fig. 11.
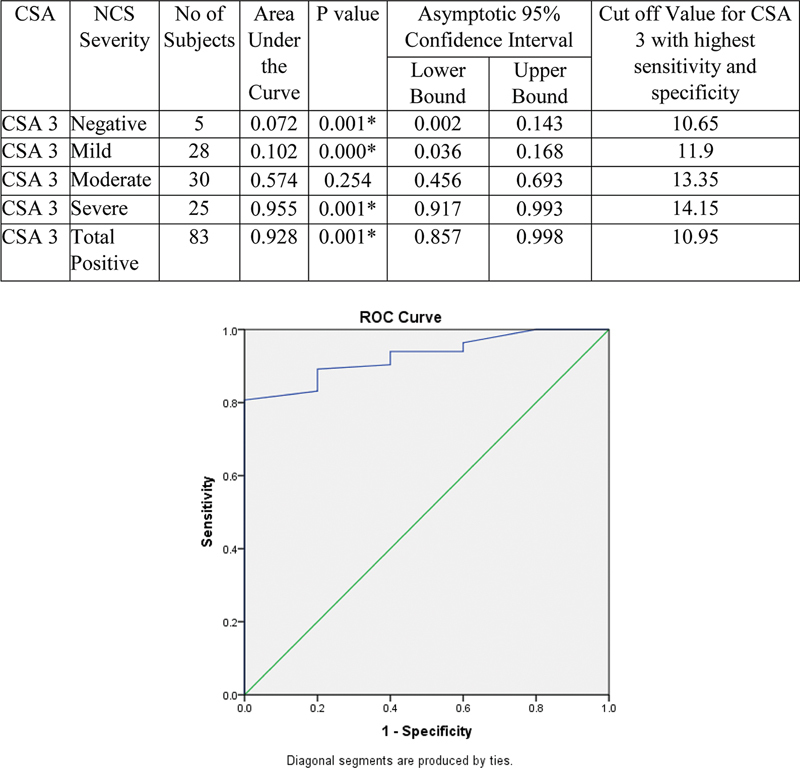
Validity of cross-sectional area (CSA3) in comparison with nerve conduction study (NCS) grade. ROC,
Validity of CSA2–1 to detect severity of NCS is represented by ROC curve. With increase in severity, AUC was found increasing. Hence, CSA2–1 can detect severe cases at the cutoff value at 6.25. Values > 6.25 will be severe and < 6.25 will be mild to moderate. Values < 2.75 will be negative. Area under ROC curve was highest for CSA2–1 (0.967); hence, it was superior to all other CSAs in the study ( Fig. 12 ).
Fig. 12.
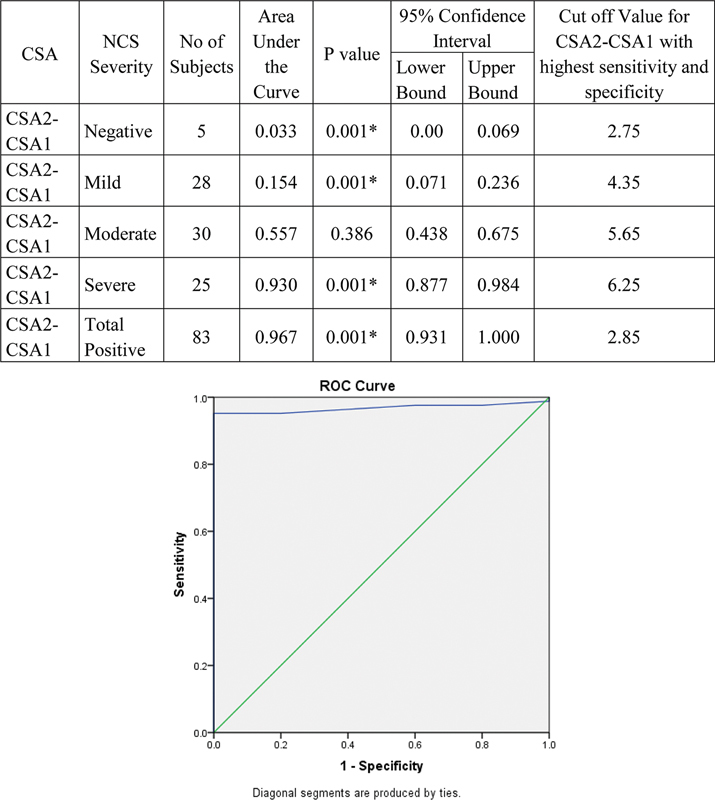
Validity of cross-sectional area (CSA2–1) in comparison with nerve conduction study (NCS) grade. ROC
Validity of CSA2–3 to detect severity of NCS is represented by ROC curve. With increase in severity, AUC was found increasing. Hence, CSA2–3 can detect severe cases at the cutoff value at 1.45. Values > 1.45 will be severe and < 1.45 will be mild to moderate. Values < 1.25 will be negative ( Fig. 13 ).
Fig. 13.
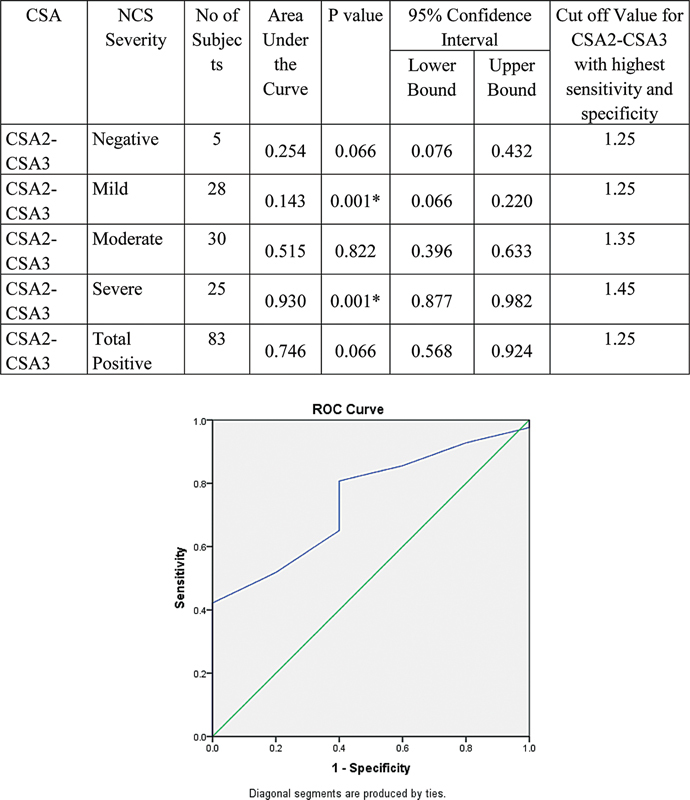
Validity of cross-sectional area (CSA2–3) in comparison with nerve conduction study (NCS) grade. ROC
Difference in mean palmar bowing and FR was observed with increasing severity of NCS. With increase in severity of NCS value of palmar bowing and FR decreased significantly till moderate grade, whereas increase was observed at severe grade ( Fig. 14 ).
Fig. 14.
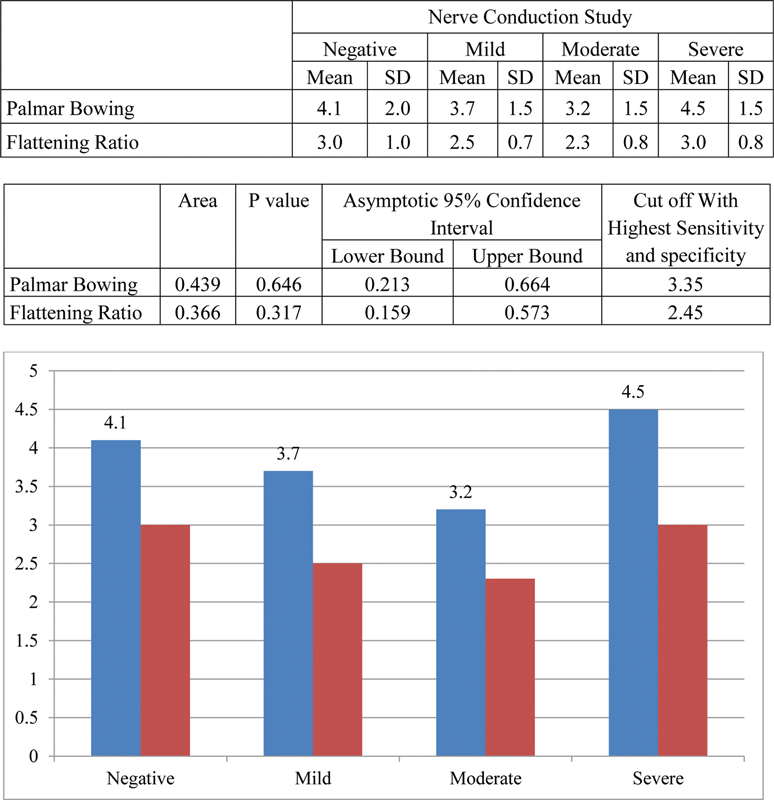
Comparison of palmar bowing and flattening ratio with different grades of nerve conduction study (NCS).
Significant association was observed between NCS and CSA2, CSA3, and CSA2–1. There was no significant association between NCS and CSA1, CSA2–CSA ( Table 1 ). Overall, CSA2–1 had highest diagnostic accuracy, followed by CSA2 and 3 ( Fig. 15 ).
Table 1. Association between NCS, CSA, palmar bowing and flattening ratio using the cutoff values from ROC curves.
| NCS | p -Value | |||||
|---|---|---|---|---|---|---|
| Positive | Negative | |||||
| Count | % | Count | % | |||
| CSA1 | Positive | 55 | 66.3 | 2 | 40.0 | 0.232 |
| Negative | 28 | 33.7 | 3 | 60.0 | ||
| CSA2 | Positive | 73 | 88.0 | 1 | 20.0 | < 0.001* |
| Negative | 10 | 12.0 | 4 | 80.0 | ||
| CSA3 | Positive | 67 | 80.7 | 0 | 0.0 | < 0.001* |
| Negative | 16 | 19.3 | 5 | 100.0 | ||
| CSA2–1 | Positive | 79 | 95.2 | 0 | 0.0 | < 0.001* |
| Negative | 4 | 4.8 | 5 | 100.0 | ||
| CSA2–3 | Positive | 54 | 65.1 | 2 | 40.0 | 0.258 |
| Negative | 29 | 34.9 | 3 | 60.0 | ||
| Power Doppler | Positive | 34 | 41.0 | 0 | 0.0 | 0.068 |
| Negative | 49 | 59.0 | 5 | 100.0 | ||
| Palmar bowing | Positive | 52 | 62.7 | 4 | 80.0 | 0.434 |
| Negative | 31 | 37.3 | 1 | 20.0 | ||
| Flattening ratio | Positive | 41 | 49.4 | 3 | 60.0 | 0.645 |
| Negative | 42 | 50.6 | 2 | 40.0 | ||
Abbreviations: CSA1, cross-sectional area 1; NCS, nerve conduction study; ROC, receiver operating characteristic.
Note: p value <0.001 and signifies statistical significance of these values.
Fig. 15.
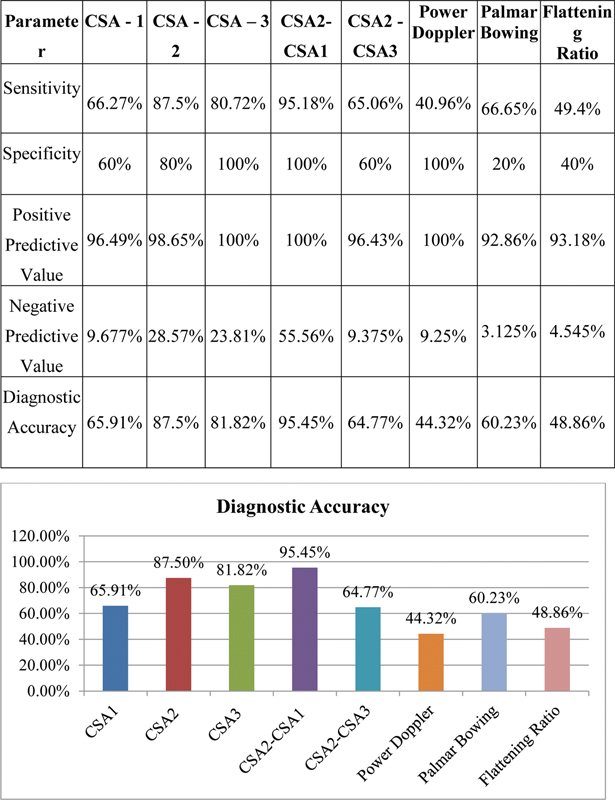
Comparison of sensitivity, specificity, positive predictive value, negative predictive value, and diagnostic accuracy of various parameters. CSA1, cross-sectional area 1.
Discussion
This study describes the findings of ultrasound in 88 wrists of 57 patients with symptoms for CTS. The findings were correlated with the results of NCS. Of the 88 studied wrists, NCS was reported as negative in 5 (5.7%), mild in 28(31.8%), moderate in 30 (34.1%), and severe in 25 (28.4%). The age of patients varied between 23 and 71 years (average age of 49.3 years) and CTS was more commonly observed among 40 and 60 years of age. Women (43, 75.4%) were more commonly affected than men
In our study based on the ROC curve, cutoff value of CSA1 with sensitivity and specificity of 66.27 and 60% was 8.35 mm 2 with diagnostic accuracy of 65.9%. Though most of the severe cases (mean of 9.6 ± 0.6 mm 2 ) can be diagnosed with a cutoff of 8.35 mm 2 , it was less diagnostic in mild and moderately affected cases. Thus, CSA1 measurement cannot be used as independent criteria for diagnosing CTS. However, it can be used as an additional contributory criterion for calculating area difference of the median nerve.
The cutoff value of CSA2 with sensitivity and specificity (87.5% and 80%) based on the ROC curve was 11.05 mm 2 , which had diagnostic accuracy of 87.5%. With increase in severity, CSA2 was found increasing and hence it can used to grade the severity of CTS. Value of > 15.75 mm 2 will be severe and <15.75 mm 2 will be mild to moderate cases. The mild and moderate cases (mean of 11.8 ± 1.4 mm 2 and 14.7 ± 1.4 mm 2 ) can also be adequately graded in most cases with cutoff of 12.85 and 14.75 mm 2 , respectively. Values < 12.1 mm 2 will be negative. Thus, CSA2 is an independent predictor and can be used as criteria for diagnosing and grading the severity of CTS.
The cutoff value of CSA3, 10.95 mm 2 , had sensitivity and specificity of 80.72 and 100% with diagnostic accuracy of 81.82%. With increase in severity, CSA3 was found increasing and it can also be used to grade the severity of CTS. Values >14.15 mm 2 will be severe and <14.15 mm 2 will be mild to moderate. The mild and moderate cases (mean of 10.8 ± 1.2 and 13.4 ± 1.3 mm 2 ) can also be adequately graded in most cases with cutoff of 11.9 and 13.35 mm 2 , respectively. Values < 10.65 mm 2 will be negative. Thus, CSA3 is an independent predictor for diagnosing and grading CTS.
The cutoff value of 2.85 mm 2 for CSA2–1 based on the ROC curve had highest sensitivity and specificity of 95.18 and 100% among all the parameters with a diagnostic accuracy of 95.45%. With increase in severity, CSA2–1 was found increasing and can detect severe cases at the cutoff value at 6.25 mm 2 (mean of 7.9 ± 1.6 mm 2 ), moderate cases at 5.65 mm 2 (mean of 5.7 ± 1.2 mm 2 ), and mild cases at 4.35 mm 2 (mean of 3.8 ± 1.2 mm 2 ). Values <2.75 mm 2 will be negative. The symptomatic cases with negative NCS (mean 2.3 ± 0.5 mm 2 ) can also excluded based on CSA2–1 cutoff of 2.85 mm 2 . Thus, CSA2–1 is the single best predictor and can be used as the best independent criteria for diagnosing and grading the severity of CTS.
The cutoff of inlet–outlet ratio (CSA2–3) based on the ROC curve was 1.25 mm 2 that had sensitivity and specificity of 65.06 and 60% and diagnostic accuracy of 64.77%. Though most of the severe and moderate cases with a cutoff of 1.45 mm 2 (mean 1.8 ± 0.3) and 1.35 mm 2 (mean 1.4 ± 0.2) can be diagnosed with the value of 1.25 mm 2 , it is less diagnostic in mild cases (mean of 1.1 ± 0.2 mm 2 ). Hence, inlet–outlet ratio cannot be used as an independent sonographic criterion.
The mean cutoff value of palmar bowing was 3.35 mm, with sensitivity and specificity of 66.65 and 20% and diagnostic accuracy of 60.23%. Thus, it cannot be used as an independent criterion and not important for diagnosing CTS.
The mean cutoff value for FR was 2.45 mm with sensitivity and specificity of 49.4 and 40% and diagnostic accuracy of 48.86%, which is statistically insignificant be used as an independent criterion for CTS.
Hence, in diagnosing and grading CTS, three gray scale parameters (CSA2–1, CSA2, and CSA3) were found to be statistically significant in our study. Other parameters cannot be used alone to accurately diagnose CTS ( Table 2 ).
Table 2. The cutoff values for diagnosing and grading the severity of carpal tunnel syndrome derived from our study:
| Ultrasound parameter | CSA2–1 | CSA2 | CSA3 |
|---|---|---|---|
| Cutoff value with highest sensitivity and specificity for diagnosing CTS | 2.85 mm 2 (95.18 and 100%) | 11.05 mm 2 (87.5 and 80%) | 10.95 mm 2 (80.72 and 100%) |
| Diagnostic accuracy | 95.45% | 87.5% | 81.82% |
| Cutoff for severe cases | 6.25 mm 2 | 15.75 mm 2 | 14.15 mm 2 |
| Cutoff for moderate cases | 5.65 mm 2 | 14.75 mm 2 | 13.35 mm 2 |
| Cutoff for mild cases | 4.35 mm 2 | 12.85 mm 2 | 11.9 mm 2 |
| Cutoff for negative cases | 2.75 mm 2 | 12.1 mm 2 | 10.65 mm 2 |
Abbreviations: CSA1, cross-sectional area 1; CTS, carpal tunnel syndrome.
Conclusion
Ultrasonography can be an effective, reliable, and cost-effective alternative to NCS in the diagnosing and grading CTS.
Ultrasound may be used as a primary modality in patients presenting with clinical suspicion of CTS, while NCS can be used in cases with equivocal results on ultrasound.
There was a good correlation between the ultrasound findings and NCS.
Among the ultrasound parameters evaluated, CSA difference between tunnel inlet and just proximal to tunnel (CSA2–1) had the highest diagnostic accuracy (95.45%).
The CSA2–1 cutoff value of 2.85 mm 2 was the single best independent predictor for carpal tunnel in our study.
The CSA2 and 3 with diagnostic accuracy of 87.5 and 81.82% can also be used as independent parameters for diagnosing CTS at cutoff value of 11.05 and 10.95 mm 2 , respectively.
CSA2–CSA1, CSA2, and CSA3 can also be used for grading carpal tunnel cases.
Other gray scale parameters CSA1, CSA2–3, palmar bowing of flexor retinaculum, and FR of median nerve had low diagnostic accuracy as independent parameters.
Power and spectral Doppler analysis may be of supplemental value to grade the severity of CTS; however, it cannot be used as independent criteria.
This is particularly relevant in our country with limited resources in electrodiagnostic tests, where a reliable sonography can be a valuable low-cost tool in evaluating patients with CTS.
Ultrasound is an operator-dependent modality; the findings of the ultrasound are subjective to interpretive error. Hence, we recommend strict methodology to accurately trace the median nerve to avoid errors in measurement of CSA.
Further studies in a primary care setup are required to validate the accuracy of our results especially in less symptomatic cases.
Ultrasound showing features of flexor tenosynoviits in a patient with positive neurophysiological study ( Fig. 16 ). Illustrative cases showing Ultrasound features of Carpal tunnel syndrome in patients with positive neirophysiological studies ( Figs. 17 18 19 ). Negative Usg features in a patinet with suspected CTS. Nerve conduction study was normal in this case ( Fig. 20 ). Usg showing bifid media Nerve with persistent median artery in a case with positive NCS ( Fig. 21 ).
Fig. 16.
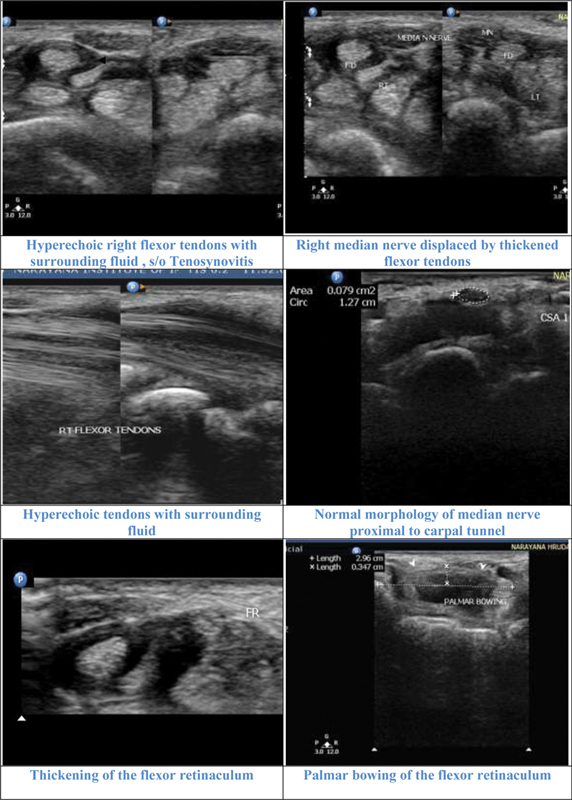
Illustrative cases: Case 1: A 46-year-old male with moderate carpal tunnel syndrome in nerve conduction study. Ultrasonography showed flexor tenosynovitis displacing the median nerve and thickening of the flexor retinaculum. Median nerve was normal proximal to the carpal tunnel. CSA 1, cross-sectional area 1; FD, flexor digitorum; MN, median nerve.
Fig. 17.
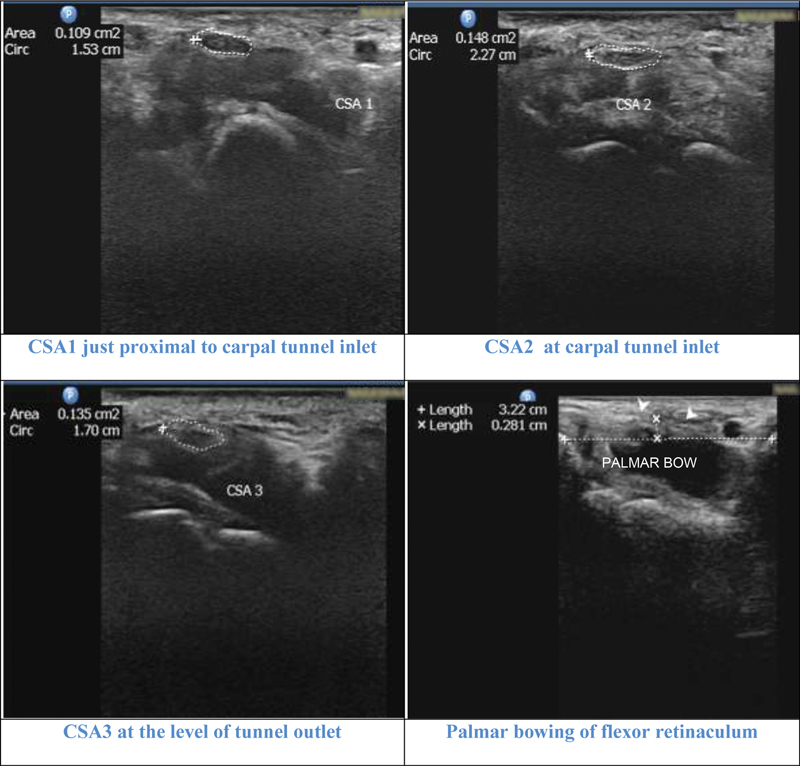
Illustrative cases: Case 2 : A 42-year-old female with moderate carpal tunnel syndrome (CTS) in nerve conduction study. All the parameters cross-sectional area 1 (CSA1), CSA2, CSA3, CSA2–1 (3.9 mm 2 ), and CSA2–3 (1.3 mm 2 ) showed moderate grade. Palmar bowing (2.8 mm) and flattening ratio (2.3) values were negative for diagnosing CTS.
Fig. 18.
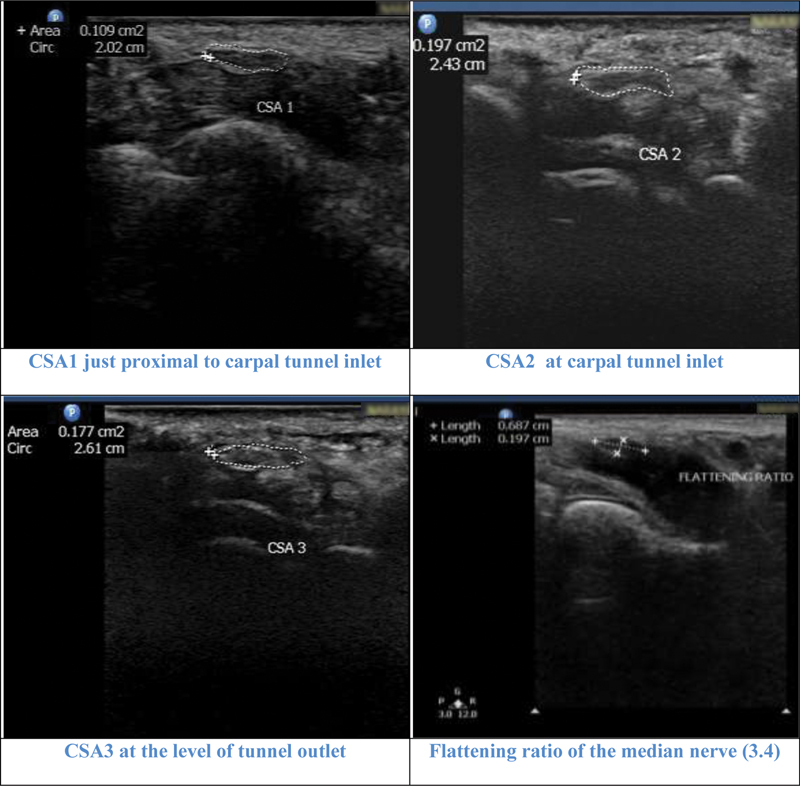
Illustrative cases: Case 3: A 62-year-old female with severe carpal tunnel syndrome in nerve conduction study. All the parameters cross-sectional area 1 (CSA1), CSA2, CSA3, CSA2–1 (8.8 mm 2) and CSA2–3 (2 mm 2 ) showed severe grade. Flattening ratio was 3.4.
Fig. 19.
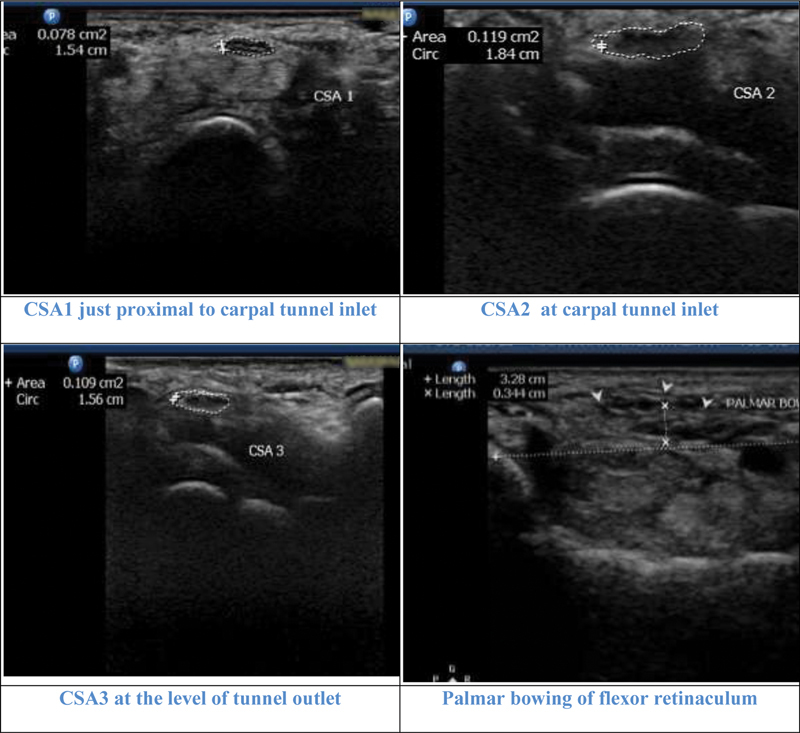
Illustrative cases: Case 4: A 71-year-old female with mild carpal tunnel syndrome CTS in nerve conduction study. CSA2, CSA3 and CSA2–1 (4.1 mm 2 ) showed mild CTS. CSA1 and CSA2–3 (1mm 2 ) were negative. Flattening ratio was 2.2 and palmar bowing 3.4 cm.
Fig. 20.
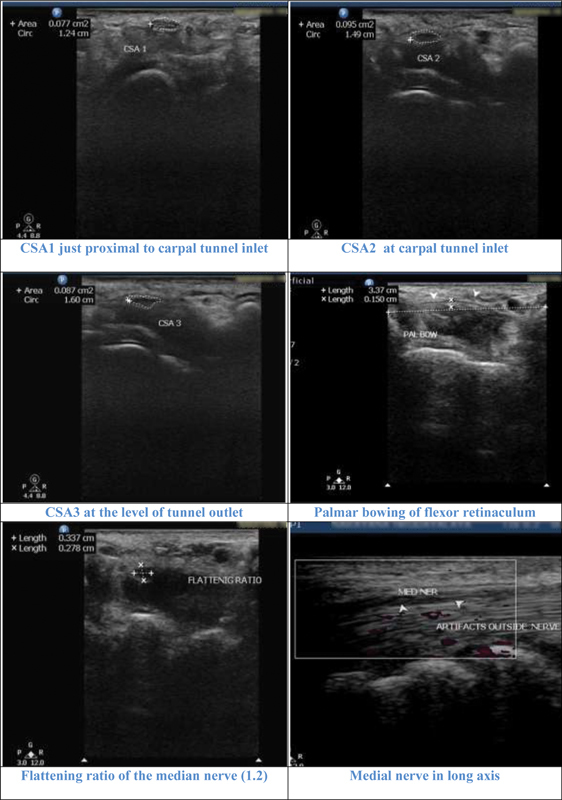
Illustrative cases: Case 5 : A 71-year-old female with negative carpal tunnel syndrome (CTS) in nerve conduction study. All parameters cross-sectional area 1 (CSA1), CSA2, CSA3, CSA2–1 (1.8 mm 2 ), and CSA2–3 (0.8mm 2 ) were negative for CTS. Flattening ratio was 1.2 and palmar bowing, 1.5 cm also were negative for CTS.
Fig. 21.
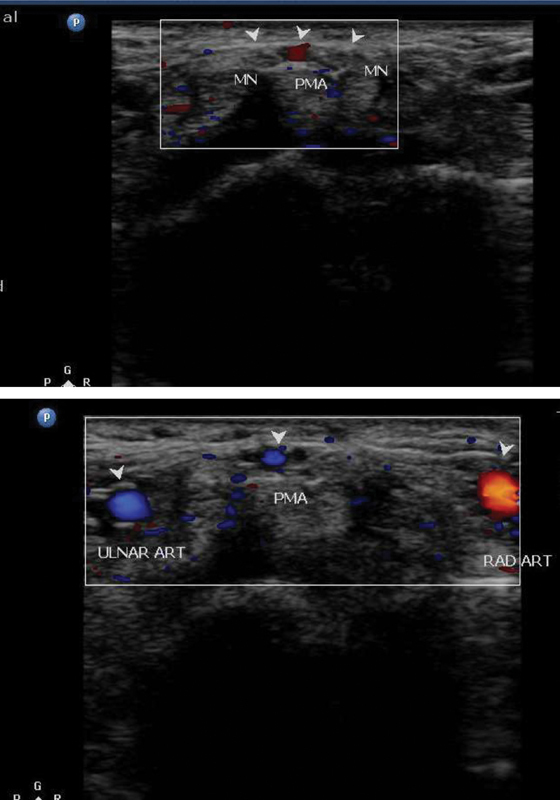
Illustrative cases: Case 6: A 46-year-old male with clinical symptoms of carpal tunnel syndrome. Ultrasonography showing bifid median nerve with persistent median artery. MN, median nerve.
Acknowledgment
Nil.
Conflict of Interest Nil.
Source(s) of Support in the Form of Grants, Equipment, Drugs, or All of These
Nil.
References
- 1.Dell P C, Guzewicz R M.Atypical peripheral neuropathies Hand Clin 1992802275–283.[Internet] [PubMed] [Google Scholar]
- 2.Phalen G S. The carpal-tunnel syndrome. Seventeen years' experience in diagnosis and treatment of six hundred fifty-four hands. J Bone Joint Surg Am. 1966;48(02):211–228. [PubMed] [Google Scholar]
- 3.Mallouhi A, Pülzl P, Trieb T, Piza H, Bodner G. Predictors of carpal tunnel syndrome: accuracy of gray-scale and color Doppler sonography. AJR Am J Roentgenol. 2006;186(05):1240–1245. doi: 10.2214/AJR.04.1715. [DOI] [PubMed] [Google Scholar]
- 4.Atroshi I, Gummesson C, Johnsson R, Ornstein E. Diagnostic properties of nerve conduction tests in population-based carpal tunnel syndrome. BMC Musculoskelet Disord. 2003;4:9. doi: 10.1186/1471-2474-4-9. [DOI] [PMC free article] [PubMed] [Google Scholar]
- 5.Witt J C, Hentz J G, Stevens J C. Carpal tunnel syndrome with normal nerve conduction studies. Muscle Nerve. 2004;29(04):515–522. doi: 10.1002/mus.20019. [DOI] [PubMed] [Google Scholar]
- 6.Martinoli C, Bianchi S, Gandolfo N, Valle M, Simonetti S, Derchi L E.US of nerve entrapments in osteofibrous tunnels of the upper and lower limbsRadiographics 2000;20(Spec No):S199–S213, discussion S213–S217 [DOI] [PubMed]
- 7.Brown J M, Yablon C M, Morag Y, Brandon C J, Jacobson J A. Radiological Society of North America; 2016. US of the Peripheral Nerves of the Upper Extremity: A Landmark Approach. [DOI] [PubMed] [Google Scholar]
- 8.Martinoli C, Bianchi S, Cohen M, Graif M.[Ultrasound of peripheral nerves] J Radiol 200586(12 Pt 2):1869–1878. [DOI] [PubMed] [Google Scholar]
- 9.Silvestri E, Martinoli C, Derchi L E, Bertolotto M, Chiaramondia M, Rosenberg I. Echotexture of peripheral nerves: correlation between US and histologic findings and criteria to differentiate tendons. Radiology. 1995;197(01):291–296. doi: 10.1148/radiology.197.1.7568840. [DOI] [PubMed] [Google Scholar]
- 10.Michelsen H, Posner M A. Medical history of carpal tunnel syndrome. Hand Clin. 2002;18(02):257–268. doi: 10.1016/s0749-0712(01)00006-3. [DOI] [PubMed] [Google Scholar]
- 11.Bongers F JM, Schellevis F G, van den Bosch W JHM, van der Zee J. Carpal tunnel syndrome in general practice (1987 and 2001): incidence and the role of occupational and non-occupational factors. Br J Gen Pract. 2007;57(534):36–39. [PMC free article] [PubMed] [Google Scholar]
- 12.Murthy J, Meena A K. Carpal tunnel syndrome: how common is the problem in South India. Neurol India. 1995;43(01):26–28. [PubMed] [Google Scholar]
- 13.Chammas M, Boretto J, Burmann L M, Ramos R M, Dos Santos Neto F C, Silva J B. Carpal tunnel syndrome - part I (anatomy, physiology, etiology and diagnosis) Rev Bras Ortop. 2014;49(05):429–436. doi: 10.1016/j.rboe.2014.08.001. [DOI] [PMC free article] [PubMed] [Google Scholar]
- 14.Lozano-Calderón S, Anthony S, Ring D. The quality and strength of evidence for etiology: example of carpal tunnel syndrome. J Hand Surg Am. 2008;33(04):525–538. doi: 10.1016/j.jhsa.2008.01.004. [DOI] [PubMed] [Google Scholar]
- 15.Assmus H, Schwerdtfeger K, Wüstner-Hofmann M, Selbmann H K. Zur Entstehung und Implementierung der Leitlinie “Diagnostik und Therapie des Karpaltunnelsyndroms”. Handchir Mikrochir Plast Chir. 2007;39(04):289–292. doi: 10.1055/s-2007-965314. [DOI] [PubMed] [Google Scholar]
- 16.Amirfeyz R, Gozzard C, Leslie I J. Hand elevation test for assessment of carpal tunnel syndrome. J Hand Surg [Br] 2005;30(04):361–364. doi: 10.1016/j.jhsb.2005.04.007. [DOI] [PubMed] [Google Scholar]
- 17.MacDermid J C, Wessel J. Clinical diagnosis of carpal tunnel syndrome: a systematic review. J Hand Ther. 2004;17(02):309–319. doi: 10.1197/j.jht.2004.02.015. [DOI] [PubMed] [Google Scholar]
- 18.Boyer K, Wies J, Turkelson C M. Effects of bias on the results of diagnostic studies of carpal tunnel syndrome. J Hand Surg Am. 2009;34(06):1006–1013. doi: 10.1016/j.jhsa.2009.02.018. [DOI] [PubMed] [Google Scholar]
- 19.Simpson J A. Electrical signs in the diagnosis of carpal tunnel and related syndromes. J Neurol Neurosurg Psychiatry. 1956;19(04):275–280. doi: 10.1136/jnnp.19.4.275. [DOI] [PMC free article] [PubMed] [Google Scholar]
- 20.Watson J C. The electrodiagnostic approach to carpal tunnel syndrome. Neurol Clin. 2012;30(02):457–478. doi: 10.1016/j.ncl.2011.12.001. [DOI] [PubMed] [Google Scholar]
- 21.American Association of Electrodiagnostic Medicine, American Academy of Neurology, and American Academy of Physical Medicine and Rehabilitation Practice parameter for electrodiagnostic studies in carpal tunnel syndrome: summary statement Muscle Nerve 20022506918–922.[Internet] [DOI] [PubMed] [Google Scholar]
- 22.Fowler J R, Maltenfort M G, Ilyas A M. Ultrasound as a first-line test in the diagnosis of carpal tunnel syndrome: a cost-effectiveness analysis. Clin Orthop Relat Res. 2013;471(03):932–937. doi: 10.1007/s11999-012-2662-3. [DOI] [PMC free article] [PubMed] [Google Scholar]
- 23.Mesgarzadeh M, Schneck C D, Bonakdarpour A. Carpal tunnel: MR imaging. Part I. Normal anatomy. Radiology. 1989;171(03):743–748. doi: 10.1148/radiology.171.3.2717746. [DOI] [PubMed] [Google Scholar]
- 24.Stuart R M, Koh E SC, Breidahl W H.Sonography of peripheral nerve pathology AJR Am J Roentgenol 200418201123–129.cited 2016Jun22 [Internet] [DOI] [PubMed] [Google Scholar]


